Article

Multi-Criteria Decision Analysis for Optimizing CO2 and NH3 Removal by Scenedesmus dimorphus Photobioreactors

1
Biosystems Engineering, Faculty of Agriculture, Bursa Uludag University, 16240 Bursa, Turkey
2
Department of Tourism and Hotel Management, Vocational School of Social Sciences, Aksaray University, 68200 Aksaray, Turkey
3
Department of Agricultural and Biosystems Engineering, South Dakota State University, Brookings, SD 57007, USA
*
Author to whom correspondence should be addressed.
Atmosphere 2023, 14(7), 1079; https://doi.org/10.3390/atmos14071079
Submission received: 31 May 2023 / Revised: 17 June 2023 / Accepted: 23 June 2023 / Published: 27 June 2023
(This article belongs to the Special Issue Emissions and Control Technologies of Odorous Gas)

Abstract

:
Numerous technologies have been investigated for mitigating air pollutant emissions from swine barns. Among them, algal photobioreactors (PBRs) can remove and utilize air pollutants such as CO2 and NH3 from barn exhaust. However, a challenge to PBR operation is that it involves multiple system input parameters and output goals. A key question is then how to determine the appropriate CO2 and NH3 concentrations in this case. Conventional statistical methods are inadequate for handling this complex problem. Multi-criteria decision-making (MCDM) emerges as a practical methodology for comparison and can be utilized to rank different CO2–NH3 interactions based on their environmental and biological performance. By employing MCDM methods, producers can effectively control the ratio of CO2 and NH3 concentrations, enabling them to identify the optimal range of operating parameters for various housing types, ensuring efficient pollutant mitigation. In this study, a multi-criteria decision-making (MCDM) approach was employed to support operation management. Specifically, influent CO2 and NH3 concentrations were optimized for three scenarios (the best biological, environmental, and overall performance), using a combination of two MCDM techniques. This study is anticipated to facilitate the system analysis and optimization of algae-based phytoremediation processes.

Graphical Abstract

1. Introduction

Concentrated animal production results in significant air pollutant emissions that contribute to environmental pollution and global warming issues. Various air pollutants, such as NH3, H2S, CH4, and CO2, can originate from animal housing, manure storage, and land application [1]. There is a need to mitigate these pollutants while sustaining animal protein supplies. This mitigation will not only protect the environment but also improve indoor air quality critical for animal health and welfare, as well as the safety and health of farm workers [2,3].
Various mitigation technologies/practices have been researched, including air scrubbers, biofilters, tree barriers, diet manipulation, and improved manure management [4,5,6]. Among them, CO2 and NH3 fixation by microalgal photosynthesis has recently attracted significant attention due to its eco-friendliness and potential economic benefits. Microalgae have substantially higher cell growth and CO2 fixation rates (about 10–50 times) than terrestrial plants [7]. They can be further valorised into biofuels, animal feed, nutrition additives, cosmetics, and pharmaceuticals [8].
Numerous factors play a crucial role in effectively reducing air pollutants released from animal barns using photobioreactor (PBR) systems. The concentrations of air pollutants vary depending on the livestock breed, animal age, and barn type. Similarly, the growth of microalgae in PBR systems differs in terms of their air pollutant reduction efficiency, biomass yield, and cell growth, which are influenced by the emitted CO2 and NH3 gas concentrations from the barn. Therefore, to achieve optimal CO2 and NH3 gas reduction efficiencies, it is essential to determine the gas concentrations at which microalgae exhibit the best cell growth and biomass yield. The existing literature indicates that while the highest cell growth, measured by cell counts, can occur at any CO2 gas concentration, the maximum biomass yield may be obtained at a different gas concentration [9]. A microalga that demonstrates the highest cell growth at a specific CO2 gas concentration might exhibit lower cell growth at another CO2 concentration due to the presence of NH3 gas in the PBR system, where CO2 and NH3 gases coexist [10]. In other words, although cell growth reaches its peak at a given CO2 gas concentration, the maximum biomass yield may not be achieved at the same CO2 gas concentration. Therefore, for the most effective mitigation of air pollutants released from animal barns using PBR systems, it is crucial to collectively evaluate and analyze the biological and environmental parameters that influence microalgae growth. By doing so, maximum efficiency can be obtained from all parameters influencing algal growth, and identifying the air pollutant concentrations at which the highest gas reduction efficiency can be achieved will enhance the system’s effectiveness and economic viability.
Challenges exist to effective CO2 and NH3 gas mitigation with microalgae due to the complexity of the relevant processes. For example, CO2 and NH3 fixation efficiencies can be affected by many operating parameters, such as gas loading rates, gas concentrations, pH, light intensity, and temperature. Numerous studies have been conducted to examine the effects of these parameters [8,11,12,13]. In nearly all these studies, different parameters were examined separately. However, interactions between the parameters should not be neglected. For example, Kang and Wen [14] reported that the solubility and uptake of CO2 by algae were affected by the presence of NH3 in PBRs. Moreover, algal PBRs for air pollutant mitigation (and other phytoremediation purposes) often involve multiple system input parameters (e.g., CO2 concentrations, pH, and temperature) and multiple output goals (e.g., biomass yield and NH3 removal efficiency), making it challenging to make management decisions concerning algal PBR operation. Previous studies have highlighted the challenge of CO2 concentration when utilizing microalgae for pollutant capture. Traditional statistical methods may not be adequate for addressing the complexities associated with determining suitable CO2 and NH3 concentrations for algal growth. Therefore, prioritizing the options for mitigating pollutants through CO2 and NH3 concentration requires a multi-criteria approach. One practical methodology for comparison in this regard is multi-criteria decision-making (MCDM). In this paper, a multi-criteria assessment model is proposed which combines grey relational analysis (GRA) and criterion impact loss (CI-LOS) techniques. This model allows for the ranking of different CO2–NH3 interactions based on their environmental and biological performance. By applying the CI-LOS method, objective determination of weights can be achieved for parameters such as cell number, biomass yield, and others that monitor microalgae growth, as well as parameters indicating gas reduction efficiency. Subsequently, using the GRA method and considering these weights, the optimal CO2 and NH3 gas concentrations can be determined.
Advancements in decision-making sciences have made MCDM methods increasingly accessible and accepted recently. MCDM refers to decision-making in the presence of multiple criteria that are inconsistent or even contradictory [15]. It is particularly useful for systems with multiple criteria and alternatives. The development of MCDM methods is motivated by not only various real-life problems requiring the consideration of multiple criteria but also by advances in mathematical optimization, scientific computing, and computer technology [16]. A fundamental task of MCDM is to evaluate a set of alternatives with a set of criteria. This involves the determination of the criteria that can be organised according to the expectation of a decision to be made for possibly solving a problem and other alternatives [17].
MCDM has been used in solving various problems in social sciences such as supplier selection [18,19,20], financial performance [21,22], and cyber security [23,24], as well as in engineering and science problems such as geographic information systems [25,26], construction equipment evaluation [27,28], and machine tool selection [29,30]. This method has been applied successfully in environmental research areas, from optimising waste management systems [31] to selecting gas mitigation methods [32,33]. Only a few reports are available concerning its applications for algal research, with the majority focusing on harvesting technologies [34,35]. Others include the identification of the best microalgae strain for biodiesel production [36], the best areas for microalgal cultivation [37], and the best algal wastewater treatment systems [38]. To our knowledge, no application of MCDM for algal PBR operation has been reported.
This study presents the first such attempt to identify optimal NH3 and CO2 concentrations for algal PBR operation. The primary aim of using the multi-criteria analysis is to find the relative importance of the factors and the criteria that affect cultivation of 
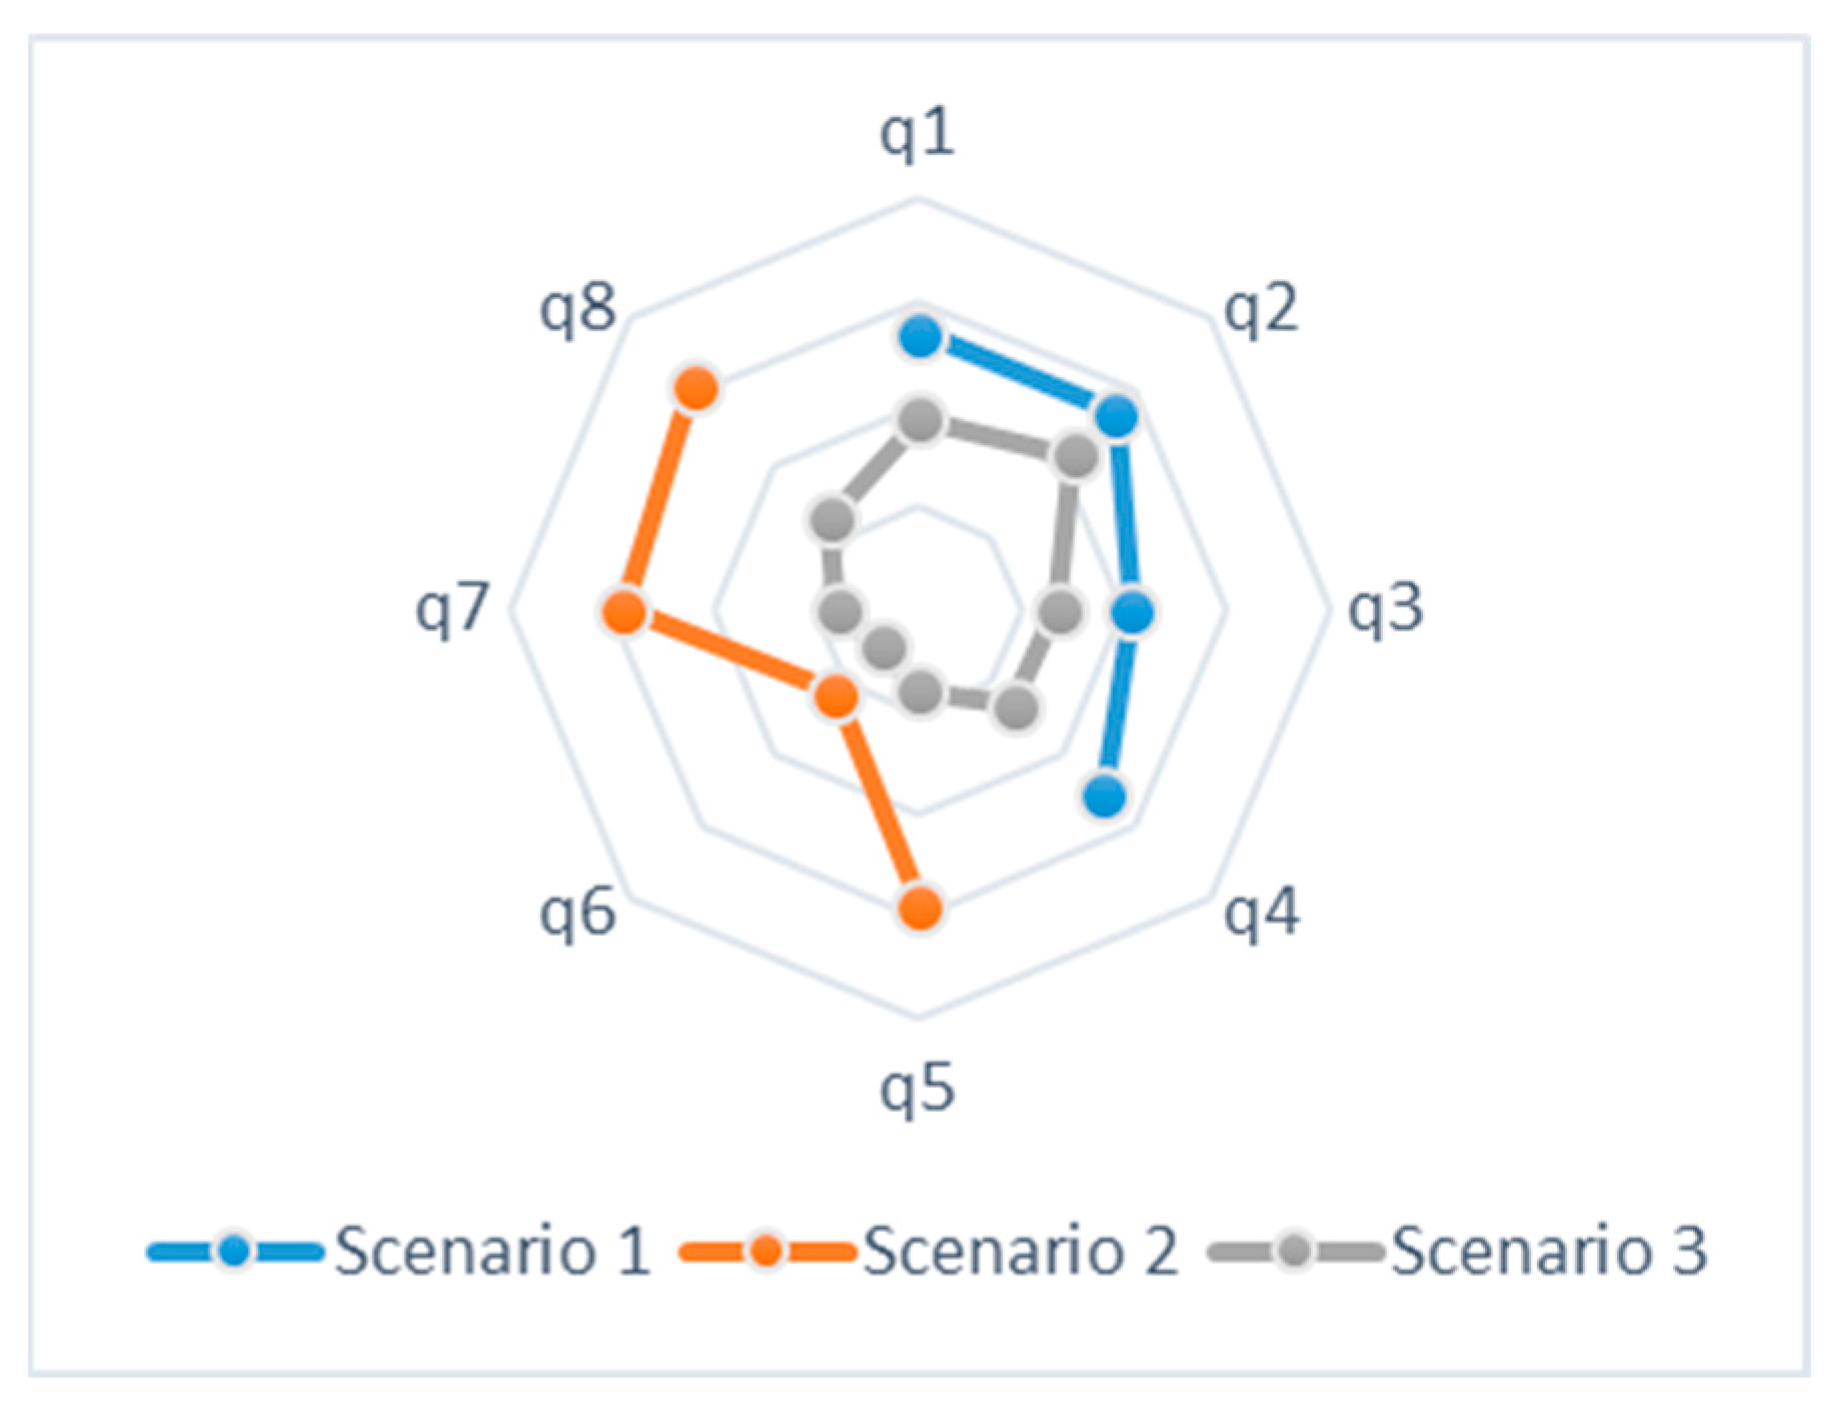
S. dimorphus with gas concentrations typical of pig house exhaust air. As a restriction, the specified concentrations must be within the typical concentration range of swine barn exhaust. The optimization was conducted to maximize the (1) biological, (2) environmental, and (3) overall performance of algal PBR systems. For each of the system output goals (scenarios), multiple performance indicators were considered. Specifically, the biological performance (i.e., algal growth) was measured by algal cell concentration, dry algal biomass, maximum specific growth rate, and cell weight; the environmental performance (i.e., pollutant mitigation) was measured by CO2 fixation rate, NH3 fixation efficiency, CO2 removal efficiency, and NH3 removal efficiency; and the overall performance was measured by all the indicators stated above. Sixteen experimental data sets were analyzed with two MCDM methods (criterion impact loss (CILOS) and grey relational analysis (GRA)) following the multi-step procedure outlined in Figure 1. Such optimization cannot be performed with regular statistical tools.

2. Materials and Methods

2.1. Experimental Prodecure

Scenedesmus dimorphus (S. dimorphus) strain UTEX 1237 was cultivated in 1 L Erlenmeyer flasks containing 100 mL of Bold’s basal medium with the composition of Uguz et al. [24]. This strain was used because of its efficient CO2 and NH3 removal [24]. The prepared BBM was sterilised and placed in the autoclave for 20 min at 121 °C. The cultures were doubled weekly and then transferred to 5 L PBRs when they reached the 5 L working volume for testing. The PBRs were built from acrylic plastic sheets sized 35 cm (height) × 50 cm (length) × 10 cm (width). Figure 2 shows the PBR experiment in operation.
Following the cultivation, 16 experiments were conducted in the laboratory under controlled conditions. In brief, algal PBRs were filled with a 5 L cultivation medium, fed with CO2-laden air at an airflow rate of 5 L min−1, and illuminated at a 60–65 µmol s−1 m−2 light density. CO2 concentration in the influent air (Table 1) was regulated using rotameters (Cole Parmer, Vernon, IL, USA) with needle valves. For NH3, due to its strong adsorption along tubings and adaptors, no rotameter-dilution method was used. Instead, ammonium chloride (NH4Cl) was added daily to the cultivation medium as an alternative NH3 source. It was calculated that the NH4Cl daily doses of 0, 19, 39, and 78 mg L−1d−1 would be equivalent to the aerial NH3 concentrations of 0, 12, 25, and 50 ppm, respectively, in the influent air. Other parameters, such as pH, temperature, and lighting, were constant throughout the cultivation experiments. The experiments were performed in triplicate, with control PBRs (fed with no NH3 or CO2) available for comparison. CO2 and NH3 gas concentrations were monitored using an INNOVA 1314i photoacoustic multi-gas monitor 1314i (LumaSense Technologies A/S, Ballerup, Denmark).

2.2. Analytical Methods

A detailed description can be found in Uguz et al. [39]. In brief, algal samples harvested from the sixteen experiments were analyzed for cell concentration (cells L−1), dry algal biomass concentration (mg L−1), cell weight (mg cell−1), specific growth rate (d−1), CO2 fixation efficiency (mg L−1 d−1), NH3 fixation efficiency (mg L−1 d−1), CO2 removal efficiency (%), and NH3 removal efficiency (mg L−1 d−1). The cell concentration was measured using haemocytometers under an Olympus optical microscope. The dry algal biomass concentration was gravimetrically determined by vacuum-filtering a known volume of an algal sample and weighing the filter after being dried in a laboratory oven at 80 °C for 3 h [40,41]. The cell weight was calculated by dividing a dry algal biomass concentration by its corresponding cell concentration. The specific growth efficiency was calculated by normalizing a cell concentration increase with the initial cell concentration. The NH3 and CO2 fixation efficiencies of the algae were calculated by multiplying the growth rate of algal biomass by nitrogen and carbon contents (%wt) in S. dimorphus. The NH3 and CO2 removal efficiencies were calculated by dividing their fixation efficiencies (mg L−1 d−1) by their loading rates (mg L−1 d−1) to the PBRs.

2.3. Multi-Criteria Analyses

In the study, sixteen experiments with different combinations of CO2 and NH3 gas concentrations were conducted. At the end of each experiment, cell number, dry weight, cell weight, growth rate, CO2 and NH3 fixation and removal rates were calculated to monitor algal growth and CO2 and NH3 mitigation efficiencies. These parameters were chosen as criteria for the MCDM analysis of the experiments. Then, the weights of each criterion were determined using the CILOS method. Figure 1 shows the weight of each selected criterion in CILOS method. The derived weight numbers then served as input to GRA. As aforementioned, the analyses compared three scenarios/output goals, with each scenario involving multiple performance indicators (Table 1). The indicator data derived from algal cultivation experiments (sixteen batches) are summarized in Table 2.

2.3.1. Criteria Impact Loss (CILOS)

The CILOS method, the theoretical background created by Mirkin (1974) and the detailed algorithm presented by Zavadskas and Podvezko [42] are among the most promising approaches to determining the objective weight. The CILOS method considers each criterion’s loss of importance (impact) when one of the other criteria achieves the optimal maximum or minimum value. The stages and calculation algorithm of the CILOS method are briefly described below [42,43,44,45,46]:
Step 1. Creating a decision matrix
The CILOS method starts with a decision matrix. The decision matrix of m × n size, which includes m criteria and n alternatives, is named Z and shown in Equation (1). Here, r 12 denotes the 2nd criterion value of the 1st alternative, while r 21 denotes the 1st criterion score of the 2nd alternative.
Z = r 11 r 12 r 1 m r 21 r 22 r 2 m r n 1 r n 2 r n m
Step 2. Converting cost criteria into benefits
Since the CILOS method only provides solutions for maximization-oriented criteria, Equation (2) is used to transform the minimization-oriented criteria into maximization-oriented (best). There is no minimization-oriented criterion for algal growth in this paper.
r - i j = m i n i r i j r i j
where r i j is the cost-oriented criterion showing the i alternative value of the j criterion. On the other hand, r - i j is the cost-oriented criterion transformed into a benefit-oriented criterion.
Step 3. Normalization
Equation (3) is applied to each criterion value for normalization. After normalization, a new matrix X is obtained.
x - i j = r i j i = 1 n r i j
where, x i * is the normalized criterion value
Step 4. Creating a square matrix (A)
After obtaining the normalized X matrix, a square matrix (A) is derived with Equations (4) and (5). The row containing the max i r i j element with the maximum value in each column is processed as in Equation (5) to form a square matrix. That is, the square matrix is obtained by taking the row with the maximum element in the ith column of the normalized decision matrix as the new matrix ith row.
a j = max i r i j = a k i j
a i j = a k i j   and   a j j = a j
where a k i j specifies the maximum values of jth criteria, which are taken from the decision matrix with ki rows to form a square matrix, a i j = a k i j and a j j = a j [47].
Step 5. Calculating a relative loss of impact matrix (P)
The values in the square matrix A are processed by Equation (6) to form the relative loss of effect matrix P = p i j .
p i j = a j j - a i j a j j , p i i = 0 ;   i , j = 1,2 , 3 , , m
In matrix P, p i j represents the loss of effect in the jth criterion when the ith criterion is selected as the best.
Step 6. Determining a weight system matrix (F)
The F matrix in Equation (7) is formed by finding the sum of each column of the P matrix and writing the negative values of these sums on the diagonals of the P matrix.
F = - i = 1 m p i 1 p 12 p 1 m p 21 - i = 1 m p i 2 p 2 m p m 1 p m 2 - i = 1 m p i m
Step 7. Calculation of weight of each criterion
The final criterion weights ( q = q 1 , q 2 , , q m ) are determined by solving Equation (8) (using Excel 2016 or Matlab 9.13).
F q T = 0
The weights q of the criteria are obtained by solving the equation F q T = 0 . Since this system of equations has infinite solutions, the weight vector is determined by normalizing the values so that i = 1 m q i = 1 .

2.3.2. Grey Relational Analysis (GRA)

Grey system theory, a control theory first proposed by Deng [48], has significantly impacted numerous fields of engineering and management. The theory enabled the development of grey relational analysis (GRA), a powerful tool that can effectively resolve complex relationships between multiple performance characteristics through the optimization of grey relational degrees [49].
As in almost all MCDM methods, GRA problem solving starts with a decision matrix consisting of the values of decision criteria. Since the decision matrix is created in the same way as CILOS (Equation (1)), no further explanation is given in this section. The problem solving procedure of GRA is summarized below [49,50,51,52,53]:
Step 1. Creating a comparison matrix
Equation (9) is used to calculate a reference series in the comparison matrix (for criteria comparison).
x o = x 0 1 , x 0 2 , , x 0 j   j = 1,2 , , n
where X 0 j represents the optimal value of the jth criterion within the normalized values. This series is obtained by taking the best value of each criterion in the decision matrix.
Step 2. Normalization and creating of normalized decision matrix
Decision problems, by their nature, consist of criteria with different units and objectives. Therefore, a normalization process is adopted while solving the decision problems. There are three possible situations for normalization in the GRA method.
i.
The Larger-The-Better Case: If the criterion used is of the highest appropriateness for the purpose, normalization is performed using Equation (10).
x i * = x i j - min j x i j max j x i j - min j x i j
ii.
The Smaller-The-Better Situation: If the criterion used is of the smallest appropriateness for the purpose, normalization is performed using Equation (11).
x i * = max j x i j - x i j max j x i j - min j x i j
where, x i * is the normalized criterion value, and x i j is the value of the jth criterion in the initial decision matrix.
iii.
The Closer-To-The-Desired-Value-The-Better Situation: If the criterion used is of the optimal appropriateness (the most suitable) for the purpose, normalization is performed using Equation (12).
x i * = x i j - x 0 b j max j x i j - x 0 b j
where x 0 b j is the determined optimal value, and j th indicates the target value of the criterion. This optimal value can take a value in the range min j x i j x 0 b j max j x i j . After completion of the normalization process, a normalized decision matrix is obtained. The normalized decision matrix ( X * ) of m × n size, which includes m criteria and n alternatives, is shown in Equation (13).
X * = x 1 * 1 x 1 * 2 x 1 * n x 2 * 1 x 2 * 2 x 2 * n x m * 1 x m * 2 x m * n
Step 3. Calculating an absolute value matrix
The normalized values of the decision matrix are subtracted from the normalized values of the reference series (Equation (14)) to form an absolute value matrix (Equation (15)).
0 i = x 0 * j - x i * j
0 i = 01 1 01 2 01 n 02 1 02 2 02 n 0 m 1 0 m 2 0 m n
where 0 i represents the values of the absolute value matrix.
Step 4. Creating a grey relational coefficient matrix
Equation (16) is used to create the grey relational coefficient matrix in which m a x and m i n are calculated with Equations (17) and (18), respectively.
γ 0 i j = m i n + ζ . m a x 0 i j + ζ . m a x
m a x = max i max j 0 i j
m i n = min i min j 0 i j
where γ 0 i j represents the values of the grey relational coefficient matrix. The “discriminant coefficient” or “contrast control coefficient” ζ in Equation (14) is a value in the range of [0, 1]. To be consistent with the literature, ζ = 0.5 was taken in this study for relevant analyses.
Step 5. Calculating grey relational degrees
The grey relational degree is a measure of the geometric similarity between the x i * series in a grey system and the reference series x 0 * and allows the series to be compared. A large grey relational degree indicates a strong relationship between the comparative and reference series. If the two series being compared are identical, the grey correlation degree is 1.
The calculation of grey relational degrees differs according to the weight status of the criteria. When criteria weights are all equal, the grey relational degrees are calculated with Equation (19), while Equation (20) is used when criterion weights differ.
Γ 0 i = 1 n j = 1 n γ 0 i j
Γ 0 i = j = 1 n w i j . γ 0 i j
where Γ 0 i refers to the grey relational degrees, and w i j is the weight of the j th criterion. The sum of the criterion weights must be equal to 1 ( j = 1 n w j = 1 ).

3. Results and Discussion

3.1. Biological Performance

When evaluating the biological performance of the PBR systems at different NH3 and CO2 concentration levels (Scenario 1), four parameters were considered. Table 2 provides the criteria involved in the assessment and a description of the performance parameters. The high dry biomass concentration appeared to be the most dominant factor according to the weights and weight system matrix of the biological performance criteria calculated using the CILOS method (Table 3). The second most dominant factor was cell concentration.
S. dimorphus showed the highest normalized cell number (2.21 ± 0.14, p < 0.01 compared with other test conditions) with 12 ppm NH3 and 3500 ppm CO2 (EXP 14). The maximum specific growth rate of S. dimorphus occurred on the second day of the experiment; the highest rate was 0.83 d−1 with 25 ppm NH3 and 3500 ppm CO2 (EXP15). Dry biomass concentration was significantly higher (1.16 ± 0.08 g L−1, p < 0.01) with 25 ppm NH3 and 2350 ppm CO2 (EXP 11) than that of other test conditions. The maximum values of performance parameters differed with NH3 and CO2 concentrations. The biological performance must stay at the optimum level to reduce the air pollutants released from pig houses. The MCDM method allows one to include different NH3-CO2 concentration combinations in a decision-making process and provides an opportunity to simultaneously evaluate multiple biological factors such as cell number, dry weight, cell weight, and maximum growth rate. Optimal CO2 and NH3 concentrations for algal growth to reduce air pollutants from animal feeding operations are the most significant factor controlling mitigation efficiencies, and thus directly affect the indoor air quality of barns and environmental pollution.
The experimental conditions that resulted in the best biological performance were those in EXP 14. EXP11 and EXP7 ranked second and third, respectively. The worst-performing experiments were found to be EXP13, EXP9 and EXP5. Table 4 presents the ranking of the sixteen experiments by biological performance, as determined using the GRA method (Equations (7)–(18)).

3.2. Environmental Performance

There are many factors affecting environmental performance, such as species-related and environmental influence on CO2 and NH3 fixation and the product yield of the microalgae. In the second scenario of the study, the environmental performance of microalgae grown in the PBR system at different NH3 and CO2 concentration levels was investigated. The environmental performance parameters were determined as CO2 fixation, NH3 fixation, CO2 removal efficiency, and NH3 removal efficiency (Table 2). NH3 removal efficiency appears to be the most dominant factor for the environmental performance, and the second dominant factor was CO2 fixation. The CILOS method processing steps (Equations (1)–(6)) for the weights and weight system matrix of the environmental performance criteria are shown in Table 3.
S. dimorphus showed the maximum CO2 fixation (432.24 ± 41.09 mg L−1d−1) in EXP 11 (25 ppm NH3 and 2350 ppm CO2), while the maximum CO2 removal efficiency (23.84 ± 2.73%) was achieved in EXP 7 (25 ppm NH3 and 1200 ppm CO2). This is because the amount of CO2 supplied to the system in EXP 7 was 1200 ppm, while the amount of CO2 supplied in EXP 11 was 2350 ppm. Similar results were observed for the NH3 fixation and removal efficiencies. While the maximum NH3 fixation was 23.8 ± 2.26 mg L−1d−1 in EXP 11 (25 ppm NH3 and 2350 ppm CO2), the maximum NH3 removal efficiency (100 ± 6.95%) was achieved at 12 ppm NH3 at all CO2 concentrations.
The main purpose of reducing the air pollutants released from livestock farms by microalgae is to reduce both NH3 and CO2 gases in the barn environment most effectively. However, according to the results of the experiments conducted at 16 different NH3-CO2 concentrations, the reduction amounts of ammonia and carbon dioxide gases do not change proportionally in all experiments. For example, the CO2 and NH3 removal efficiencies vary independently for different gas concentrations. Ryu et al. [54] reported that Chlorella sp. had higher cell concentrations with increased CO2 concentrations, but CO2 fixation efficiency was lower at elevated CO2 concentrations. When the results obtained in the study are analyzed statistically, the results identify the experiments in which the highest values of environmental parameters were obtained independently from each other. However, determining the optimum condition by considering all the environmental parameters together would allow more efficient reduction in the gases released from barns.
According to the results of Scenario 2, the first-ranked experiment was EXP14 which had 12 ppm NH3 and 3500 ppm CO2 gas concentrations. This experiment was followed by EXP15, EXP7 and EXP11. The worst-performing experiments were found to be EXP5, EXP8 and EXP13. Table 4 presents the ranking of the 16 experiments in terms of environmental performance, as determined using the GRA method (Equations (7)–(18)).
Aerial pollutants (NH3 and CO2) emitted from animal feeding operations affect the air quality of the environment, the neighborhood, and the health of both animals and workers. These air pollutant emissions are currently being regulated by national regulations and international protocols that aim to reduce air pollutant emissions from intensive livestock farming [55]. Reducing air pollutant concentrations to acceptable levels for human and environmental quality is the main objective of every environmental protection agency or regulatory body in developed or developing countries [56]. Microalgae can be used to remove these air pollutants and produce valuable products in bio-mitigation.

3.3. Overall Performance: Selection of the Optimal CO2 and NH3 Concentrations

The biological and environmental performance of the PBR system was evaluated in Scenarios 1 and 2, respectively. EXP 14 was ranked first for biological and environmental performance according to the MCDM methods. In the third scenario, the overall performance including all the biological and environmental parameters was investigated. The weights and weight system matrix of the overall performance criteria calculated using the CILOS method processing steps (Equations (1)–(6)) are shown in Table 3. Figure 3 shows the criteria weights for all scenarios.
According to the biological and environmental performance, EXP 14 was ranked one (Figure 4). However, the experiment ranking changed when all performance parameters were analyzed together. EXP11 was identified as the most optimal experiment for overall performance (Figure 4). EXP14 and EXP7 were the second and third ranked, respectively. The worst-performing experiments were found to be EXP13, EXP9 and EXP5. Table 5 presents the ranking of the 16 experiments in terms of overall performance.

3.4. Sensitivity Analysis

Sensitivity analysis is a procedure performed to test the consistency and measure the power of decision problem results. In this study, sensitivity analysis was performed to test the consistency and measure the power of the results obtained with CILOS and GRA. The results of the third scenario, including all the criteria, and the results of other MCDM methods were compared. For the sensitivity analysis, Weighted Aggregated Sum Product Assessment (WASPAS), Multi-Attribute Ideal-Real Comparative Analysis (MAIRCA), Additive Ratio Assessment (ARAS), Multi-Attributive Border Approximation Area Comparison (MABAC) and The Complex Proportional Assessment (COPRAS) methods were used. The weights used in all methods were those calculated by the CILOS method. The correlations between the methods listed above and the results of the GRA method were tested with Spearman’s rho rank correlation. The results are shown in Table 6.
When Spearman’s Rho values are examined, excellent correlations are observed between the rankings obtained by all other MCDM methods and the rankings obtained by the GRA method. These results prove that GRA is a consistent method with high-measuring power.

4. Conclusions

This study demonstrated the use of a multi-criteria analysis methodology combined with different CO2 and NH3 levels to improve the CO2 and NH3 fixation ability of S. dimorphus. The MCDM results show that for both the biological and environmental performance, the optimal combination of CO2 and NH3 concentrations is 12 ppm NH3 and 3500 ppm CO2. However, the optimal CO2 and NH3 concentrations for the overall performance were 25 ppm NH3 and 2350 ppm CO2. The results of this study allow producers to determine the maximum mitigation of CO2 and NH3 concentrations and optimise the operating parameters of PBRs for various housing types, such as dairy, poultry, and pig barns.
For example, in the poultry sector, air pollutants released from poultry houses vary depending on the breeding period of the chickens. While the air pollutant concentrations released from hen houses are low in the first days of the production period, they increase towards the end of production. Meanwhile, engineering options are available to adjust the CO2 and NH3 concentrations in the exhaust air from animal barns and the PRB’s algal growth. For the exhaust air, the CO2 and NH3 concentrations that feed into a PBR can be regulated by changing ventilation/heating configuration or settings, installing pre-scrubbers, and so on. For the algal broth, the concentrations can be adjusted by amending the liquid with carbonate or ammonium salts that are readily available on most farms. Therefore, knowing the gas concentrations at which the most effective CO2 and NH3 reductions can be achieved can facilitate the setup and operation of the PBR system. This study indicates that such information can be generated from MCDM analyses. Although still technically intimidating to most producers, the selected MCDM methods are far simpler and require less computing power than artificial intelligence methods (e.g., machine learning). Therefore, they can be translated into Web calculators or MS Excel-based tools that are easily adopted by producers, or implemented in animal barn controllers to automate the facility operation.
Overall, this study presents clear results that can guide decision-makers in choosing the best PBR operating parameters. This MCDM method will aid future algal phytoremediation research for enhancing CO2 and NH3 mitigation and minimizing the environmental impacts of animal feeding operations.
In light of the above conclusions, the following tasks are recommended for future research:
  • Additional MCDM methods should be explored to broaden the scope of the multi-criteria decision-making process in air pollutant mitigation using PBR systems.
  • The significance of the carbohydrate, protein, and fat values of microalgae as criteria should be further investigated. The analysis would facilitate a multi-criteria assessment not only regarding reducing air pollutants emitted from barns but also in evaluating the potential utilization of the obtained biomass in sectors such as animal feed, biodiesel, and others.
  • It is advisable to develop an evaluation tool utilizing the MCDM methods examined in this study. Such a tool would simplify the air pollutant mitigation process and facilitate the comparison of the applicability of microalgae in various sectors.

Author Contributions

All authors who meet authorship criteria are listed as authors. Conceptualization, S.U. and T.A.; methodology, S.U. and T.A.; validation, S.U., T.A. and X.Y.; investigation, S.U.; data curation, S.U. and G.A; writing—original draft preparation, S.U. and T.A.; writing—review and editing, S.U., T.A., G.A. and X.Y.; visualization, S.U. and T.A.; supervision, X.Y. and G.A.; funding acquisition, S.U. and X.Y. All authors have read and agreed to the published version of the manuscript.

Funding

This research was supported by a collaboration between the South Dakota State University Agricultural Experiment Station, Bursa Uludag University, and The Council of Higher Education of Turkey (YUDAB Scholarship). The efforts of Yang were sponsored by the USDA NIFA Hatch (SD00H709-20) and Multistate Hatch Projects (SD00R690-20) through the South Dakota Agricultural Experimental Station.

Institutional Review Board Statement

Not applicable.

Informed Consent Statement

Not applicable.

Data Availability Statement

Not applicable.

Conflicts of Interest

The authors declare no conflict of interest.

References

  1. Maurer, D.L.; Koziel, J.A.; Harmon, J.D.; Hoff, S.J.; Rieck-Hinz, A.M.; Andersen, D.S. Summary of performance data for technologies to control gaseous, odor, and particulate emissions from livestock operations: Air management practices assessment tool (AMPAT). Data Brief 2016, 7, 1413–1429. [Google Scholar] [CrossRef] [PubMed] [Green Version]
  2. Mostafa, E.; Selders, A.; Gates, R.S.; Buescher, W. Pig barns ammonia and greenhouse gas emission mitigation by slurry aeration and acid scrubber. Environ. Sci. Pollut. Res. 2020, 27, 9444–9453. [Google Scholar] [CrossRef] [PubMed]
  3. Van der Heyden, C.; Demeyer, P.; Volcke, E.I.P. Mitigating emissions from pig and poultry housing facilities through air scrubbers and biofilters: State-of-the-art and perspectives. Biosyst. Eng. 2015, 134, 74–93. [Google Scholar] [CrossRef]
  4. Conti, C.; Costantini, M.; Fusi, A.; Manzardo, A.; Guarino, M.; Bacenetti, J. Environmental impact of pig production affected by wet acid scrubber as mitigation technology. Sustain. Prod. Consum. 2021, 28, 580–590. [Google Scholar] [CrossRef]
  5. Feilberg, A.; Sommer, S.G. Ammonia and Malodorous Gases: Sources and Abatement Technologies. In Animal Manure Recycling: Treatment and Management; John Wiley & Son: Hoboken, NJ, USA, 2013; pp. 153–175. [Google Scholar] [CrossRef]
  6. Bobrowski, A.B.; Willink, D.; Janke, D.; Amon, T.; Hagenkamp-Korth, F.; Hasler, M.; Hartung, E. Reduction of ammonia emissions by applying a urease inhibitor in naturally ventilated dairy barns. Biosyst. Eng. 2021, 204, 104–114. [Google Scholar] [CrossRef]
  7. Costa, J.A.V.; de Morais, M.G. An Open Pond System for Microalgal Cultivation. In Biofuels from Algae; Elsevier: Amsterdam, The Netherlands, 2014; pp. 1–22. [Google Scholar] [CrossRef]
  8. Li, Q.F.; Liu, Y.; Liao, W.; Powers, W. Microalgal Cultivation Using Animal Production Exhaust Air: Technical and Economic Feasibility. CLEAN–Soil Air Water 2017, 45, 1500309. [Google Scholar] [CrossRef]
  9. Lim, Y.A.; Khong, N.M.; Priyawardana, S.D.; Ooi, K.R.; Ilankoon, I.; Chong, M.N.; Foo, S.C. Distinctive correlations between cell concentration and cell size to microalgae biomass under increasing carbon dioxide. Bioresour. Technol. 2022, 347, 126733. [Google Scholar] [CrossRef] [PubMed]
  10. Kang, J.; Wang, T.; Xin, H.; Wen, Z. A laboratory study of microalgae-based ammonia gas mitigation with potential application for improving air quality in animal production operations. J. Air Waste Manag. Assoc. 2013, 64, 330–339. [Google Scholar] [CrossRef]
  11. Fatini, A.M.; Basri, E.M.; Maznah, W.O.W. Effect of different nitrogen sources on cell growth and biochemical compositions of Chlorococcum sp. cultivated under laboratory conditions. IOP Conf. Ser. Earth Environ. Sci. 2021, 711, 012010. [Google Scholar] [CrossRef]
  12. de Morais, M.G.; Costa, J.A.V. Biofixation of carbon dioxide by Spirulina sp. and Scenedesmus obliquus cultivated in a three-stage serial tubular photobioreactor. J. Biotechnol. 2007, 129, 439–445. [Google Scholar] [CrossRef]
  13. Ho, S.-H.; Chen, C.-Y.; Chang, J.-S. Effect of light intensity and nitrogen starvation on CO2 fixation and lipid/carbohydrate production of an indigenous microalga Scenedesmus obliquus CNW-N. Bioresour. Technol. 2012, 113, 244–252. [Google Scholar] [CrossRef] [PubMed]
  14. Kang, J.; Wen, Z. Use of microalgae for mitigating ammonia and CO2 emissions from animal production operations—Evaluation of gas removal efficiency and algal biomass composition. Algal Res. 2015, 11, 204–210. [Google Scholar] [CrossRef]
  15. Zavadskas, E.K.; Turskis, Z.; Kildienė, S. State of art surveys of overviews on mcdm/madm methods. Technol. Econ. Dev. Econ. 2014, 20, 165–179. [Google Scholar] [CrossRef] [Green Version]
  16. Toloie-Eshlaghy, A.; Homayonfar, M. MCDM Methodologies and Applications: A Literature Review from 1999 to 2009. Res. J. Intern. Stud. 2011, 21, 86–137. [Google Scholar]
  17. Florindo, T.; Florindo, G.; Talamini, E.; Costa, J.; Léis, C.; Tang, W.; Schultz, G.; Kulay, L.; Pinto, A.; Ruviaro, C. Application of the multiple criteria decision-making (MCDM) approach in the identification of Carbon Footprint reduction actions in the Brazilian beef production chain. J. Clean. Prod. 2018, 196, 1379–1389. [Google Scholar] [CrossRef]
  18. Stević, Ž.; Pamucar, D.; Puška, A.; Chatterjee, P. Sustainable supplier selection in healthcare industries using a new MCDM method: Measurement of alternatives and ranking according to COmpromise solution (MARCOS). Comput. Ind. Eng. 2020, 140, 106231. [Google Scholar] [CrossRef]
  19. Kaya, S.K.; Aycin, E. An integrated interval type 2 fuzzy AHP and COPRAS-G methodologies for supplier selection in the era of Industry 4.0. Neural Comput. Appl. 2021, 33, 10515–10535. [Google Scholar] [CrossRef]
  20. Dang, T.-T.; Nguyen, N.-A.; Nguyen, V.-T.; Dang, L.-T. A Two-Stage Multi-Criteria Supplier Selection Model for Sustainable Automotive Supply Chain under Uncertainty. Axioms 2022, 11, 228. [Google Scholar] [CrossRef]
  21. Pineda, P.J.G.; Liou, J.J.; Hsu, C.-C.; Chuang, Y.-C. An integrated MCDM model for improving airline operational and financial performance. J. Air Transp. Manag. 2018, 68, 103–117. [Google Scholar] [CrossRef]
  22. Ramanathan, R.; Ramanathan, U.; Bentley, Y. The debate on flexibility of environmental regulations, innovation capabilities and financial performance–A novel use of DEA. Omega 2018, 75, 131–138. [Google Scholar] [CrossRef] [Green Version]
  23. Torbacki, W. A Hybrid MCDM Model Combining DANP and PROMETHEE II Methods for the Assessment of Cybersecurity in Industry 4.0. Sustainability 2021, 13, 8833. [Google Scholar] [CrossRef]
  24. Nguyen, V.T.T.; Wang, C.-N.; Yang, F.-C.; Vo, T.M.N. Efficiency Evaluation of Cyber Security Based on EBM-DEA Model. Eurasia Proc. Sci. Technol. Eng. Math. 2022, 17, 38–44. [Google Scholar] [CrossRef]
  25. Tulun, Ş.; Arsu, T.; Gürbüz, E. Selection of the most suitable biogas facility location with the geographical information system and multi-criteria decision-making methods: A case study of Konya Closed Basin, Turkey. Biomass Convers. Biorefinery 2023, 13, 3439–3461. [Google Scholar] [CrossRef]
  26. Saraswat, S.; Digalwar, A.K.; Yadav, S.; Kumar, G. MCDM and GIS based modelling technique for assessment of solar and wind farm locations in India. Renew. Energy 2021, 169, 865–884. [Google Scholar] [CrossRef]
  27. Zhang, F.; Ju, Y.; Gonzalez, E.D.S.; Wang, A. SNA-based multi-criteria evaluation of multiple construction equipment: A case study of loaders selection. Adv. Eng. Inform. 2020, 44, 101056. [Google Scholar] [CrossRef]
  28. Ghorabaee, M.K.; Amiri, M.; Zavadskas, E.K.; Antucheviciene, J. A new hybrid fuzzy MCDM approach for evaluation of construction equipment with sustainability considerations. Arch. Civ. Mech. Eng. 2018, 18, 32–49. [Google Scholar] [CrossRef]
  29. Li, H.; Wang, W.; Fan, L.; Li, Q.; Chen, X. A novel hybrid MCDM model for machine tool selection using fuzzy DEMATEL, entropy weighting and later defuzzification VIKOR. Appl. Soft Comput. 2020, 91, 106207. [Google Scholar] [CrossRef]
  30. Wu, Z.; Ahmad, J.; Xu, J. A group decision making framework based on fuzzy VIKOR approach for machine tool selection with linguistic information. Appl. Soft Comput. 2016, 42, 314–324. [Google Scholar] [CrossRef]
  31. Narayanamoorthy, S.; Brainy, J.; Sulaiman, R.; Ferrara, M.; Ahmadian, A.; Kang, D. An integrated decision making approach for selecting a sustainable waste water treatment technology. Chemosphere 2022, 301, 134568. [Google Scholar] [CrossRef]
  32. Barbosa, R.; Guimarães, C.; Serra, E.; Bellon, D.; Martínez-Amariz, A. Multicriteria analysis of methane mitigation options on offshore oil and gas production platforms. J. Phys. Conf. Ser. 2019, 1386, 012118. [Google Scholar] [CrossRef]
  33. Cao, Y.; Wang, X.; Bai, Z.; Chadwick, D.; Misselbrook, T.; Sommer, S.G.; Qin, W.; Ma, L. Mitigation of ammonia, nitrous oxide and methane emissions during solid waste composting with different additives: A meta-analysis. J. Clean. Prod. 2019, 235, 626–635. [Google Scholar] [CrossRef]
  34. Unay, E.; Ozkaya, B.; Yoruklu, H.C. A multicriteria decision analysis for the evaluation of microalgal growth and harvesting. Chemosphere 2021, 279, 130561. [Google Scholar] [CrossRef] [PubMed]
  35. Albaqi, A.R.; Dewayanto, N.; Suyono, E.A.; Budiman, A. Selection of Microalgae Harvesting Technology for Bio-Crude Oil Production. Front. Renew. Energy 2022, 1, 31–37. Available online: https://journal.ugm.ac.id/v3/FREE/article/view/3847 (accessed on 28 October 2022).
  36. Nwokoagbara, E.; Olaleye, A.K.; Wang, M. Biodiesel from microalgae: The use of multi-criteria decision analysis for strain selection. Fuel 2015, 159, 241–249. [Google Scholar] [CrossRef]
  37. Katooli, M.H.; Aslani, A.; Astaraee, F.R.; Sobczuk, T.M.; Bakhtiar, A. Multi-criteria analysis of microalgae production in Iran. Biofuels 2019, 12, 789–795. [Google Scholar] [CrossRef] [Green Version]
  38. Delanka-Pedige, H.; Zhang, Y.; Nirmalakhandan, N. Algal wastewater treatment integrated with carbon adsorption and ozonation for water reclamation: Multi-criteria comparison with conventional pathways. Algal Res. 2021, 61, 102581. [Google Scholar] [CrossRef]
  39. Uguz, S.; Anderson, G.; Yang, X.; Simsek, E.; Osabutey, A. Cultivation of Scenedesmus dimorphus with air contaminants from a pig confinement building. J. Environ. Manag. 2022, 314, 115129. [Google Scholar] [CrossRef]
  40. Goswami, R.C.D.; Kalita, M.C. Scenedesmus dimorphus and Scenedesmus quadricauda: Two potent indigenous microalgae strains for biomass production and CO2 mitigation—A study on their growth behaviour and lipid productivity under different concentration of urea as nitrogen source. J. Algal Biomass Utln. 2011, 2, 42–49. Available online: https://pdfs.semanticscholar.org/9874/6c87fce372e744d9ba4071fb23867f6abd7d.pdf (accessed on 22 October 2021).
  41. Shen, Y.; Pei, Z.; Yuan, W.; Mao, E. Effect of nitrogen and extraction method on algae lipid yield. Int. J. Agric. Biol. Eng. 2009, 2, 51–57. [Google Scholar] [CrossRef]
  42. Zavadskas, E.K. Integrated Determination of Objective Criteria Weights in MCDM. Int. J. Inf. Technol. Decis. Mak. 2016, 15, 267–283. [Google Scholar] [CrossRef]
  43. Čereška, A.; Zavadskas, E.K.; Cavallaro, F.; Podvezko, V.; Tetsman, I.; Grinbergienė, I. Sustainable Assessment of Aerosol Pollution Decrease Applying Multiple Attribute Decision-Making Methods. Sustainability 2016, 8, 586. [Google Scholar] [CrossRef] [Green Version]
  44. Luo, Y.; Zhang, X.; Qin, Y.; Yang, Z.; Liang, Y. Tourism Attraction Selection with Sentiment Analysis of Online Reviews Based on Probabilistic Linguistic Term Sets and the IDOCRIW-COCOSO Model. Int. J. Fuzzy Syst. 2020, 23, 295–308. [Google Scholar] [CrossRef]
  45. Yenilmezel, S.; Ertuğrul, I. Çok Kriterli Karar Verme Yöntemleri İle Bir Mermer Fabrikası İçin Kesintisiz Güç Kaynağı Seçimi. J. Aksaray Univ. Fac. Econ. Adm. Sci. 2022, 14, 251–266. [Google Scholar] [CrossRef]
  46. Çiftaslan, E.M.; Rençber, O.F. IDOCRIW ve CoCoSo Yöntemleri ile Sistemik Önemli Bankaların Performans Analizi: Türkiye Örneği. Kahramanmaraş Sütçü İmam Üniversitesi Sos. Bilim. Derg. 2022, 19, 54–72. [Google Scholar] [CrossRef]
  47. Trinkūnienė, E.; Podvezko, V.; Zavadskas, E.K.; Jokšienė, I.; Vinogradova, I.; Trinkūnas, V. Evaluation of quality assurance in contractor contracts by multi-attribute decision-making methods. Econ. Res.-Ekon. Istraživanja 2017, 30, 1152–1180. [Google Scholar] [CrossRef] [Green Version]
  48. Ju-Long, D. Control problems of grey systems. Syst. Control Lett. 1982, 1, 288–294. [Google Scholar] [CrossRef]
  49. Zeng, G.; Jiang, R.; Huang, G.; Xu, M.; Li, J. Optimization of wastewater treatment alternative selection by hierarchy grey relational analysis. J. Environ. Manag. 2007, 82, 250–259. [Google Scholar] [CrossRef]
  50. Kuo, Y.; Yang, T.; Huang, G.-W. The use of grey relational analysis in solving multiple attribute decision-making problems. Comput. Ind. Eng. 2008, 55, 80–93. [Google Scholar] [CrossRef]
  51. Ecer, F.; Günay, F. Measuring the financial performances of tourism firms traded on the Borsa Istanbul through gray relational analysis method. Anatolia Tur. Arast. Derg. 2014, 25, 35–48. [Google Scholar]
  52. Özbek, A.; Demirkol, I. Lojistik sektöründe faaliyet gösteren işletmelerin SWARA ve GİA yöntemleri ile analizi. Kırıkkale Üniversitesi Sos. Bilim. Derg. 2018, 8, 71–86. Available online: https://dergipark.org.tr/en/pub/kusbd/issue/35805/342593 (accessed on 5 October 2022).
  53. Ayçin, E. Çok Kriterli Karar Verme: Bilgisayar Uygulamalı Çözümler, in Nobel Akad. Yayıncılık. 2019. Available online: https://www.researchgate.net/profile/Ejder-Aycin/publication/333918321_Cok_Kriterli_Karar_Verme_Bilgisayar_Uygulamali_Cozumler_Genisletilmis_ve_Guncellenmis_2_Baski/links/5f81fba792851c14bcbe6d54/Cok-Kriterli-Karar-Verme-Bilgisayar-Uygulamali-Coezuemler-G (accessed on 5 October 2022).
  54. Ryu, H.J.; Oh, K.K.; Kim, Y.S. Optimization of the influential factors for the improvement of CO2 utilization efficiency and CO2 mass transfer rate. J. Ind. Eng. Chem. 2009, 15, 471–475. [Google Scholar] [CrossRef]
  55. Guo, L.; Zhao, B.; Jia, Y.; He, F.; Chen, W. Mitigation Strategies of Air Pollutants for Mechanical Ventilated Livestock and Poultry Housing—A Review. Atmosphere 2022, 13, 452. [Google Scholar] [CrossRef]
  56. Smiles, U.; Ogochukwu, E.; Ivoke, G.; Okoro, G. Evaluation of effect of pig production to the Environment in Enugu State, Nigeria. Sustain. Agric. Food Environ. Res. 2023, 12. [Google Scholar] [CrossRef]
Figure 1. Workflow chart for proposed MCDM analyses.
Atmosphere 14 01079 g001
Figure 2. PBRs operating in the experiment.
Atmosphere 14 01079 g002
Figure 3. Criteria weights for all scenarios.
Atmosphere 14 01079 g003
Figure 4. Ranks for all scenarios.
Atmosphere 14 01079 g004
Table 1. Criteria and key performance indicators to evaluate the performance of algal PBRs.
CriteriaKey Performance Indicators (Kpis)Definition
Biological PerformanceC1Cell countIndicating algal cell concentrations grown with NH3 and CO2 typical of the barn exhaust air
C2Dry biomassIndicating algal dry biomass concentrations grown with NH3 and CO2 typical of the barn exhaust air
C3Cell weightIndicating average algal cell weight grown with NH3 and CO2 typical of the barn exhaust air
C4Growth rateIndicating specific algal growth rate, i.e., a ratio of algal cell increase to the initial cell concentration.
Environmental PerformanceC5CO2 fixation rateIndicating CO2 uptake by algae—an estimate from algal biomass and its carbon content
C6NH3 fixation rateIndicating NH3 uptake by algae—an estimate from algal biomass and its nitrogen content
C7CO2 removal rateIndicating the fraction of CO2 in PBR influents taken up by algae
C8NH3 removal rateIndicating the fraction of NH3 in PRB influents taken up by algae
Overall PerformanceC1, C2, C3, C4, C5, C6, C7 and C8
Table 2. Decision matrix for multi-criteria analyses.
ScenariosNH3-CO2 CombinationsOverall Performance
Biological PerformanceEnvironmental Performance
Criteria AspectsMaxMaxMaxMaxMaxMaxMaxMax
Criteria/IndicatorsC1C2C3C4C5C6C7C8
EXP10 ppm NH3-350 ppm CO20.540.600.313.390000
EXP212 ppm NH3-350 ppm CO21.151.120.440.9699.522.35.4876.6
EXP325 ppm NH3-350 ppm CO21.271.200.62.0881.818.34.536.1
EXP450 ppm NH3-350 ppm CO21.231.240.452.2671.015.93.915.6
EXP50 ppm NH3-1200 ppm CO20.690.720.051.280000
EXP612 ppm NH3-1200 ppm CO21.781.800.351.01193.012.610.694.4
EXP725 ppm NH3-1200 ppm CO21.952.000.620.53364.823.820.185.3
EXP850 ppm NH3-1200 ppm CO21.411.450.261.2128.78.47.0928.4
EXP90 ppm NH3-2350 ppm CO20.850.880.281.736.300.410.340
EXP1012 ppm NH3-2350 ppm CO21.761.770.341.06163.85.469.0280.0
EXP1125 ppm NH3-2350 ppm CO22.042.160.430.58432.214.423.899.8
EXP1250 ppm NH3-2350 ppm CO21.321.330.350.73252.98.4313.955.7
EXP130 ppm NH3-3500 ppm CO21.171.190.311.2654.41.212.990
EXP1412 ppm NH3-3500 ppm CO22.212.220.490.75267.35.9814.797.2
EXP1525 ppm NH3-3500 ppm CO21.561.530.831.58105.82.365.8346.7
EXP1650 ppm NH3-3500 ppm CO21.211.230.511.23105.62.365.8123.3
All criteria in the decision matrix were maximization-oriented criteria for all three scenarios. Each NH3-CO2 combination corresponded to a unique set of input and output data.
Table 3. Criteria weights for all scenarios.
Criteria/ScenarioScenario 1Scenario 2Scenario 3
q10.2687 0.1860
q20.2710 0.2130
q30.2066 0.1347
q40.2537 0.1318
q5 0.28850.0801
q6 0.11380.0504
q7 0.28800.0801
q8 0.30980.1238
Table 4. Grey Relational Coefficient Matrix and Ranks for Scenario 1 and 2.
Experiments/CriteriaScenario 1Scenario 2
Grey Relational Coefficient MatrixCriteria Weights DifferGrey Relational Coefficient MatrixCriteria Weights Differ
C1C2C3C4 Γ 0 i RankC5C6C7C8 Γ 0 i Rank
EXP10.3330.3330.4291.0000.52270.3330.3330.4291.0000.5675
EXP20.4410.4240.5000.3700.431130.4410.4240.5000.3700.43412
EXP30.4700.4430.6290.5220.50980.4700.4430.6290.5220.5296
EXP40.4600.4530.5060.5590.49390.4600.4530.5060.5590.5039
EXP50.3550.3510.3330.4040.362160.3550.3510.3330.4040.36316
EXP60.6600.6590.4480.3750.54450.6600.6590.4480.3750.5117
EXP70.7630.7860.6500.3330.63730.7630.7860.6500.3330.6003
EXP80.5110.5130.4060.3950.460100.5110.5130.4060.3950.44511
EXP90.3800.3770.4150.4630.407150.3800.3770.4150.4630.41515
EXP100.6500.6430.4430.3800.53760.6500.6430.4430.3800.5068
EXP110.8310.9310.4940.3370.66320.8310.9310.4940.3370.5924
EXP120.4840.4760.4480.3500.441120.4840.4760.4480.3500.43113
EXP130.4450.4400.4290.4020.429140.4450.4400.4290.4020.42614
EXP141.0001.0000.5340.3510.73911.0001.0000.5340.3510.6651
EXP150.5620.5401.0000.4410.61640.5620.5401.0000.4410.6482
EXP160.4550.4500.5490.3980.459110.4550.4500.5490.3980.46410
Table 5. Grey Relational Coefficient Matrix and Ranks for Scenario 3.
Grey Relational Coefficient MatrixCriteria Weights Differ
Experiments/CriteriaC1C2C3C4C5C6C7C8 Γ 0 i Rank
EXP10.3330.3330.4291.0000.3330.3330.3330.3330.43413
EXP20.4410.4240.5000.3700.3940.8840.3940.6810.4808
EXP30.4700.4430.6290.5220.3810.6830.3810.4390.4857
EXP40.4600.4530.5060.5590.3740.6000.3740.3720.46010
EXP50.3550.3510.3330.4040.3330.3330.3330.3330.35016
EXP60.6600.6590.4480.3750.4750.5140.4751.0000.5994
EXP70.7630.7860.6500.3330.7621.0000.7621.0000.7373
EXP80.5110.5130.4060.3950.4160.4360.4160.4110.45011
EXP90.3800.3770.4150.4630.3370.3370.3370.3330.38015
EXP100.6500.6430.4430.3800.4460.3930.4461.0000.5835
EXP110.8310.9310.4940.3371.0000.5581.0001.0000.7761
EXP120.4840.4760.4480.3500.5470.4360.5470.5300.4739
EXP130.4450.4400.4290.4020.3640.3450.3640.3330.40414
EXP141.0001.0000.5340.3510.5670.4000.5671.0000.7522
EXP150.5620.5401.0000.4410.3980.3570.3980.4840.5546
EXP160.4550.4500.5490.3980.3980.3570.3980.3940.43812
Table 6. Spearman’s Rho correlation values between methods.
MethodWASPASMAIRCAARASMABACCOPRAS
GRA0.988 *0.991 *0.991 *0.991 *0.991 *
* A significant data difference methods.
Disclaimer/Publisher’s Note: The statements, opinions and data contained in all publications are solely those of the individual author(s) and contributor(s) and not of MDPI and/or the editor(s). MDPI and/or the editor(s) disclaim responsibility for any injury to people or property resulting from any ideas, methods, instructions or products referred to in the content.

