
Analysis of the Severe Dust Process and Its Impact on Air Quality in Northern China

Abstract
:1. Introduction
2. Data and Methods
2.1. Data
2.2. Method of Determining the Location of Low-Pressure Center and Front
2.3. Dust Duration and Classification, Air Quality Levels
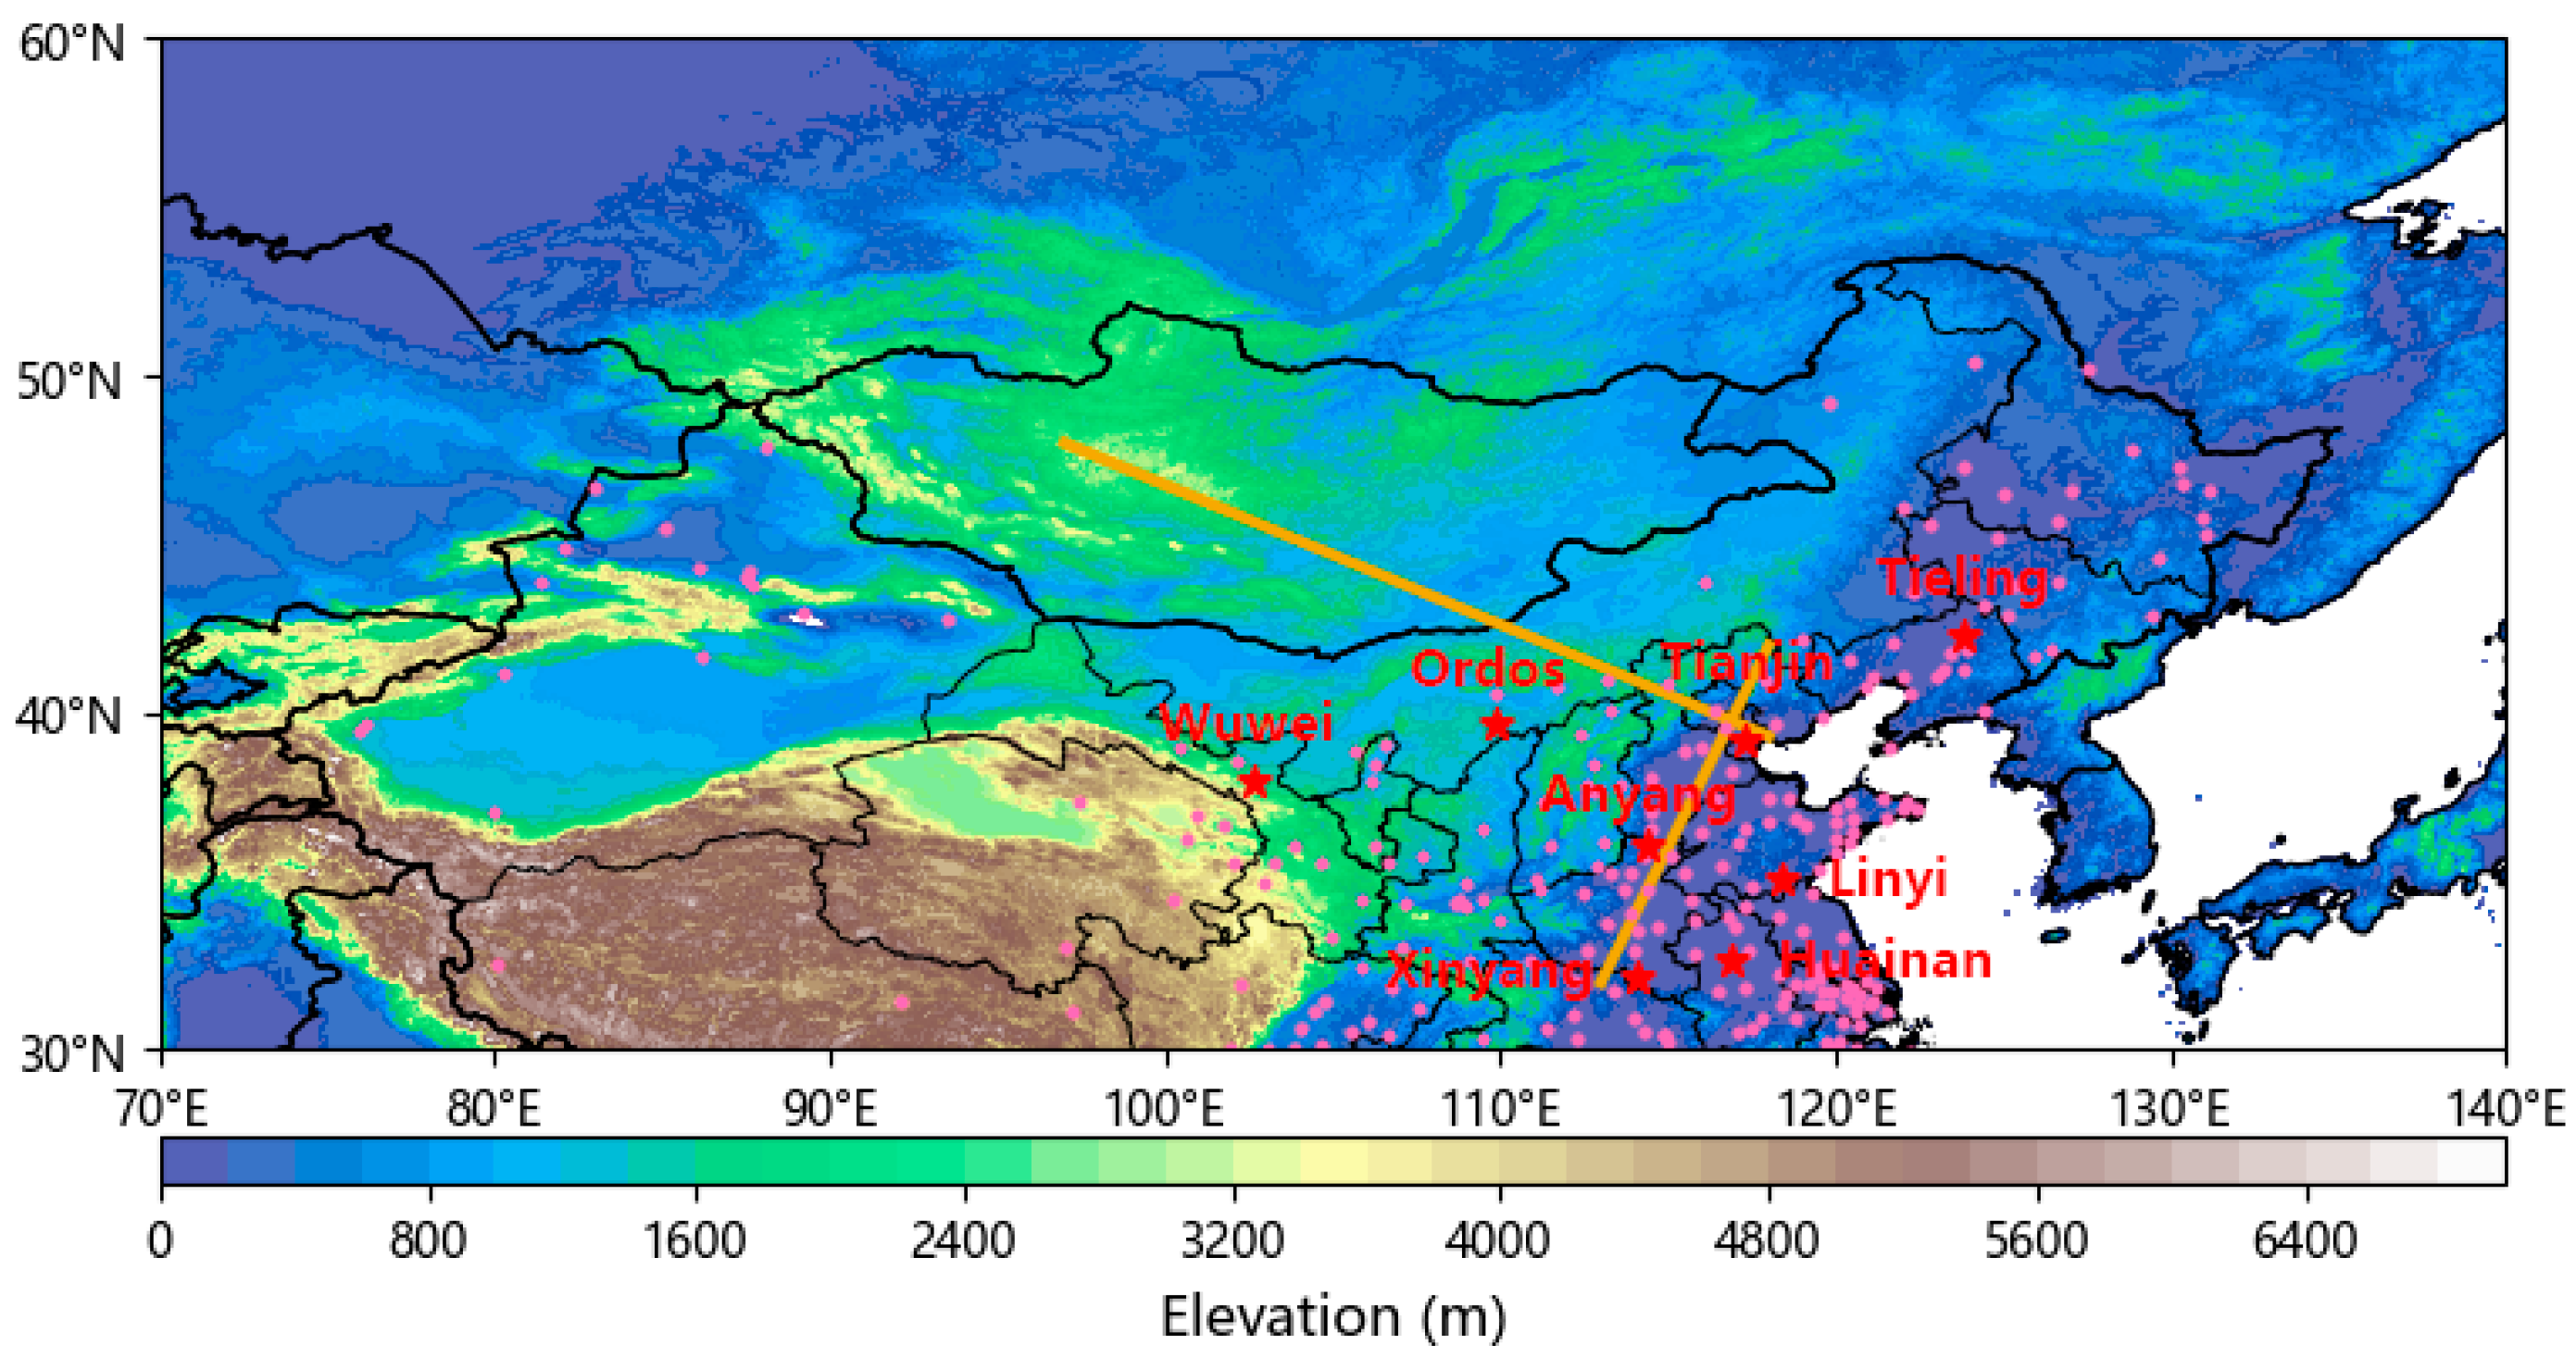
2.4. Study Area and Distribution of Observation Station
3. Weather Situation
4. Transport Characteristics of Dust
5. Effects on Air Quality
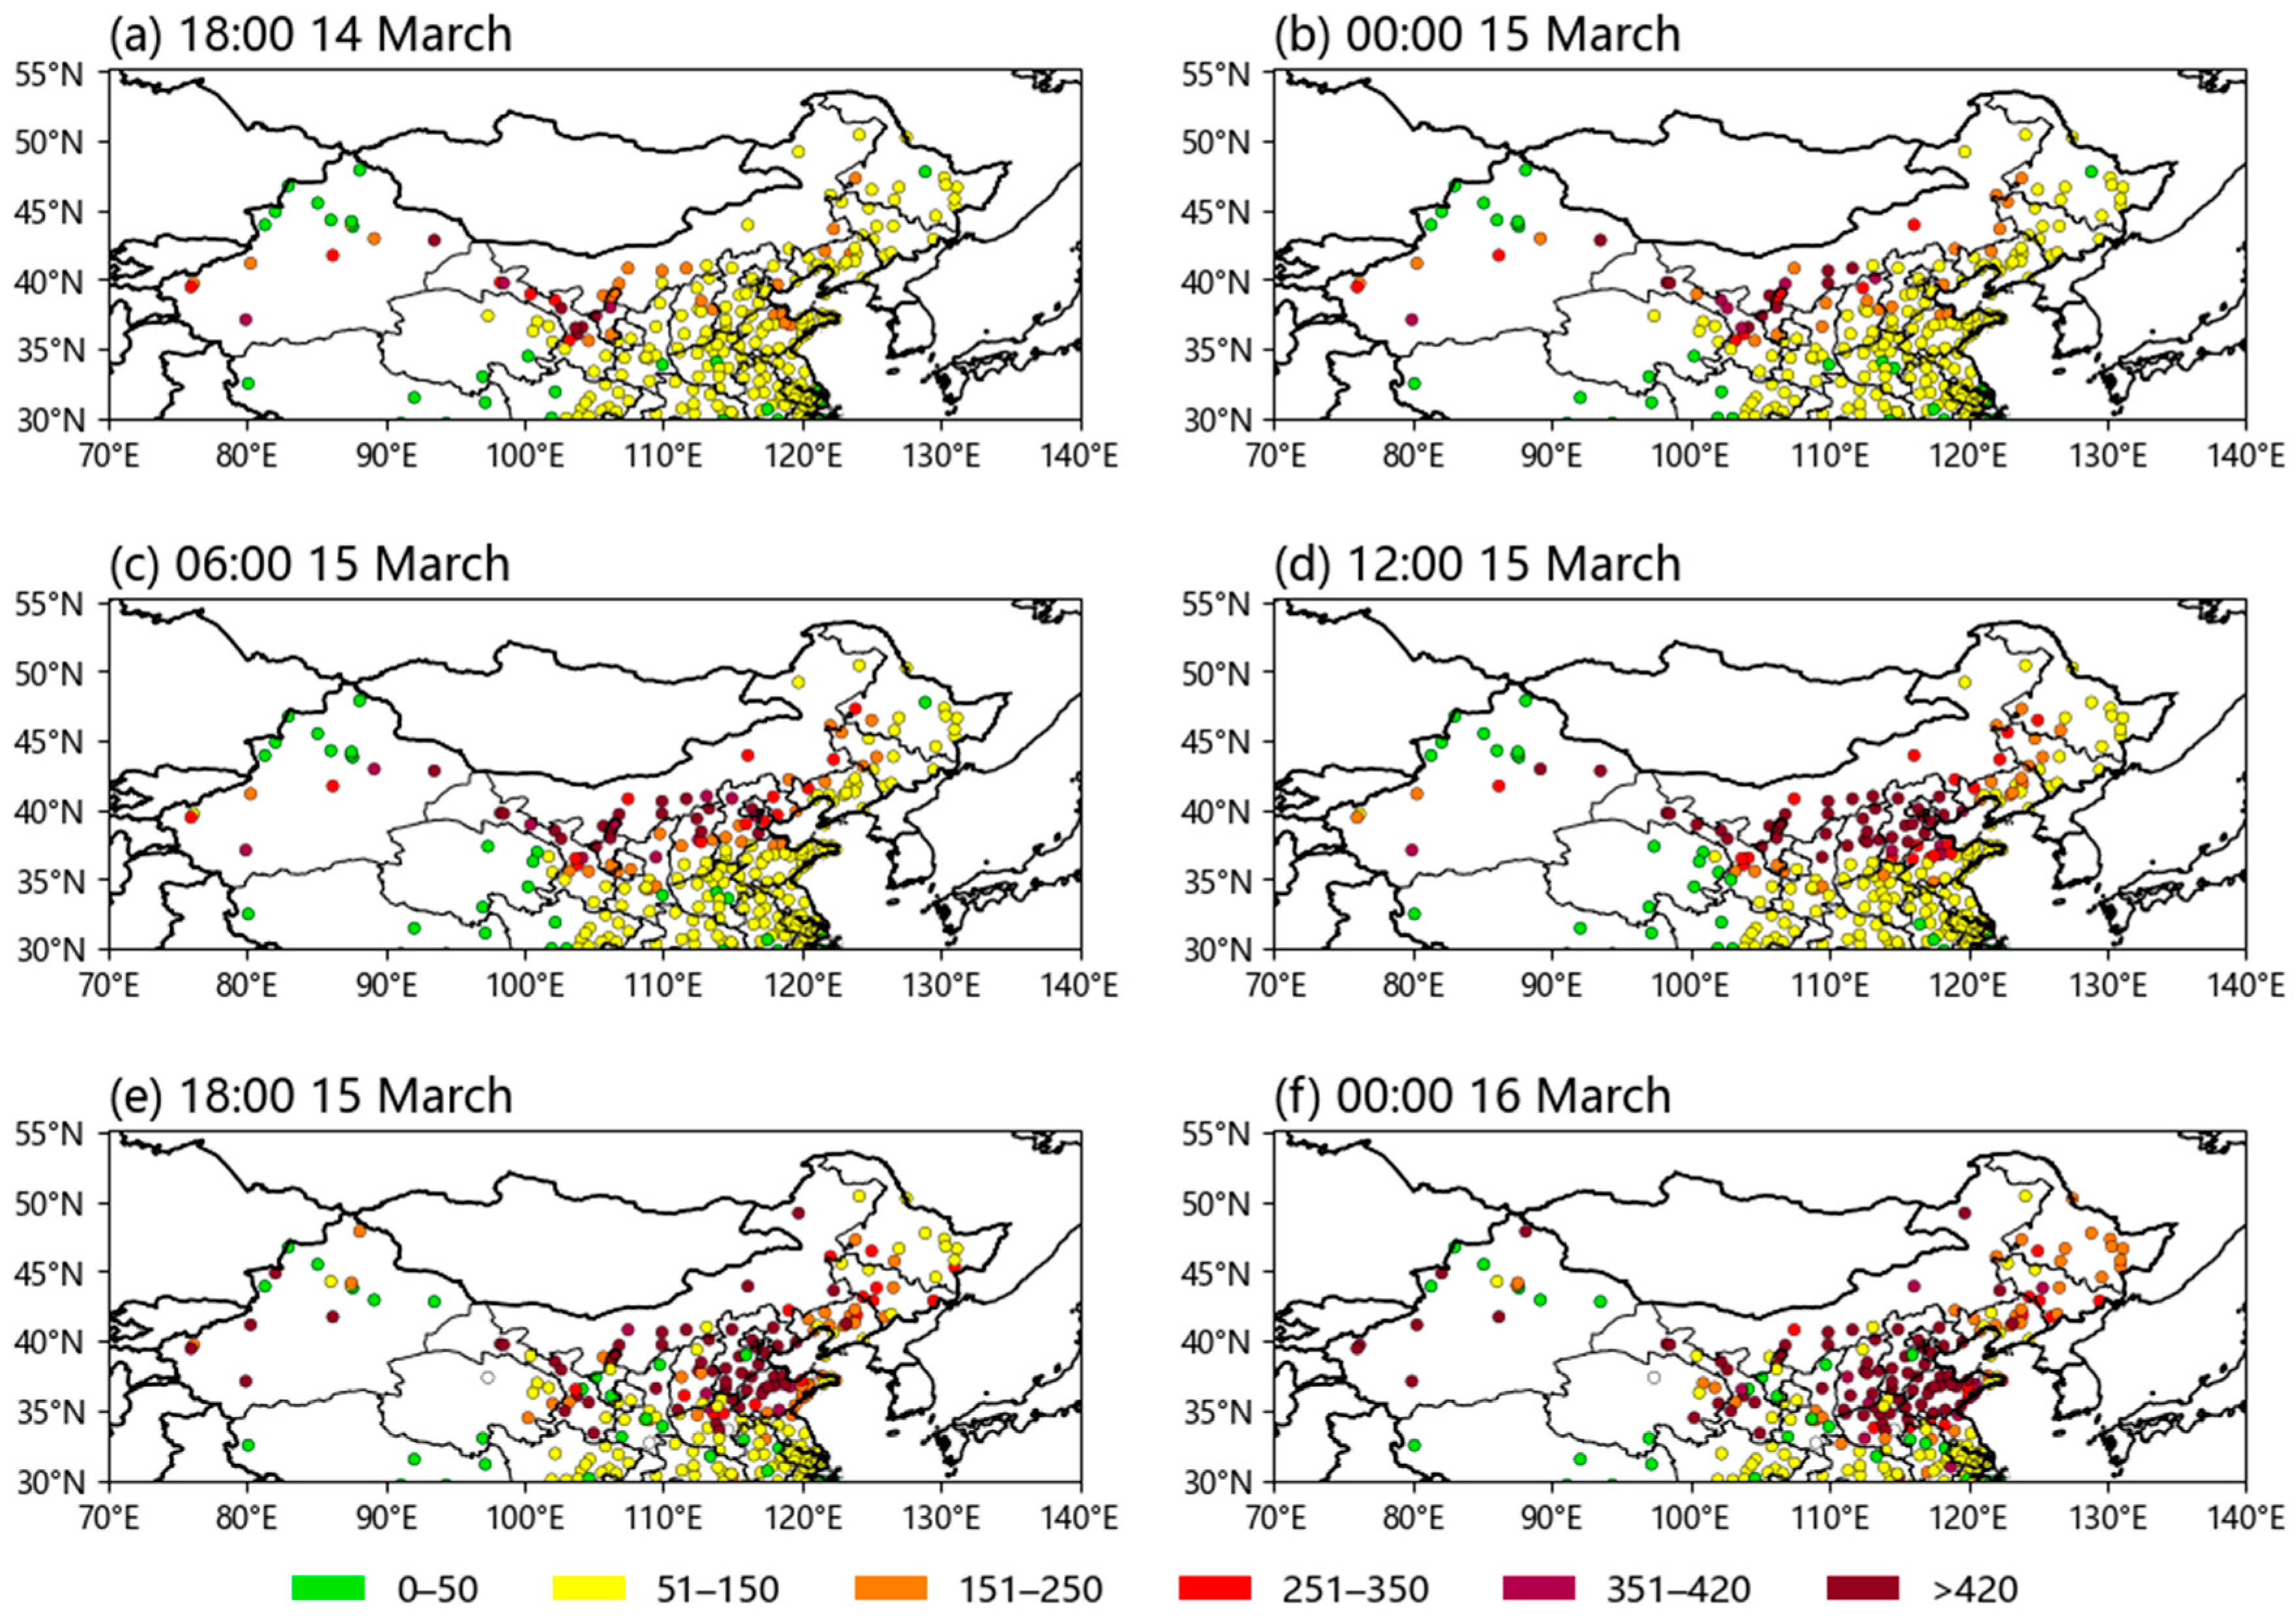
5.1. Spatial Distribution of Particulate Matter (PM)
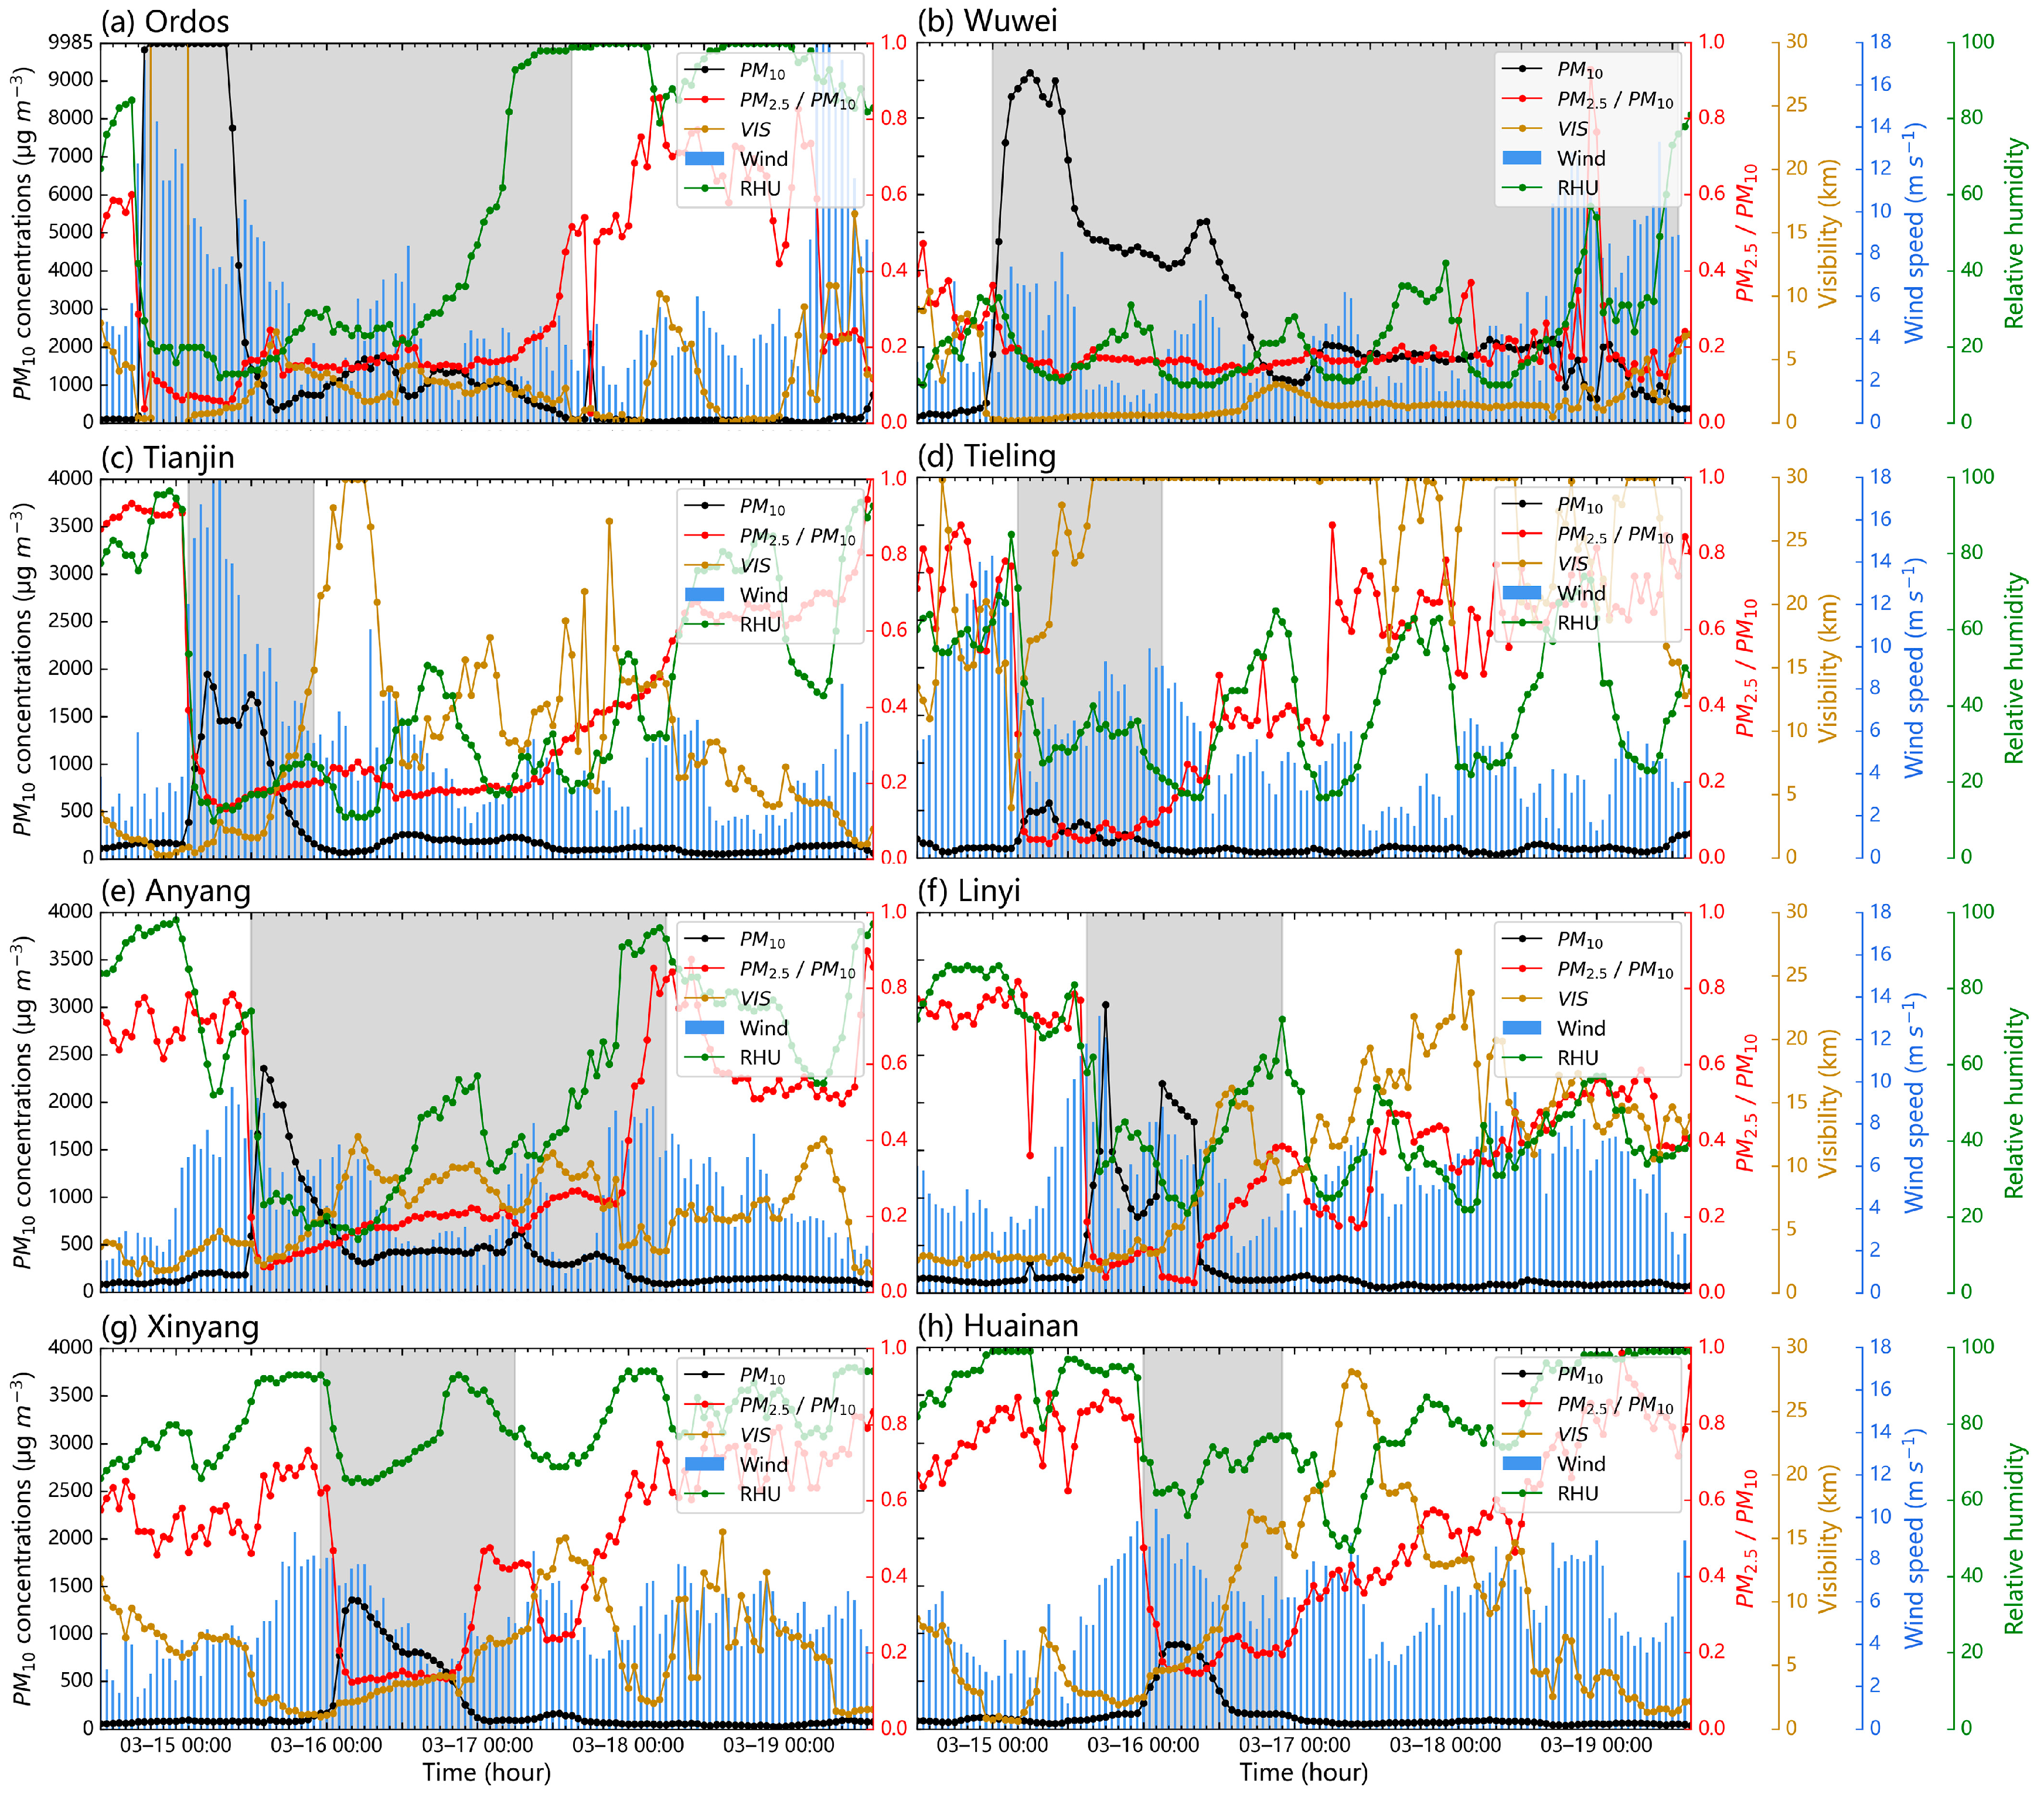
5.2. Temporal Variation of PM and Meteorological Elements at Typical Stations
6. Conclusions
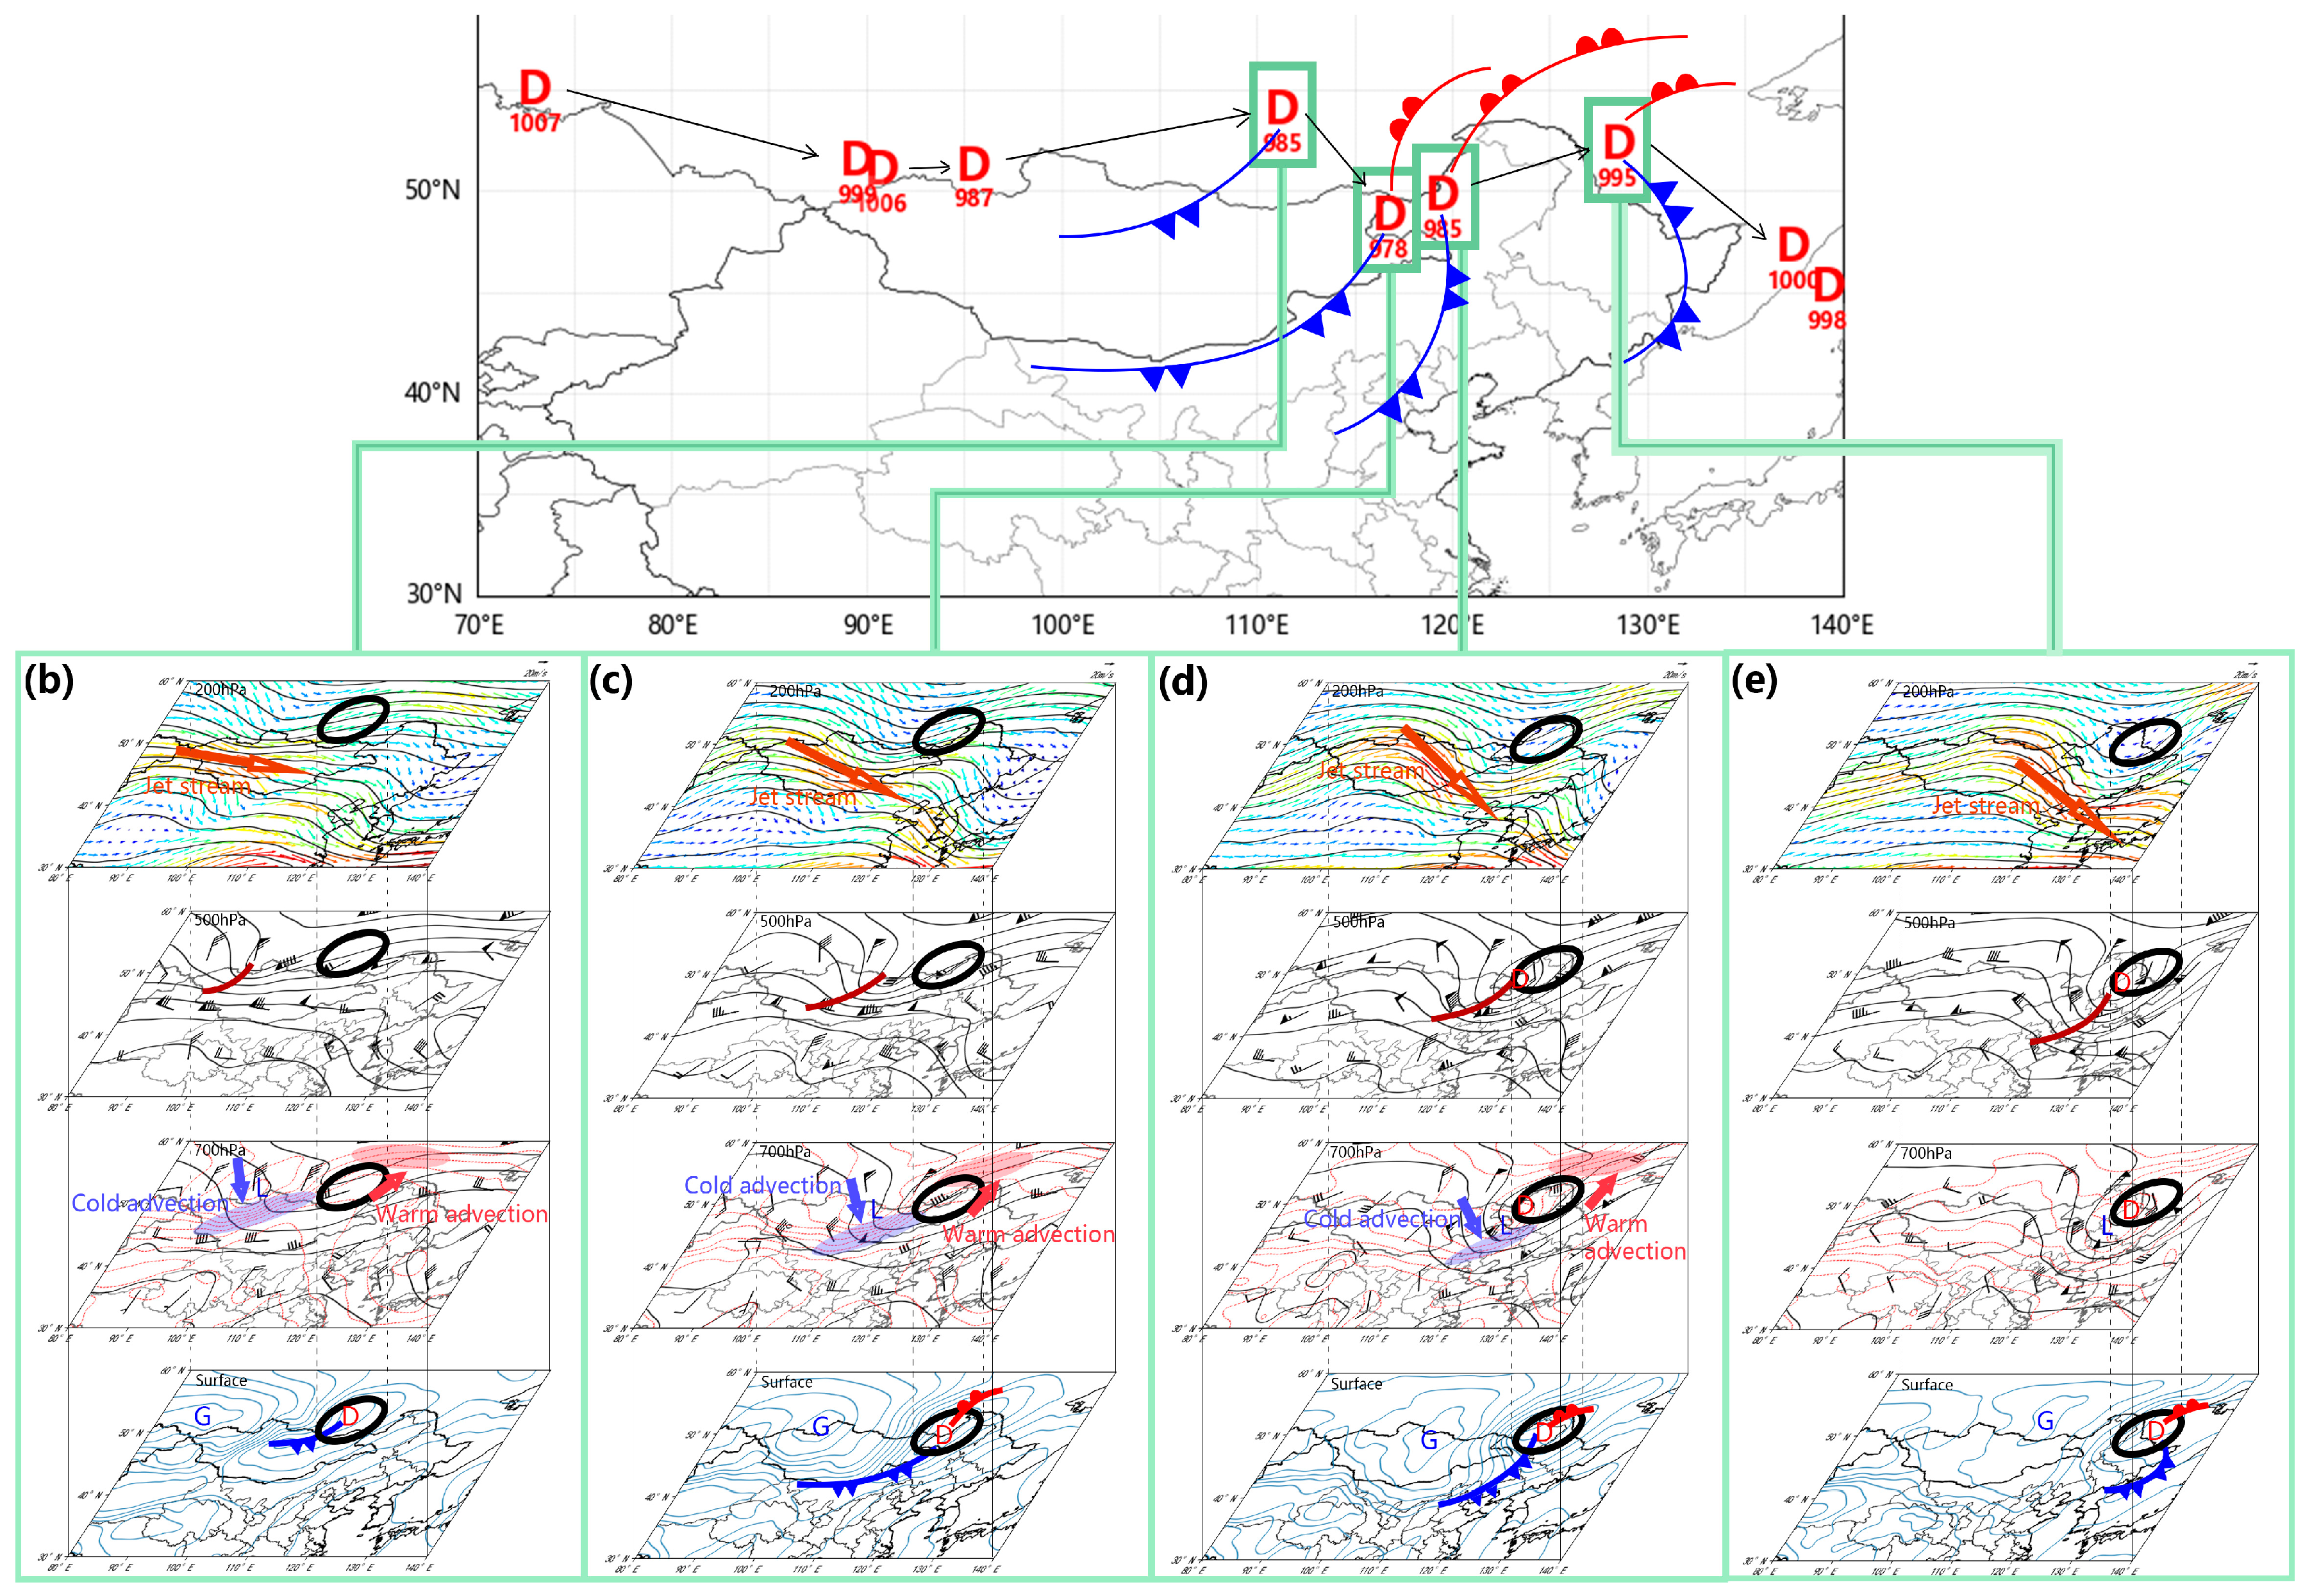
- The present dust event belongs to the typical Mongolian cyclone-induced type. The strong divergence on the left side of the jet stream exit, the positive vorticity advection ahead of the trough at high levels, and the strong temperature gradient at low levels all contribute to the initiation and development of the frontal cyclone system. The intense Mongolian cyclone facilitates near-surface dust uplift and promotes both vertical and long-distance horizontal transport of dust, thereby providing advantageous dynamic conditions for this dust event.
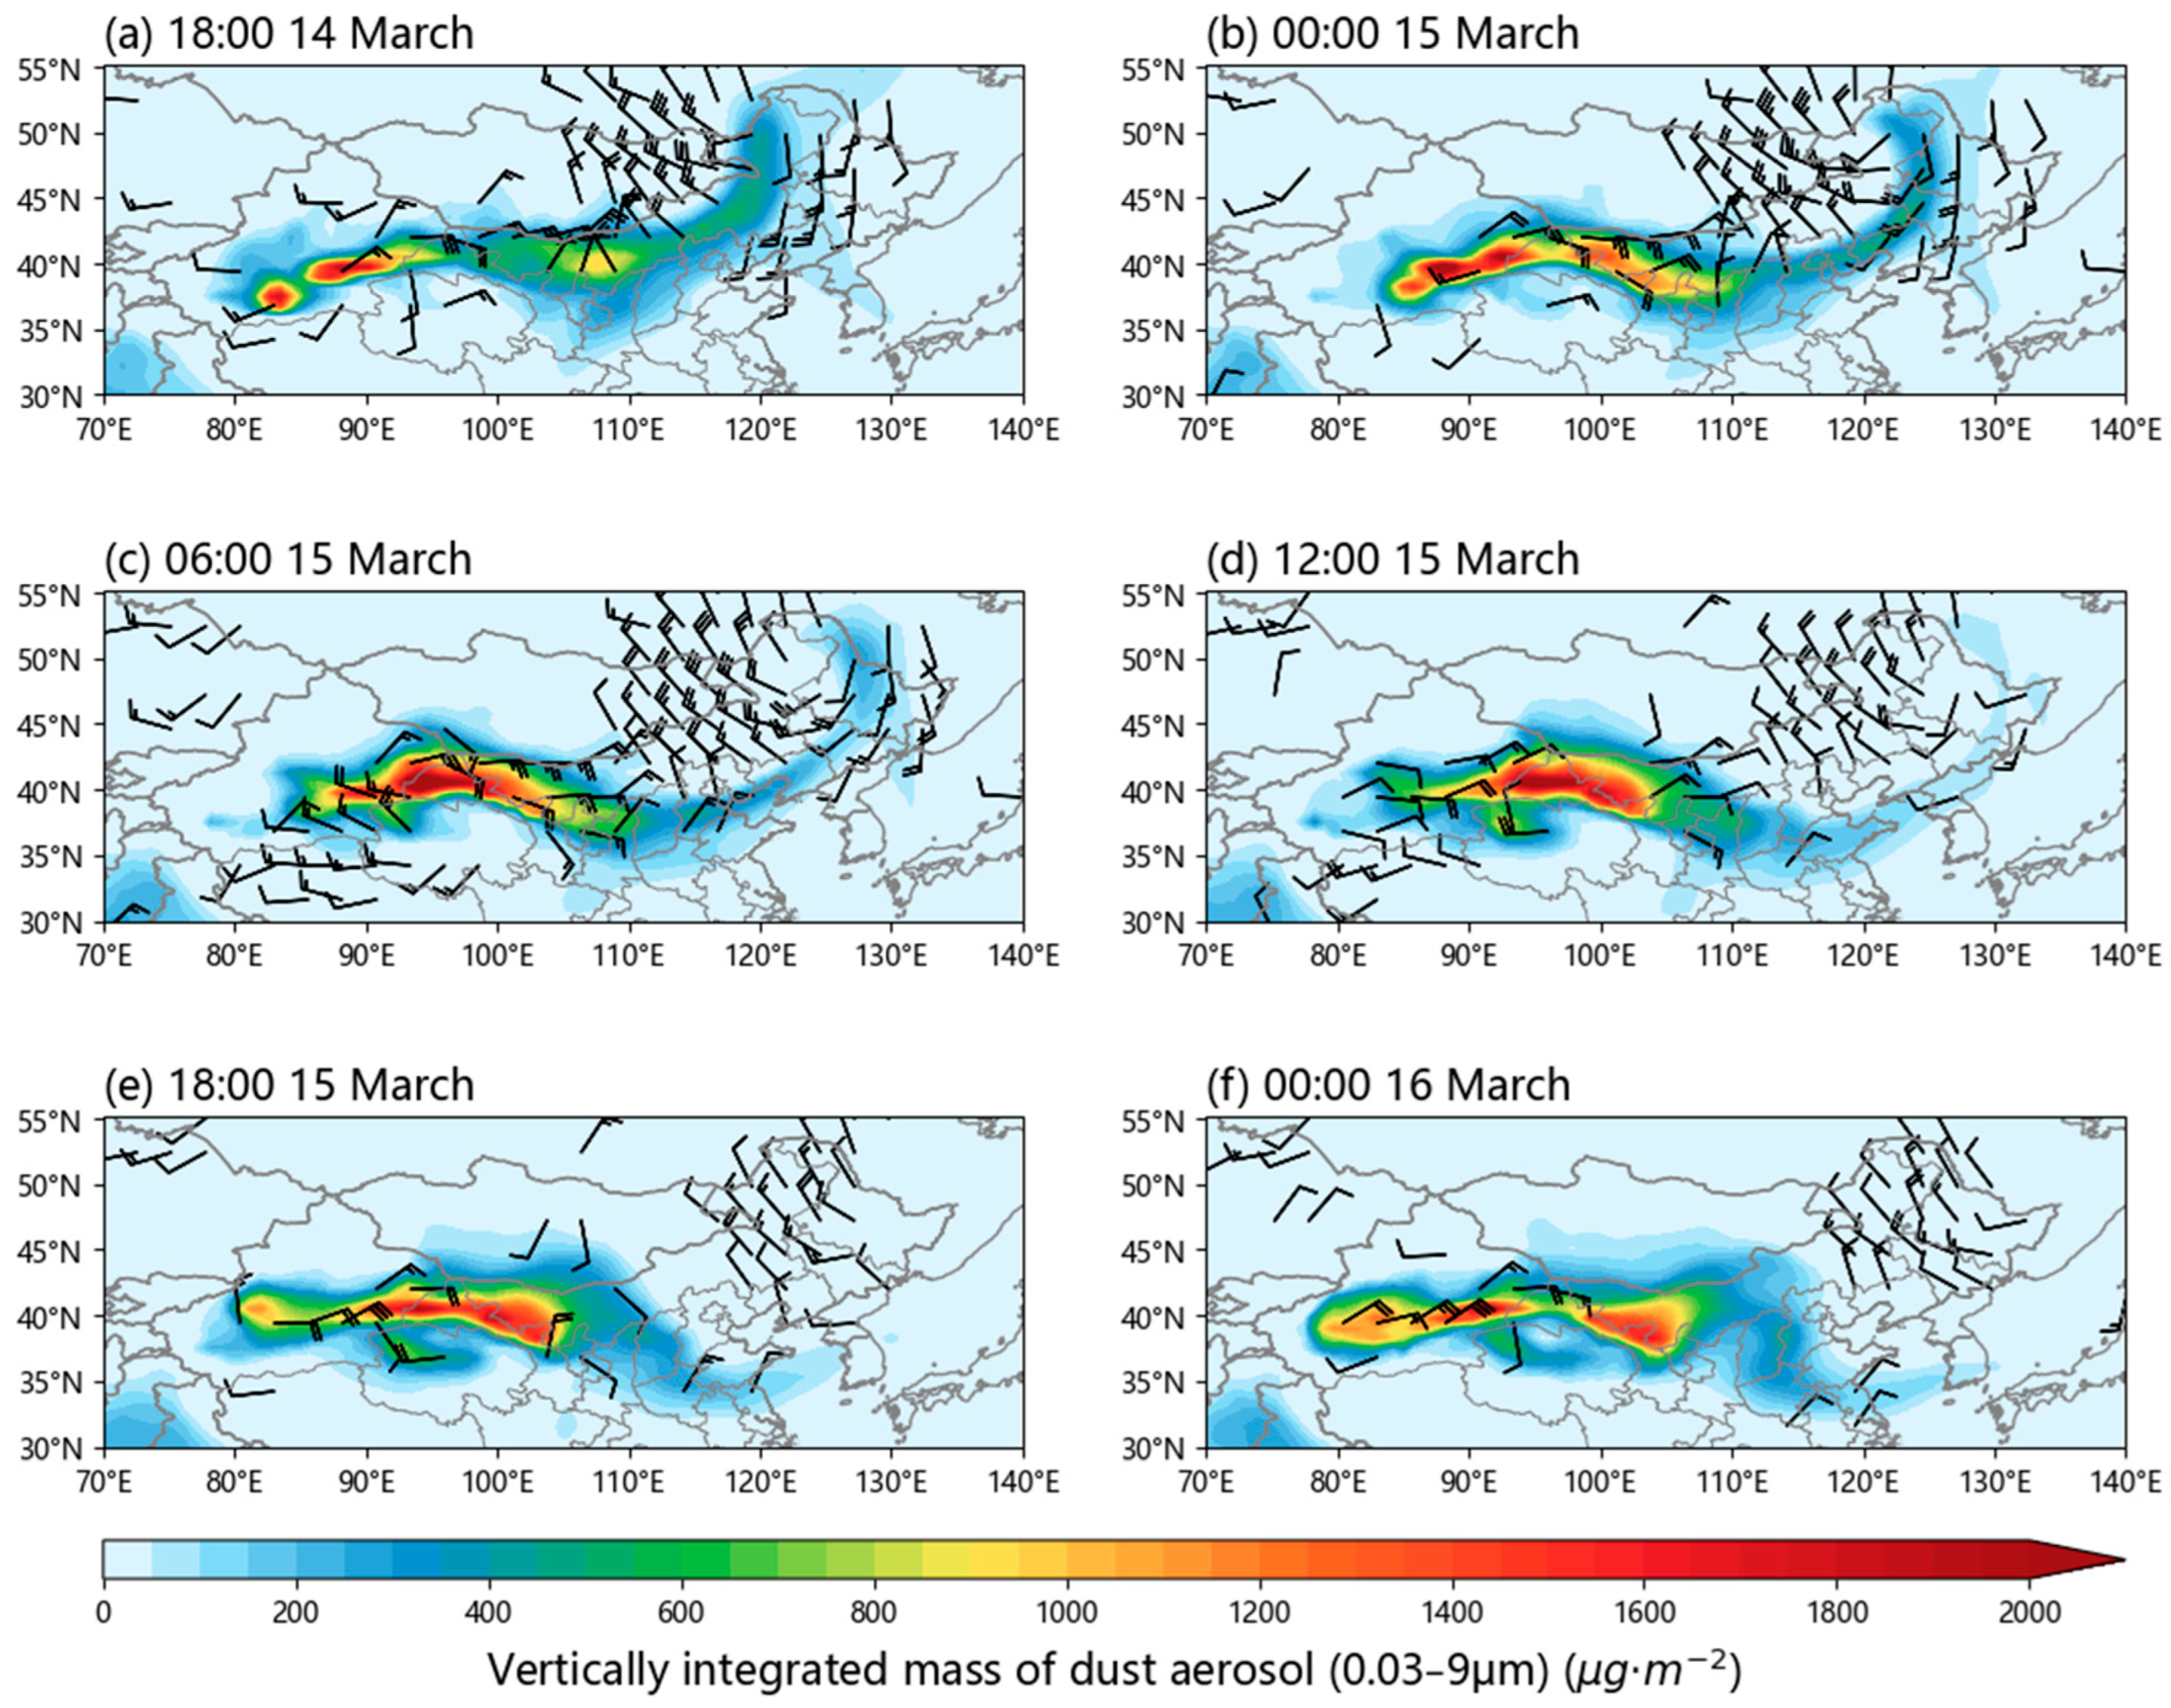
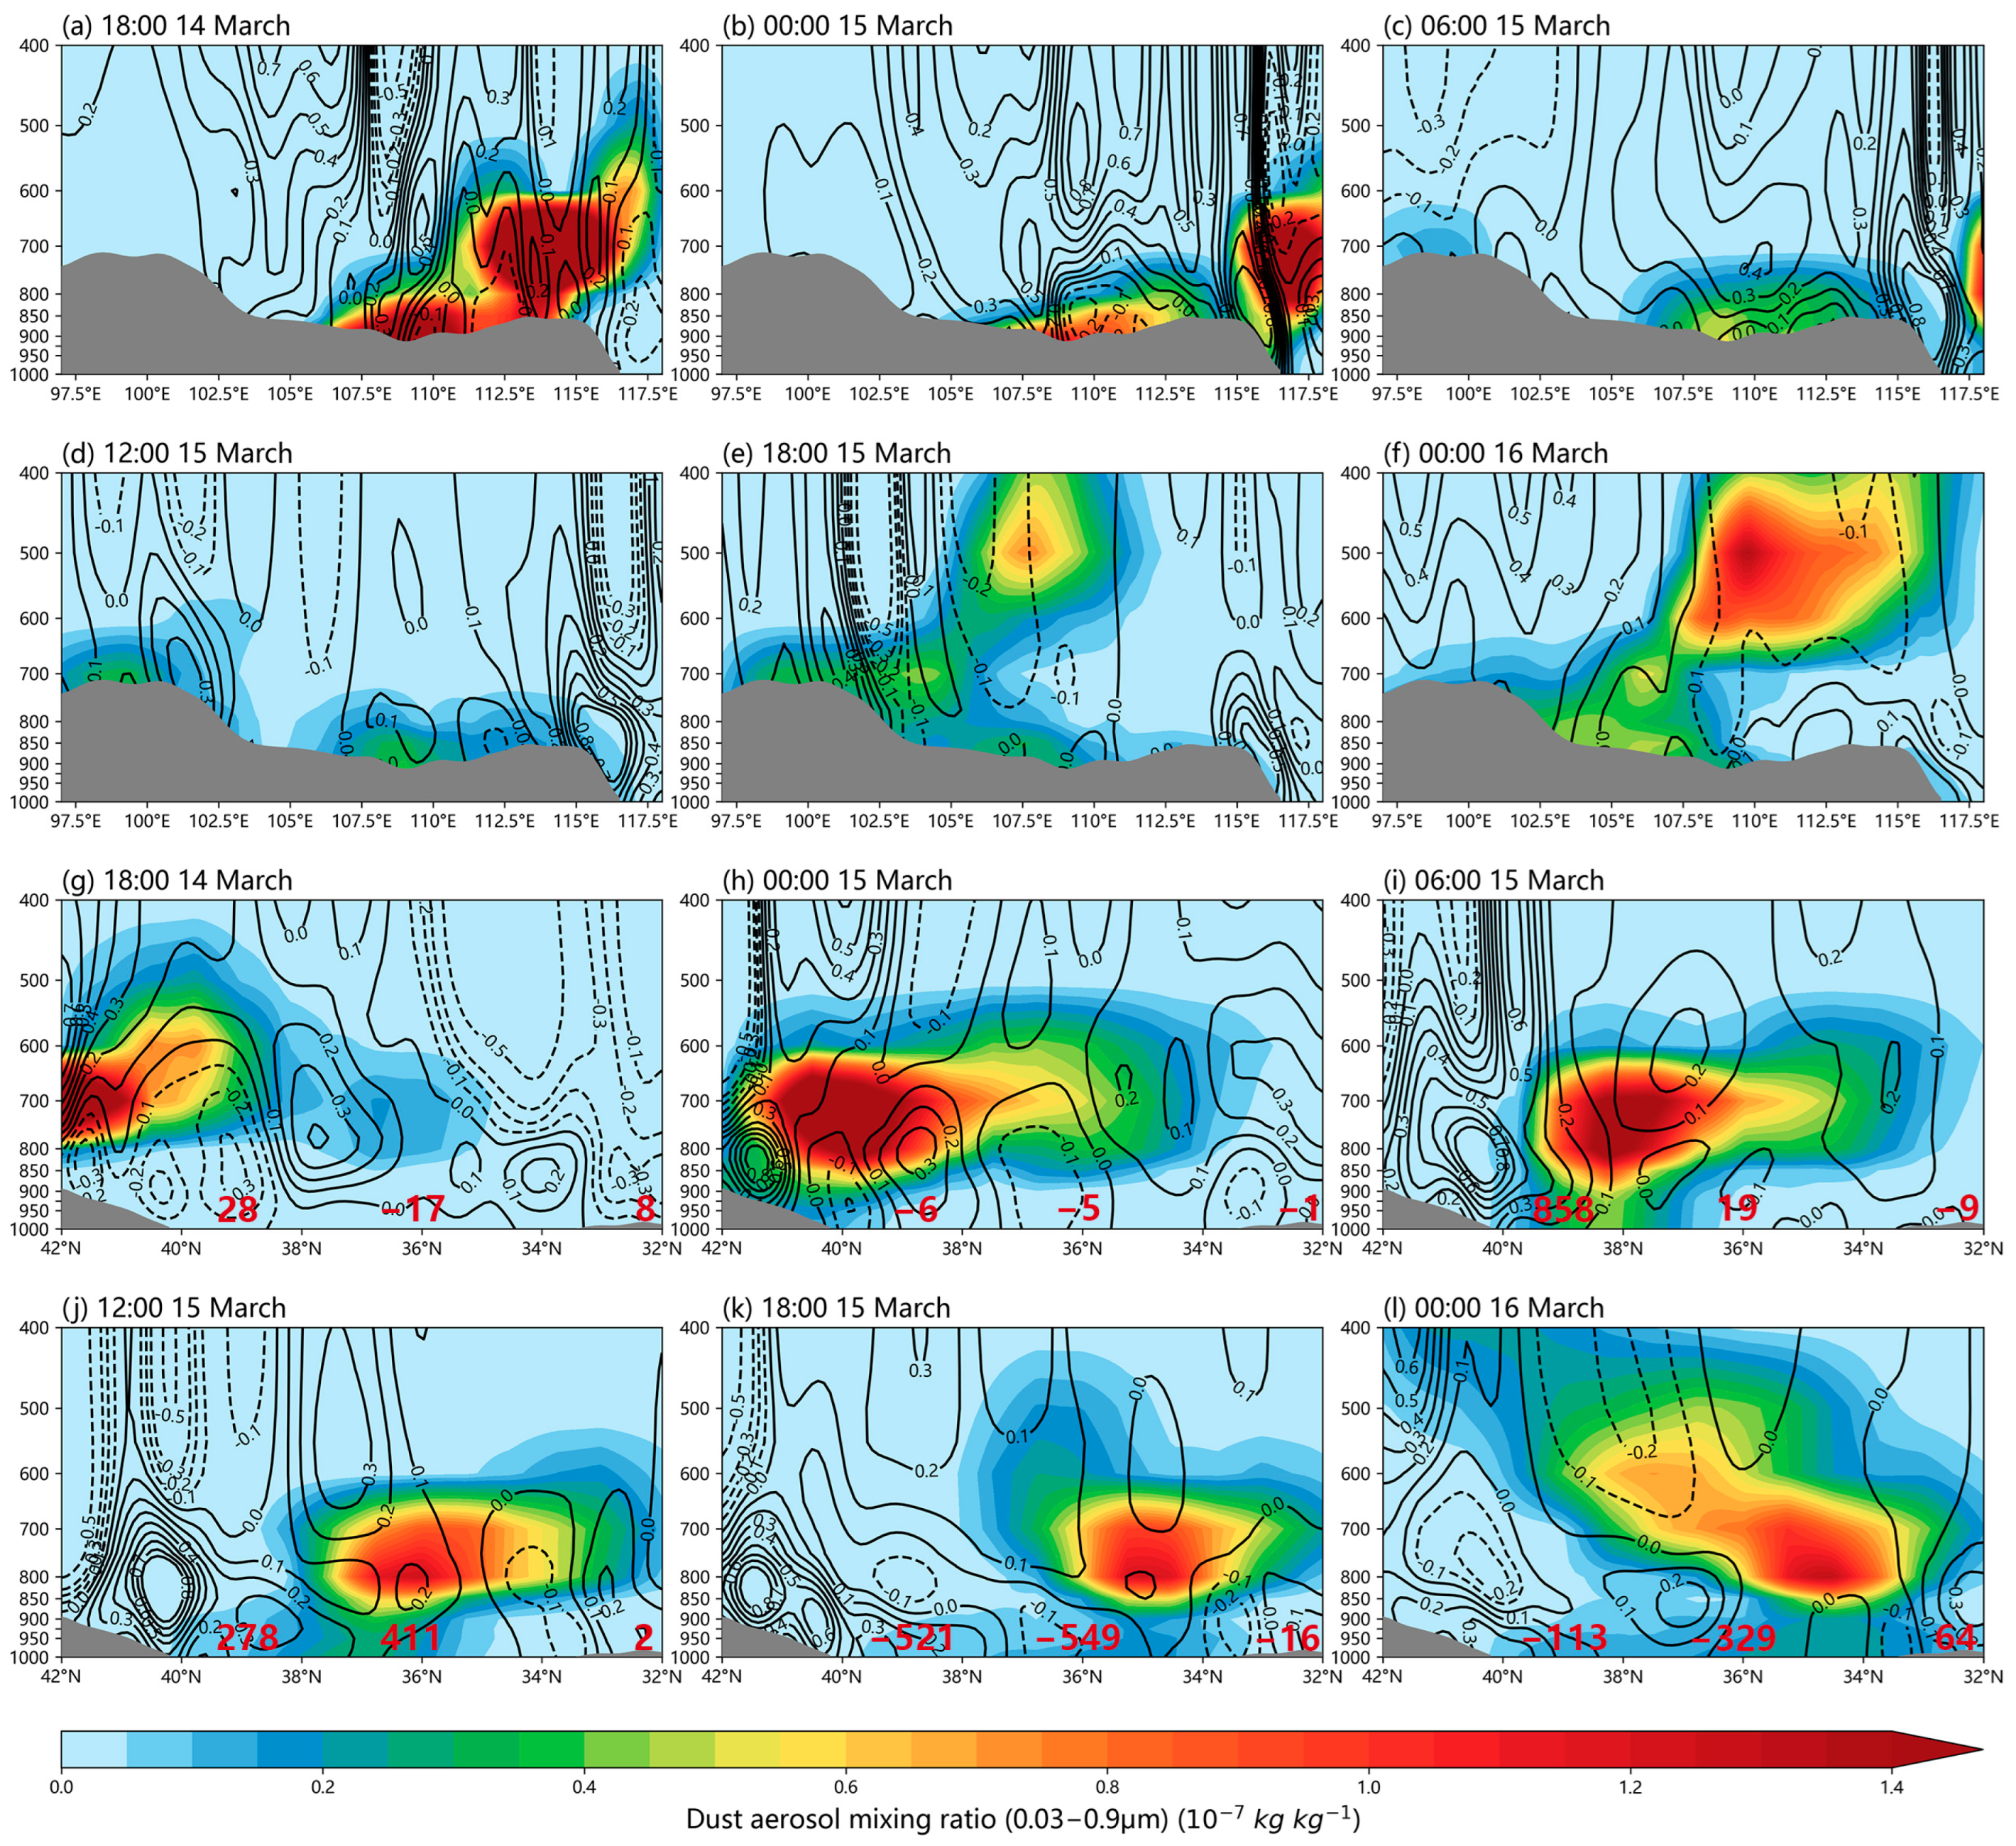
- The Gobi Desert in Mongolia is the primary source, with dust particles transported from Mongolia to northern China via the northwesterly flow behind the Mongolian cyclone. The dust event lags behind the evolution of weather systems. The Mongolian cyclone induces vertical motion in the lower atmosphere, uplifting and transporting near-surface dust particles. The dust transport displays a complex three-dimensional structure; the maximum dust intensity occurs at around 2500 m, characterized by a wide and elevated region of high values extending vertically, with some areas reaching over 4200 m.
- This dust event has a significant impact on air quality in northern China, characterized by its extensive spatial coverage, high intensity, and prolonged duration. A total of 58.8% of the monitoring sites in northern China were affected by the pollution, with 36.3% of the sites reaching severe pollution levels or higher. Furthermore, 35.9% of the sites experienced more than 12 h of pollution. With the arrival of a sandstorm, the concentration of PM10 rapidly increases; this indicates that the contribution of external dust sources to PM10 particles is dominant.
- The visibility is primarily affected by solid dust particles, especially at the northern stations, which are closer to the dust source. The increase in the PM10 concentration leads to a rapid reduction in visibility. However, the southern stations, characterized by higher moisture content, exhibit a clear inverse correlation between relative humidity and visibility, indicating a significant influence of liquid particles on visibility before the frontal passage. Subsequently, the visibility gradually improves due to the wet deposition resulting from the precipitation process.
Author Contributions
Funding
Data Availability Statement
Acknowledgments
Conflicts of Interest
References
- Han, H.; Guo, L.; Zhang, J.Q.; Zhang, K.Z.; Cui, N.B. Spatiotemporal analysis of the coordination of economic development, resource utilization, and environmental quality in the Beijing-Tianjin-Hebei urban agglomeration. Ecol. Indic. 2021, 127, 107724. [Google Scholar] [CrossRef]
- Zhao, L.; Liu, C.; Liu, X.; Liu, K.; Shi, Y. Urban spatial structural options for air pollution control in China: Evidence from provincial and municipal levels. Energy Rep. 2021, 7, 93–105. [Google Scholar] [CrossRef]
- Zhang, Q.; Meng, X.; Shi, S.; Kan, L.; Chen, R.; Kan, H. Overview of particulate air pollution and human health in China: Evidence, challenges, and opportunities. Innovation 2022, 3, 100312. [Google Scholar] [CrossRef] [PubMed]
- Wang, Z.; Hu, B.; Zhang, C.; Atkinson, P.M.; Wang, Z.; Xu, K.; Chang, J.; Fang, X.; Jiang, Y.; Shi, Z. How the Air Clean Plan and carbon mitigation measures co-benefited China in PM2.5 reduction and health from 2014 to 2020. Environ. Int. 2022, 169, 107510. [Google Scholar] [CrossRef] [PubMed]
- Zheng, Y.; Xue, T.; Zhao, H.; Lei, Y. Increasing life expectancy in China by achieving its 2025 air quality target. Environ. Sci. Ecotechnol. 2022, 12, 100203. [Google Scholar] [CrossRef] [PubMed]
- Querol, X.; Tobias, A.; Perez, N.; Karanasiou, A.; Amato, F.; Stafoggia, M.; Perez Garcia-Pando, C.; Ginoux, P.; Forastiere, F.; Gumy, S.; et al. Monitoring the impact of desert dust outbreaks for air quality for health studies. Environ. Int. 2019, 130, 104867. [Google Scholar] [CrossRef]
- Chen, S.; Huang, J.; Kang, L.; Wang, H.; Ma, X.; He, Y.; Yuan, T.; Yang, B.; Huang, Z.; Zhang, G. Emission, transport, and radiative effects of mineral dust from the Taklimakan and Gobi deserts: Comparison of measurements and model results. Atmos. Chem. Phys. 2017, 17, 2401–2421. [Google Scholar] [CrossRef] [Green Version]
- Chen, S.; Huang, J.; Li, J.; Jia, R.; Jiang, N.; Kang, L.; Ma, X.; Xie, T. Comparison of dust emissions, transport, and deposition between the Taklimakan Desert and Gobi Desert from 2007 to 2011. Sci. China Earth Sci. 2017, 60, 1338–1355. [Google Scholar] [CrossRef]
- Li, J.; Hao, X.; Liao, H.; Yue, X.; Li, H.; Long, X.; Li, N. Predominant Type of Dust Storms That Influences Air Quality Over Northern China and Future Projections. Earths Future 2022, 10, e2022EF002649. [Google Scholar] [CrossRef]
- Xu, C.; Guan, Q.; Lin, J.; Luo, H.; Yang, L.; Tan, Z.; Wang, Q.; Wang, N.; Tian, J. Spatiotemporal variations and driving factors of dust storm events in northern China based on high-temporal-resolution analysis of meteorological data (1960–2007). Environ. Pollut. 2020, 260, 114084. [Google Scholar] [CrossRef]
- Zhang, T.; Zheng, M.; Sun, X.; Chen, H.; Wang, Y.; Fan, X.; Pan, Y.; Quan, J.; Liu, J.; Wang, Y.; et al. Environmental impacts of three Asian dust events in the northern China and the northwestern Pacific in spring 2021. Sci. Total Environ. 2023, 859, 160230. [Google Scholar] [CrossRef] [PubMed]
- Zhang, W.; Zhuang, G.; Huang, K.; Li, J.; Zhang, R.; Wang, Q.; Sun, Y.; Fu, J.S.; Chen, Y.; Xu, D.; et al. Mixing and transformation of Asian dust with pollution in the two dust storms over the northern China in 2006. Atmos. Environ. 2010, 44, 3394–3403. [Google Scholar] [CrossRef]
- Tan, S.; Chen, B.; Wang, H.; Che, H.; Yu, H.; Shi, G. Variations in Aerosol Optical Properties over East Asian Dust Storm Source Regions and Their Climatic Factors during 2000–2021. Atmosphere 2022, 13, 992. [Google Scholar] [CrossRef]
- Ridley, D.A.; Heald, C.L.; Kok, J.F.; Zhao, C. An observationally constrained estimate of global dust aerosol optical depth. Atmos. Chem. Phys. 2016, 16, 15097–15117. [Google Scholar] [CrossRef] [Green Version]
- Singh, C.; Singh, S.K.; Chauhan, P.; Budakoti, S. Simulation of an extreme dust episode using WRF-CHEM based on optimal ensemble approach. Atmos. Res. 2021, 249, 105296. [Google Scholar] [CrossRef]
- Kim, K.-M.; Kim, S.-W.; Choi, M.; Kim, M.; Kim, J.; Shin, I.; Kim, J.; Chung, C.-Y.; Yeo, H.; Kim, S.-W.; et al. Modeling Asian Dust Storms Using WRF-Chem During the DRAGON-Asia Field Campaign in April 2012. J. Geophys. Res. Atmos. 2021, 126, e2021JD034793. [Google Scholar] [CrossRef]
- Akritidis, D.; Pozzer, A.; Flemming, J.; Inness, A.; Zanis, P. A Global Climatology of Tropopause Folds in CAMS and MERRA-2 Reanalyses. J. Geophys. Res. Atmos. 2021, 126, e2020JD034115. [Google Scholar] [CrossRef]
- Inness, A.; Ades, M.; Agusti-Panareda, A.; Barre, J.; Benedictow, A.; Blechschmidt, A.-M.; Dominguez, J.J.; Engelen, R.; Eskes, H.; Flemming, J.; et al. The CAMS reanalysis of atmospheric composition. Atmos. Chem. Phys. 2019, 19, 3515–3556. [Google Scholar] [CrossRef] [Green Version]
- Xie, Z.; Cheng, Z.; Bueh, C.; Yong, M.; Wu, C.; Gomboluudev, P. Pattern Transition of Dust Events over Northern China and Mongolia and Its Modulating Circulation in Spring. Sola 2022, 18, 159–166. [Google Scholar] [CrossRef]
- Chen, L.; Li, D.; Pryor, S.C. Wind speed trends over China: Quantifying the magnitude and assessing causality. Int. J. Climatol. 2013, 33, 2579–2590. [Google Scholar] [CrossRef]
- Tai, A.P.K.; Ma, P.H.L.; Chan, Y.-C.; Chow, M.-K.; Ridley, D.A.; Kok, J.F. Impacts of climate and land cover variability and trends on springtime East Asian dust emission over 1982–2010: A modeling study. Atmos. Environ. 2021, 254, 118348. [Google Scholar] [CrossRef]
- Guan, Q.; Yang, J.; Zhao, S.; Pan, B.; Liu, C.; Zhang, D.; Wu, T. Climatological analysis of dust storms in the area surrounding the Tengger Desert during 1960–2007. Clim. Dyn. 2015, 45, 903–913. [Google Scholar] [CrossRef]
- An, L.; Che, H.; Xue, M.; Zhang, T.; Wang, H.; Wang, Y.; Zhou, C.; Zhao, H.; Gui, K.; Zheng, Y.; et al. Temporal and spatial variations in sand and dust storm events in East Asia from 2007 to 2016: Relationships with surface conditions and climate change. Sci. Total Environ. 2018, 633, 452–462. [Google Scholar] [CrossRef] [PubMed]
- Wu, C.; Lin, Z.; Shao, Y.; Liu, X.; Li, Y. Drivers of recent decline in dust activity over East Asia. Nat. Commun. 2022, 13, 7105. [Google Scholar] [CrossRef] [PubMed]
- Xu, X.; Zhao, T.; Liu, F.; Gong, S.L.; Kristovich, D.; Lu, C.; Guo, Y.; Cheng, X.; Wang, Y.; Ding, G. Climate modulation of the Tibetan Plateau on haze in China. Atmos. Chem. Phys. 2016, 16, 1365–1375. [Google Scholar] [CrossRef] [Green Version]
- Yin, Z.; Wan, Y.; Zhang, Y.; Wang, H. Why super sandstorm 2021 in North China? Natl. Sci. Rev. 2022, 9, nwab165. [Google Scholar] [CrossRef]
- Severe Sand and Dust Storm Hits Asia. Available online: https://public.wmo.int/en/media/news/severe-sand-and-dust-storm-hits-asia (accessed on 16 March 2021).
- Liang, L.; Han, Z.; Li, J.; Xia, X.; Sun, Y.; Liao, H.; Liu, R.; Liang, M.; Gao, Y.; Zhang, R. Emission, transport, deposition, chemical and radiative impacts of mineral dust during severe dust storm periods in March 2021 over East Asia. Sci. Total Environ. 2022, 852, 158459. [Google Scholar] [CrossRef]
- Jin, J.; Pang, M.; Segers, A.; Han, W.; Fang, L.; Li, B.; Feng, H.; Lin, H.X.; Liao, H. Inverse modeling of the 2021 spring super dust storms in East Asia. Atmos. Chem. Phys. 2022, 22, 6393–6410. [Google Scholar] [CrossRef]
- Hersbach, H.; Bell, B.; Berrisford, P.; Hirahara, S.; Horanyi, A.; Munoz-Sabater, J.; Nicolas, J.; Peubey, C.; Radu, R.; Schepers, D.; et al. The ERA5 global reanalysis. Q. J. R. Meteorol. Soc. 2020, 146, 1999–2049. [Google Scholar] [CrossRef]
- Zhang, Z.; Zhang, X.; Gong, D.; Kim, S.J.; Mao, R.; Zhao, X. Possible influence of atmospheric circulations on winter haze pollution in the Beijing-Tianjin-Hebei region, northern China. Atmos. Chem. Phys. 2016, 16, 561–571. [Google Scholar] [CrossRef] [Green Version]
- Huang, J.; Wang, T.; Wang, W.; Li, Z.; Yan, H. Climate effects of dust aerosols over East Asian arid and semiarid regions. J. Geophys. Res. Atmos. 2014, 119, 11398–11416. [Google Scholar] [CrossRef]


| PM10_24 h (µg m−3) | Pollution Level | Num | Proportion | Num_12 h | Proportion_12 h |
|---|---|---|---|---|---|
| 0–150 | No pollution | 101 | 41.2% | 0 | 0 |
| 151–250 | Lower | 35 | 14.3% | 26 | 10.6% |
| 251–350 | Medium | 20 | 8.2% | 13 | 5.3% |
| 351–420 | Severe | 12 | 4.9% | 9 | 3.7% |
| >420 | Serious | 77 | 31.4% | 40 | 16.3% |
| Total | 245 | 100% | 88 | 35.9% |
Disclaimer/Publisher’s Note: The statements, opinions and data contained in all publications are solely those of the individual author(s) and contributor(s) and not of MDPI and/or the editor(s). MDPI and/or the editor(s) disclaim responsibility for any injury to people or property resulting from any ideas, methods, instructions or products referred to in the content. |
© 2023 by the authors. Licensee MDPI, Basel, Switzerland. This article is an open access article distributed under the terms and conditions of the Creative Commons Attribution (CC BY) license (https://creativecommons.org/licenses/by/4.0/).
Share and Cite
Liu, X.; Zhang, Y.; Yao, H.; Lian, Q.; Xu, J. Analysis of the Severe Dust Process and Its Impact on Air Quality in Northern China. Atmosphere 2023, 14, 1071. https://doi.org/10.3390/atmos14071071
Liu X, Zhang Y, Yao H, Lian Q, Xu J. Analysis of the Severe Dust Process and Its Impact on Air Quality in Northern China. Atmosphere. 2023; 14(7):1071. https://doi.org/10.3390/atmos14071071
Chicago/Turabian StyleLiu, Xiaoyu, Yu Zhang, Hailan Yao, Qinlai Lian, and Jianjun Xu. 2023. "Analysis of the Severe Dust Process and Its Impact on Air Quality in Northern China" Atmosphere 14, no. 7: 1071. https://doi.org/10.3390/atmos14071071