1. Introduction
The wind-induced vibration of super high-rise buildings may be very significant, especially for the vibration caused by vortexes in the cross-wind direction. As is known, aeroelastic effects play an important role in determining the cross-wind responses of high-rise buildings. There have been many studies on the cross-wind aeroelastic effects of high-rise buildings and flexible structures [
1,
2,
3,
4,
5,
6,
7,
8,
9,
10,
11,
12,
13,
14,
15]. Most of these previous studies on aeroelastic effects have focused on buildings with a circular or rectangular cross-section, but few studies have investigated buildings with a hexagonal cross-section. In fact, more and more tall buildings with hexagonal cross-sections have been built in the past decades [
16]. In view of this, it is necessary to systematically investigate the cross-wind aeroelastic effects of hexagonal tall buildings to ensure that they perform well under strong wind.
From the existing research, aerodynamic forces on hexagonal tall buildings have been researched by some researchers. Steckley et al. carried out a high-frequency force balance experiment in a wind tunnel and studied the base moment of the hexagonal tall building [
17]. Tanaka et al. studied the wind forces on rigid models of hexagonal tall buildings based on the wind tunnel tests of the synchronous pressure model [
18]. Kim et al. studied the bending moment and response of hexagonal tall buildings in a wind tunnel [
19]. Wang et al. conducted a series of wind tunnel tests of synchronous pressure models to study the wind force of tall buildings with a hexagonal section, and the empirical formulae of wind force were proposed [
20].
As is well known, aerodynamic forces alone are not sufficient to accurately estimate wind-induced structural responses because of the aeroelastic effects on tall buildings. As the geometry of buildings with a hexagonal cross-section is different from that of a building with a square or circular cross-section, the wind flow around a hexagonal building differs from that around a rectangular or a circular building, and so do aeroelastic effects. In other words, the results of the cross-wind aeroelastic effects for a rectangular or a circular building cannot be directly applied to hexagonal buildings.
This study will investigate the cross-wind aeroelastic effects of hexagonal tall buildings in terms of cross-wind responses and the aerodynamic damping ratio. The multiple-degree-of-freedom (MDOF) aeroelastic model of hexagonal tall buildings is fabricated and then a series of wind tunnel tests are conducted on them to acquire the cross-wind responses for the two representative wind directions determined by wind pressure measurements on the rigid model for a series of wind directions. Meanwhile, the measured response is used to identify the associated aerodynamic damping ratio by making use of the random decrement technique (RDT). The dynamic responses and damping ratios for the two representative wind directions are then discussed in detail. Two expressions for the cross-wind aerodynamic damping ratio are established for the two directions, which can provide guidance for estimating the cross-wind aerodynamic ratios of tall buildings with a hexagonal cross-section.
2. Wind Tunnel Tests
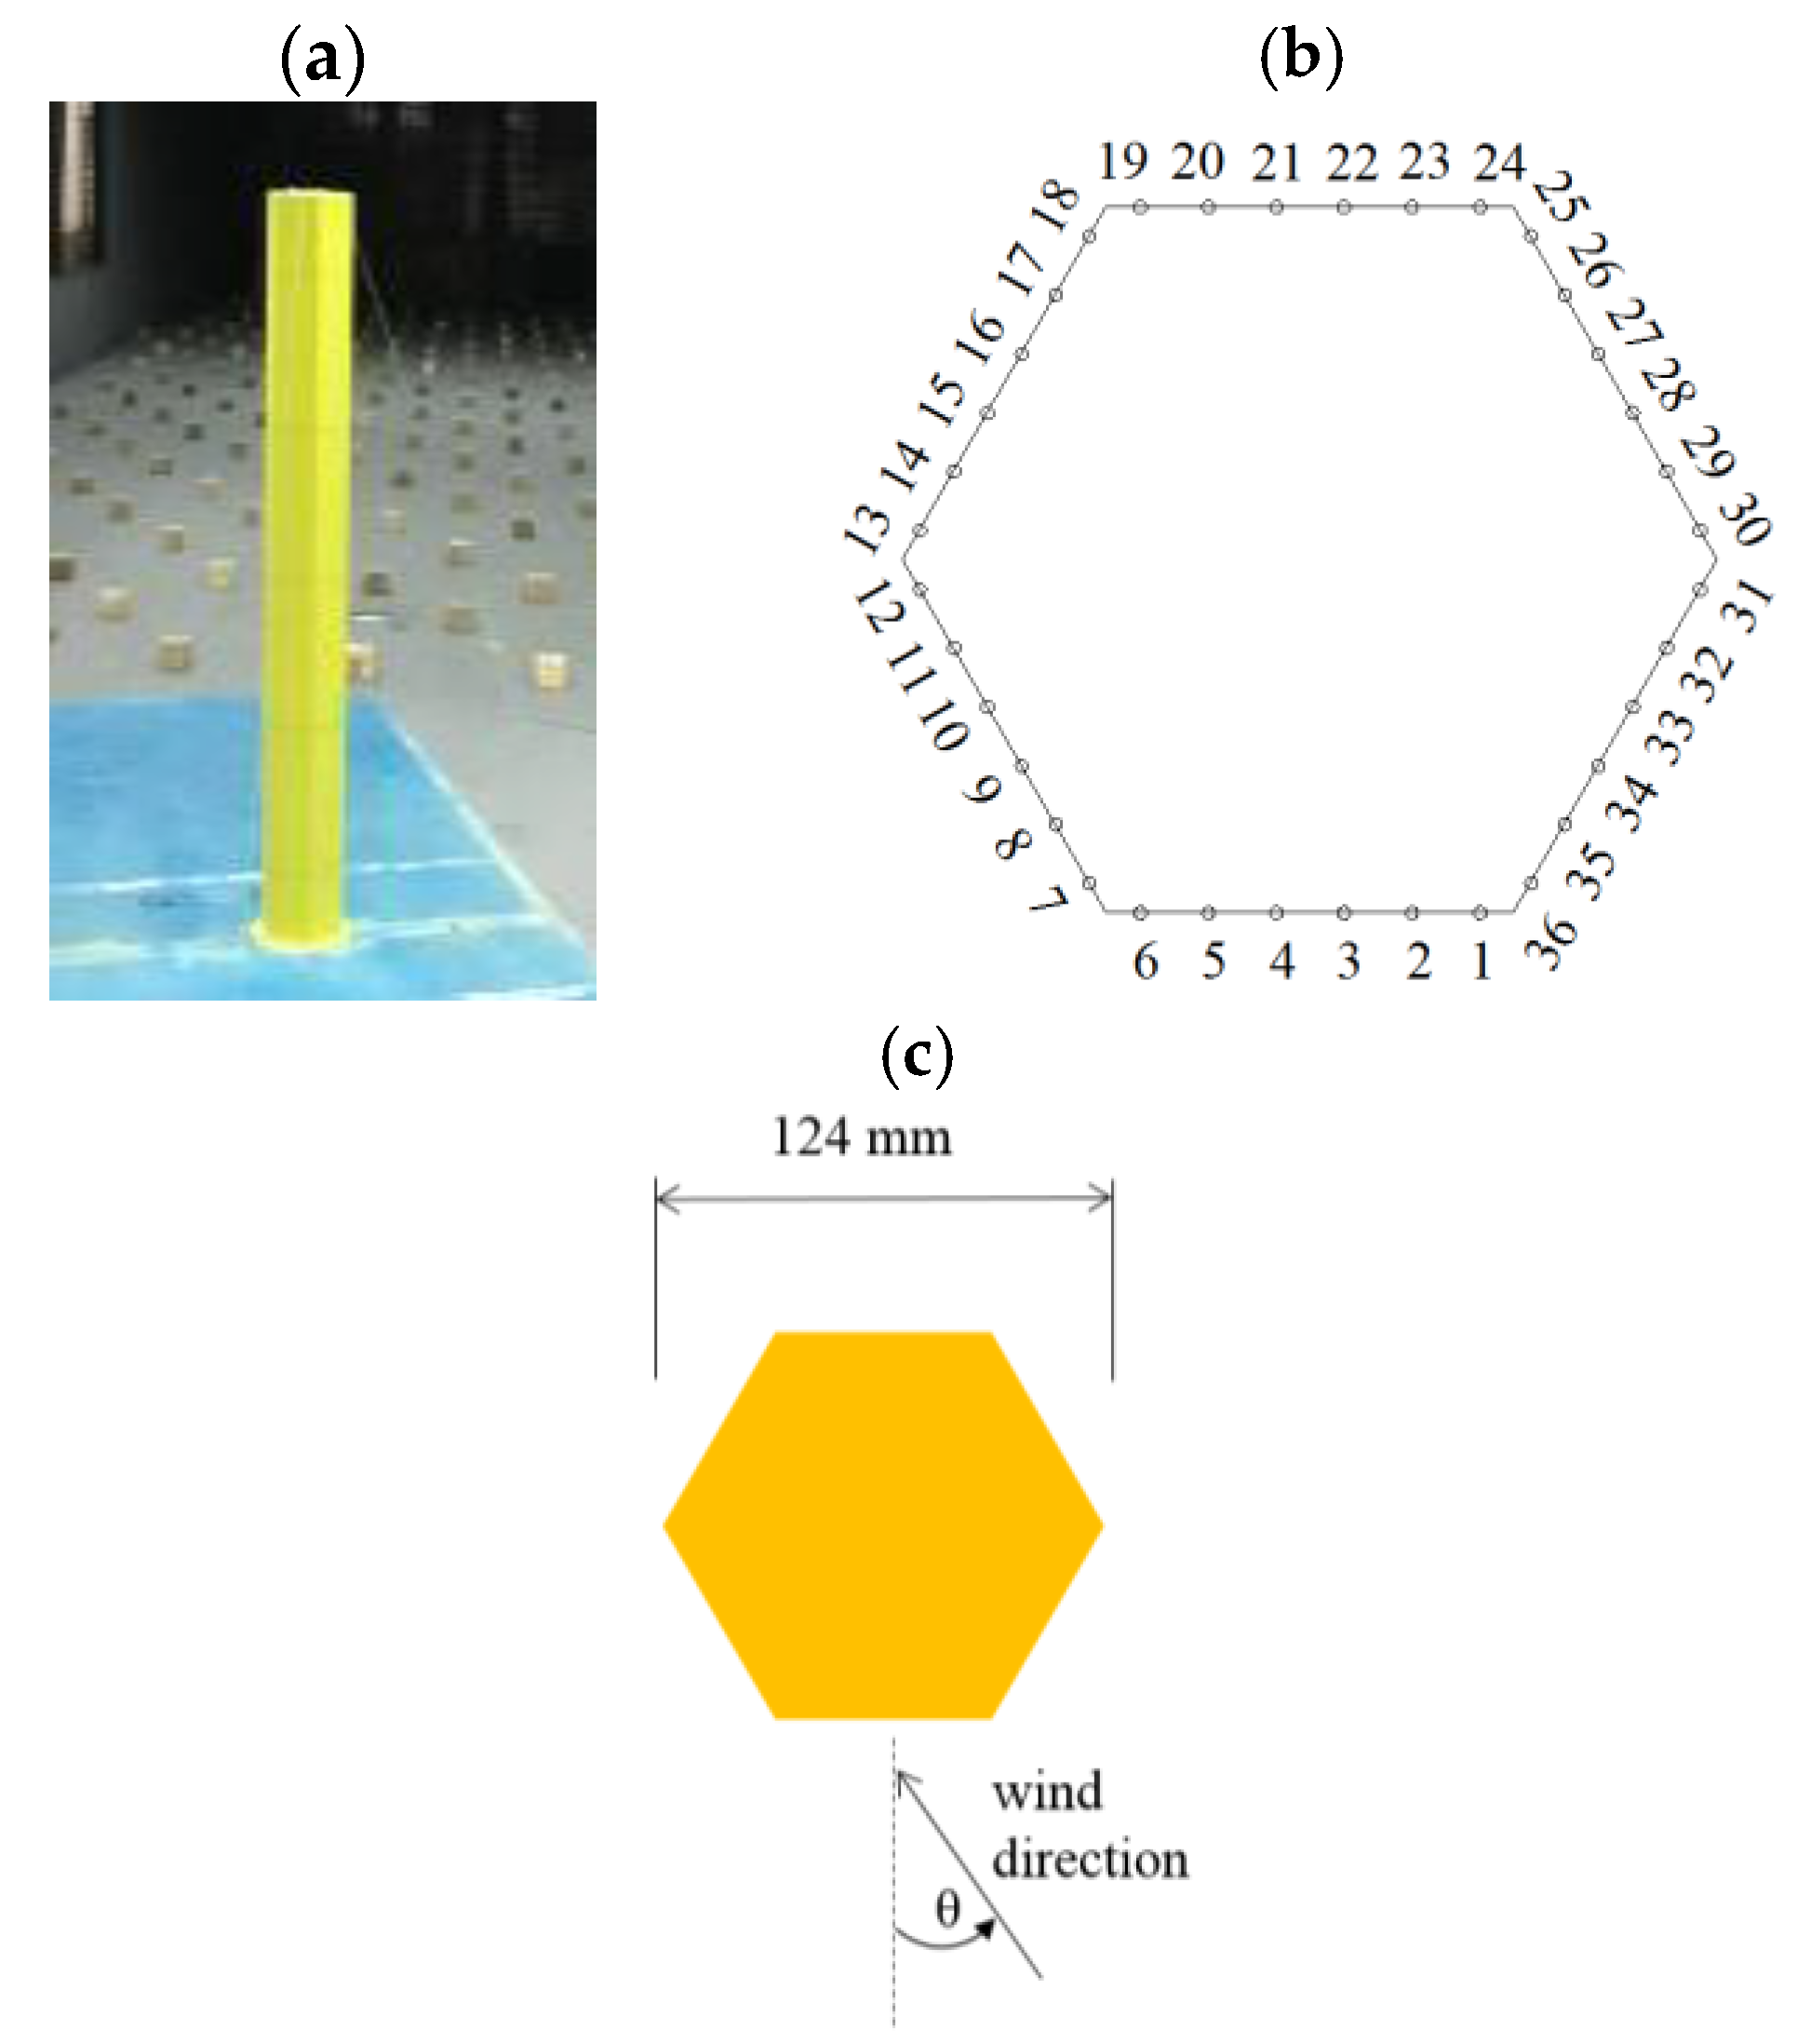
A building with a height of 600 m at the prototype scale and an aspect ratio of 10 was considered to represent a typical tall building with a hexagonal cross-section. All tests were carried out in the WD-1 boundary layer wind tunnel at Wuhan University, China. Considering the test operation and block ratio of the wind tunnel, a length scale of 1:600 was used for all of the models. As a result, the height of the building at the model scale was 1 m, and the distance between the two opposite vertexes of the hexagonal model was 124 mm.
2.1. Pressure Measurement on Rigid Model
Before conducting the aeroelastic model wind tunnel test, a synchronous pressure measurement wind test was carried out on a rigid model of the hexagonal building (shown in
Figure 1a) to obtain a general understanding of the aerodynamic forces on the building. Six levels of pressure taps were equally distributed along the model’s height. Each level has 36 taps equally distributed around the perimeter of the cross-section (shown in
Figure 1b). The definition of wind direction is shown in
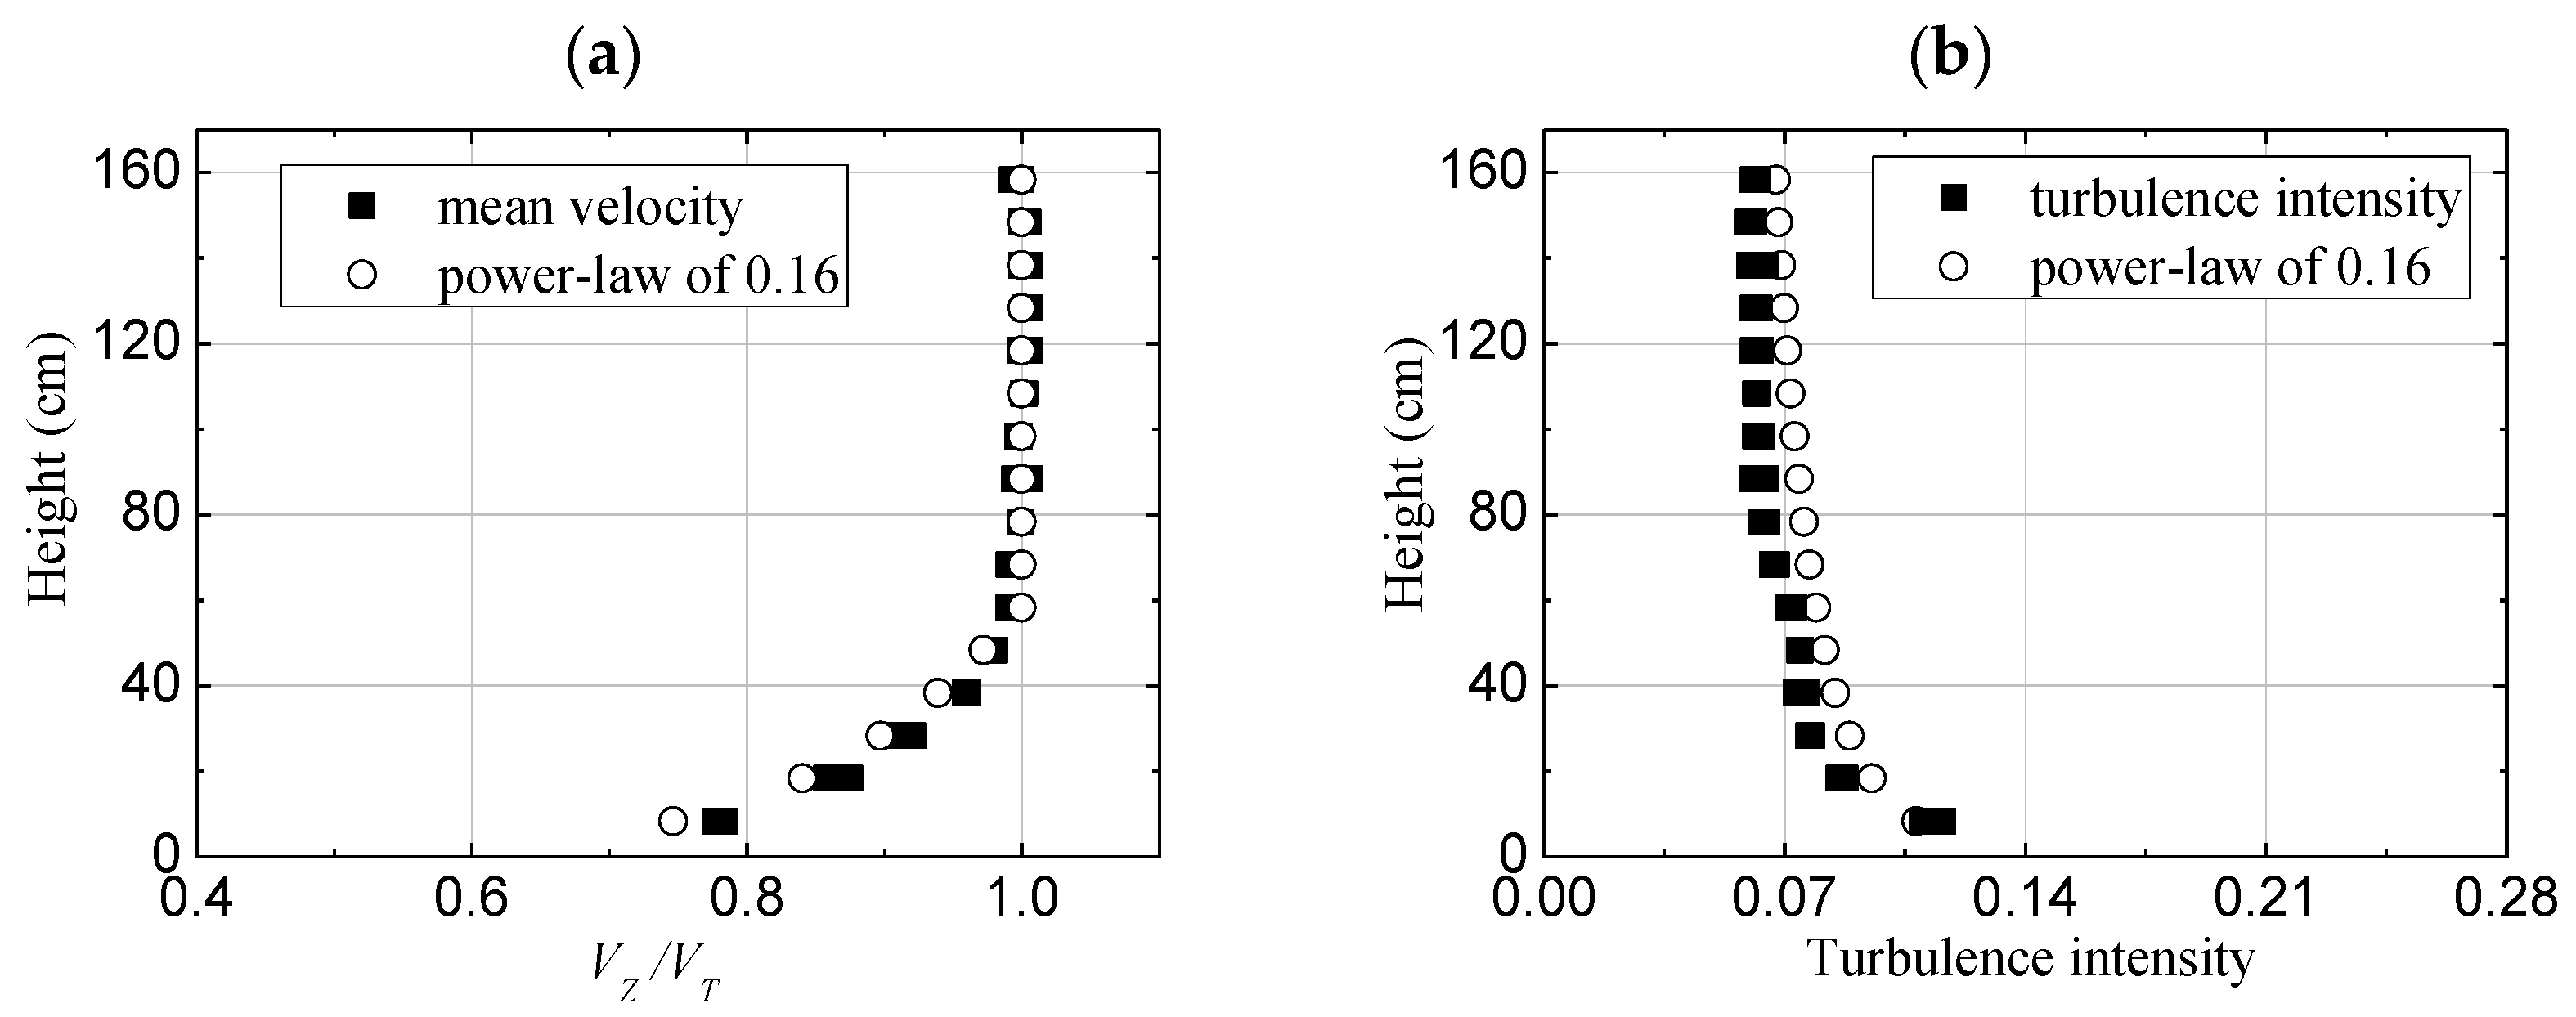
Figure 1c. Considering the symmetry of the model’s cross-section, only wind directions from 0° to 30° (including seven wind direction cases: 0°, 5°, 10°, 15°, 20°, 25° and 30°) were considered in the pressure measurement wind tunnel test. The simulated wind field in the wind tunnel was terrain category B of the Chinese code [
21] with an exponent of 0.15. The simulated results of mean wind speed and turbulence intensity profiles in the wind tunnel are illustrated in
Figure 2.
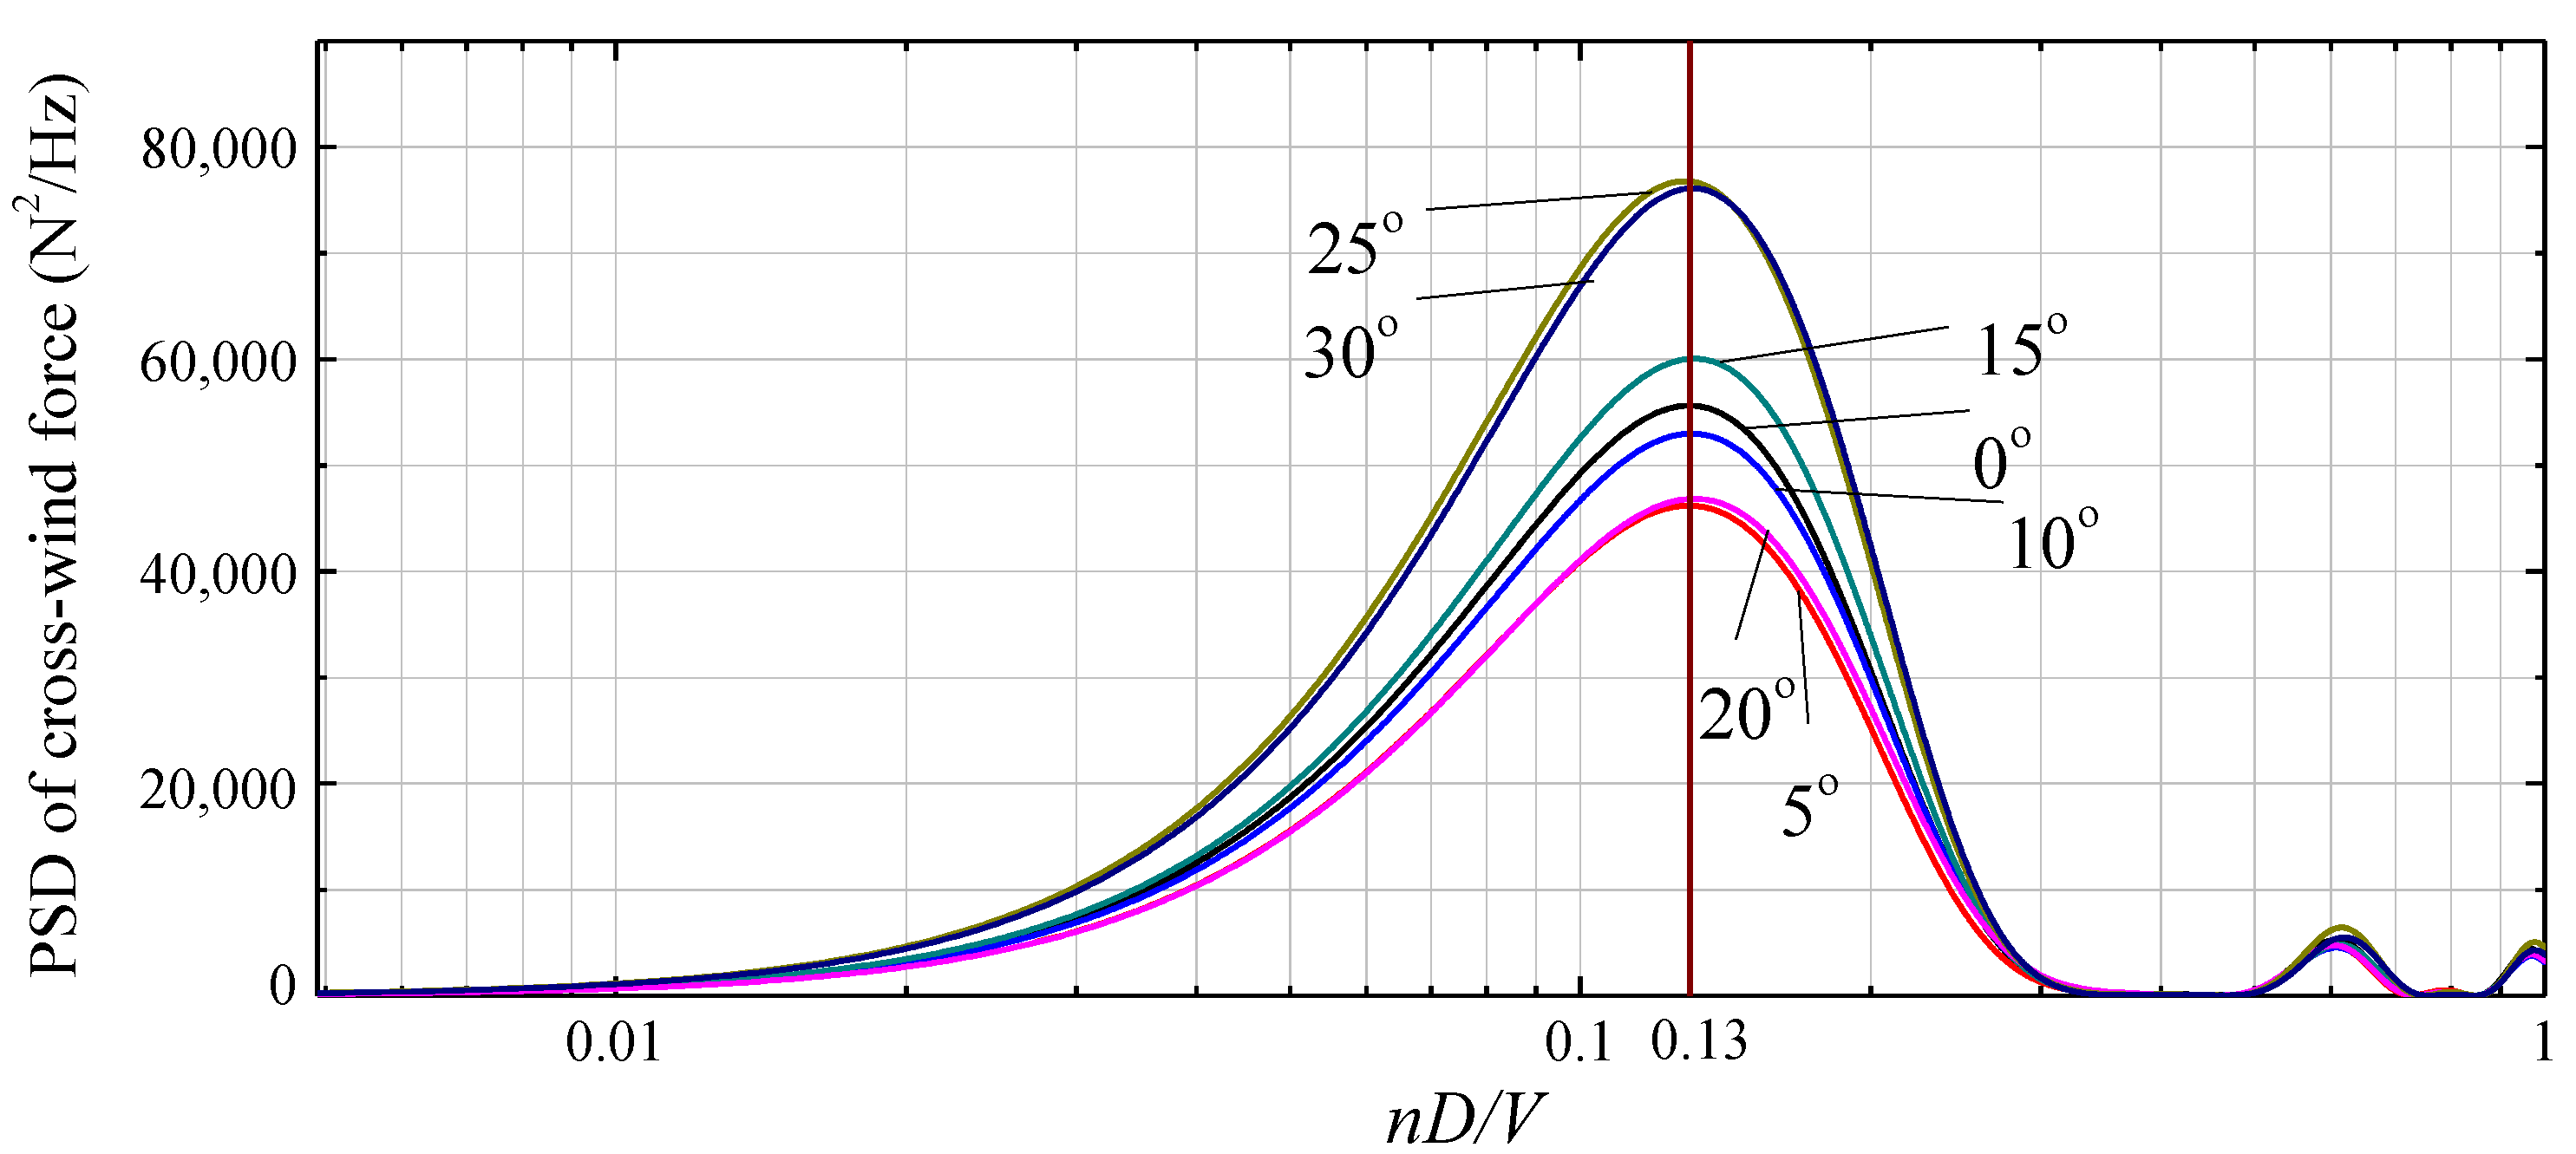
Making use of pressure data measured using the wind tunnel test on the rigid model, aerodynamic cross-wind forces on the building model can be determined. Power spectral densities (PSDs) of the cross-wind forces at the same wind speed are shown in
Figure 3 for all of the test wind directions. As can be seen, PSDs of cross-wind forces for wind directions
θ = 25° and 30° are relatively large. As is known, significant vortex-induced vibrations are more likely to occur when the wind load is large, especially when the building is symmetrical about the wind direction. The wind load of 30° direction is very large and the building is symmetrical about this wind direction, so this direction was selected as a representative wind direction. The building is also symmetrical about a 0° direction, so this direction was also selected as a representative wind direction, although the wind load of this direction is not very large.
2.2. Aeroelastic Model Test
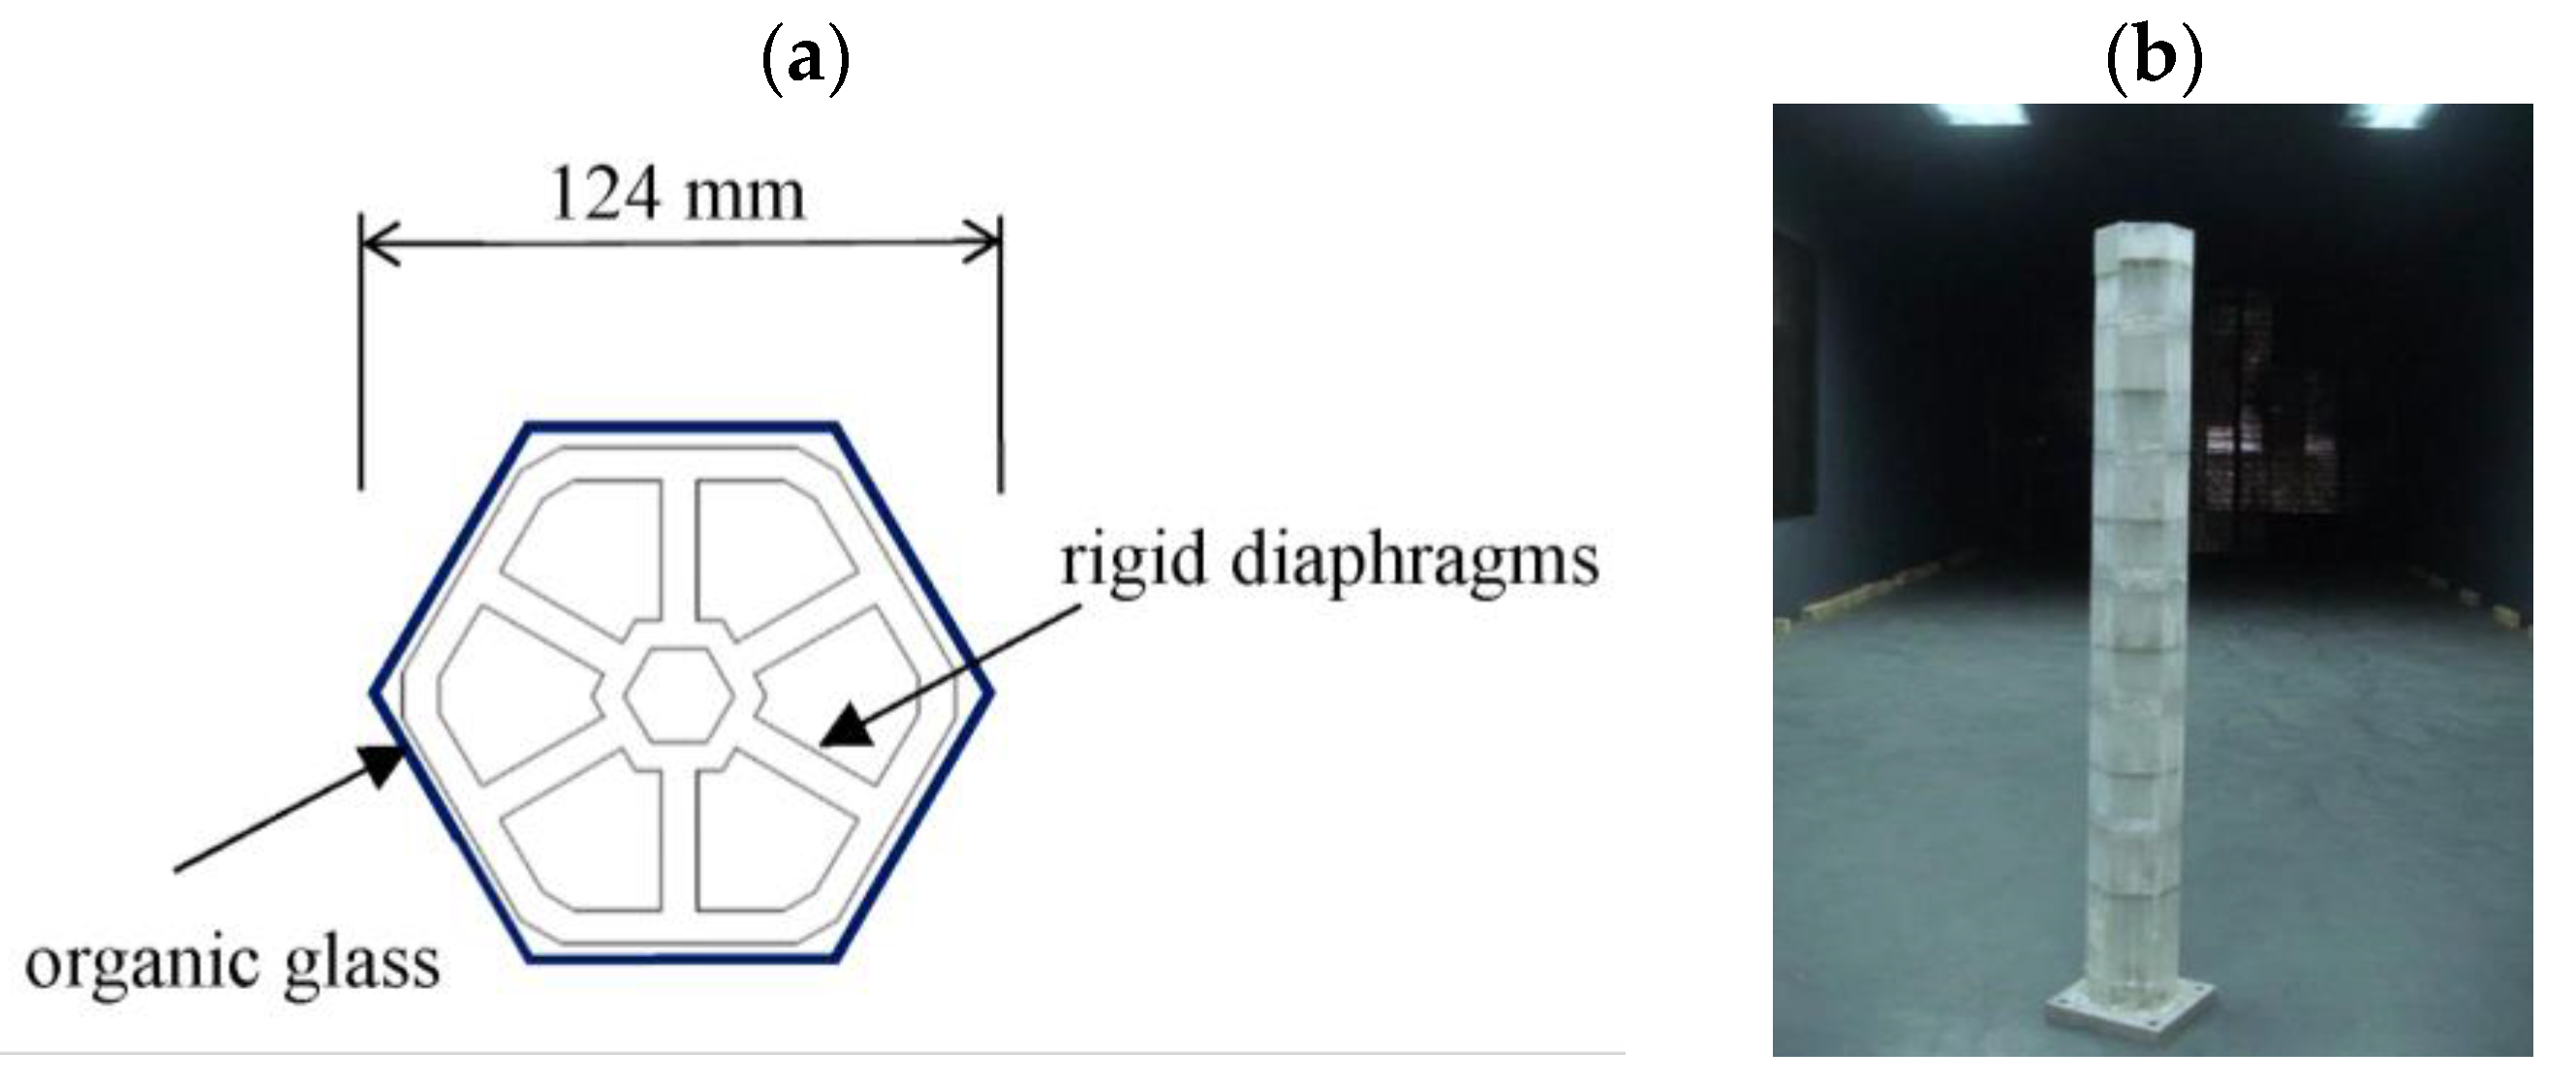
The aeroelastic model with MDOF was fabricated for the hexagonal building with a length scale of 1:600. The skeleton of the MDOF model was made of aluminum alloy 6061. As shown in
Figure 4, there were six rigid plates equally distributed along the height, which represent six degrees of freedom. An aluminum column passed through the center of the six rigid plates and bonded together, representing the elastic and deformation properties of the model. The outer coating of the model was made of organic glass to simulate the building shape.
By adjusting the parameters of the above MDOF model, different test cases could be achieved. The mass of the model was adjusted by sticking copper blocks on rigid plates. The damping ratio of the model was adjusted by setting light foam strips between the rigid plates. These detailed processes can be found in the related papers of the authors [
22,
23,
24]. Eight test cases with different structural properties were adjusted by this MDOF model, as listed in
Table 1. The frequencies in
Table 1 are the first natural frequency of each test case, with a frequency scale ratio of about 100:1. The displacement response of the MDOF model was measured using a laser displacement meter, and the acceleration response was measured using an acceleration transducer.
The calculation formula of the equivalent mass
M in
Table 1 is:
The calculation formula of the
Sc number in
Table 1 is:
where
m(
z) is the mass per unit length,
ϕ(
z) is the mode shape of the aeroelastic model,
H is the total height;
ξs is the structural damping ratio,
ρa is the air density, and
S is the cross-section area of the MDOF model.
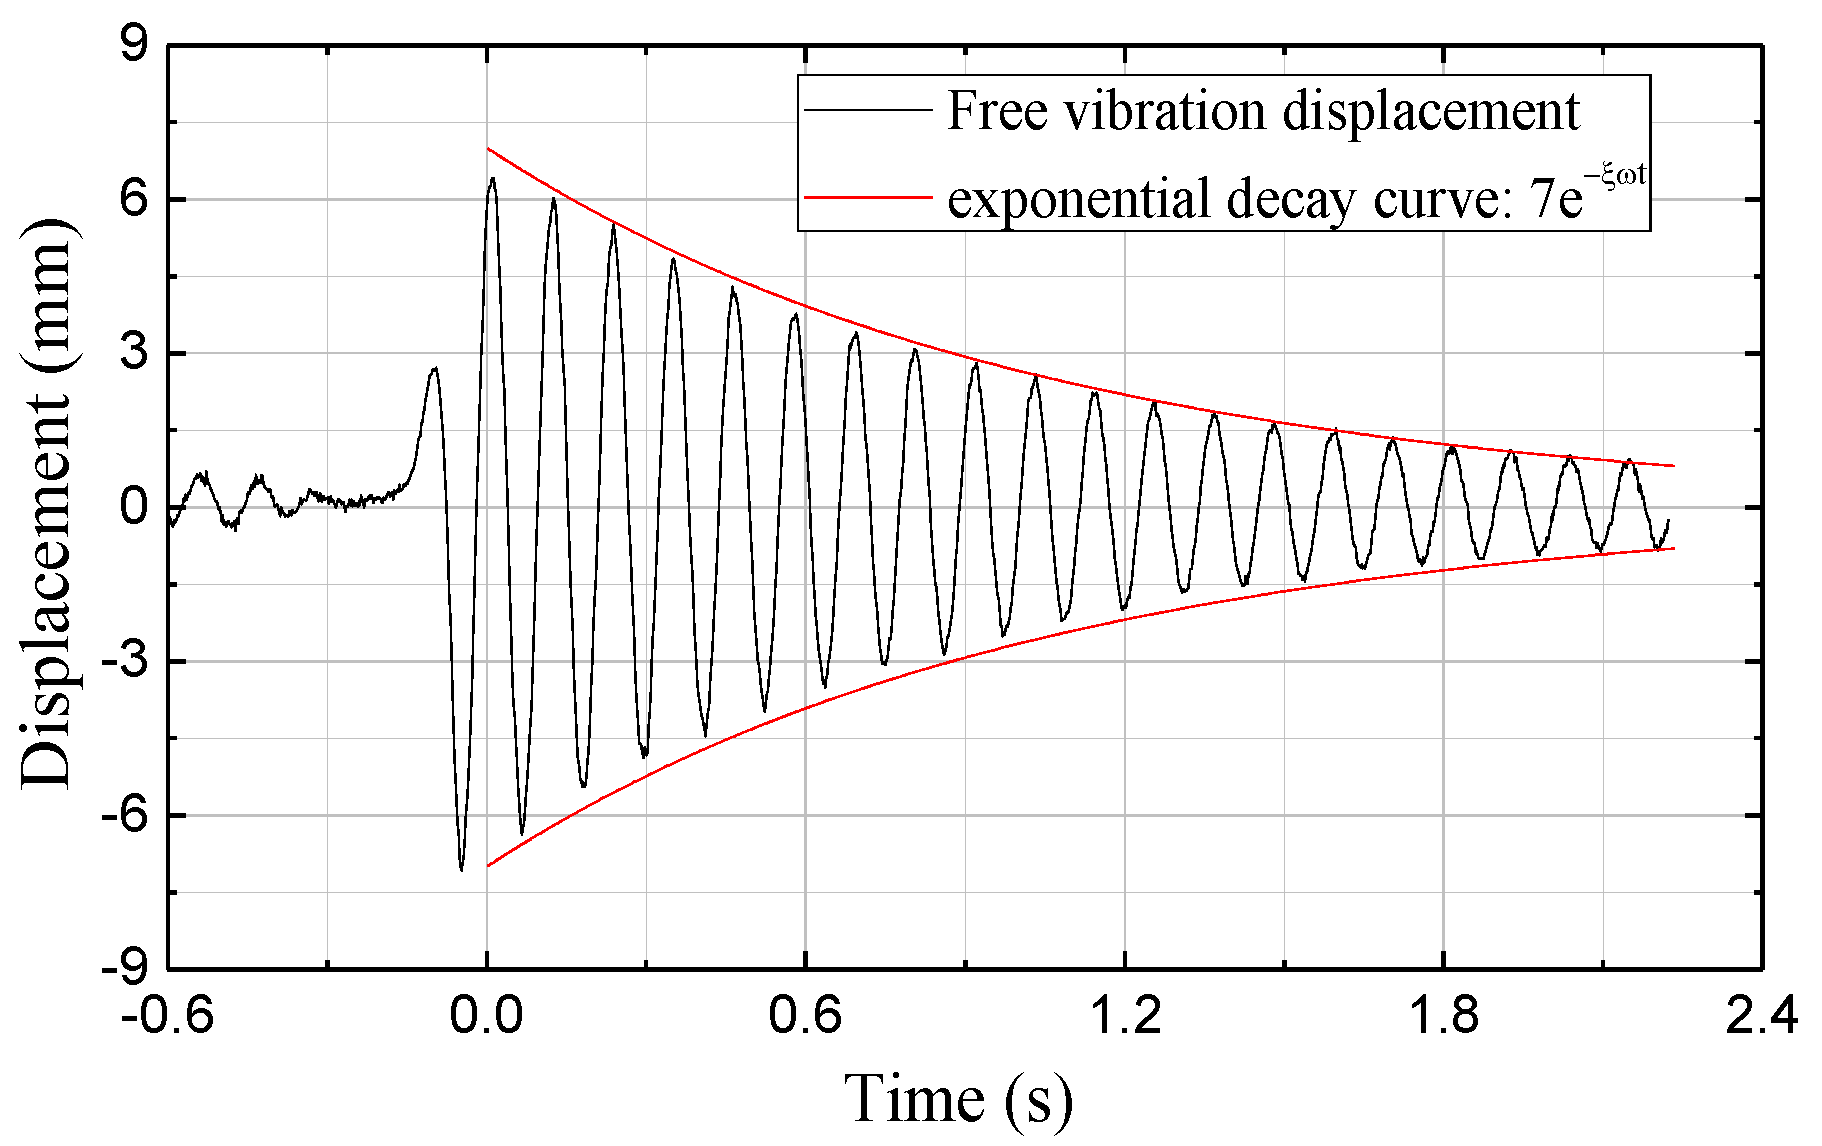
The damping ratio was identified using the free vibration test. Taking case 5 as an example, fix the MDOF model on the wind tunnel ground first and then knock the top of the MDOF model, the model will exhibit free vibration, and the free vibration attenuation curve can be obtained using a laser displacement meter, which is shown in
Figure 5. According to the free vibration results of
Figure 5, the damping ratio of the MDOF model can be identified.
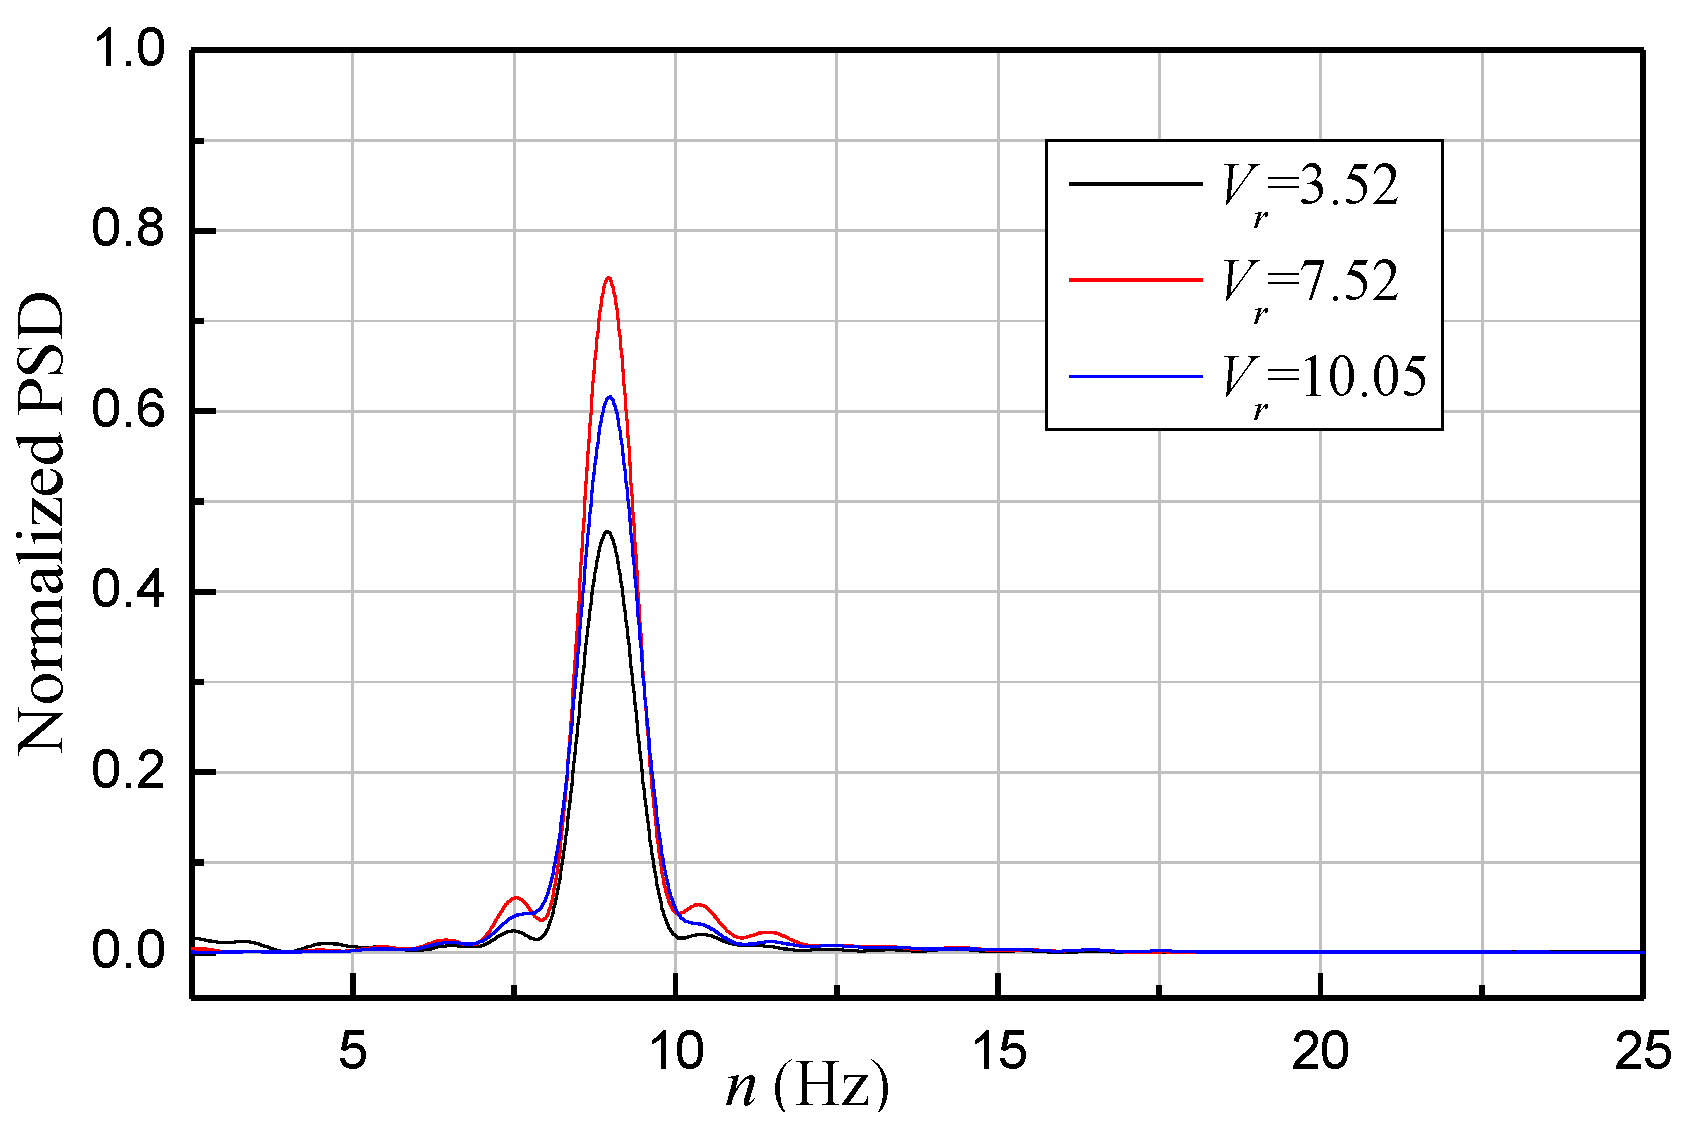
The power spectral densities of the wind-induced structural acceleration responses of the model are shown in
Figure 6 for three different wind speeds. As can be seen, all three curves of the PSD for different wind speeds present one clear peak, which is only the first frequency of the model, indicating that the wind-induced vibration is dominated by the first-order vibration. According to the location of the PSD peak, the frequency of the MDOF model can be identified.
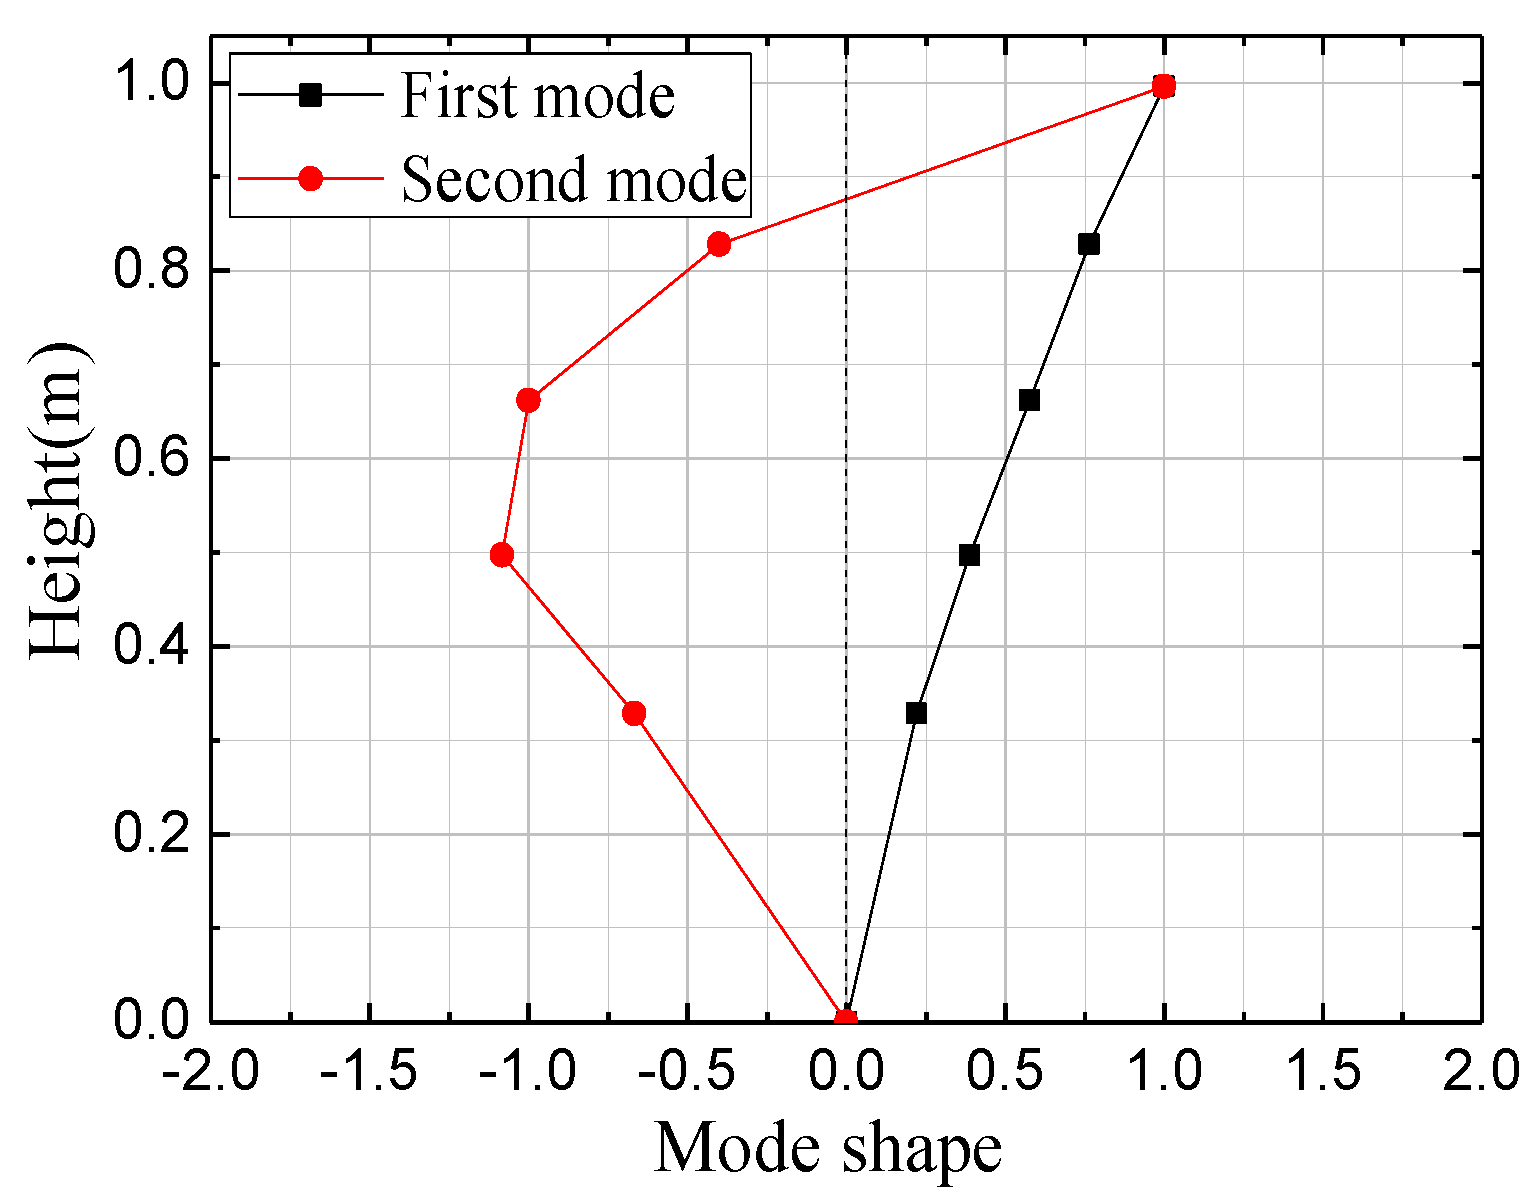
The mode shapes were determined according to the coherence between vibration responses at different heights. The identified mode shapes for case 5 are shown in
Figure 7.
3. Cross-Wind Responses of the Hexagonal Aeroelastic Models
After identifying the dynamic properties of each case, the aeroelastic wind tunnel test was conducted. The cross-wind displacement and acceleration responses at the top of each model were measured by a laser displacement meter and an acceleration sensor, respectively. As discussed in
Section 2.1, only two representative wind directions
θ = 0° and 30° were considered for the aeroelastic wind tunnel test: one was a vertex of the hexagonal cross-section against the approaching wind (i.e., wind direction I,
θ = 30°), and the other was a face of the hexagonal cross-section perpendicular to the approaching wind (i.e., wind direction II,
θ = 0°), as illustrated in
Figure 8.
3.1. When a Vertex Is against the Approaching Wind (Direction I)
The cross-wind displacement responses at the top of the first four models (i.e., cases 1 to 4 in
Table 1) are examined when a vertex of the hexagonal cross-section is against the approaching wind. As known, the Strouhal number
St (
St = nD/
V, where
V is the mean speed of the approaching wind;
n and
D denote the fundamental structural frequency and the width of the model’s windward face, respectively) of a hexagonal cylinder is about 0.13. Accordingly, the reduced critical wind velocity for the resonance
Vc (=1/
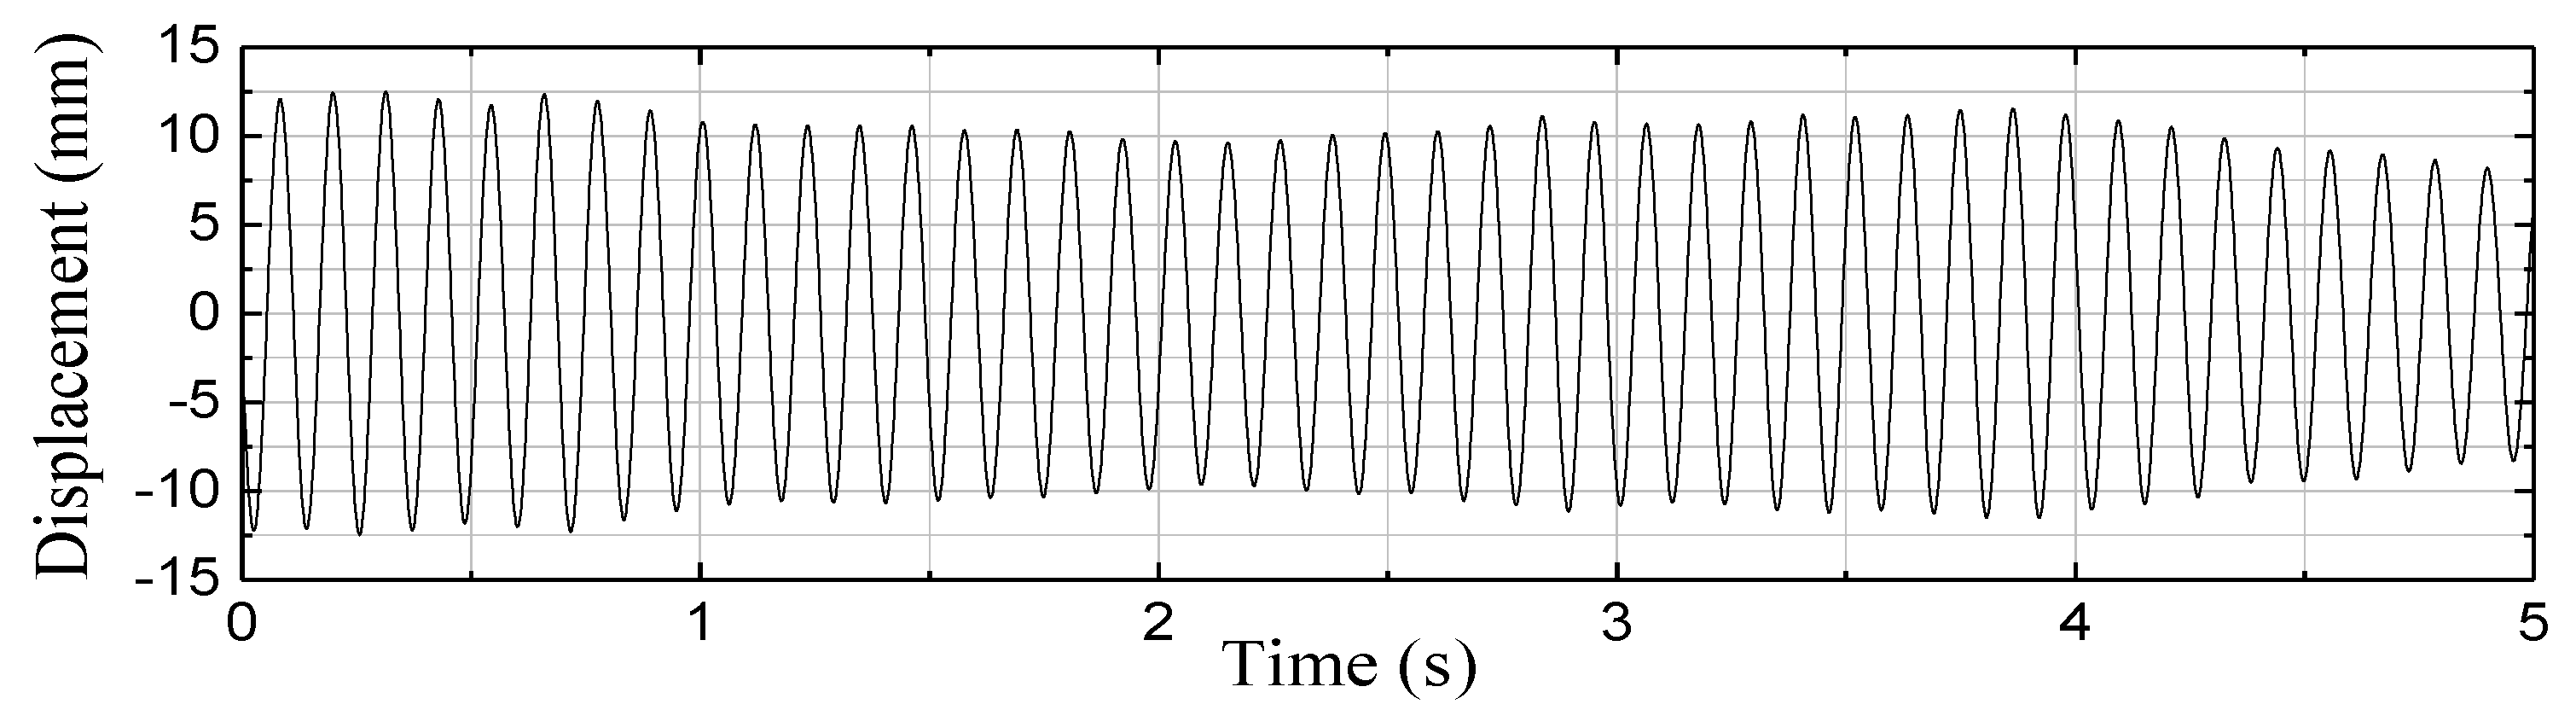
St) for case 1 is about 7.7. The measured time history of the displacement response for case 1 is shown in
Figure 9 for
Vr =
V/
(nD) = 8.1. As can be seen, the measured responses around the reduced critical wind speed are highly harmonic.
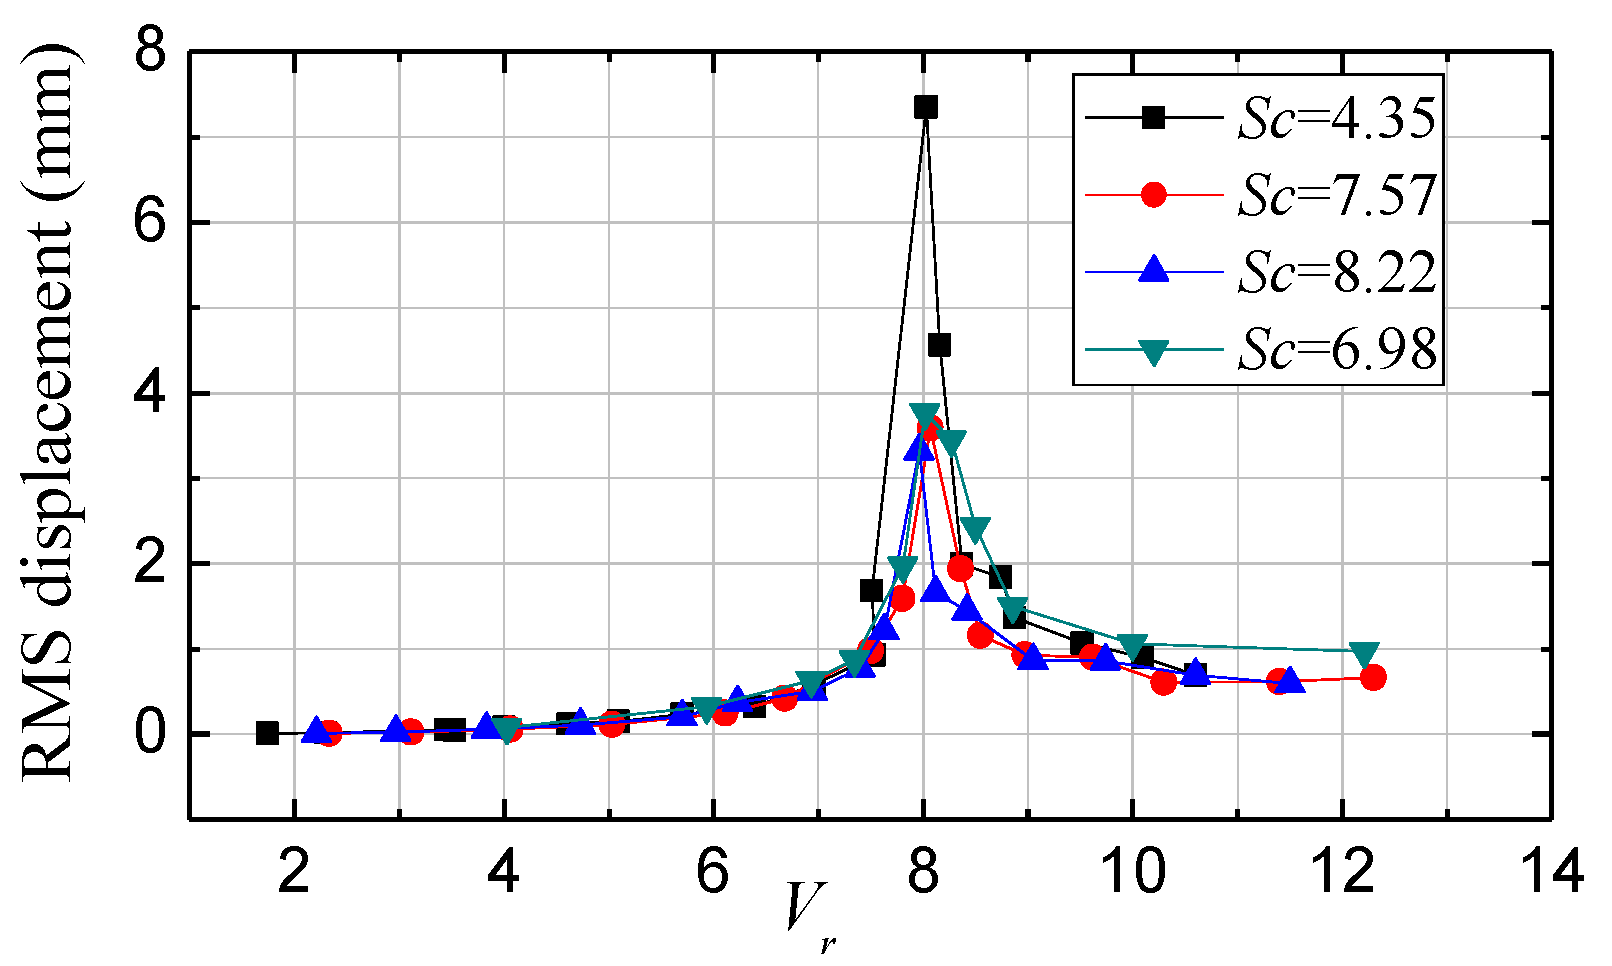
The root-mean-square (RMS) values of the measured cross-wind structural displacement responses for cases 1 to 4 are shown in
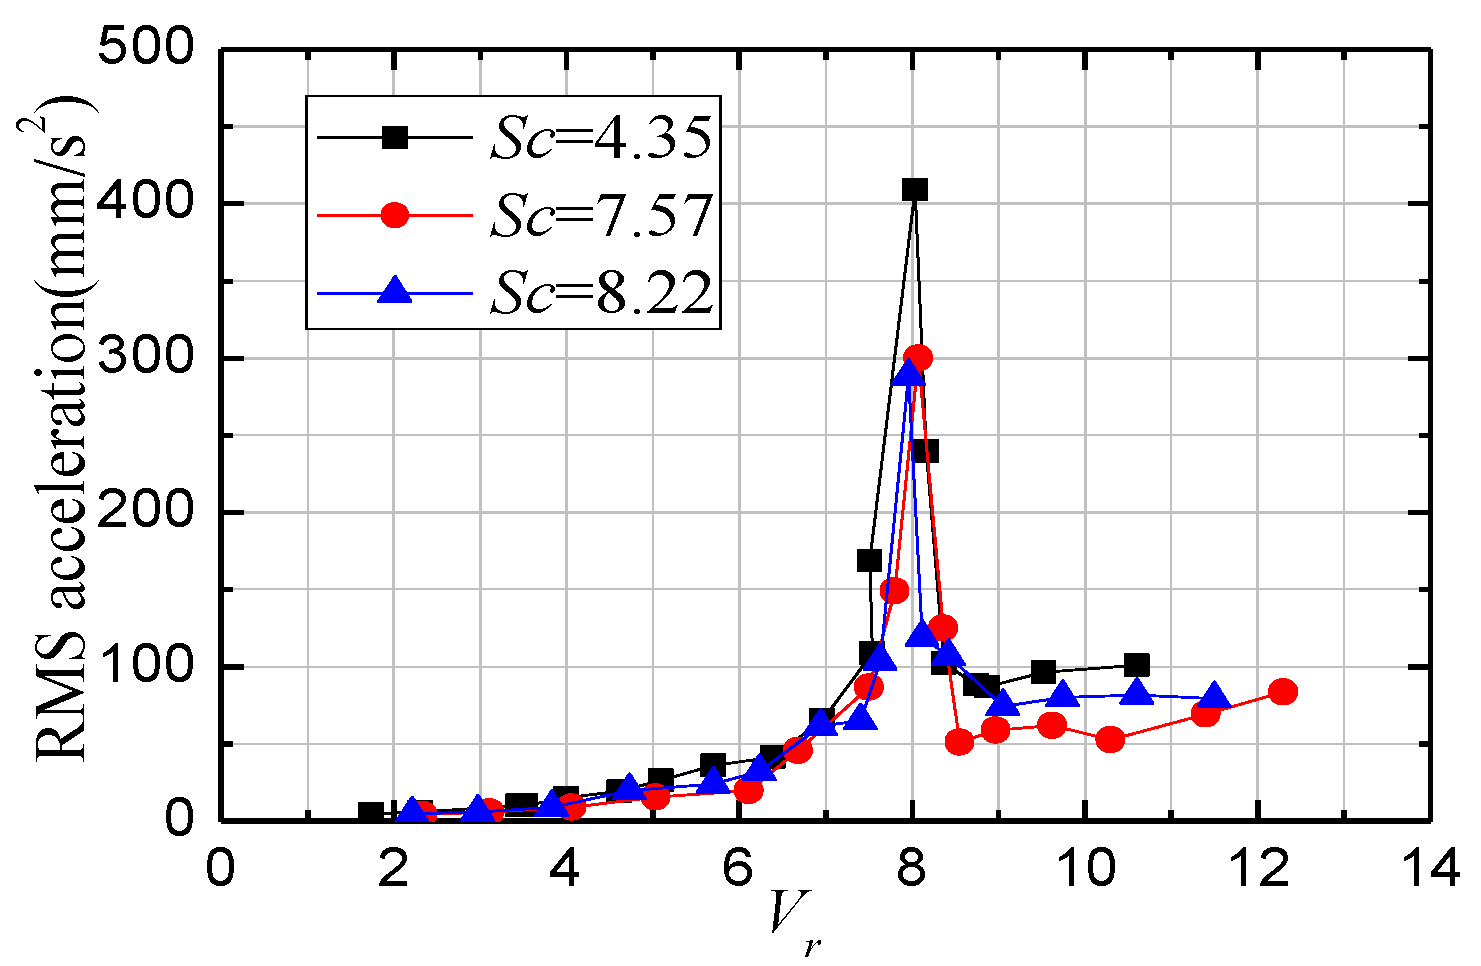
Figure 10. The RMS values of the measured cross-wind acceleration responses are shown in
Figure 11. It should be explained that the acceleration response of case 4 is not shown in
Figure 11, because there was an unknown error with the acceleration acquisition instrument during the wind tunnel test, leading to the acceleration data of case 4 not being measured, so there is no acceleration result for case 4 in
Figure 11; however, the displacement acquisition instrument at this time was available, so only the displacement results of case 4 were measured and are shown in
Figure 10.
As can be seen from
Figure 10 and
Figure 11, both displacement and acceleration responses are relatively large when the reduced wind velocity (
Vr) is close to the critical wind speed of VIV (
Vc). In addition, the time history shown in
Figure 9 is nearly harmonic when
Vr is close to
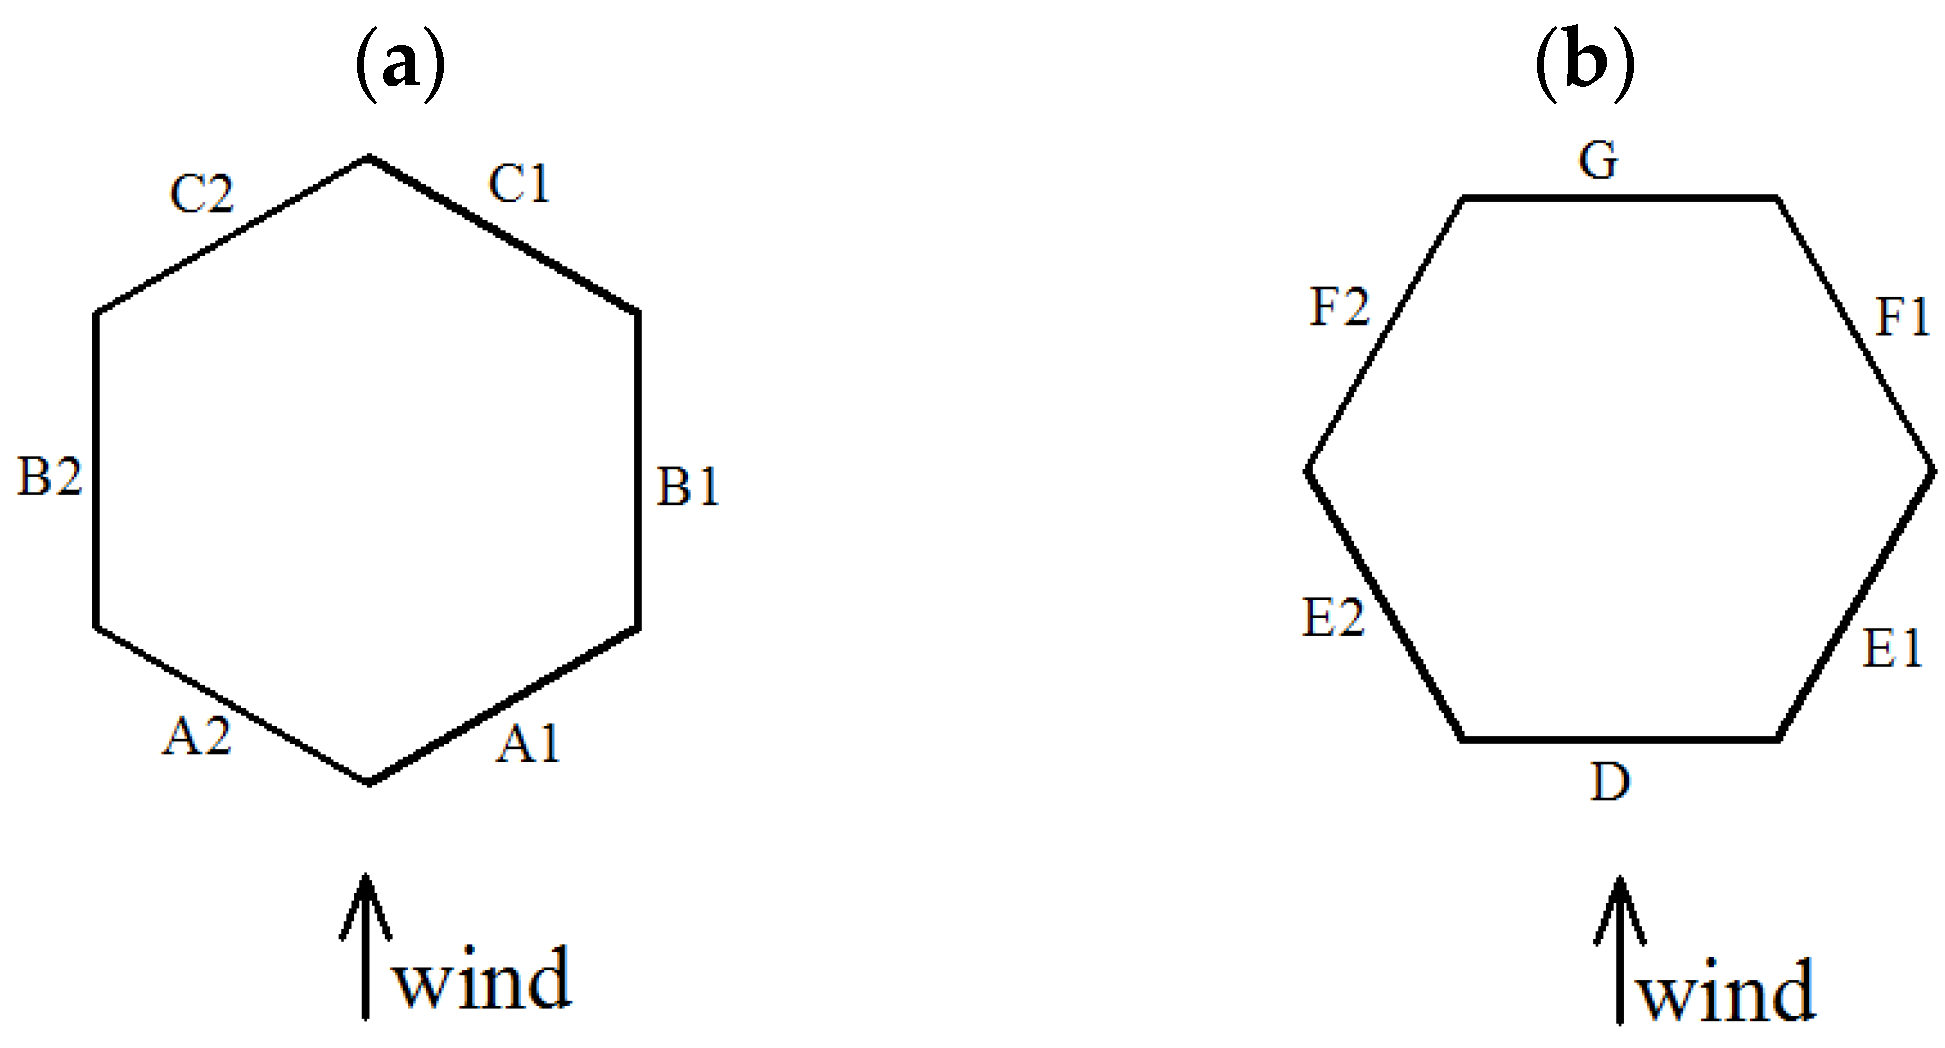
Vc, indicating significant vortex-induced resonance (VIR). This is because, for wind direction I, the incoming flow separates from the downstream corners of the windward faces (A1 and A2) to generate vortices. Meanwhile, both the symmetrical lateral faces (B1 and B2) and the symmetrical leeward faces (C1 and C2) are immersed in the vortex flow, and hence, are subjected to cross-wind forces. In other words, it is easy to cause VIR when a vertex of the hexagonal cross-section is against the approaching wind.
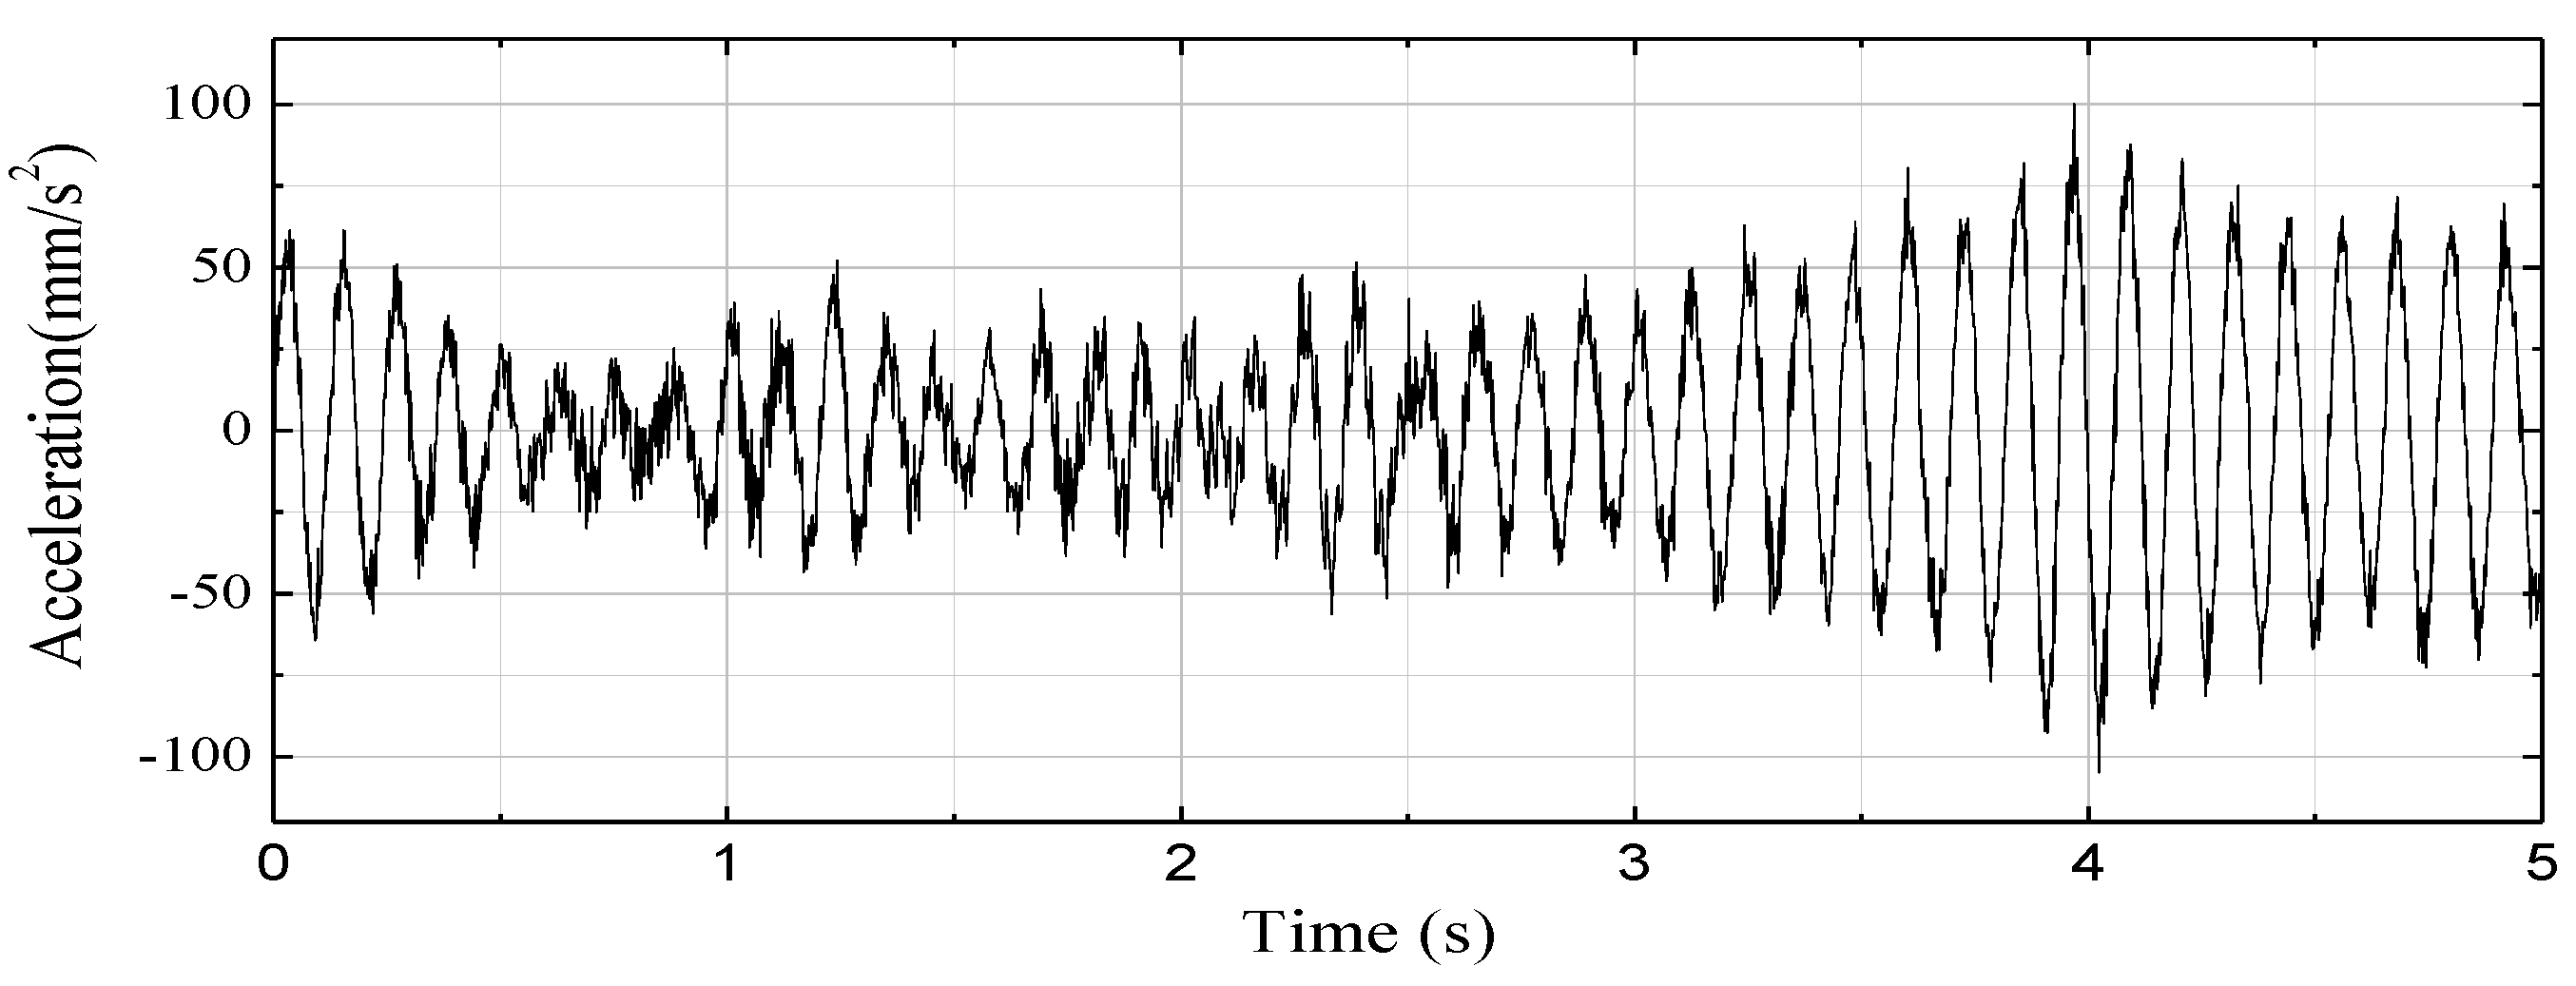
3.2. When a Face Is Perpendicular to the Approaching Wind (Direction II)
The cross-wind acceleration responses of the latter four aeroelastic models (i.e., cases 5 to 8 in
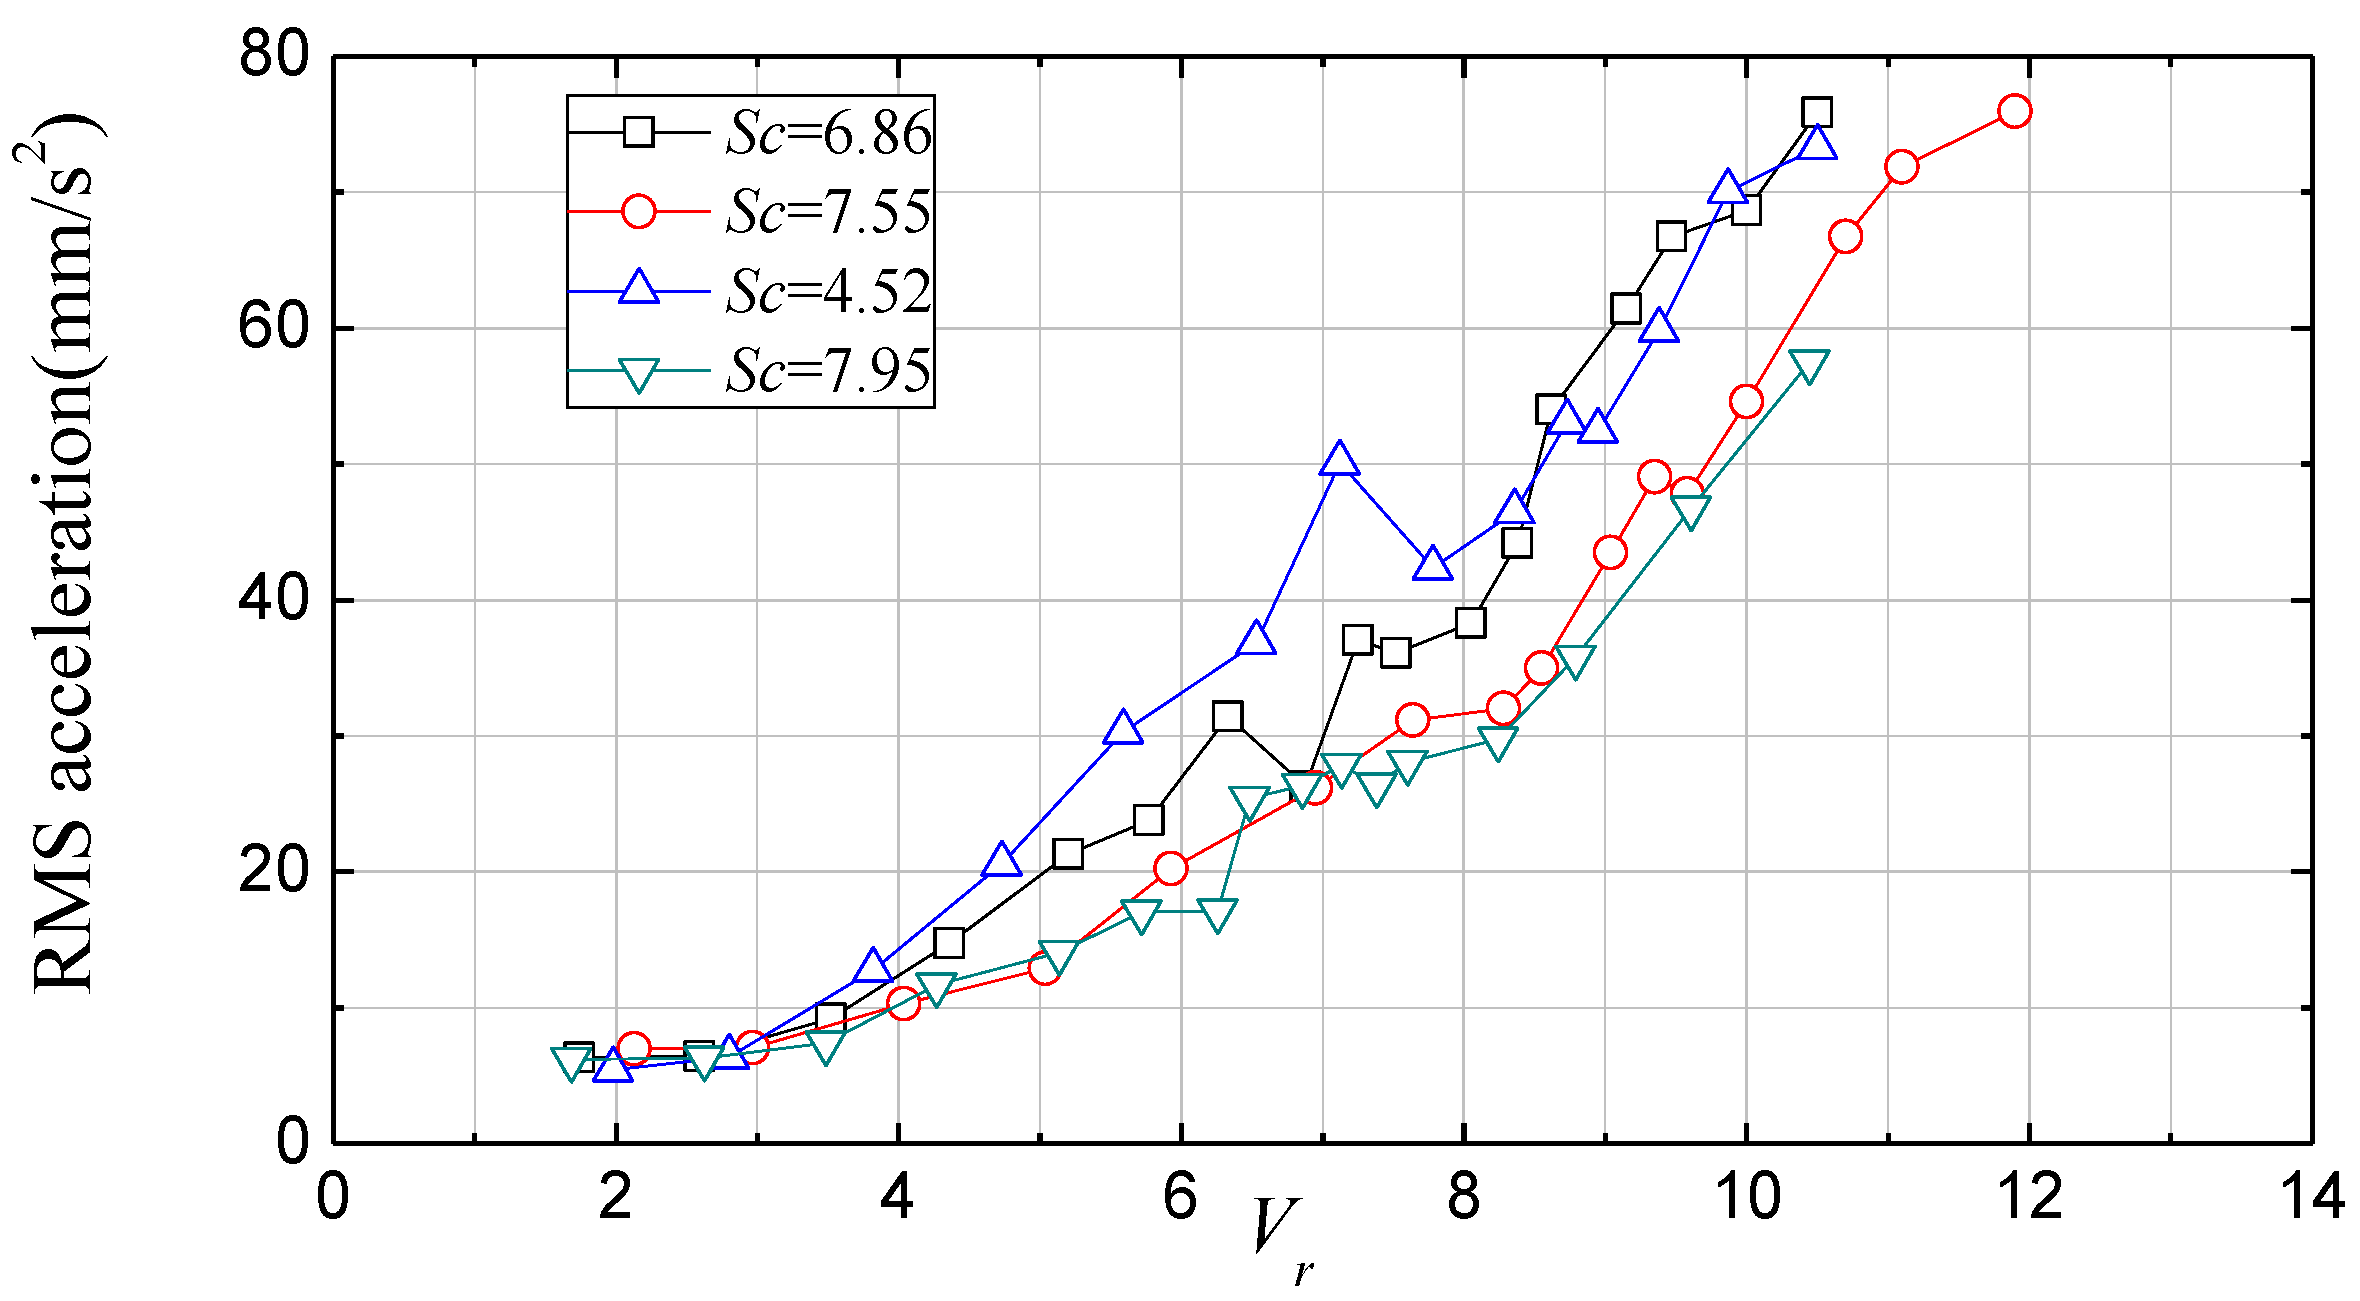
Table 1) were examined when a face of the hexagonal building model was perpendicular to the approaching wind; i.e., for direction II. The RMS values of the acceleration responses for cases 5 to 8 are shown in
Figure 12. It can be observed from
Figure 12 that the RMS values of the acceleration responses gradually increase with reduced wind velocity
Vr. This variation trend is very different from that in direction I, where the RMS values show a sharp increase when
Vr is close to
Vc. In other words, the resonance does not occur for direction II. This can also be illustrated by the time history of the acceleration response. As shown in
Figure 13, the time history of the measured acceleration response for case 7 does not show obvious harmonic vibrations, even when
Vr = 7.2 is close to
Vc. These indicate that the vortex-induced harmonic vibration of the building under this wind direction is relatively slight. This is because, for wind direction II, the resulting wind pressure acting on faces E1 and E2 in the cross-wind direction is close to zero, contributing little to the cross-wind vibrations. Apparently, the windward face D and leeward face G contribute nothing to the cross-wind vibrations. That is to say, the cross-wind vibrations are mainly caused by wind forces acting on faces F1 and F2. Therefore, it is difficult to generate significant VIV when a face of the hexagonal building is perpendicular to the approaching wind.
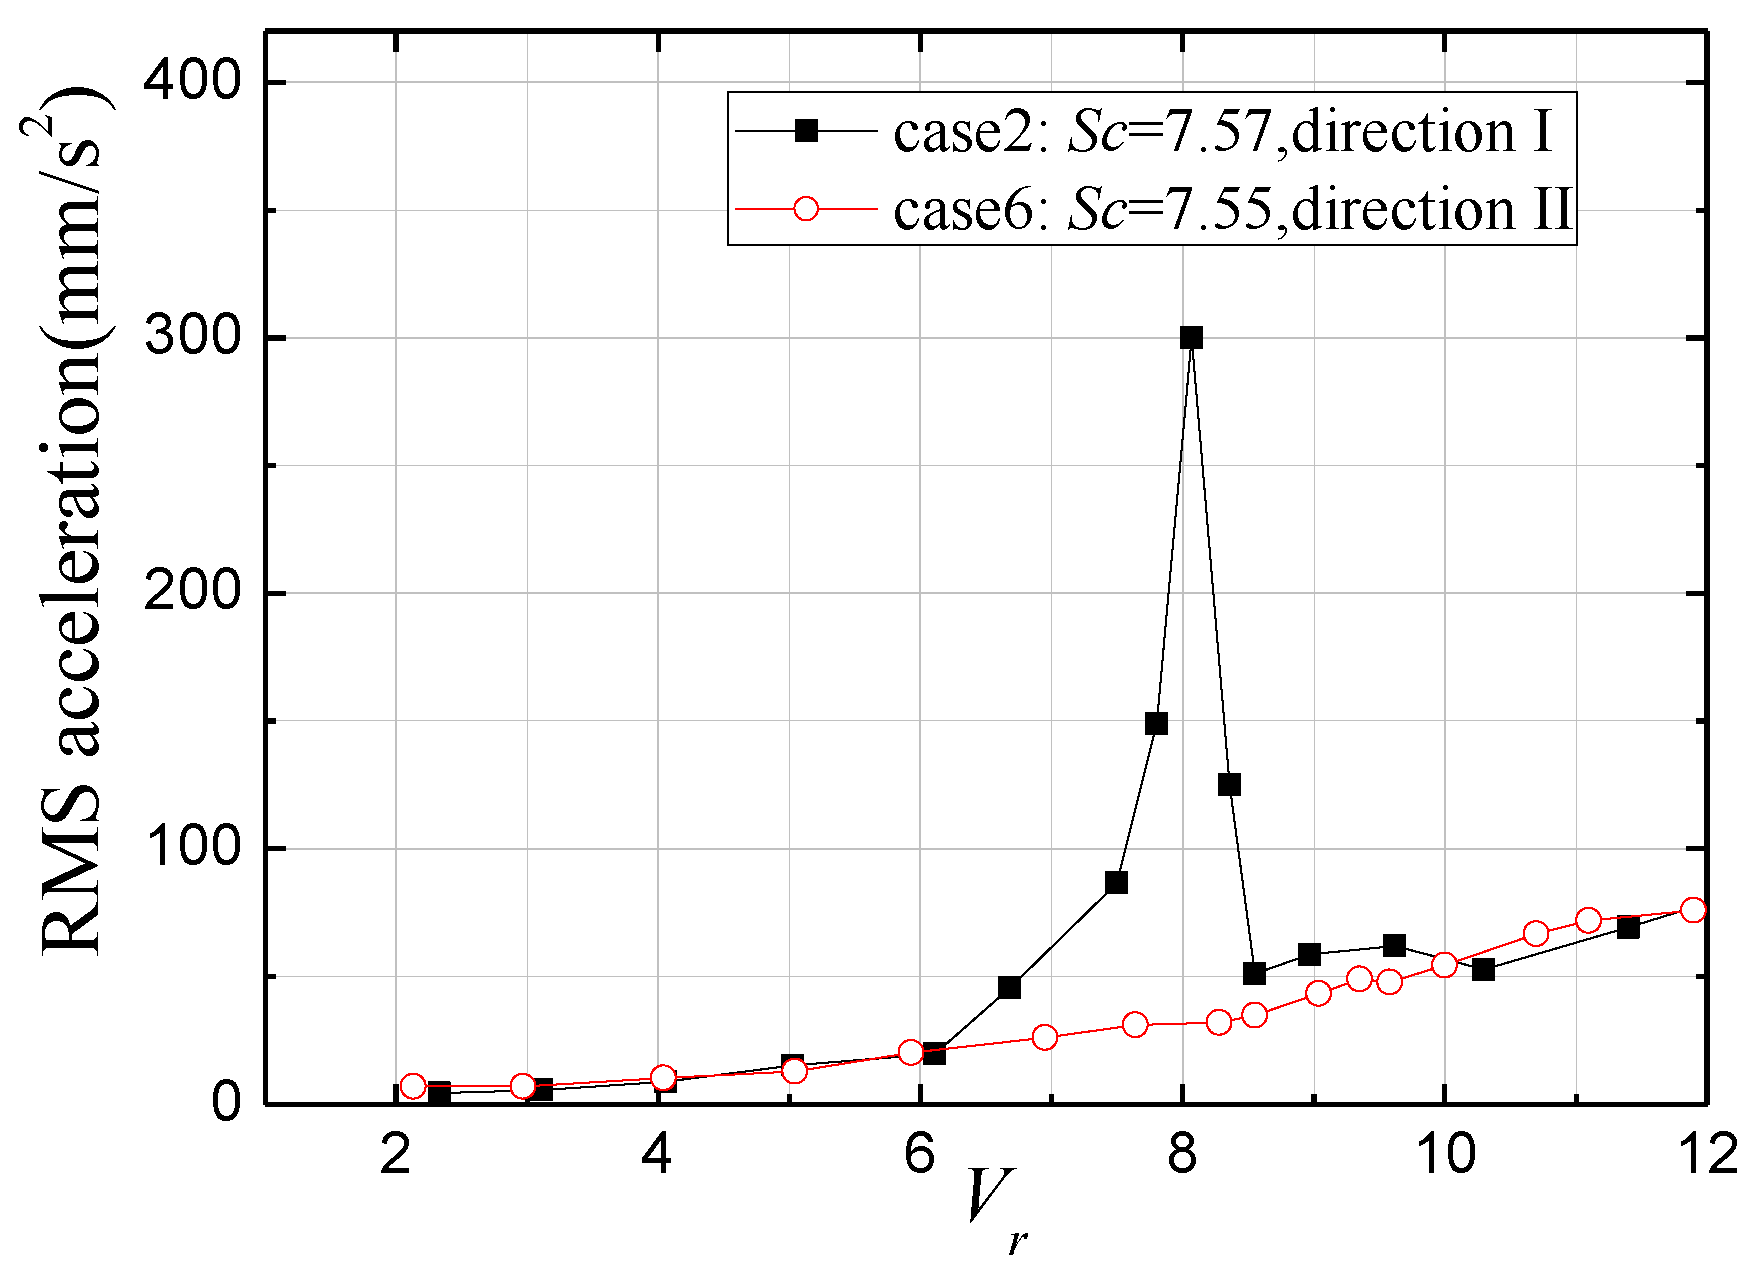
The RMS values of cross-wind acceleration responses measured for two cases with different wind directions are shown in
Figure 14 for comparison. As listed in
Table 1, the structural properties for these two cases are similar. Hence, the responses for the two cases are close to each other when the reduced wind velocity
Vr is far away from the reduced critical wind speed
Vc. However, when
Vr is close to
Vc, the response for direction I is much larger than that for case II. This is because the aerodynamic force for wind direction I (
θ = 30°) is larger than that for direction II (
θ = 0°), as shown in
Figure 3. The other reason is that there is significant vortex-induced resonance in direction I, causing the remarkable increase in the acceleration response, whereas vortex-induced vibration is slight in direction II, and hence, the response is small.
4. Aerodynamic Damping Ratio of the Hexagonal Aeroelastic Models
4.1. Identification of Aerodynamic Damping Ratio
The random decrement (RDT) technique has been widely used to identify the aerodynamic damping ratio [
25,
26,
27,
28,
29,
30,
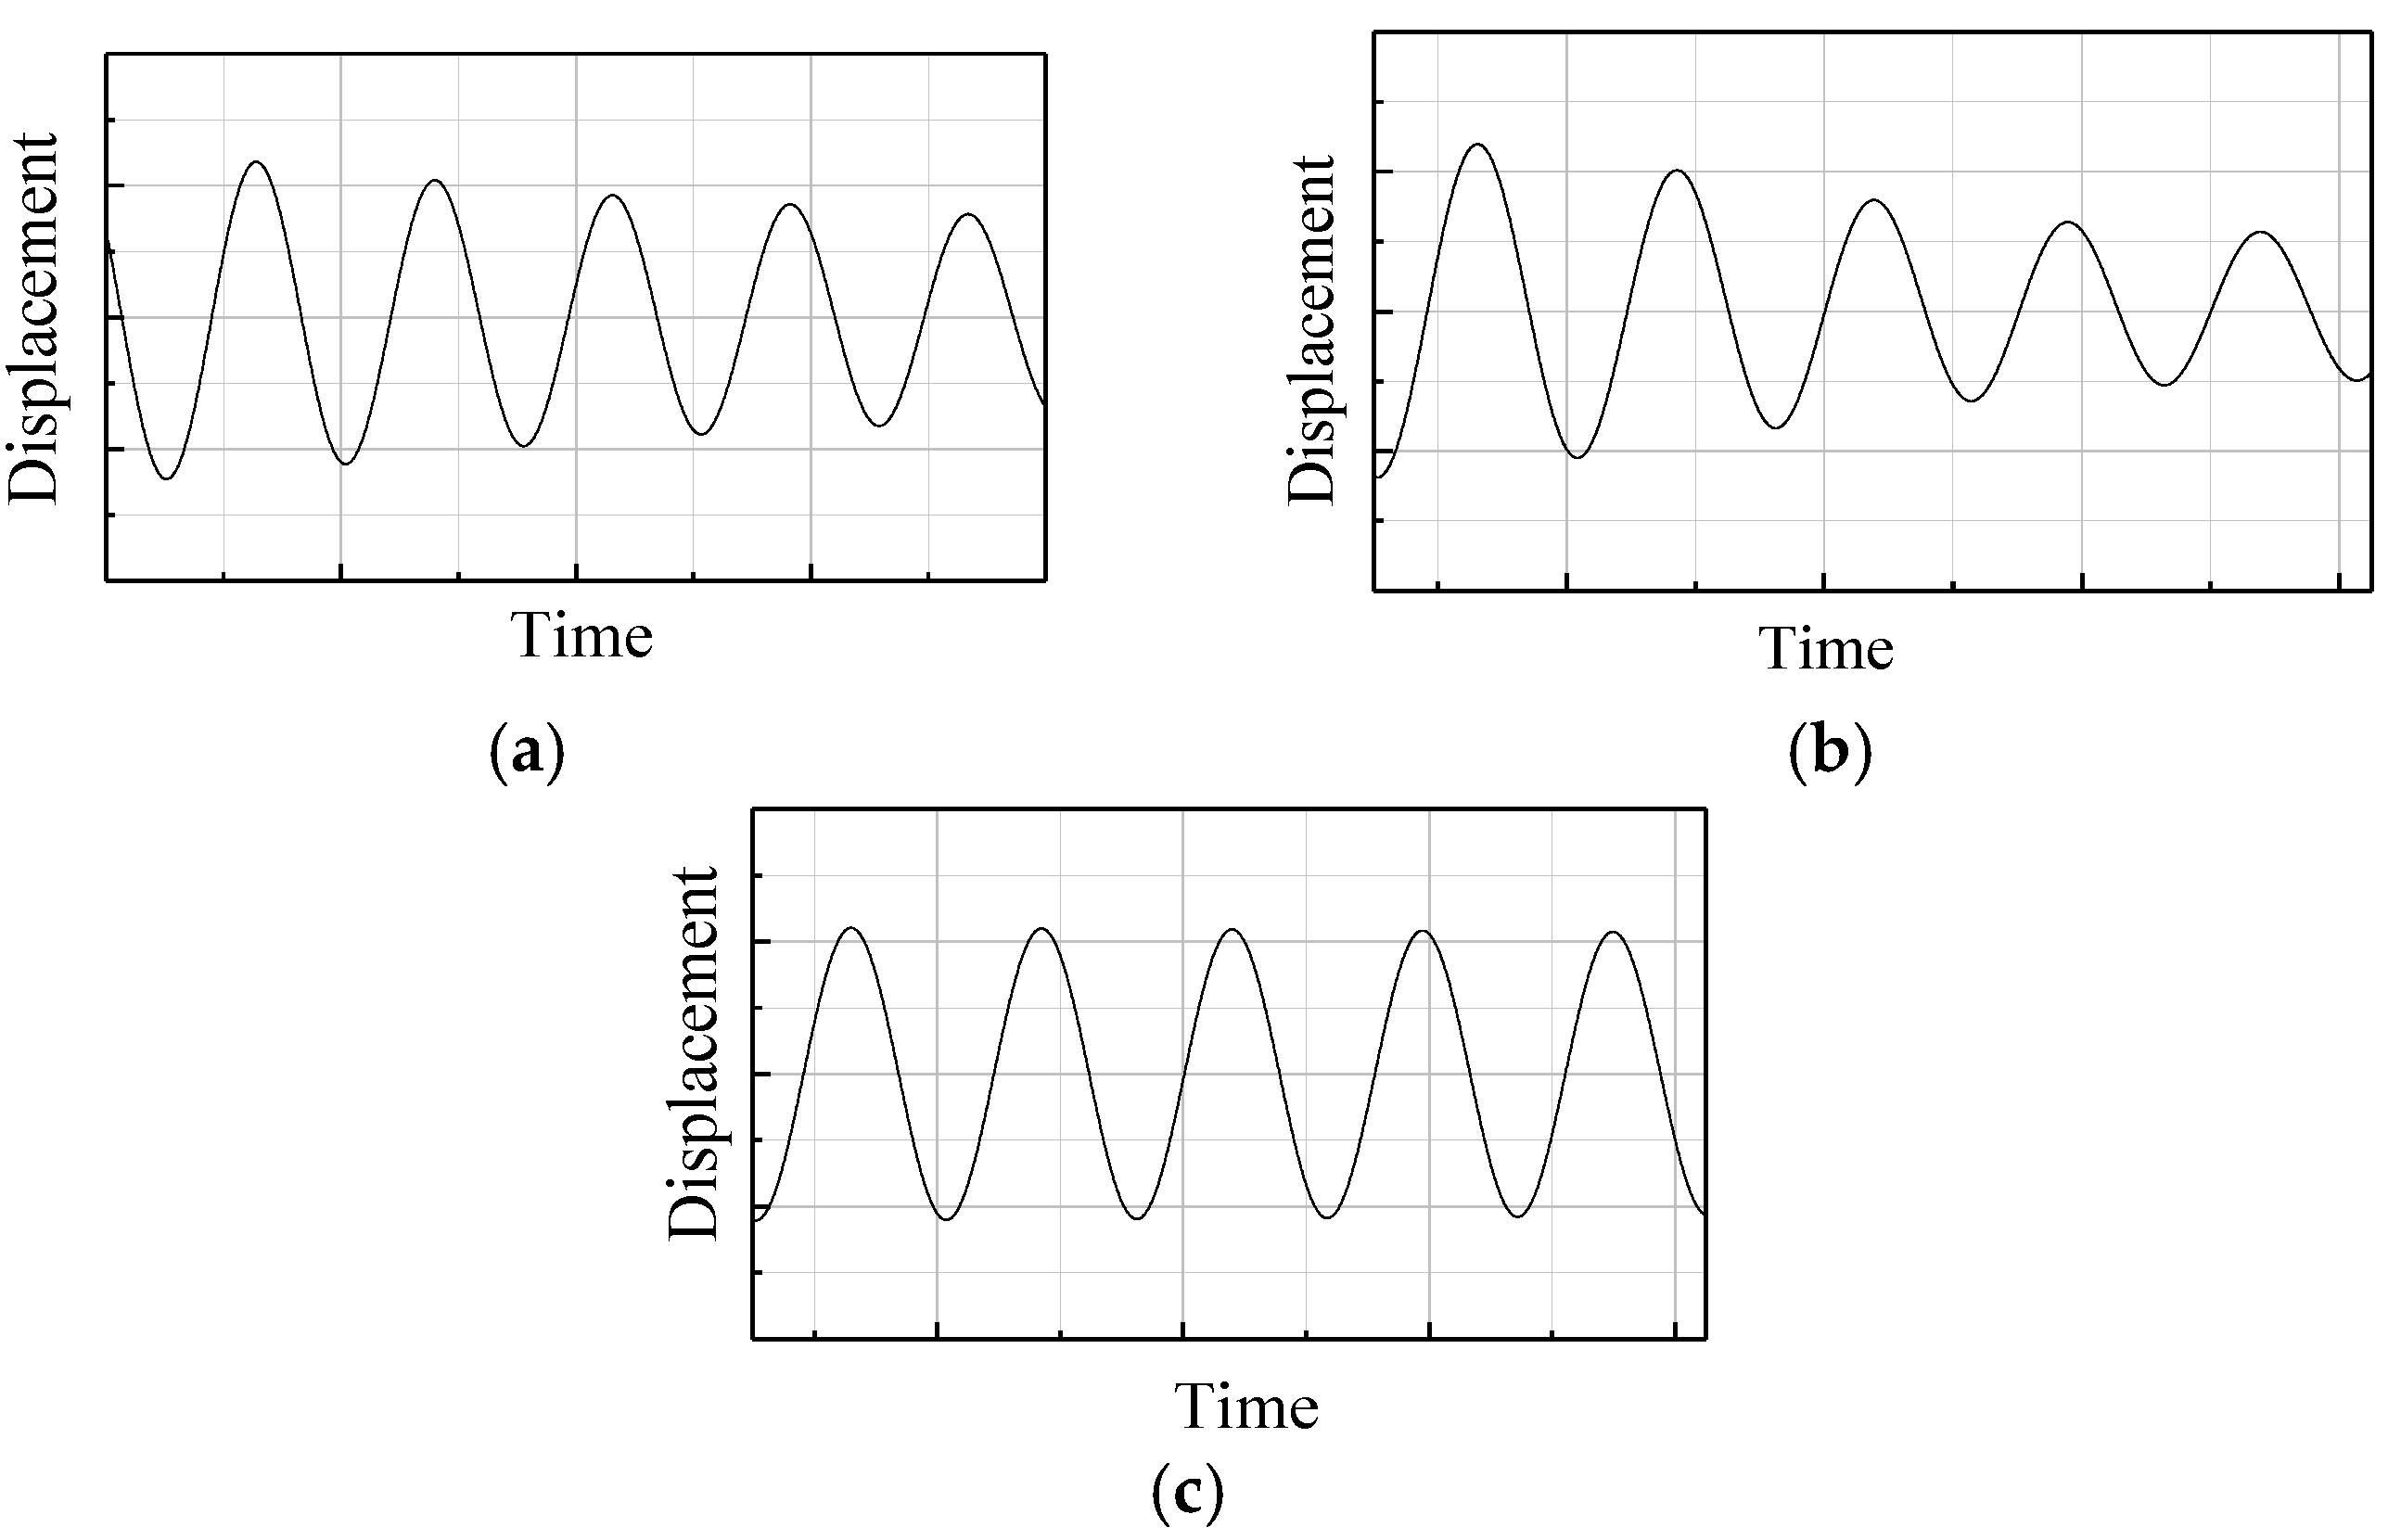
31]. Based on the RDT technique, the free vibration time history of the vibration model can be estimated. Taking case 3 as an example, three free vibration time histories obtained by the RDT are shown in
Figure 15. According to these time histories, the total damping ratio
ξt can be calculated. Thereafter, the aerodynamic damping ratio
ξa can be calculated by subtracting the structural damping ratio
ξs from the total damping ratio
ξt; i.e.,
ξa =
ξt −
ξs.
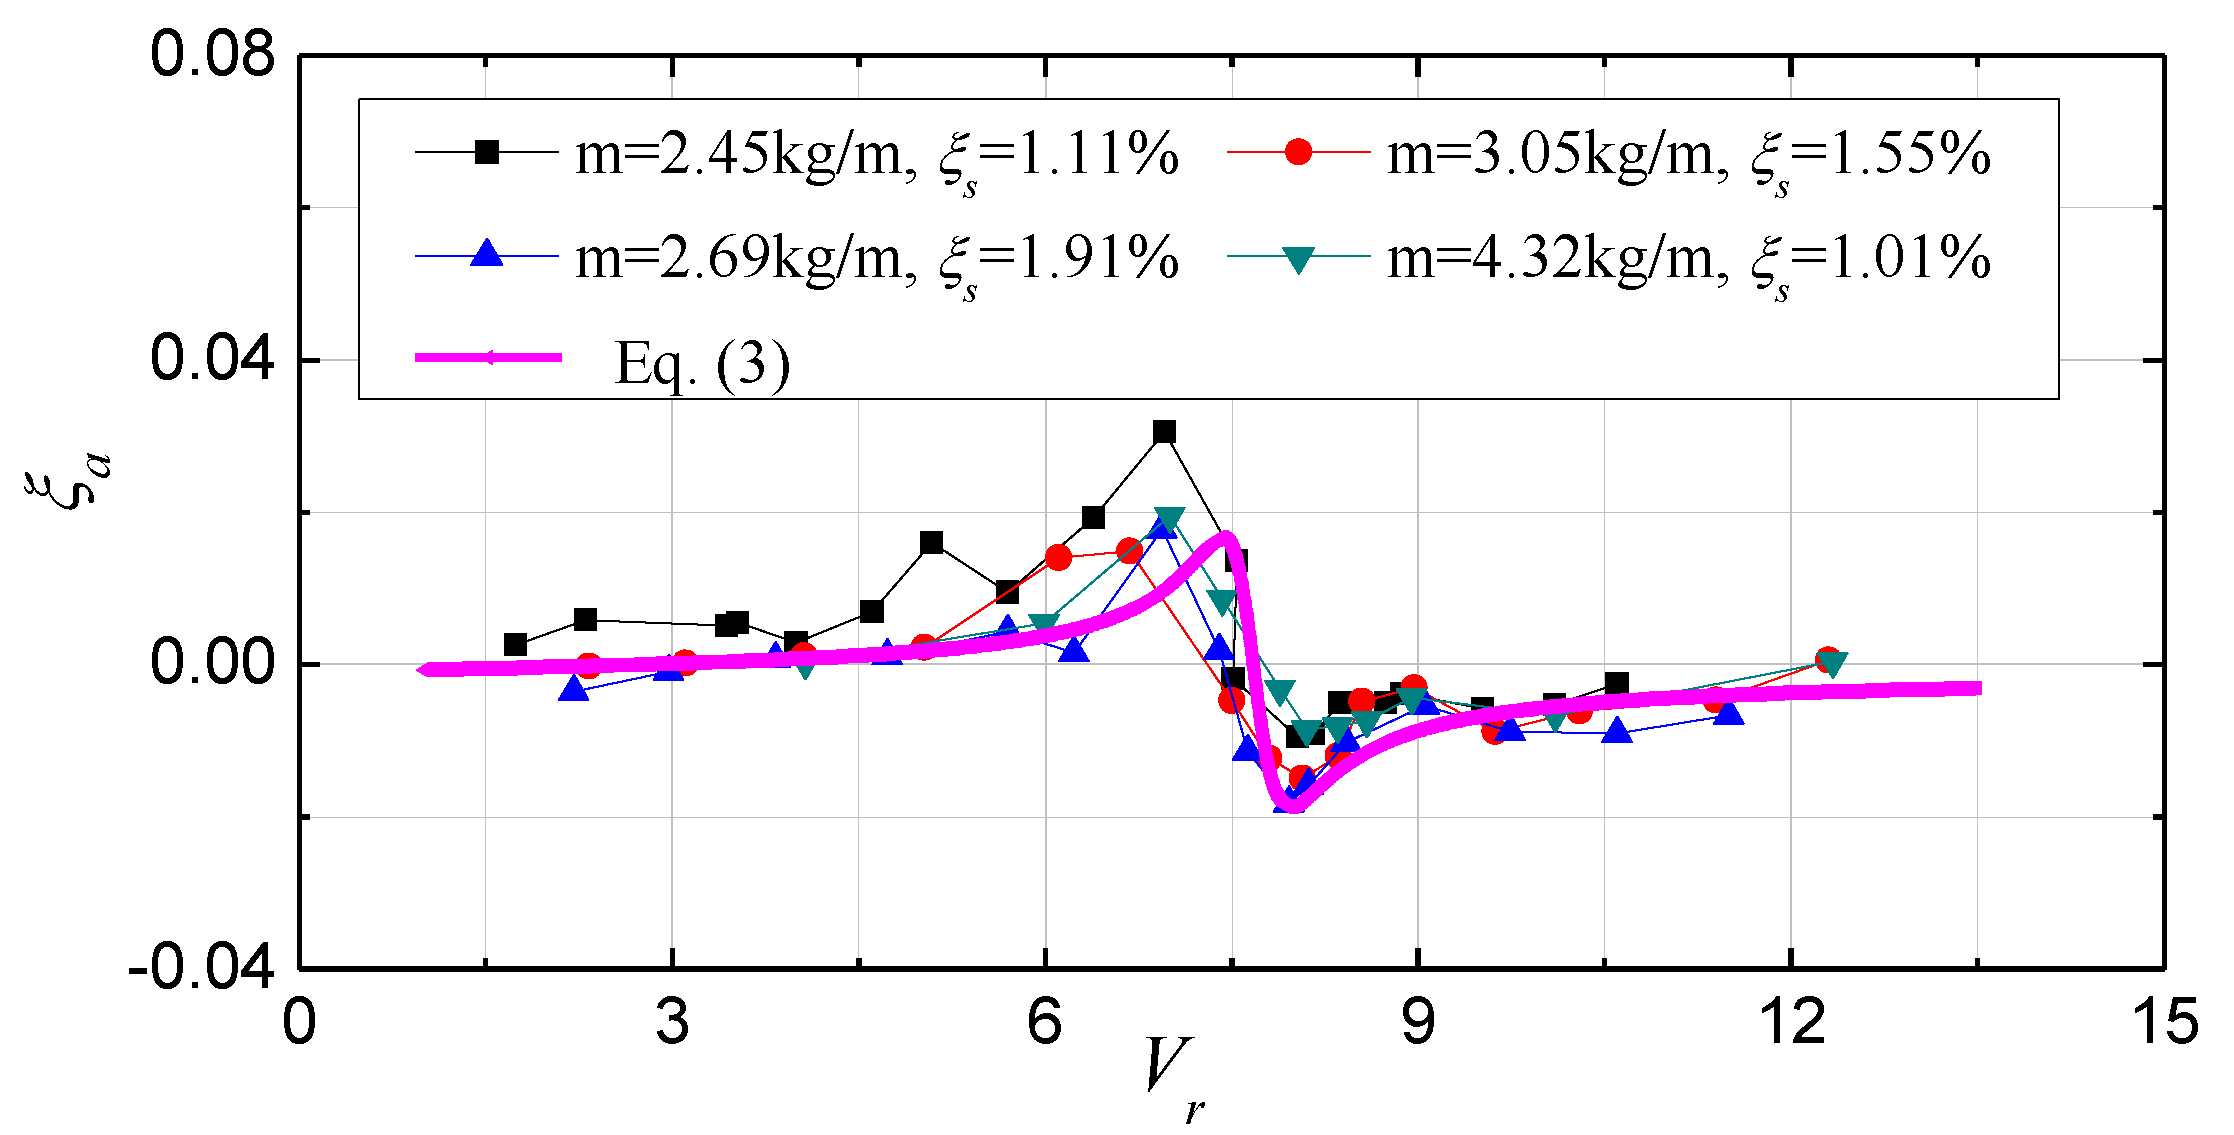
4.2. Aerodynamic Damping for Wind Direction I
For the first four cases (i.e., cases 1 to 4) where a vertex of the hexagonal aeroelastic model is against the approaching wind, the cross-wind aerodynamic damping ratio is shown in
Figure 16. As can be seen, when the reduced wind velocity
Vr is very small, the aerodynamic damping ratio is very small and close to zero. With increasing
Vr, the aerodynamic damping ratio gradually increases and reaches the maximum. The aerodynamic damping ratio then changes from positive to negative when
Vr is close to
Vc. Thereafter, the absolute value of the aerodynamic damping ratio rapidly decreases and finally maintains a constant around zero. Generally, the variation of the aerodynamic damping ratio with reduced wind velocity
Vr is very consistent with that of tall buildings with a square section.
In addition to the reduced wind velocity, the structural damping and mass also affect the aerodynamic damping. However, it can be observed that the effects of these two parameters on negative aerodynamic damping ratios are smaller than those on positive aerodynamic damping ratios. Negative aerodynamic damping ratios are more dangerous in engineering practice, as they tend to decrease the total damping ratio, and hence, exacerbate wind-induced structural responses. For easy application, a regression analysis for the aerodynamic damping is conducted using Equation (3) with reduced wind speed
Vr as the variable, by weighting the negative damping ratios.
where
P1,
P2 and
P3 are fitting parameters to be determined by regression analysis; the reciprocal of
β denotes the threshold of the reduced wind velocity, where the reduced aerodynamic damping ratio changes from positive to negative. Regression analysis suggests that that
P1 = −0.001,
P2 = 0.5,
P3 = 200 and
β = 0.13. As can be seen from
Figure 16, the results of Equation (3) agree with the experimental results, although there is a slight difference between them.
4.3. Aerodynamic Damping When a Face Is Perpendicular to the Approaching Wind (Direction II)
For the latter four cases (i.e., cases 5 to 8, where a face of the hexagonal aeroelastic model is against the approaching wind), the variation in the cross-wind aerodynamic damping ratio
ξa with reduced wind velocity
Vr is shown in
Figure 17. As can be seen, the variation is very different from that shown in
Figure 16, because the wind flow for these two wind directions is totally different, as discussed above. Unlike the complicated variation shown in
Figure 16, all four sets of aerodynamic damping ratios shown in
Figure 17 almost linearly increase with reduced wind speed
Vr. As a result, a linear formula, as shown in Equation (4), is put forward for estimating the aerodynamic damping. The result of Equation (4) is shown in
Figure 17, which coincides well with the results from the wind tunnel test.
In this way, the cross-wind aerodynamic damping ratios for the hexagonal tall building were identified for the two representative wind directions. In addition, two expressions were developed by regression analysis to estimate the cross-wind aerodynamic damping according to the reduced wind speed Vr in the preliminary design stage. Furthermore, the variation trend and magnitude of aerodynamic damping ratios were completely different for the two wind directions, as direction I had significant VIV, while direction II did not. Around the range of the reduced critical wind speed, the aerodynamic damping ratio in direction II was larger than that in direction I. Therefore, if there is a dominant wind direction in the construction site of the hexagonal tall building, it is more favorable to make the dominant wind direction coincide with direction II to achieve better wind performance.
5. Conclusions
The cross-wind aeroelastic effects of tall buildings with a hexagonal cross-section were investigated in this study using wind tunnel tests on aeroelastic models with multiple-degree-of-freedom. Two representative wind directions, i.e., wind directions I and II, were identified. The cross-wind dynamic responses and aerodynamic damping ratios were examined for the two wind directions and the difference between the aeroelastic effects of these two wind directions was uncovered. The main findings of this paper are summarized as follows:
(1) When a vertex of the hexagonal tall building is against the approaching wind (i.e., wind direction I), the aerodynamic force is considerable and there are significant VIVs around the critical wind velocity. However, when a face is perpendicular to the approaching wind (direction II), the hexagonal tall building does not show significant VIVs and the aerodynamic force is relatively small.
(2) Aerodynamic damping ratios for these two representative wind directions exhibit different variations in terms of the reduced wind speed. For direction I, the variation is similar to that of a tall building with a square cross-section. For direction II, the aerodynamic damping ratio almost linearly increases with the reduced wind speed. Furthermore, around the range of reduced critical wind speed, the aerodynamic damping ratio for direction II is smaller than that for direction I. Direction I is the most dangerous wind direction, whereas direction II is the most favorable one. Therefore, if there is a dominant wind direction on the construction side of a hexagonal tall building, the building should be designed in such a way that the dominant wind direction is along direction II, to avoid excessive cross-wind structural responses.
(3) Two equations for the aerodynamic damping ratios were obtained by regression analysis for the two representative wind directions. The two equations can be used to estimate the cross-wind aerodynamic damping ratios of a hexagonal tall building in the preliminary design stage. By substituting the reduced wind speed into the two equations, the aerodynamic damping ratios can be readily determined for the two representative wind directions, which can facilitate the design of hexagonal tall buildings.
Author Contributions
Conceptualization, L.W.; Writing original draft, Y.F. and J.L. All authors have read and agreed to the published version of the manuscript.
Funding
This research was funded by National Natural Science Foundation of China: 51708186.
Institutional Review Board Statement
Not applicable for studies not involving humans or animals.
Informed Consent Statement
Not applicable for studies not involving humans.
Data Availability Statement
Not applicable.
Acknowledgments
The work described here was partly supported by National Natural Science Foundation of China (No. 51708186).
Conflicts of Interest
The authors declare no conflict of interest.
References
- Gu, M.; Quan, Y. Across-wind loads of typical tall buildings. J. Wind Eng. Ind. Aerodyn. 2004, 92, 1147–1165. [Google Scholar] [CrossRef]
- Huang, P.; Quan, Y.; Gu, M. Experimental study of aerodynamic damping of typical tall buildings. Math. Probl. Eng. 2013, 2013, 731572. [Google Scholar] [CrossRef] [Green Version]
- Kim, Y.-M.; You, K.-P.; Ko, N.-H. Across-wind responses of an aeroelastic tapered tall building. J. Wind Eng. Ind. Aerodyn. 2008, 96, 1307–1319. [Google Scholar] [CrossRef]
- Kwok, K.; Wilhelm, P.; Wilkie, B. Effect of edge configuration on wind-induced response of tall buildings. Eng. Struct. 1988, 10, 135–140. [Google Scholar] [CrossRef]
- Li, S.Y.; Xiao, C.Y.; Fan, Y.G.; Chen, Z.-Q. Experimental investigation of aerodynamic damping on super-high-rise buildings with square cross section under the action of full-direction wind. J. Hunan Univ. 2015, 42, 9–15. [Google Scholar]
- Liu, T.; Zhang, W.; Yue, Q. A study on vortex-induced vibration of supertall buildings in acrosswind. Struct. Des. Tall Spec. Build. 2011, 20, 902–910. [Google Scholar] [CrossRef]
- Quan, Y.; Gu, M. Across-wind equivalent static wind loads and responses of super-high-rise buildings. Adv. Struct. Eng. 2012, 15, 2145–2155. [Google Scholar] [CrossRef]
- Wang, L.; Zhang, W. The Influence of Chamfered and Rounded Corners on Vortex-Induced Vibration of Super-Tall Buildings. Appl. Sci. 2023, 13, 1049. [Google Scholar] [CrossRef]
- Kawai, H. Effect of cornermodifications on aero-elastic instabilities of tall buildings. J. Wind. Eng. Ind. Aerodyn. 1998, 74–76, 719–729. [Google Scholar] [CrossRef]
- Hayashida, H.; Iwasa, Y. Aerodynamic shape effects of tall building for vortex induced vibration. J. Wind Eng. Ind. Aerodyn. 1990, 33, 237–242. [Google Scholar] [CrossRef]
- Miyashita, K.; Ohkuma, T.; Tamura, Y. Wind-induced response of high-rise buildings. J. Wind Eng. Ind. Aerodyn. 1993, 50, 319–328. [Google Scholar] [CrossRef]
- Tse, K.T.; Hu, G.; Song, J.; Park, H.S.; Kim, B. Effects of corner modifications on wind loads and local pressures on walls of tall buildings. Build. Simul. 2020, 14, 1109–1126. [Google Scholar] [CrossRef]
- Kim, Y.C.; Kanda, J. Wind pressures on tapered and set-back tall buildings. J. Fluids Struct. 2013, 39, 306–321. [Google Scholar] [CrossRef]
- Mannini, C.; Marra, A.M.; Bartoli, G. Experimental investigation on VIV-galloping interaction of a rectangular 3:2 cylinder. Meccanica 2015, 50, 841–853. [Google Scholar] [CrossRef]
- Wang, J.-B.; Wang, Y.; Wang, L.; Liang, S.-G. Study on the Peak Factor of the Wind-Induced Response of Super-High-Rise Buildings. Atmosphere 2023, 14, 379. [Google Scholar] [CrossRef]
- Council on Tall Buildings, S.B. Architectural Society of China. Table of the tall buildings above 180 meters in China Mainland. China Civ. Eng. J. 2010, 43, 104–109. [Google Scholar]
- Steckley, A. Motion-Induced Wind Forces on Chimneys and Tall Buildings. Ph.D. Thesis, University of Western Ontario, London, UK, 1989. [Google Scholar]
- Tanaka, H.; Tamura, Y.; Ohtake, K.; Nakai, M.; Kim, Y.C. Experimental investigation of aerodynamic forces and wind pressures acting on tall buildings with various unconventional configurations. J. Wind. Eng. Ind. Aerodyn. 2012, 107/108, 179–191. [Google Scholar] [CrossRef]
- Kim, Y.; Bandi, E.; Yoshida, A.; Tamura, Y. Response characteristics of super-tall buildings–Effects of number of sides and helical angle. J. Wind Eng. Ind. Aerodyn. 2015, 145, 252–262. [Google Scholar] [CrossRef]
- Wang, L.; Zhang, W.; Liu, L.-S.; Zhang, Z.-h. Wind force of super high-rise buildings with hexagonal section. Structures 2021, 34, 3716–3723. [Google Scholar] [CrossRef]
- GB50009-2012; Load Code for the Design of Building Structures. China Architecture and Building Press: Beijing, China, 2012.
- Wang, L.; Liang, S.-G.; Huang, G.; Song, J.; Zou, L. Investigation on the unstability of vortex induced resonance of high-rise buildings. J. Wind Eng. Ind. Aerodyn. 2018, 175, 17–31. [Google Scholar] [CrossRef]
- Wang, L.; Zhu, Y.-J.; Wang, Z.-K.; Fan, Y. A design method for multi-degree-of-freedom aeroelastic model of super tall buildings. Wind Struct. 2021, 32, 219–225. [Google Scholar]
- Wang, L.; Shi, F.; Chen, K.; Tang, Y.; Hao, W. A fabrication method of continuous aero-model for high chimney. Structures 2021, 34, 3716–3723. [Google Scholar] [CrossRef]
- Vickery, B.J.; Steckley, A. Aerodynamic damping and vortex excitation on an oscillating prism in turbulent shear flow. J. Wind. Eng. Ind. Aerodyn. 1993, 49, 121–140. [Google Scholar] [CrossRef]
- Marukawa, H.; Kato, N.; Fujii, K.; Tamura, Y. Experimental evaluation of aerodynamic damping of tall buildings. J. Wind Eng. Ind. Aerodyn. 1996, 59, 177–190. [Google Scholar] [CrossRef]
- Tamura, Y.; Suganuma, S.-y. Evaluation of amplitude-dependent damping and natural frequency of buildings during strong winds. J. Wind Eng. Ind. Aerodyn. 1996, 59, 115–130. [Google Scholar] [CrossRef]
- Wang, L.; Fan, X.-Y.; Liang, S.-G.; Song, J.; Wang, Z.-K. Improved expression for across-wind aerodynamic damping ratios of super high-rise buildings. J. Wind Eng. Ind. Aerodyn. 2018, 176, 263–272. [Google Scholar] [CrossRef]
- Kareem, A.; Gurley, K. Damping in structures: Its evaluation and treatment of uncertainty. J. Wind Eng. Ind. Aerodyn. 1996, 59, 131–157. [Google Scholar] [CrossRef]
- Hayashida, H.; Mataki, Y.; Iwasa, Y. Aerodynamic damping effects of tall building for a vortex induced vibration. J. Wind Eng. Ind. Aerodyn. 1992, 43, 1973–1983. [Google Scholar] [CrossRef]
- Watanabe, Y.; Isyumov, N.; Davenport, A. Empirical aerodynamic damping function for tall buildings. J. Wind Eng. Ind. Aerodyn. 1997, 72, 313–321. [Google Scholar] [CrossRef]
Figure 1.
Rigid model of the tall hexagonal building. (a) Rigid model, (b) Arrangement of pressure taps, (c) Definition of wind direction.
Figure 1.
Rigid model of the tall hexagonal building. (a) Rigid model, (b) Arrangement of pressure taps, (c) Definition of wind direction.
Figure 2.
Simulated wind profile in the wind tunnel for category B. (a) Mean wind speed, (b) Turbulence intensity.
Figure 2.
Simulated wind profile in the wind tunnel for category B. (a) Mean wind speed, (b) Turbulence intensity.
Figure 3.
PSD of cross-wind forces on rigid model.
Figure 3.
PSD of cross-wind forces on rigid model.
Figure 4.
Aeroelastic MDOF model. (a) Plan view of each diaphragm in the model, (b) Model in the wind tunnel.
Figure 4.
Aeroelastic MDOF model. (a) Plan view of each diaphragm in the model, (b) Model in the wind tunnel.
Figure 5.
Free vibration displacement of the MDOF models (case 5).
Figure 5.
Free vibration displacement of the MDOF models (case 5).
Figure 6.
PSD of wind-induced acceleration of the aeroelastic model in case 5.
Figure 6.
PSD of wind-induced acceleration of the aeroelastic model in case 5.
Figure 7.
First two mode shapes of the MDOF model in case 5.
Figure 7.
First two mode shapes of the MDOF model in case 5.
Figure 8.
Two typical wind directions. (a) Wind direction I, (b) Wind direction II.
Figure 8.
Two typical wind directions. (a) Wind direction I, (b) Wind direction II.
Figure 9.
Time history of cross-wind displacement for case 1.
Figure 9.
Time history of cross-wind displacement for case 1.
Figure 10.
Cross-wind displacement of cases 1 to 4 (wind direction I).
Figure 10.
Cross-wind displacement of cases 1 to 4 (wind direction I).
Figure 11.
Cross-wind acceleration response of cases 1 to 3 (wind direction I).
Figure 11.
Cross-wind acceleration response of cases 1 to 3 (wind direction I).
Figure 12.
RMS crosswind acceleration of cases 5 to 8 (direction II).
Figure 12.
RMS crosswind acceleration of cases 5 to 8 (direction II).
Figure 13.
Time history of cross-wind acceleration in case 7 (Sc = 4.52, Vr = 7.2).
Figure 13.
Time history of cross-wind acceleration in case 7 (Sc = 4.52, Vr = 7.2).
Figure 14.
Cross-wind acceleration for two cases with different wind directions.
Figure 14.
Cross-wind acceleration for two cases with different wind directions.
Figure 15.
Free decay curves estimated by the RDT for case 3. (a) Vr = 3.83, ξt = 1.98%, (b) Vr = 6.94, ξt = 3.67%, (c) Vr = 8.00, ξt = 0.09%.
Figure 15.
Free decay curves estimated by the RDT for case 3. (a) Vr = 3.83, ξt = 1.98%, (b) Vr = 6.94, ξt = 3.67%, (c) Vr = 8.00, ξt = 0.09%.
Figure 16.
Aerodynamic damping for direction I.
Figure 16.
Aerodynamic damping for direction I.
Figure 17.
Aerodynamic damping ratio for direction II.
Figure 17.
Aerodynamic damping ratio for direction II.
Table 1.
Modal properties of the eight aeroelastic models.
Table 1.
Modal properties of the eight aeroelastic models.
| Test Cases | Frequency
(Hz) | Equivalent Mass
(kg/m) | Structural Damping Ratio (%) | Sc
Number | Wind Direction |
|---|
| 1 | 9.00 | 2.45 | 1.11 | 4.35 | direction I |
| 2 | 7.75 | 3.05 | 1.55 | 7.57 | direction I |
| 3 | 8.31 | 2.69 | 1.91 | 8.22 | direction I |
| 4 | 8.97 | 4.32 | 1.01 | 6.98 | direction I |
| 5 | 8.88 | 2.45 | 1.75 | 6.86 | direction II |
| 6 | 7.69 | 3.05 | 1.54 | 7.55 | direction II |
| 7 | 8.25 | 2.69 | 1.05 | 4.52 | direction II |
| 8 | 9.01 | 4.32 | 1.15 | 7.95 | direction II |
| Disclaimer/Publisher’s Note: The statements, opinions and data contained in all publications are solely those of the individual author(s) and contributor(s) and not of MDPI and/or the editor(s). MDPI and/or the editor(s) disclaim responsibility for any injury to people or property resulting from any ideas, methods, instructions or products referred to in the content. |
© 2023 by the authors. Licensee MDPI, Basel, Switzerland. This article is an open access article distributed under the terms and conditions of the Creative Commons Attribution (CC BY) license (https://creativecommons.org/licenses/by/4.0/).


