Article

ENSO Forcing of Rainfall Erosivity in the Wuding River Basin

State Key Laboratory of Eco-Hydraulics in Northwest Arid Region of China, Xi’an University of Technology, Xi’an 710048, China
*
Author to whom correspondence should be addressed.
Atmosphere 2023, 14(6), 1030; https://doi.org/10.3390/atmos14061030
Submission received: 25 May 2023 / Revised: 6 June 2023 / Accepted: 13 June 2023 / Published: 15 June 2023
(This article belongs to the Section Meteorology)

Abstract

:
Rainfall erosivity (RE) is an important indicator of the ability of rainfall to cause soil erosion and is linked to ENSO through the transport of rainfall. Accurate assessment of RE and improved understanding of RE are essential for soil erosion prediction, optimization of soil and water conservation measures, and ecological management and restoration. Therefore, the Wuding River Basin, a typical ecologically fragile area, is selected as the research area. The erosivity model based on daily rainfall was first used to calculate RE, and the temporal and periodic characteristics of RE are studied. Then the effects of the Southern Oscillation Index (SOI), the Surface Temperature of the Central East Equatorial Pacific Ocean (SST), and the Multivariate ENSO Index (MEI) on RE are explored by using cross wavelet technique. Results indicated that: (1) the concentration of rainfall leads to the largest RE values in summer compared with other seasons, accumulating about 69% of the annual RE; (2) The overall trend of increasing RE in the Wuding River basin is not significant, but shows an abrupt change in 2015; (3) the influence of the SOI and SST indices of ENSO events on RE is significant, which is shown to be a statistically significant correlation (95% confidence level), indicating that ENSO has a strong influence on the changing pattern of RE. These findings are helpful in predicting soil erosion and are significant for developing further erosion control measures.

1. Introduction

Soil erosion refers to the erosion process of soil by external forces such as water and wind, which can lead to soil and water loss, cause land degradation, affect food security, silt rivers, increase the risk of flood disasters, and threaten water security. Globally, soil erosion is the biggest threat to soil function and sustainable development [1,2]. There are many factors that affect soil erosion, among which rainfall is one of the most important influencing factors. A certain intensity of rainfall falling to the surface will form surface runoff, which in turn will cause soil erosion, and the magnitude of its erosion capacity is expressed by rainfall erosivity (RE) [3]. RE characterizes the potential capacity of rainfall to cause soil erosion, and it is an important factor in the general soil loss equation [4]. It is also the basis for analyzing and predicting soil erosion patterns, and has been widely used in studies such as climate change monitoring and soil erosion simulation [5]. Therefore, an accurate assessment of RE and a full understanding of the spatial and temporal distribution patterns of RE in watersheds are of great practical significance for the determination and prediction of potential hazards of soil erosion, optimization of soil and water conservation measures, ecological management and restoration, and agricultural management [6,7].
Rainfall erosivity is considered one of the key input parameters in the Universal Soil Loss Equation (USLE) and the Revised Universal Soil Loss Equation (RUSLE) models [8]. Wischmeier and Smith (1978) defined RE as the kinetic energy E (MJ/ha) and the maximum rainfall intensity (Imax) in a 30-min period, known as the EI30 [9]. The advantage of this method is that the accuracy of the calculation is high, but it requires long series of individual rainfall amount data, while rainfall information is difficult to obtain during the calculation and the data processing procedure is complicated. Later, the method of calculating RE using the product of individual rainfall and rainfall intensity was proposed, which avoids the calculation of rainfall kinetic energy, but requires detailed individual rainfall data and a large calculation effort [10]. Therefore, many scholars began to explore and propose models for calculating RE using daily, monthly, or annual rainfall [11,12]. However, there are limitations in the accuracy of annual and monthly rainfall information for estimating RE, in contrast, the model based on daily rainfall to calculate RE is highly accurate and has been widely used [13]. Among them, the Rainfall erosivity model constructed by Zhang et al. (2002) based on daily rainfall has a high calculation accuracy and has been validated by many scholars at the watershed scale [14,15,16]. However, most of the studies on RE are aimed at revealing the spatial and temporal variation of RE under the changing environment, and the driving mechanism of rainfall erosion force change is less revealed.
The El Niño Southern Oscillation (ENSO) is the most intense sea-air interaction event affecting global climate and is an important factor in climate change. ENSO is an atmospheric circulation mechanism that controls a region and affects regional hydrological elements by altering the movement of rainbands and water vapor transport, which in turn changes the global water cycle and leads to spatial and temporal redistribution of water resources [17,18]. Although ENSO occurs only near the east-central equatorial Pacific, it can induce rainfall anomalies in most parts of the world [19]. And rainfall is not only a source driver of soil erosion, but also a bridge between ENSO and RE [20]. Rainfall intensity and stability tend to vary across regions due to regional differences and different rainfall types. ENSO has a distinct cyclical character, stemming from its air-sea interactions, of which El Niño and La Niña are the extreme phases of its cycle [21,22]. The characteristic values of ENSO are commonly expressed by the Southern Oscillation Index (SOI), the Surface Temperature of the Central East Equatorial Pacific Ocean (SST), and the Multivariate ENSO Index (MEI), which influence rainfall through the variability of these indicators and are also responsible for important factors such as drought, flooding, and erosion [23,24,25]. The direct impact of ENSO on soil erosion mainly comes from the amount and intensity of rainfall, and ENSO exacerbates the probability of extreme rainfall events, and higher rainfall intensity implies stronger erosion. To date, studies on the effects of ENSO on rainfall have been conducted [26,27]. The results show that ENSO shows a significant correlation with rainfall in South Australia, and also causes changes in atmospheric circulation, and global extreme rainfall events increase during El Niño events and decrease during La Niña events, with El Niño events causing more winter rainfall in southeastern China and shifting the summer rain band southward, while La Niña events do the opposite [28,29]. Although the relationship between ENSO and rainfall events is well known, only a few studies have analyzed the direct impact of ENSO on rainfall erodibility [30,31]. Global climate change, and in particular the associated changes in rainfall, has complex implications for RE. Short periods of intense rainfall may increase, leading to more pronounced soil erosion. the IPCC report also concluded that the frequency of intense rainfall events will increase the erosive power of rainfall, which can lead to severe soil erosion and affect erosion rates [32]. The Wuding River basin has low vegetation cover and high specific rainfall in the river section, and the erosion problem due to rainfall erosion is serious and the ecological environment of the basin is very fragile [33]. Therefore, according to the natural conditions of the Wuding River basin, the rainfall erosion force model was utilized to study the changes of RE associated with ENSO events during 1960–2019 in the Wuding River, in order to provide a theoretical basis for the comprehensive management and prevention of soil erosion in the Wuding River basin, and at the same time, provide scientific references for the monitoring and prevention of regional soil erosion and ecological environmental protection.
The main aims of this study are: (1) to study the temporal and periodic variation of rainfall erosivity in the Wuding River basin at different time scales; (2) to explore the trend of RE and to determine whether its stationarity is valid over the period 1960–2019; (3) to assess the influence of the Southern Oscillation Index (SOI), Sea Surface Temperature (SST) and the multivariate ENSO index (MEI) on rainfall erosivity.

2. Materials and Methods

2.1. Study Area

The Wuding River Basin (37°–39° N, 107.7°–110.5° E), located in the northern part of the Loess Plateau, was selected as the study region (Figure 1). With a drainage area of 3.03 × 10⁴ km2 and a total length of 491 km (the average ratio of the main channel is 1.97%), the river is the largest tributary of the Hekou-Longmen section of the Yellow River in China. Originating from the north Shaanxi Province, the Wuding River flows through the Inner Mongolia Autonomous Region and is discharged into the Yellow River in Qingjian County. Affected by the temperate continental monsoon, the Wuding River Basin has an arid and semi-arid climate with hot summer but cold and dry winter. Mean annual temperature ranges from 7.9 °C to 11.2 °C, and the mean annual evaporation is approximately 1100~1400 mm. Mean annual rainfall ranges from 300 mm in the northwest to 550 mm in the southwest, and nearly 65% of rainfall concentrated between July to September with rainstorms.
Geographically, the Wuding River is located at the junction of the southern margin of the Maowusu Desert and the northern Loess Plateau, and is a transition belt from wind-sand to a loess area. Loessial soil (covering 45.6% of the basin) and aeolian sandy soil (covering 54.4% of the basin) are the typical soil types of the basin, which are highly erodible [34]. In the basin, cultivated land, grassland, and desert area dominated the land use cover, and forest land accounted for less than 10% of the whole basin. Extensive rainstorms in summer, coupled with highly erodible loessial soil and sparse vegetation coverage, make the Wuding River Basin the highest soil erosion in the Loess Plateau [35]. The area of water and soil loss in the basin accounts for 76.5% of the total area of the basin, with an average soil erosion rate of 8000 t/km2/a. In order to control water loss and soil erosion, a series of ecological restoration measures have been initiated by the Chinese government since the 1960s, which have greatly improved the underlying surface conditions of the basin, resulting in changes in characteristics of runoff generation and convergence [36].

2.2. Data Collection

There are 4 National Meteorological Observatory in the Wuding River Basin, the distribution of them is shown in Figure 1. Daily rainfall data obtained from these four stations are provided by the National Climate Center (NCC) of the China Meteorological Administration (http://data.cma.cn/) accessed on 1 January 2021. The database in Hengshan, Suide, and Yulin covers the period from 1 January 1960 to 31 December 2019. For the Jingbian station, the daily rainfall data from 1 February 1962 to 1 June 1965 are missing, thus all the calculation results for the Jingbian station are from 1 January 1966 to 31 December 2019.
In this study, to examine the relationship between rainfall erosivity and the ENSO event, the Southern Oscillation Index (SOI), Sea Surface Temperature (SST), and the multivariate ENSO index (MEI) developed by Wolter and Timlin is used [37,38,39]. The MEI, calculated from six observed variables over the tropical Pacific (sea-level pressure, zonal and meridional components of the surface wind, sea surface temperature, surface air temperature, and total cloudiness fraction), is considered to be an inclusive index for monitoring the ENSO event because it integrates more information. The MEI is available from https://www.psl.noaa.gov/enso/mei.old/table.html, accessed on 20 April 2023. The SOI, which is from https://www.ncdc.noaa.gov/teleconnections/enso/indicators/soi/data.csv, accessed on 20 April 2023, is a series of monthly standardized index values for the difference in sea level between Tahiti (13° S, 150° W) and Darwin, Australia (13° S, 130° E) [40]. The SST is from https://www.cpc.ncep.noaa.gov/data/indices/wksst8110.for, accessed on 20 April 2023.

2.3. Methods

2.3.1. Calculation of Rainfall Erosivity

Generally, rainfall erosivity (RE) can be estimated based on the EI30 index, but needs high temporal resolution rainfall data (<60 min) and a complex calculation process [3]. Therefore, in this study, the RE was calculated using a daily RE model with a simple model structure. The model was proposed by Zhang et al. (2003) based on the Richardson daily rainfall erosive agent model, and has been widely used on the national and regional scales in China [6,14,41].
The formula for calculation is as follows:
R E i = α j = 1 k ( P j ) β
where R E i is the rainfall erosivity in the i-th half month (MJ·mm·ha−1·h−1); Each month is separated into two half-months using the fifteenth day as the cut-off point, and thus one year is divided into 24 half-months. k denotes the number of days in the half-month period; P j represents the daily erosive rainfall amount on the j-th day during the half-months. According to a previous study of China, daily rainfall amount exceeding 12 mm is defined as erosive rainfall [16]. In other words, the rainfall that does not erode is excluded from the calculation of rainfall erosivity. This operation greatly reduces the workload of calculating rainfall erosivity and improves the prediction accuracy of soil erosion. Therefore, when the rainfall amount of that day is less than 12 mm, it is regarded as 0. The terms α and β stand for the empirical parameters and can be determined by the following formulas:
β = 0.8363 + 18 . 144 / P d 12 + 24.455 / P y 12
α = 21.586 β 7.1981
where P d 12 and P y 12 are the average values of the daily and annual erosive rainfall for days with rainfall ≥ 12 mm, respectively.
Using Equations (1)–(3), the half-month RE values can be calculated for each station in the Wuding River Basin, and then accumulate them to obtain the annual RE values.

2.3.2. Modified Mann-Kendall Trend Test

The original Mann-Kendall (MK) test is a commonly used non-parametric method for estimating trends in time series [42]. However, the MK method is based on uncorrelated data and the results are easy to be affected by the persistence of time series. Therefore, Hamed and Rao (1998) proposed the Modified Mann-Kendall (MMK) method by containing the lag-i autocorrelation to remove the persistence. In this study, the MMK test was applied for trend detection in rainfall and RE values, and the significance level was set at 0.05 [43].

2.3.3. Heuristic Segmentation Method

The heuristic segmentation algorithm proposed by Bernaola-Galván (2001) is widely used to identify abrupt changes in nonlinear and non-stationary time series [44]. For a given time series X = x1, x2, …, xn, a sliding point moves step by step from left to right along the time series. And then the point divides X into two stationary segments with one on the left and the other right of the point. The mean and standard deviations of the two subseries are then calculated. The difference in their means ( μ L ( i ) and μ R ( i ) ) is estimated by Student-t test statistic:
T ( i ) = | μ L ( i ) μ R ( i ) s D ( i ) |
s D ( i ) = ( ( n L 1 ) s L 2 + ( n R 1 ) s R 2 n L + n R 2 ) 1 / 2 × ( 1 n L + 1 n R ) 1 / 2
where T ( i ) is the statistic representing the difference in mean values when the pointer reaches position i (1 ≤ I < n); s D ( i ) denotes the pooled variance at the position i; n L and ( n R ) is the length of the left (right) subseries.
A larger T value means the more significantly different average values of the left and right time series. The largest T value is a good candidate for the cut point. Then, the statistical significance P ( T max ) corresponding to the largest T is computed:
P ( T max ) { 1 I [ v / ( v + T max 2 ) ] ( δ v , δ ) } η
where η = 4.19 ln ( n ) 11.54 and δ = 0.40 , v = n − 2 are obtained from the Monte Carlo simulations; and Ix (a, b) is the incomplete beta function.
If P ( T max ) is less than a threshold of P0 (typically set to 0.95), the time series will not be split. Otherwise, the time series will be partitioned into two segments, and the iteration of the above procedure on each new subseries continues until P ( T max ) < P0 or the length of the acquired subseries is shorter than the presupposed minimum segment length l 0 (typically set to 25).

2.3.4. Cross Wavelet Analysis

The cross wavelet transform, combined with the wavelet transformation and cross-spectrum analysis, is able to detect the correlation between two-time series and reflect their phase structure and local characteristics in both time and frequency domains [45]. For time series x ( t ) and y ( t ) whose CWTs are separately W t X ( a , τ ) and W t Y ( a , τ ) , the cross wavelet transform is defined as follows:
W t X Y ( a , τ ) = W t X ( a , τ ) W t Y ( a , τ )
where W t Y ( a , τ ) is the complex conjugate of W t Y ( a , τ ) ; The argument of W t X Y ( a , τ ) denotes the delay between x ( t ) and y ( t ) at the time position on the scale a [46]. For more details on the cross wavelet transform, please refer to Torrence and Compo (1998) [47]. In this study, the cross wavelet transform is employed to investigate resonant periods between the RE and the ENSO event.

3. Results

3.1. Changing Characteristics of Annual RE

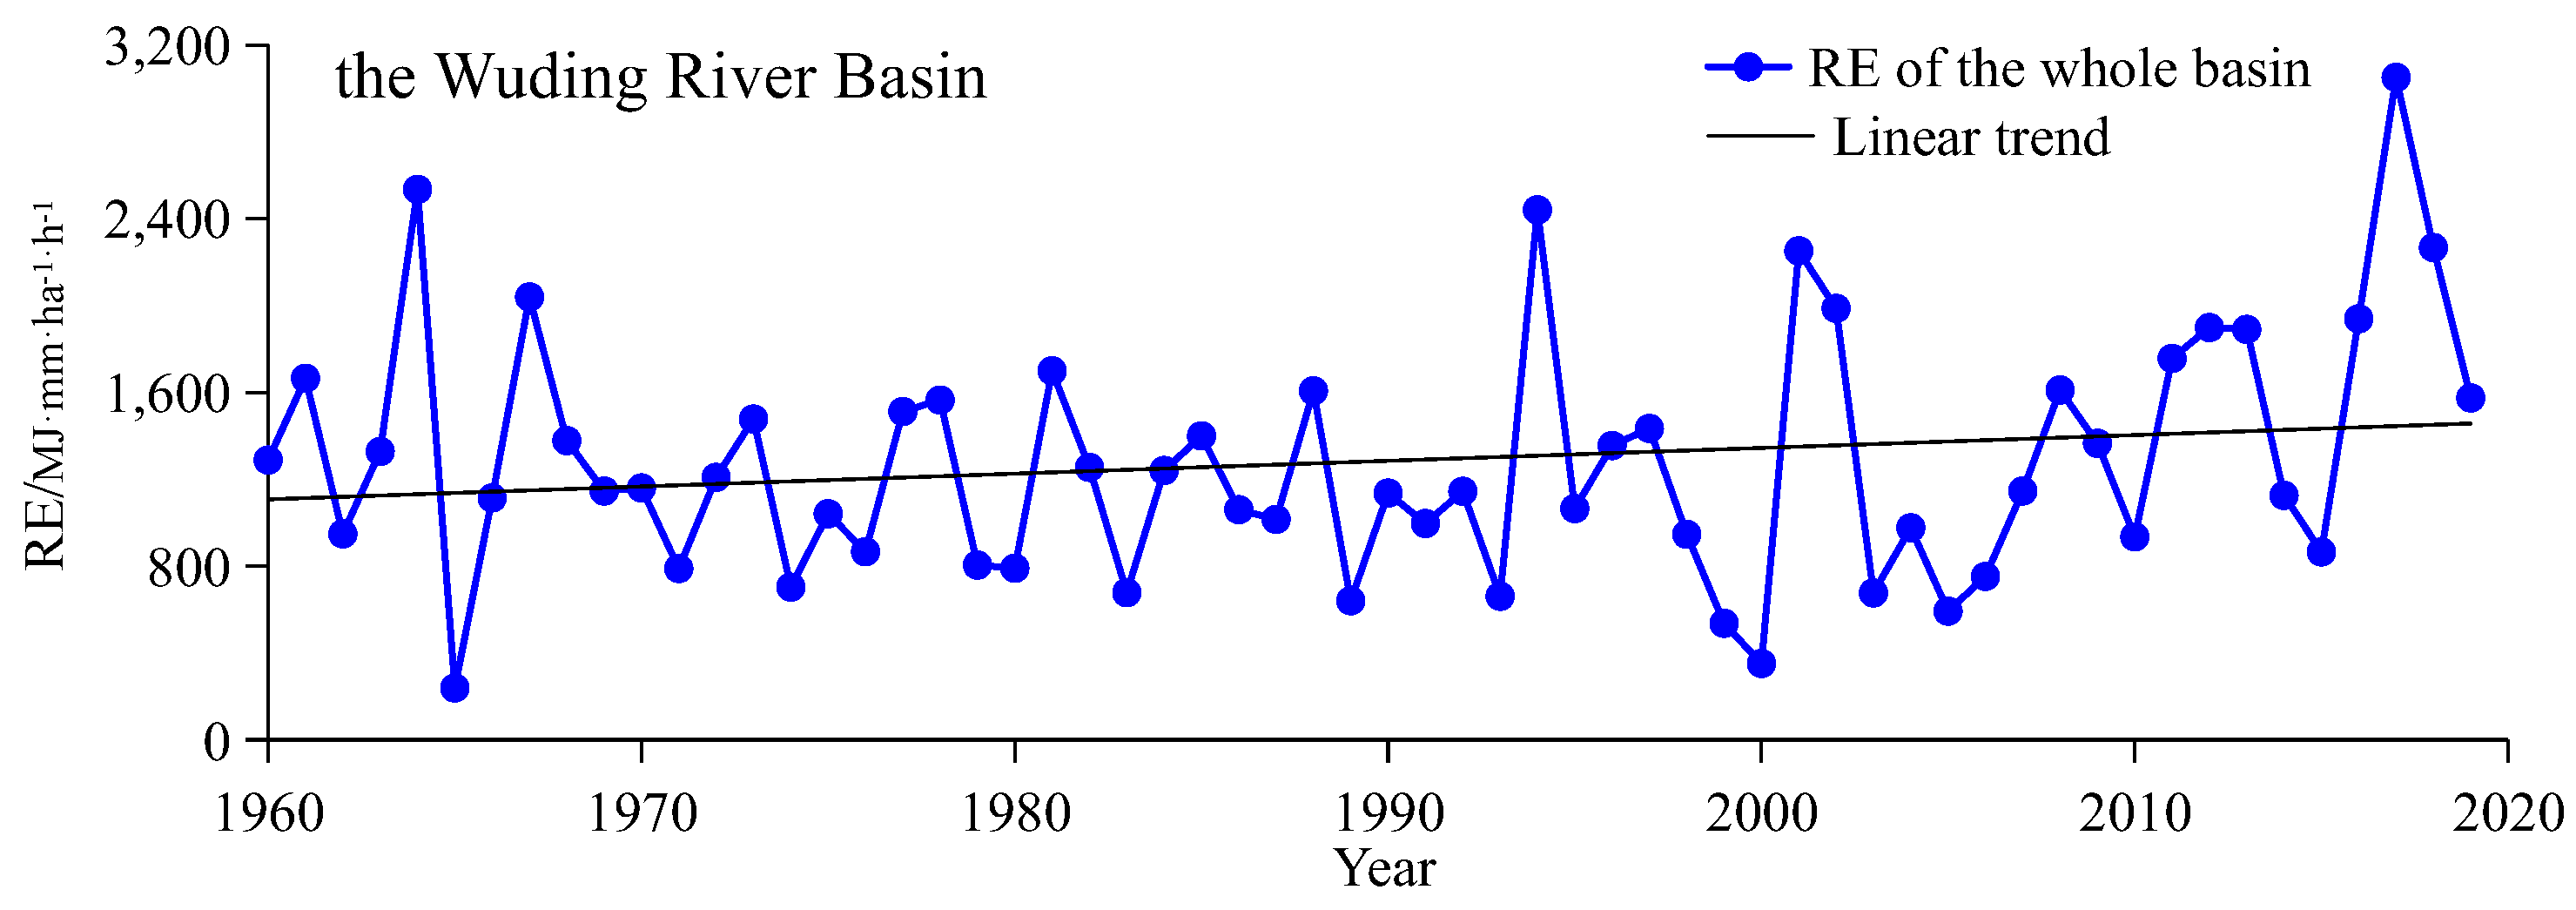
3.1.1. Temporal Trend of Annual RE

The linear trends of rainfall, erosive rainfall, and RE are displayed in Table 1. It can be observed from Table 1 that the rainfall, erosive rainfall, and RE exhibit an obvious temporal variability from 1960 to 2019. The linear growth rate of rainfall in Hengshan, Yulin, and Jingbian is positive, while in Suide it is negative, indicating an upward trend of rainfall in Hengshan, Yulin, and Jingbian while a downward trend in Suide. The maximum linear increasing rate is 15.0 mm/10a, which occurred in Yulin, while the maximum linear decreasing rate is 3.3 mm/10a, which occurred in Suide. The annual erosive rainfall in all four stations show an upward trend, among which Yulin had the largest increase of 14.5 mm/10a, while Suide had the smallest increase of 4.9 mm/10a. The change of erosive rainfall in Hengshan, Yulin, and Jingbian stations is consistent with the rainfall variation. However, for the Suide station, the annual rainfall decreased from 1960 to 2019, while the erosive rainfall increased, indicating that the erosivity of rainfall has not decreased in recent decades, and the risk of soil erosion has not reduced with the decrease of annual rainfall. The linear trend of annual RE is positive in all four stations and shows an order of Yulin > Jingbian > Hengshan > Suide. The maximum linear growth rates appear in Yulin with the value of 115.1 MJ·mm·ha−1·h−1/10a, while the minimum linear growth rates appear in Suide with 17.3 MJ·mm·ha−1·h−1/10a. The trend comparison between annual RE and erosive rainfall shows that the linear trend of RE is mainly consistent with the erosive rainfall. In addition, Figure 2 shows an increasing trend in RE across the basin. According to the MMK test, no significant trend of change in the annual rainfall, erosive rainfall, and RE is detected over recent decades.

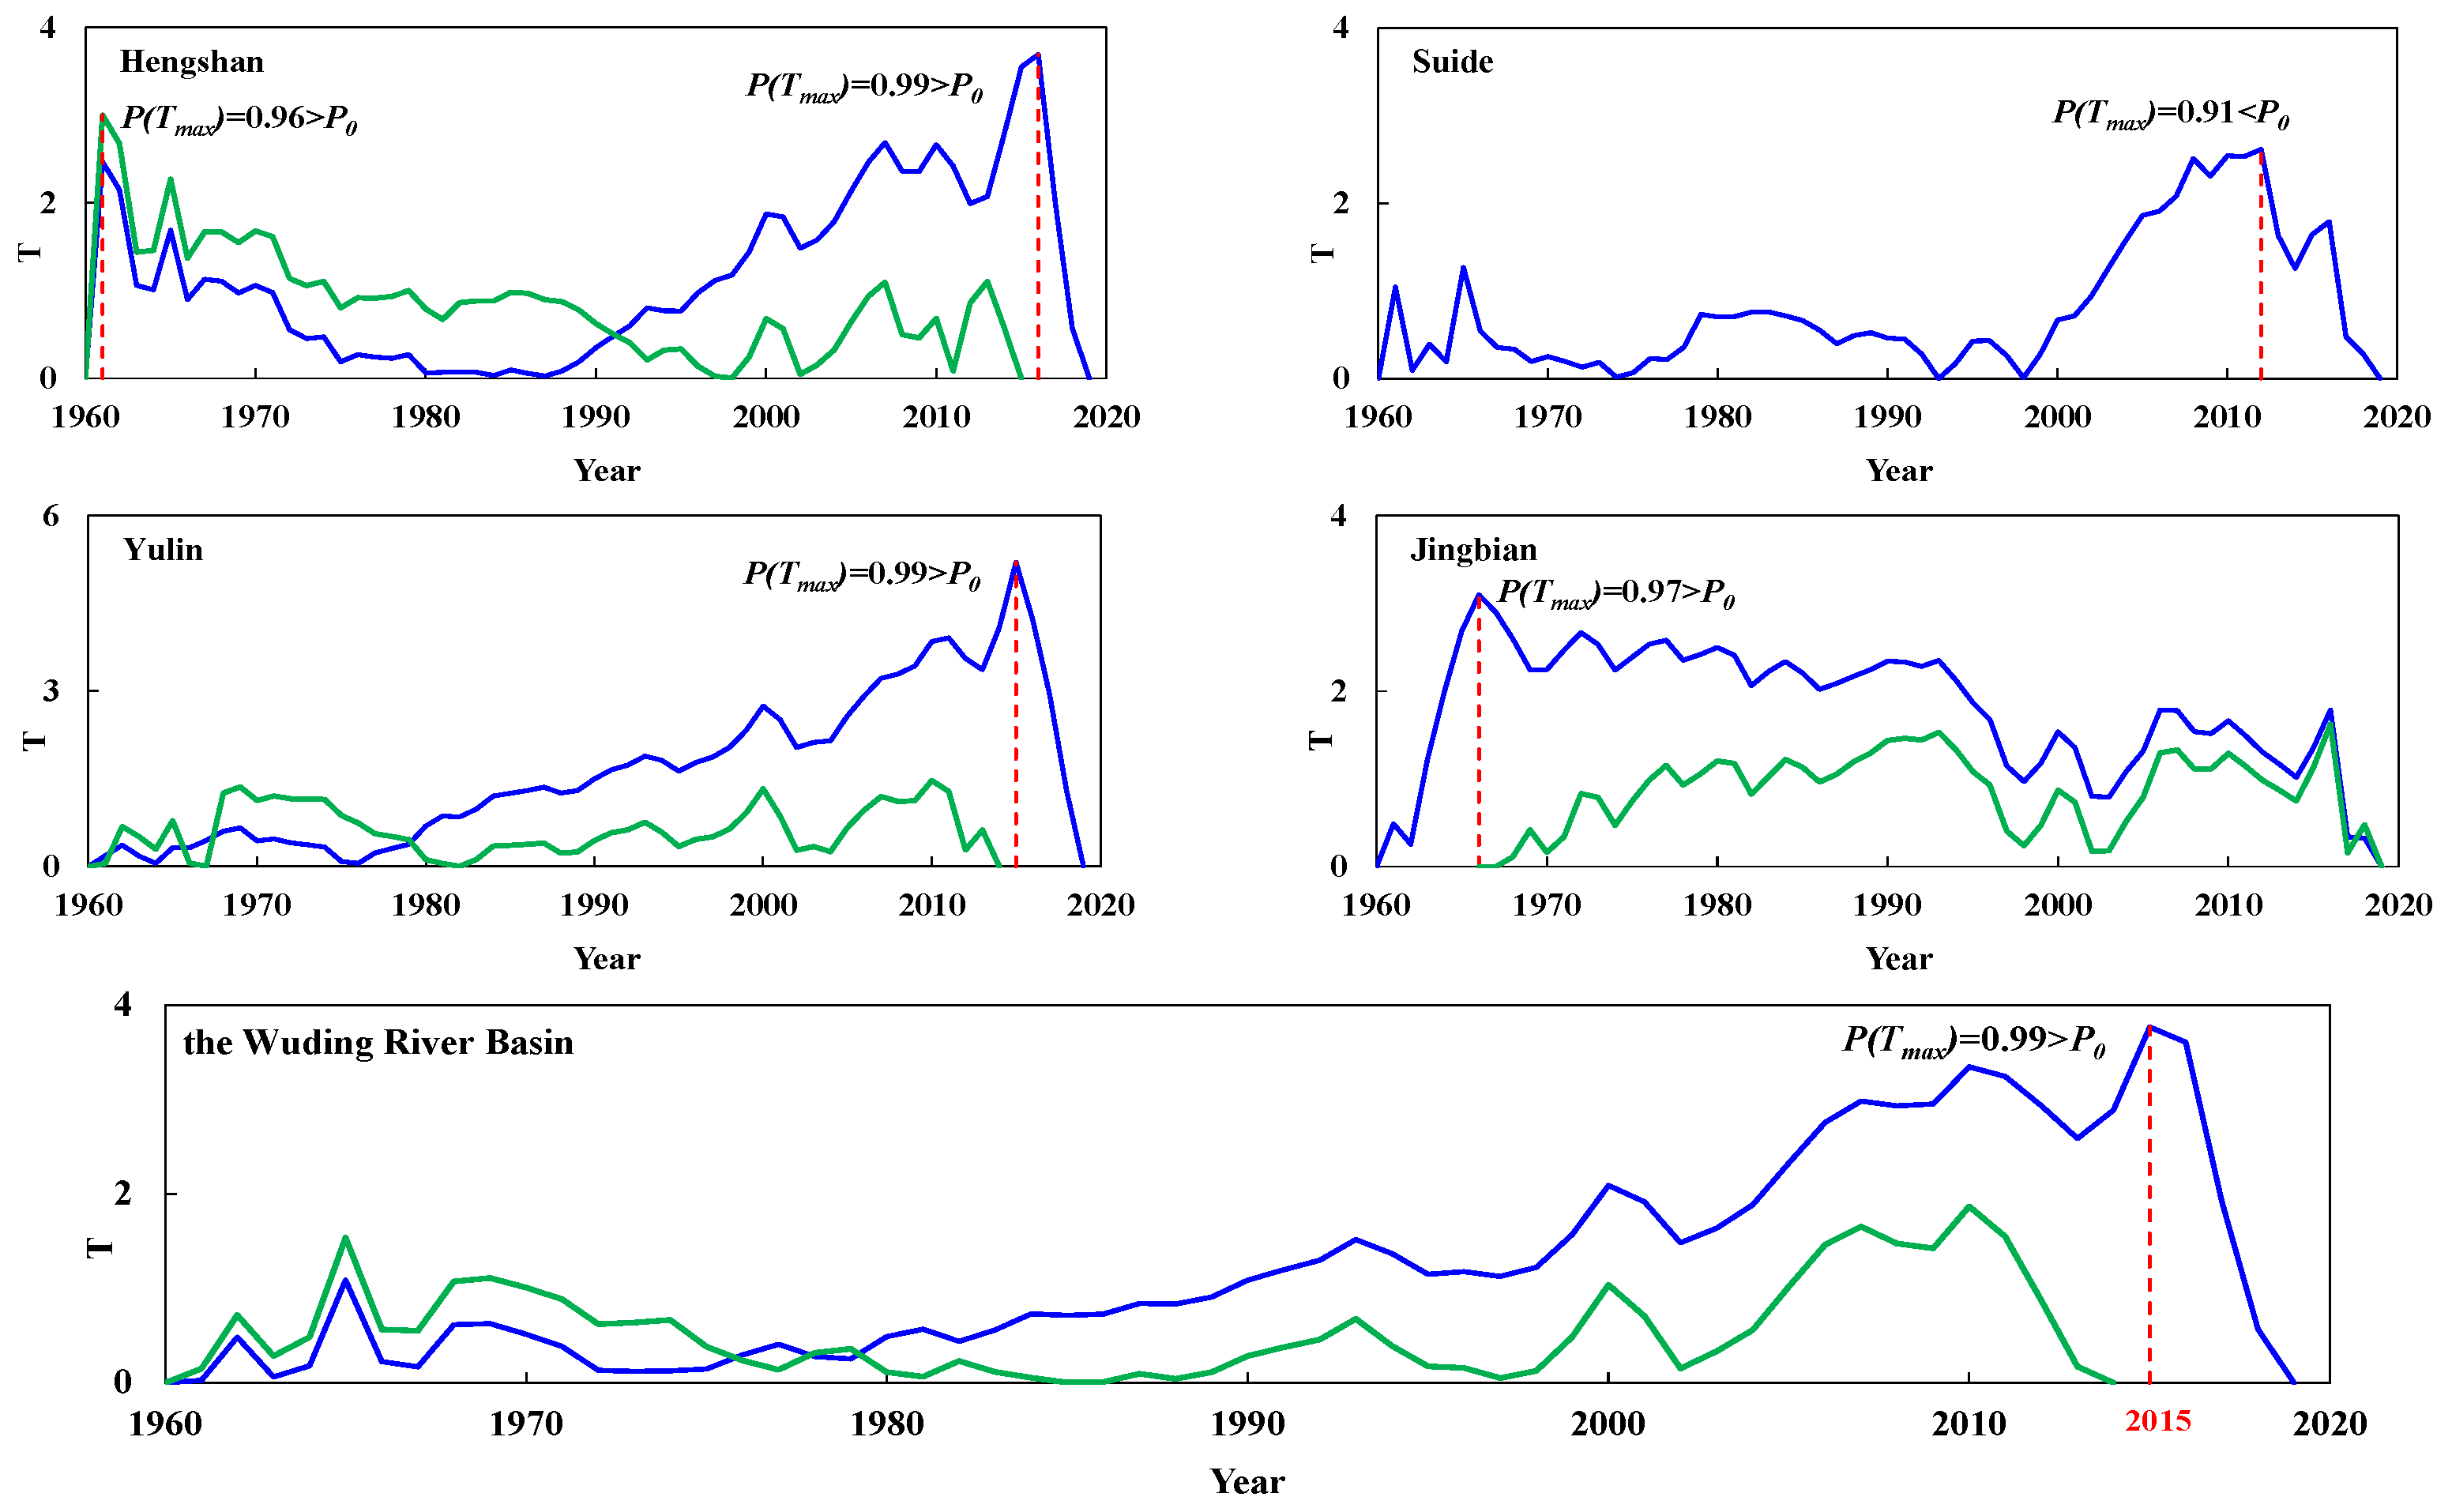
3.1.2. Abrupt Change of Annual RE

In this study, the heuristic segmentation method was used for the identification of breakpoints of annual RE from 1960 to 2019. According to the blue and green solid line illustrated in Figure 3, the maximum T value in the Hengshan station occurred in 1961 and 2016, with the corresponding P(Tmax) up to 0.96 and 0.99, respectively, which is much higher than P0 (0.95). The above indicates that the years 1961 and 2016 are the breakpoints of the annual RE series in the Hengshan station. For Yulin and Jingbian stations, the maximum T value occurred in 2015 and 1966, respectively. Thus, only one breakpoint is detected in Yulin and Jingbian stations. For the Suide station, the maximum T value appeared in 2012, and the corresponding P(Tmax) is 0.91, which is less than P0. This indicates that the year of 2012 is the turning point but not the breakpoint of the annual RE series in the Suide station. We also detect the breakpoint of the annual RE series in the whole Wuding River Basin. According to the blue solid line, we found that the maximum T value appeared in 2015 with the P(Tmax) up to 0.99 which is much higher than P0. Therefore, the breakpoint of the annual RE series in the Wuding River basin is 2015. The annual average RE was 2208 MJ∙mm∙ha−1∙h−1 from 2016 to 2019, representing an 82% increase over the annual average RE of 1215 MJ∙mm∙Ha−1∙h−1 from 1960 to 2015.

3.1.3. Periodic Oscillation of Annual RE

By using the continuous wavelet transform technique, the periodic variation of the annual RE series was identified as illustrated in Figure 4. It can be seen that in the Hengshan station, annual RE oscillating over a 22–40 years band from 1960 to 2019 with a period of 32 years as the main oscillation period. In addition, the inter-annual oscillations of RE over 5–8 years band from 1997 to 2018 was also observed. In the Suide station, annual RE oscillating over the 7–12 years band from 1960 to 1980 with a period of 8.5 years, 13–19 and 22–42 years band from 1960 to 2019 with the dominant oscillation periods of 17 and 32 years. Figure 4c reveals that annual RE in the Yulin station exhibits three dominant periods of 7, 17, and 32 years. For the Jingbian station, significant periods are dominated by the 4, 17, and 31-year scales. Thus, the periodic evolution of annual RE in the Wuding River Basin is generally characterized by 4–8.5 years, 17 years and 31–32 years periods, where the first period is likely to be closely associated with ENSO events.

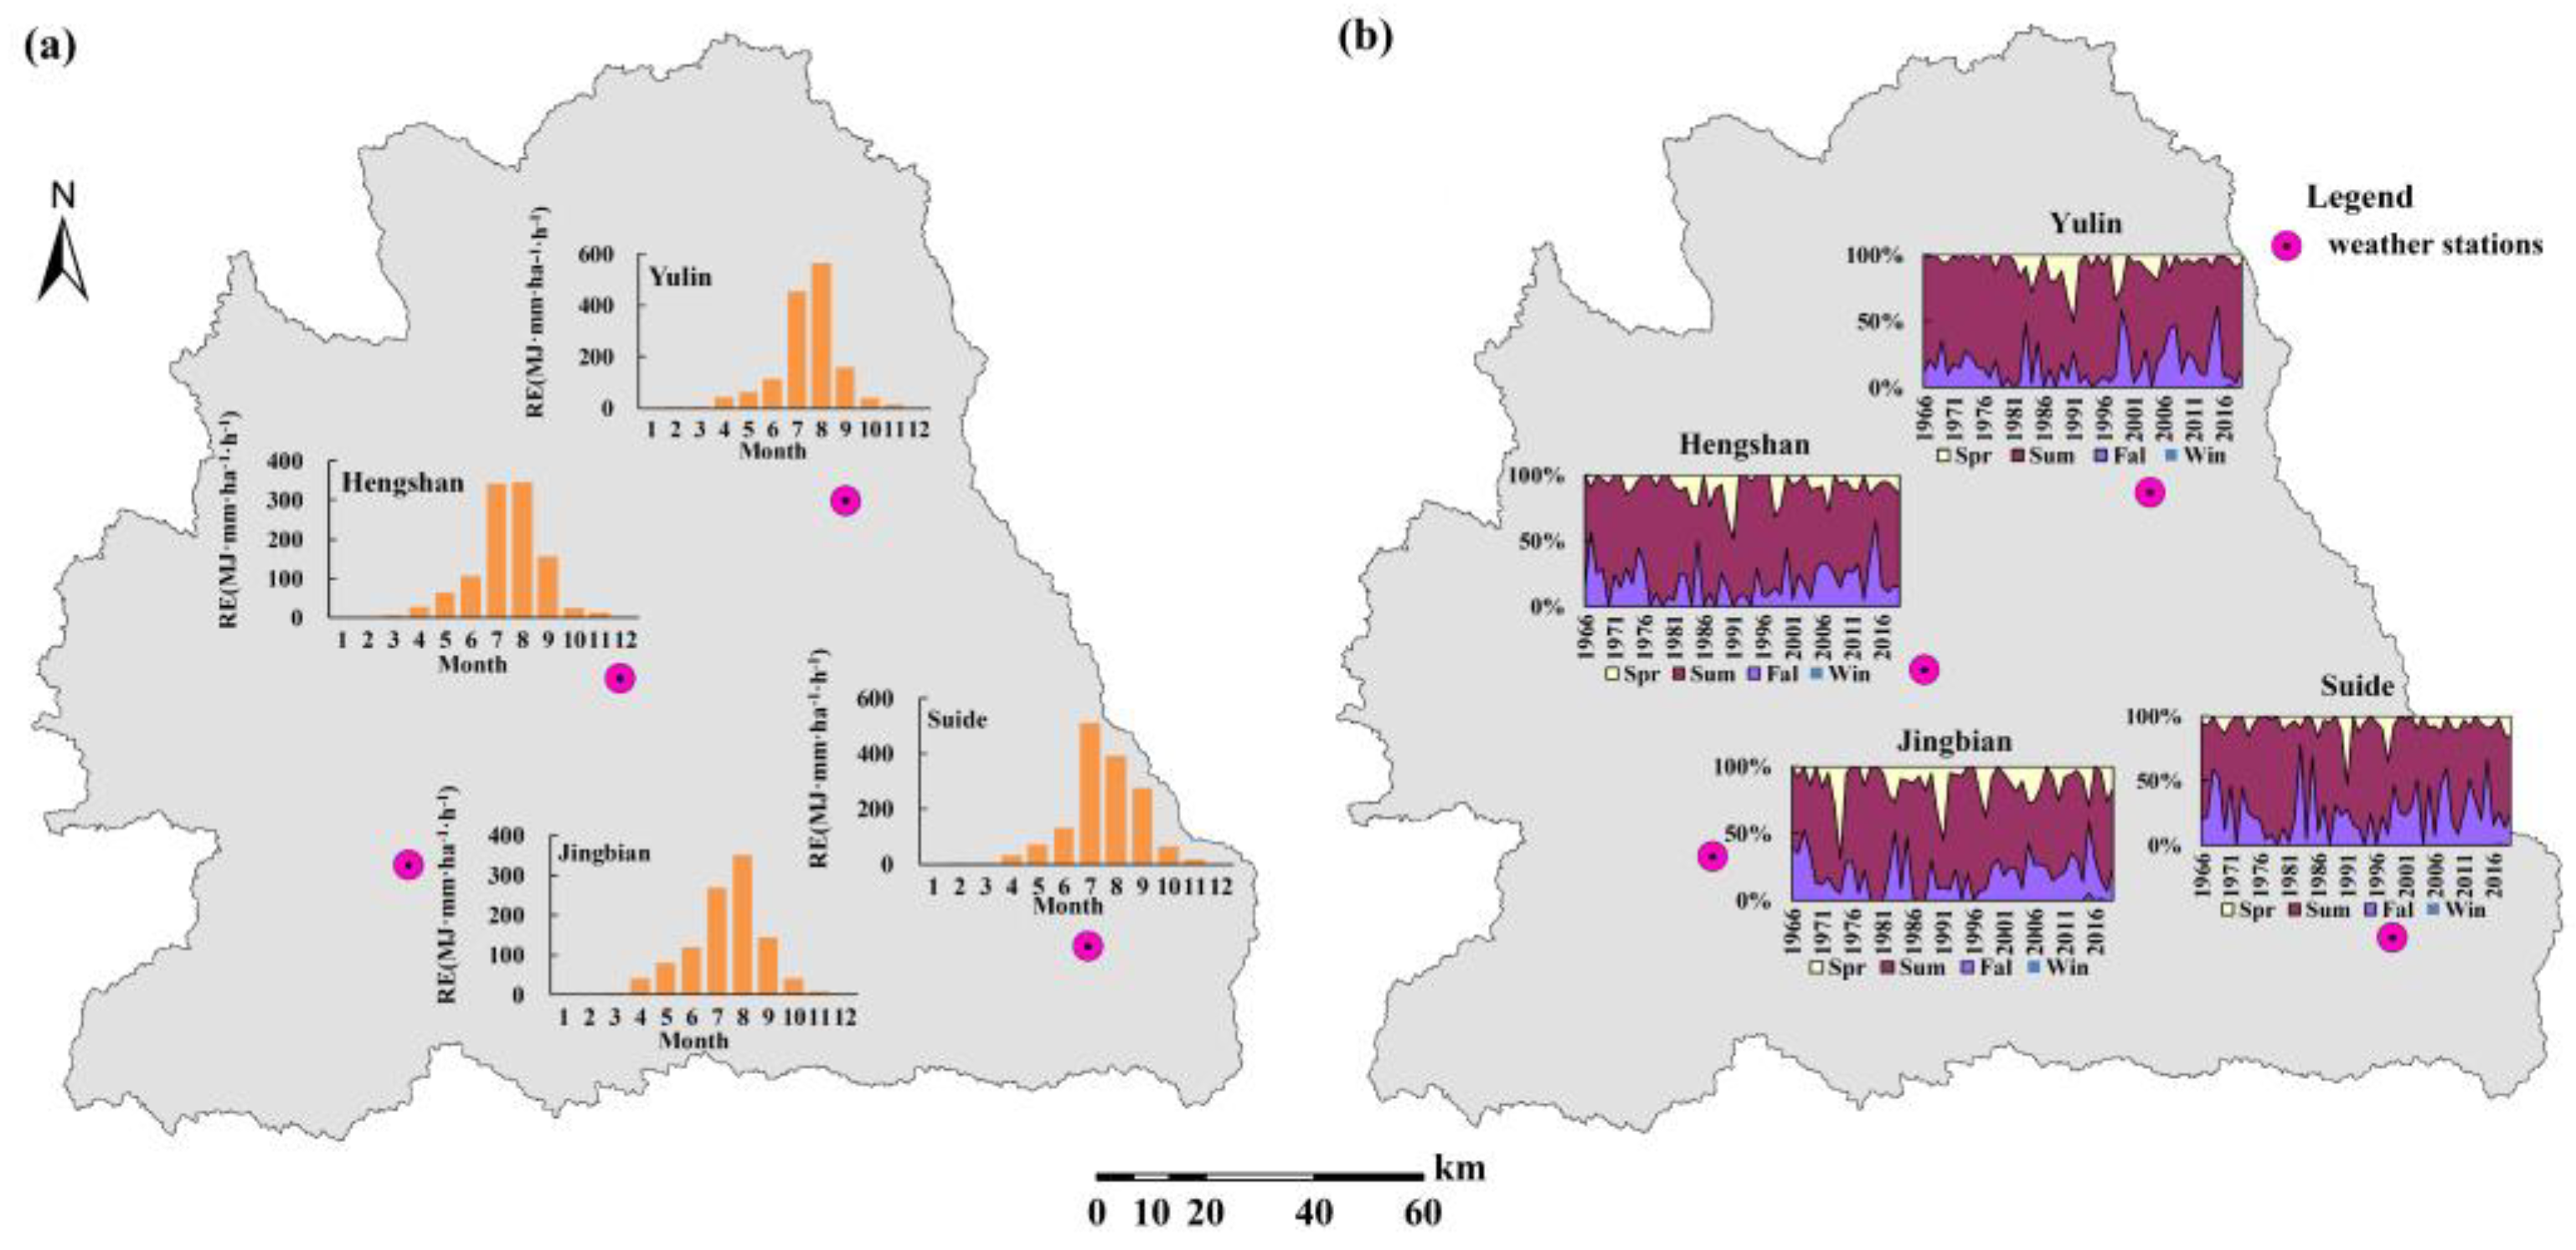
3.2. Changing Characteristics of Monthly and Seasonal RE

Figure 5a shows the distribution characteristics of monthly RE in the Wuding River Basin. The average monthly RE is 91, 125, 121 and 88 MJ mm ha−1 h−1 in Hengshan, Suide, Yulin and Jingbian, respectively. Similar to rainfall, monthly RE has a unimodal distribution, with a peak from July to August and a minimum value in December and January. Generally, RE is concentrated in the months of June, July, August, and September, accounting for more than 83% of the total RE of the whole year. As presented in Figure 5b, the seasonal RE has an obvious difference with an order of summer > autumn > spring > winter in the Wuding River Basin. The highest RE is found in summer, accounting for more than 70% of the total annual RE, while the lowest RE value is observed in the winter, close to 0. The obvious seasonality of RE is mainly affected by seasonal variability of rainfall, with high rainfall that in turn leads to large RE.
The MMK statistic for the month with a high RE value is calculated and the results are presented in Table 2. A positive value of MMK statistic denotes an increasing trend of RE, while a negative value of MMK statistic denotes a decreasing trend of RE. As shown in Table 2, the RE series in July and September shows an increase in the 4 stations, while the RE series in June and August in Suide and Jingbian have a decreasing trend. Among them, the largest increase of RE is found in June in Yulin, while the largest decrease is found in June in Suide. In addition, all the selected monthly RE series detected non-significant trends with the selected significance level of 0.05 in the Wuding River Basin. We also detect the trend of seasonal RE. Results in Table 2 indicate a mixture of positive and negative values of MMK statistics in the Wuding River Basin. The MMK statistics of spring, fall and winter RE are positive, indicating an increase in spring, fall and winter RE. For summer RE, the MMK statistics are positive in Hengshan, Yulin and Jingbian and negative in Suide. This indicates an upward trend of summer RE in the Wuding River Basin except for Suide. Although no significant trend of RE is detected across the basin, the MMK statistics of RE in spring and fall are relatively large, which still reminds policymakers aware of the risk of local soil and water loss caused by climate change.

3.3. Influence of ENSO Events on RE

3.3.1. Influence of Different ENSO Event Types on RE

The ENSO events are typically characterized by SST anomalies exceeding 0.5 °C in the eastern equatorial Pacific (5° N−5° S, 170° W−120° W) and are judged as an El Niño/La Niña event when they last for more than 5 months (SST anomaly ≥ 0.5 °C for El Niño events; SST anomaly ≤ −0.5 °C for La Niña events) [48]. El Niño/La Niña events often indirectly affect climate and cause meteorological disasters in the form of remote correlations. In this study, El Niño (warm) and La Niña (cold) events are determined from the SST anomaly data from 1960–2019, as shown in Figure 6, and the corresponding monthly average RE is obtained, as shown in Table 3.
As shown in Table 3, the overall monthly average RE of La Niña events is 98.31 MJ·mm·hm−2·h−1·a−1, which is higher than the monthly average RE of El Niño events (71.35 MJ·mm·hm−2·h−1·a−1), but the mean values of RE during both La Niña/El Niño are smaller than the overall monthly average RE from 1960–2019 (106.71 MJ·mm·hm−2·h−1·a−1). The monthly mean RE during the 1960–2019 ENSO events fluctuated considerably, reaching a maximum value of 204.43 MJ·mm·hm−2·h−1·a−1 during the El Niño event and a minimum value of 0. Similarly, during La Niña events, the maximum value of RE is 262.13 MJ·mm·hm−2·h−1·a−1 and the minimum value is also 0. The monthly mean RE is also calculated for the ENSO and non-ENSO periods. Results show that the monthly mean RE is 83.15 MJ·mm·hm−2·h−1·a−1 for the ENSO period and 129.51 MJ·mm·hm−2·h−1·a−1 for the non-ENSO period, thus showing that the monthly mean RE for the non-ENSO period is not only greater than that for the ENSO period, but also greater than that for the El Niño event, La Niña event and the whole study period, respectively. This may be influenced by the rainy season, June to September, which is the rainy season in the Wuding River basin and concentrates 65% of the annual rainfall during this period, and more than 60% of the erosive rainfall is also concentrated in this period. The statistical analysis shows that from 1960 to 2019, the total number of months covered by the rainy season is 360, of which 79 months occurs in the ENSO period and 281 in the non-ENSO period, accounting for 22% and 78% of the total number of months in the rainy season, respectively. In other words, the number of rainy season months in the non-ENSO period far exceeds that in the ENSO period. Therefore, when the other factors affecting RE are constant, the monthly average RE in the non-ENSO period is bound to be stronger.

3.3.2. Correlations between ENSO Events and RE

Since ENSO events are closely related to regional precipitation and indirectly have a strong influence on RE at the regional scale. Therefore, studying the detailed correlation between ENSO and RE and its evolutionary characteristics can help reveal the causes of RE changes. Cross wavelet analysis is applied to explore the link between the time series of SOI, SST, and MEI indices and the annual RE in the Wuding River Basin (Figure 7).
It can be seen from Figure 7a that the SOI index shows a significantly positive correlation with RE in the Wuding River Basin with a 2~4 year signal during 1965~1970, which is significant at a 95% confidence level. Additionally, the SOI index also has a significantly negative linkage with RE with a 3~5 year signal during 1995~2002, which is significant at a 95% confidence level, implying that ENSO events are closely associated with RE in the Wuding River Basin. Similarly, Figure 7b shows the cross-wavelet transform between SST and RE in the Wuding River Basin. At the 95% confidence level, there is a significant negative correlation between SST and changes in RE, with a 1~4 year signal for 1964–1972, and a 3.5 year signal for 1985. It also shows a significant positive correlation with a 3~7 year signal for 1996–2005. Unlike the SOI and SST, the MEI index and RE show a negative linkage with the RE series in the Wuding River Basin, with a 2~9 year signal during 2012~2019, but it is insignificant at the 95% confidence level (Figure 7c). The variation of rainfall erosivity is influenced by many factors. Although ENSO occurs only in the equatorial Pacific, its effects can spread globally. In this paper, by analyzing the correlation between annual RE and ENSO index, the resonance cycle of annual RE and ENSO index in the Wuding River basin was identified, which indicates that ENSO events play an important role in causing rainfall erosivity in the Wuding River Basin.

4. Discussion

Rainfall is the main factor affecting rainfall erosivity, and rainfall amount and rainfall erosivity in the Wuding River Basin are significantly correlated, which is consistent with the findings of Sun et al. (2020) related to rainfall erosion forces on the Loess Plateau [49]. The correspondence between rainfall and rainfall erosion force indicates that the spatial and temporal variation of rainfall erosion force depends to some extent on rainfall amount, and when estimating rainfall erosion force based on precipitation data, its estimation accuracy is directly influenced by precipitation characteristics [50,51]. Rainfall varies by altitude due to topographic differences, and the northward shift of the East Asian monsoon due to global warming also causes differences in spatial distribution. The spatial distribution of rainfall and rainfall erosion force in the watershed is generally consistent, which is consistent with the findings of Yin and Xie (2005) [52], further verifying that rainfall is the dominant factor affecting rainfall erosion force [53]. In addition, the spatial distribution pattern of the precipitation erosion rate in this study is consistent with the analysis of Zhang et al. (2021) [54].
Atmospheric oscillation is an atmospheric circulation mechanism that controls the climate of a region, and studying the interrelationship between rainfall erosion force and atmospheric oscillation can help to understand the characteristics of regional rainfall erosion force changes. The cross wavelet transform analysis of rainfall erosion force in the Wuding River basin from 1960 to 2019 shows that there is a significant resonance cycle between rainfall erosion force and ENSO climate index, which indicates that large-scale climate factors significantly influence the inter-annual variation of rainfall erosivity. In recent years, many scholars have conducted studies on the relationship between large-scale climate and precipitation erosivity. Lee et al. (2023) study the rainfall erosivity over the United States, and results show that both warm and cold ENSO events reveal the high significance level of the ENSO-REI correlation with an opposite tendency in monthly rainfall erosivity anomalies [55]. A study on the RE in the Guizhou Province indicates that the degree of rainfall erosion is proportional to the ENSO duration and the longer the ENSO duration, the greater the rainfall erosivity [56]. The above results show that ENSO has a strong driving effect on rainfall erosivity. Therefore, it is of great significance to find out the mechanism of ENSO’s influence on RE for deep understanding and prediction of RE.

5. Conclusions

Rainfall erosivity is one of the key dynamic factors causing soil erosion. Therefore, it is important to evaluate the characteristics of rainfall erosivity in the Wuding River Basin in a changing environment where soil erosion is extremely serious. In this study, the temporal characteristics of rainfall erosivity in the Wuding River basin are analyzed, and then the reasons for the changes in rainfall erosivity are investigated by exploring the link between rainfall erosivity and large-scale atmospheric circulation patterns.
Throughout the study area, the rainfall amount, erosive rainfall, and rainfall erosivity exhibit significant synchronous fluctuations in the Wuding River Basin. On the annual time scale, both erosive rainfall and rainfall erosivity show an increasing trend, but this increasing trend is not significant, and rainfall erosivity shows a significant abrupt change in 2015. On the monthly time scale, the rainfall erosivity in the Wuding River basin is greatest in July and August and least in January, with significant inter-month differences. Seasonal rainfall erosion rates show a sequence of summer > autumn > spring > winter, with summer accumulating about 69% of the annual rainfall erosivity.
The average monthly rainfall erosivity in the Wuding River Basin from 1960 to 2019 is 106.71 MJ·mm·hm−2·h−1·a−1. Comparative analyses of rainfall erosivity indicate that the rainfall erosivity of 129.51 MJ·mm·hm−2·h−1·a−1 during non-ENSO events is higher than that of 71.35 MJ·mm·hm−2·h−1·a−1 during warm ENSO events and 98.31 MJ·mm·hm−2·h−1·a−1 during cold ENSO events, which is mainly influenced by the number of rainy months during non-ENSO and ENSO periods.
From the cross-wavelet transform analysis, it is concluded that rainfall erosivity and SOI have 2~4 year positive phase of the resonant cycle and 3~5 year negative phase of the resonant cycle, with SST there are 1–4 year and 3.5 year negative phase of the resonant cycle, and 3–7 year positive phase of the resonant cycle, while with MEI there is only 2~9 year negative phase of the resonant cycle. Overall, the annual rainfall erosivity in the Wuding River basin from 1960–2019 is strongly correlated with SOI, SST, and MEI, and SOI and SST show more pronounced effects on rainfall erosivity than MEI index, indicating that ENSO events are remote drivers of the evolution of rainfall erosivity and the tropical warming and cooling anomalies in sea surface temperature modulate the annual rainfall erosivity cycle in the Wuding River basin. The results of this study can help to understand the effect of ENSO on rainfall erosivity, and can also provide effective guidance for soil erosion prediction and the development of effective erosion control strategies.

Author Contributions

Conceptualization, J.Z. (Jing Zhao) and J.Z. (Jiayang Zhao); methodology, J.Z. (Jing Zhao); data curation, J.Z. (Jiayang Zhao); writing—original draft preparation, J.Z. (Jing Zhao); writing—review and editing, Q.H. All authors have read and agreed to the published version of the manuscript.

Funding

This research was funded by the National Natural Science Foundation of China, grant number 52009102, and the Young Talent Fund of University Association for Science and Technology in Shaanxi, China, grant number 20220710.

Institutional Review Board Statement

Not applicable.

Informed Consent Statement

Not applicable.

Data Availability Statement

The daily rainfall data used in this study were provided by the National Climate Center (NCC) of the China Meteorological Administration (http://data.cma.cn/) accessed on 1 January 2021. The MEI is available from https://www.psl.noaa.gov/enso/mei.old/table.html, accessed on 20 April 2023. The SOI is from https://www.ncdc.noaa.gov/teleconnections/enso/indicators/soi/data.csv, accessed on 20 April 2023. The SST is from https://www.cpc.ncep.noaa.gov/data/indices/wksst8110.for, accessed on 20 April 2023. The other data can be obtained from the author (Jing Zhao, zhaojing3942727@126.com) upon reasonable request.

Acknowledgments

In this study, the meteorological data and teleconnection data are downloaded from different data centers. The authors express their gratitude for the data sharing of the above datasets. Moreover, sincere gratitude is expanded to the editor and the anonymous reviewers who provide professional comments for this paper.

Conflicts of Interest

The authors declare no conflict of interest.

References

  1. FAO; ITPS. Status of the World’s Soil Resources (Main Report); Food and Agriculture Organization of the United Nations: Rome, Italy, 2015; Available online: http://www.fao.org/3/a-i5199e.pdf (accessed on 20 May 2023).
  2. Wang, S.; Fu, B.J.; Piao, S.L.; Lü, Y.H.; Ciais, P.; Feng, X.M.; Wang, Y.F. Reduced sediment transport in the Yellow River due to anthro-pogenic changes. Nat. Geosci. 2016, 9, 38–41. [Google Scholar] [CrossRef]
  3. Panagos, P.; Ballabio, C.; Borrelli, P.; Meusburger, K.; Klik, A.; Rousseva, S.; Tadić, M.P.; Michaelides, S.; Hrabalíková, M.; Olsen, P.; et al. Rainfall erosivity in Europe. Sci. Total Environ. 2015, 511, 801–814. [Google Scholar] [CrossRef] [Green Version]
  4. Yin, S.; Nearing, M.A.; Borrelli, P.; Xue, X. Rainfall Erosivity: An Overview of Methodologies and Applications. Vadose Zone J. 2017, 16, 1–16. [Google Scholar] [CrossRef] [Green Version]
  5. Renard, K.G.; Foster, G.R.; Weesies, G.A. Predicting Soil Erosion by Water: A Guide to Conservation Planning with the Revised Universal SOIL loss Equation (RUSLE); United States Government Printing: Washington, DC, USA, 1997. [Google Scholar]
  6. Li, X.; Ye, X. Variability of rainfall erosivity and erosivity density in the Ganjiang River Catchment, China: Characteristics and influences of climate change. Atmosphere 2018, 9, 48. [Google Scholar] [CrossRef] [Green Version]
  7. Oliveira, P.T.S.; Wendland, E.; Nearing, M.A. Rainfall erosivity in Brazil: A review (Review). Catena 2013, 100, 139–147. [Google Scholar] [CrossRef]
  8. Wischmeier, W.H.; Smith, D.D. Rainfall energy and its relationship to soil loss Trans. Am. Geophys. Union 1958, 39, 285–291. [Google Scholar] [CrossRef]
  9. Wischmeier, W.H.; Smith, D.D. Predicting Rainfall Erosion Losses: A Guide to Conservation Planning; Agriculture Research. Agriculture Handbook No. 537; US Department of Agriculture, Science and Education Administration: Washington, DC, USA, 1978. [Google Scholar]
  10. Lee, J.H.; Heo, J.H. Evaluation of estimation methods for rainfall erosivity based on annual precipitation in Korea. J. Hydrol. 2011, 409, 30–48. [Google Scholar] [CrossRef]
  11. Renard, K.G.; Freidmund, J.R. Using monthly precipitation data to estimate the R-factor in the RUSLE. J. Hydrol. 1994, 157, 287–306. [Google Scholar] [CrossRef]
  12. Loureiro, N.D.S.; Coutinho, M.D.A. A new procedure to estimate the RUSLE EI30 index, based on monthly rainfall data and applied to the Algarve region, Portugal. J. Hydrol. 2011, 250, 12–18. [Google Scholar] [CrossRef]
  13. Duan, X.; Gu, Z.; Li, Y.; Xu, H. The spatiotemporal patterns of rainfall erosivity in Yunnan Province, southwest China: An analysis of empirical orthogonal functions. Glob. Planet. Chang. 2016, 144, 82–93. [Google Scholar] [CrossRef]
  14. Zhang, W.; Fu, J. Rainfall erosivity estimation under different rainfall amount. Resour. Sci. 2003, 25, 35–41. [Google Scholar]
  15. Huang, J.; Zhang, J.C.; Zhang, Z.X.; Xu, C.-Y. Spatial and temporal variations in rainfall erosivity during 1960–2005 in the Yangtze River Basin. Stoch. Environ. Res. Risk Assess. 2013, 27, 337–351. [Google Scholar] [CrossRef]
  16. Xin, Z.; Yu, X.; Li, Q.; Lu, X.X. Spatiotemporal variation in rainfall erosivity on the Chinese Loess Plateau during the period 1956–2008. Reg. Environ. Chang. 2011, 11, 149–159. [Google Scholar] [CrossRef]
  17. Li, Z.; Fang, H. Impacts of climate change on water erosion: A review. Earth-Sci. Rev. 2016, 163, 94–117. [Google Scholar] [CrossRef]
  18. Limsakul, A.; Singhruck, P. Long-term trends and variability of total and extreme precipitation in Thailand. Atmos. Res. 2016, 169, 301–317. [Google Scholar] [CrossRef]
  19. Mello, C.R.D.; Norton, L.D.; Curi, N.; Yanagi, S.N.M. Sea surface temperature (SST) and rainfall erosivity in the Upper Grande River Basin, southeast Brazil. Cienc. Agrotec. 2012, 36, 53–59. [Google Scholar] [CrossRef] [Green Version]
  20. Lee, J.H.; Julien, P.Y. Influence of the El Nino/Southern Oscillation on South Korean streamflow variability. Hydrol. Process. 2017, 31, 2162–2178. [Google Scholar] [CrossRef]
  21. Infanti, J.M.; Kirtman, B.P. North American rainfall and temperature prediction response to the diversity of ENSO. Clim. Dyn. 2017, 46, 3007–3023. [Google Scholar] [CrossRef]
  22. Krishnamurthy, L.; Vecchi, G.A.; Yang, X.; Van der, W.K.; Balaji, V.; Kapnick, S.B.; Jia, L.; Zeng, F.; Underwood, S. Causes and probability of occurrence of extreme precipitation events like Chennai 2015. J. Clim. 2018, 31, 3831–3848. [Google Scholar] [CrossRef]
  23. D’Odorico, P.; Yoo, J.; Over, T.M. An assessment of ENSO-induced patterns of rainfall erosivity in the Southwestern United States. J. Clim. 2000, 14, 4230–4242. [Google Scholar] [CrossRef]
  24. Paula, G.M.D.; Streck, N.A.; Junior, A.Z.; Eltz, F.L.F.; Heldwein, A.B.; Ferraz, S.E.T. Effect of El Niño/Southern Oscillation on rainfall erosivity in Santa Maria (RS). Rev. Bras. Cienc. Solo 2010, 34, 1315–1323. [Google Scholar] [CrossRef] [Green Version]
  25. Mello, C.R.; Norton, L.D.; Curi, N.; Yanagi, S.N.M. El Niño Southern Oscillation and rainfall erosivity in the headwater region of the Grande River Basin, southeast Brazil. Hydrol. Earth Syst. Sci. 2011, 8, 10707–10738. [Google Scholar]
  26. Cao, Q.; Hao, Z.C.; Yuan, F.F.; Su, Z.K.; Berndtsson, R.; Hao, J.; Nyima, T. Impact of ENSO regimes on developing and decaying phase precipitation during rainy season in China. Hydrol. Earth Syst. Sci. 2017, 21, 5415–5426. [Google Scholar] [CrossRef] [Green Version]
  27. Christine, T.Y.C.; Scott, B.P. The non-linear impact of El Niño, La Niña and the Southern Oscillation on seasonal and regional Australian precipitation. J. South. Hemisph. Earth 2017, 67, 25–45. [Google Scholar]
  28. Ramos, M.C.; Durán, B. Assessment of rainfall erosivity and its spatial and temporal variabilities: Case study of the Penedès area (NE Spain). Catena 2014, 123, 135–147. [Google Scholar] [CrossRef]
  29. Li, C.; Ma, H. Relationship between ENSO and winter rainfall over Southeast China and its decadal variability. Adv. Atmos. Sci. 2012, 29, 1129–1141. [Google Scholar] [CrossRef]
  30. Sen, R.S.; Rouault, M. Spatial patterns of seasonal scale trends in extreme hourly precipitation in South Africa. Appl. Geogr. 2013, 39, 151–157. [Google Scholar] [CrossRef]
  31. Stephenson, T.S.; Vincent, L.A.; Allen, T.; Van Meerbeeck, C.J.; McLean, N.; Peterson, T.C.; Taylor, M.A.; Aaron-Morrison, A.P.; Auguste, T.; Bernard, D.; et al. Changes in extreme temperature and precipitation in the Caribbean region, 1961–2010. Int. J. Climatol. 2014, 34, 2957–2971. [Google Scholar] [CrossRef]
  32. IPCC. Climate Change Impacts, Adaptation, and Vulnerability. In Contribution of Working Group II to the Forth Assessment Report of the Intergovernmental Panel on Climate Change; Cambridge University Press: Cambridge, UK; New York, NY, USA, 2007; p. 84. [Google Scholar]
  33. Duan, L.X.; Huang, M.B.; Zhang, L.D. Differences in hydrological responses for different vegetation types on a steep slope on the loess plateau, China. J. Hydrol. 2016, 537, 356–366. [Google Scholar] [CrossRef]
  34. Han, J.; Gao, J.; Luo, H. Changes and implications of the relationship between rainfall, runoff and sediment load in the Wuding River basin on the Chinese Loess Plateau. Catena 2019, 175, 228–235. [Google Scholar] [CrossRef]
  35. Tian, X.; Zhao, G.; Mu, X. Hydrologic alteration and possible underlying causes in the Wuding River, China. Sci. Total Environ. 2019, 693, 133556. [Google Scholar] [CrossRef]
  36. Zhang, H.; Li, J.; Xin, C.; Li, J. Runoff-sediment Yield Relationship and Variation Characteristics in Wuding River Basin, a Branch of the Middle Yellow River, China. J. Earth Sci. Environ. 2019, 41, 241–252. [Google Scholar]
  37. Allan, R.; Ansell, T. A new globally complete monthly historical gridded mean sea level pressure dataset (HadSLP2). J. Clim. 2005, 19, 5816. [Google Scholar] [CrossRef] [Green Version]
  38. Wolter, K.; Timlin, M.S. Monitoring ENSO in COADS with a Seasonally Adjusted Principal Component Index. In Proceedings of the 17th Climate Diagnostics Workshop, Norman, OK, USA, 18–23 October 1993. [Google Scholar]
  39. Wolter, K.; Timlin, M.S. El Niño/Southern Oscillation behaviour since 1871 as diagnosed in an extended multivariate ENSO index (MEI. ext). Int. J. Climatol. 2011, 31, 1074–1087. [Google Scholar] [CrossRef]
  40. Li, J.; Xie, S.P.; Cook, E.R.; Morales, M.S.; Christie, D.A.; Johnson, N.C.; Chen, F.; D’Arrigo, R.; Fowler, A.M.; Gou, X.; et al. El Niño modulations over the past seven centuries. Nat. Clim. Chang. 2013, 3, 822–826. [Google Scholar] [CrossRef] [Green Version]
  41. Richardson, C.W.; Foster, G.R. Estimation of rainfall erosion index from precipitation amount. Trans. Am. Soc. Agric. Eng. 1980, 26, 0153–0156. [Google Scholar] [CrossRef]
  42. Kendall, M.G. Rank Correlation Methods; Griffin: London, UK, 1955. [Google Scholar]
  43. Hamed, K.H.; Rao, A.R. A modified Mann–Kendall trend test for autocorrelated data. J. Hydrol. 1998, 204, 182–196. [Google Scholar] [CrossRef]
  44. Bernaola-Galván, P.; Ivanov, P.C.; Amaral, L.A.N.; Stanley, H.E. Scale invariance in the nonstationary of human heart rate. Phys. Rev. Lett. 2001, 87, 168105. [Google Scholar] [CrossRef] [Green Version]
  45. Hudgins, L.; Friehe, C.A.; Mayer, M.E. Wavelet transforms and atmopsheric turbulence. Phys. Rev. Lett. 1993, 71, 3279. [Google Scholar] [CrossRef]
  46. Maraun, D.; Kurths, J. Cross wavelet analysis: Significance testing and pitfalls. Nonlinear Process. Geophys. 2004, 11, 505–514. [Google Scholar] [CrossRef] [Green Version]
  47. Torrence, C.; Compo, G.P. A practical guide to wavelet analysis. Bull. Am. Meteorol. Soc. 1998, 79, 61–78. [Google Scholar] [CrossRef]
  48. Kaplan, A.; Cane, M.A.; Kushnir, Y.; Clement, A.C.; Blumenthal, M.B.; Rajagopalan, B. Analyses of global sea surface temperature 1856–1991. J. Geophys. Res. 1998, 103, 18567–18589. [Google Scholar] [CrossRef] [Green Version]
  49. Sun, C.-J.; Wang, J.-R.; Zheng, Z.-J.; Chen, W.; Sun, J.-L. Temporal and spatial distribution characteristics of rainfall erosivity and its influencing factors in the protected area of the Loess Plateau. Arid Land Geogr. 2020, 43, 568–576. [Google Scholar]
  50. Yue, B.J.; Shi, Z.H.; Fang, N.F. Evaluation of rainfall erosivity and its temporal variation in the Yanhe River catchment of the Chinese Loess Plateau. Nat. Hazards 2014, 74, 585–602. [Google Scholar] [CrossRef]
  51. Cui, Y.S.; Pan, C.Z.; Liu, C.L.; Luo, M.J.; Guo, Y.H. Spatiotemporal variation and tendency analysis on rainfall erosivity in the Loess Plateau of China. Hydrol. Res. 2020, 51, 1048–1062. [Google Scholar] [CrossRef]
  52. Yin, S.; Xie, Y. Spatial Variations and Seasonal Distributions of Rainfall Erosivity on Loess Plateau. Bull. Soil Water Conserv. 2005, 25, 29–33. [Google Scholar]
  53. Vrieling, A.; Hoedjes, J.C.B.; van der Velde, M. Towards large-scale monitoring of soil erosion in Africa: Accounting for the dynamics of rainfall erosivity. Glob. Planet. Change 2014, 115, 33–43. [Google Scholar] [CrossRef]
  54. Zhang, Y.; Chao, Y.; Fan, R.; Ren, F.; Qi, B.; Ji, K.; Xu, B. Spatial-temporal trends of rainfall erosivity and its implication for sustainable agriculture in the Wei River Basin of China. Agric. Water Manag. 2021, 245, 106557. [Google Scholar] [CrossRef]
  55. Lee, J.H.; Julien, P.Y.; Cho, J.; Lee, S.; Kim, J.; Kang, W. Rainfall erosivity variability over the United States associated with large-scale climate variations by El Niño/southern oscillation. Catena 2023, 226, 107050. [Google Scholar] [CrossRef]
  56. Zhu, D.; Xiong, K.; Xiao, H.; Gu, X. Variation characteristics of rainfall erosivity in Guizhou Province and the correlation with the El Niño Southern Oscillation. Sci. Total Environ. 2019, 691, 835–847. [Google Scholar] [CrossRef]
Figure 1. Location of the Wuding River Basin.
Atmosphere 14 01030 g001
Figure 2. The inter-annual variation of RE of the Wuding River Basin.
Atmosphere 14 01030 g002
Figure 3. And change points of annual RE in the four stations and the whole Wuding River Basin. The blue solid line and the green solid line refer to the first and second iteration and segmentation process, respectively.
Atmosphere 14 01030 g003
Figure 4. The continuous wavelet transform of the annual RE series in (a) the Hengshan station; (b) the Suide station; (c) the Yulin station; (d) the Jingbian station. In each sub-figure, the left part in each sub-figure is the real parts of wavelet coefficients, and the right part is the wavelet spectrum.
Atmosphere 14 01030 g004
Figure 5. Changing characteristics of the monthly RE (a) and seasonal RE (b) at different stations in the Wuding River Basin. Spr, Sum, Fal, and Win represent spring, summer, fall, and winter, respectively.
Atmosphere 14 01030 g005
Figure 6. The time series of SST anomaly.
Atmosphere 14 01030 g006
Figure 7. Cross wavelet transforms between annual average RE and SOI (a), SST (b), MEI (c) in the Wuding River Basin. The 95% significance confidence level against red noise is exhibited as a thick contour, and the relative phase relationship is denoted as arrows (with anti-phase pointing left, and in-phase pointing right).
Atmosphere 14 01030 g007aAtmosphere 14 01030 g007b
Table 1. Trends of annual rainfall, erosive rainfall, and RE at each station.
No.StationRainfallErosive RainfallRainfall Erosivity
Linear Trend
mm/10a
MMK
Statistic
Linear Trend
mm/10a
MMK
Statistic
Linear Trend
MJ·mm·ha−1·h−1/10a
MMK
Statistic
1Hengshan3.20.795.40.9434.10.58
2Suide−3.3−0.584.90.1817.30.30
3Yulin15.01.9514.51.86115.11.60
4Jingbian6.50.909.41.2167.00.98
Table 2. MMK test for monthly and seasonal RE from 1960 to 2019 at each station.
No.StationMMK Statistic
JuneJulyAugustSeptemberSpringSummerFallWinter
1Hengshan0.521.150.481.231.650.551.680
2Suide−0.990.87−0.870.661.31−0.061.260.36
3Yulin1.710.400.470.541.760.791.540.36
4Jingbian−0.251.57−0.690.811.380.571.450.69
Table 3. Average monthly RE for El Niño and La Niña events during 1960–2019.
No.ENSO EventsTime SpanDuration TimeAverage Monthly ErosivityNo.ENSO EventsTime SpanDuration TimeAverage Monthly Erosivity
1La Niña1964.5–1965.19262.131El Niño1963.7–1964.28123.86
2La Niña1970.7–1972.11994.942El Niño1965.5–1966.41210.52
3La Niña1973.5–1974.715126.563El Niño1968.11–1969.5716.5
4La Niña1974.10–1976.41955.184El Niño1969.8–1969.125130.44
5La Niña1984.11–1985.6828.265El Niño1972.5–1973.210120.84
6La Niña1988.5–1989.513126.486El Niño1976.9–1977.2633.96
7La Niña1995.8–1996.3894.327El Niño1977.9–1978.1514.49
8La Niña1998.7–2001.23245.188El Niño1982.5–1983.614100.23
9La Niña2005.11–2006.350.009El Niño1986.8–1988.11863.97
10La Niña2007.7–2008.61285.0110El Niño1991.6–1992.61345.46
11La Niña2010.6–2011.51279.3411El Niño1994.10–1995.250.00
12La Niña2011.8–2012.3880.9912El Niño1997.5–1998.513133.06
13La Niña2016.8–2016.125237.2613El Niño2002.6–2003.29204.43
14La Niña2017.10–2018.4760.7014El Niño2004.7–2005.3980.6
Average monthly erosivity La Niña98.3115El Niño2006.9–2007.1531.62
Average monthly erosivity El Niño71.3516El Niño2009.8–2010.3899.78
Average monthly erosivity ENSO83.1517El Niño2014.11–2016.41848.85
Average monthly erosivity Non-ENSO129.5118El Niño2018.10–2019.5825.75
Average monthly erosivity during 1960–2019106.71
Disclaimer/Publisher’s Note: The statements, opinions and data contained in all publications are solely those of the individual author(s) and contributor(s) and not of MDPI and/or the editor(s). MDPI and/or the editor(s) disclaim responsibility for any injury to people or property resulting from any ideas, methods, instructions or products referred to in the content.

