Communication

Volatile Organic Compound Emissions from Indoor Fragrance Diffusers

Department of Occupational Safety and Hygiene, Fooyin University, Kaohsiung City 831301, Taiwan
*
Author to whom correspondence should be addressed.
Atmosphere 2023, 14(6), 1012; https://doi.org/10.3390/atmos14061012
Submission received: 8 May 2023 / Revised: 30 May 2023 / Accepted: 8 June 2023 / Published: 12 June 2023
(This article belongs to the Special Issue Analysis of Indoor VOCs and Odours Emission)

Abstract

:
People today spend most of their time indoors; many use fragrances in closed restrooms and bathrooms at home and in public spaces for masking odors. However, volatile organic compounds (VOCs) that are emitted from indoor fragrances have been reported in recent years to pose a risk to health. In this work, microneedle trap samplers (NTSs) were fabricated, packed with sulfonated divinylbenzene (SDVB) adsorbents, and used in passive mode to extract the VOCs that were emitted by bamboo diffusers in fragrance bottles in bathrooms. Instrumental analysis revealed that the main VOCs that were emitted from chemically synthesized fragrances were ethanol (19.2–40.5 ppb), propylene glycol (273.4–527.9 ppb), and 3-ethylbenzaldehyde (3.8–12.4 ppb). Lower indoor air change rates were associated with significantly higher emitted concentrations of VOCs. 3-Ethylbenzaldehyde is a strong respiratory irritant, and outdoor pollutants such as toluene, which escapes from paints, have a negative impact on indoor air quality.

1. Introduction

Modern people spend much more time indoors at work, school, and home than they spend outdoors [1,2,3,4]. Fragrances are often used in family bathrooms and public toilets to obscure odors [2,3,5,6,7]. However, fragrances have been identified as the main cause of indoor air pollution [2,4,6,7,8]. Most of the fragrances that are used in the home are prepared from hydrocarbon compounds, while only a few are extracted from natural products [7]. According to studies [2,7,9], household fragrances usually contain undeclared or inaccurate specified chemical ingredients.
Large amounts of volatile organic compounds (VOCs) are emitted from fragrances and related products during indoor use, and the constituents of fragrance emissions vary significantly [4,10,11]. Wolkoff [7,12] proposed that on-site sampling and experimental analysis should be performed to identify the human health hazards that are associated with VOCs in fragrances. Balducci et al. [4] collected chemicals for 24 h that were emitted from fragrances in two Italian indoor environments, a coffee bar and a private house, using XAD-4 adsorbent cartridges. According to their laboratory analysis using a gas chromatograph that was connected to a mass spectrum detector (GC-MS), carvone was present at 349 ng/m3 (0.176 ppb) in the coffee bar and camphor was present at 157 ng/m3 (0.080 ppb) in the house. Numerous several endocrine disruptors, such as lilialand galaxolide were also detected at the two sites. Singer et al. [10] designed and constructed a 50 m3 experimental chamber that was ventilated at approximately 0.5/h to evaluate VOC emissions from cleaning products and air fresheners. They sampled VOCs using adsorbent tubes that were packed with Tenax TA/Carbosieve SIII, and identified by a GC-MS. The main emitted VOCs were terpene hydrocarbons of which d-limonene and terpinolene were species (around 1000 μg/m3 (457 ppb) over a sampling period of 1 h). Du et al. [11] performed a series of tests on a simulated office (with air exchange rates of 3.5–4.4/h) to study the emissions of VOCs from lemon essential oil in an ultrasonic diffuser. TNX TA-packed TDS tubes were used to adsorb the VOCs in a sampling period of 1 h, and these were examined using GC-MS. d-Limonene and β-pinene were identified at concentrations of 107 ± 36 and 24.1 ± 5.6 ppb, respectively. Such on-site simulation tests enable the VOC emissions of fragrances to be accurately analyzed.
Indoor aroma products can be heated to increase the fragrance of their emissions. Cheng and Lai [13] extracted VOCs that were emitted from heated tea tree essential oil at various evaporation temperatures—27 °C by free diffusion, 60 °C using a ceramic evaporation diffuser, and 100 °C using thermal ceramic wicks. Their experimental results confirmed that the heating temperature greatly affects the amounts of VOCs emitted. Their experiment also revealed that the temperature to which essential oils were heated should be as low as possible to minimize the production of irritant VOC by-products; when the evaporation temperature did not exceed 100 °C, the concentrations of the main by-products, trimethylbenzene and diethylbenzene, that were emitted from the tea tree essential oil were far below the threshold limit values that are set by the National Institute for Occupational Safety and Health (NIOSH). Additionally, diffusers are likely to significantly increase the emissions of VOCs from liquid aroma products. Cheng et al. [14] and Angulo-Milhem et al. [15] studied the characteristics of VOC emissions from aroma products using a small chamber that they designed. Cheng et al. [14] found that liquid fresheners emitted more VOC emissions than granular and ointment fresheners. Angulo-Milhem et al. found that the use of diffusers at room temperature clearly increased the emissions of VOCs from liquid tea tree essential oil [15].
In Taiwan, fragrance bottles (Figure 1) are often used in restrooms and bathrooms, and several sticks of diffusers are inserted into them to promote the emission of aroma components. According to the research aforementioned results, the emitted concentration of VOCs from indoor fragrances is significantly different when the sampling location is in an exposure chamber or an indoor environment. In order to characterize VOC emissions from a fragrance bottle, a glass chamber and needle trap samplers (NTS, in Figure 2) were used to extract the emitted VOCs, and the samplers were then delivered to a laboratory to identify the emitted compounds. Additionally, the fragrance bottle with diffusers was placed in the bathroom of a rental building and the emitted VOCs were sampled continuously for four to five days. The tests, including sampling in a simulated environment and in the field, supported a preliminary assessment of the health hazard that is faced by users who are exposed to this fragrance in a bathroom.

2. Materials and Methods

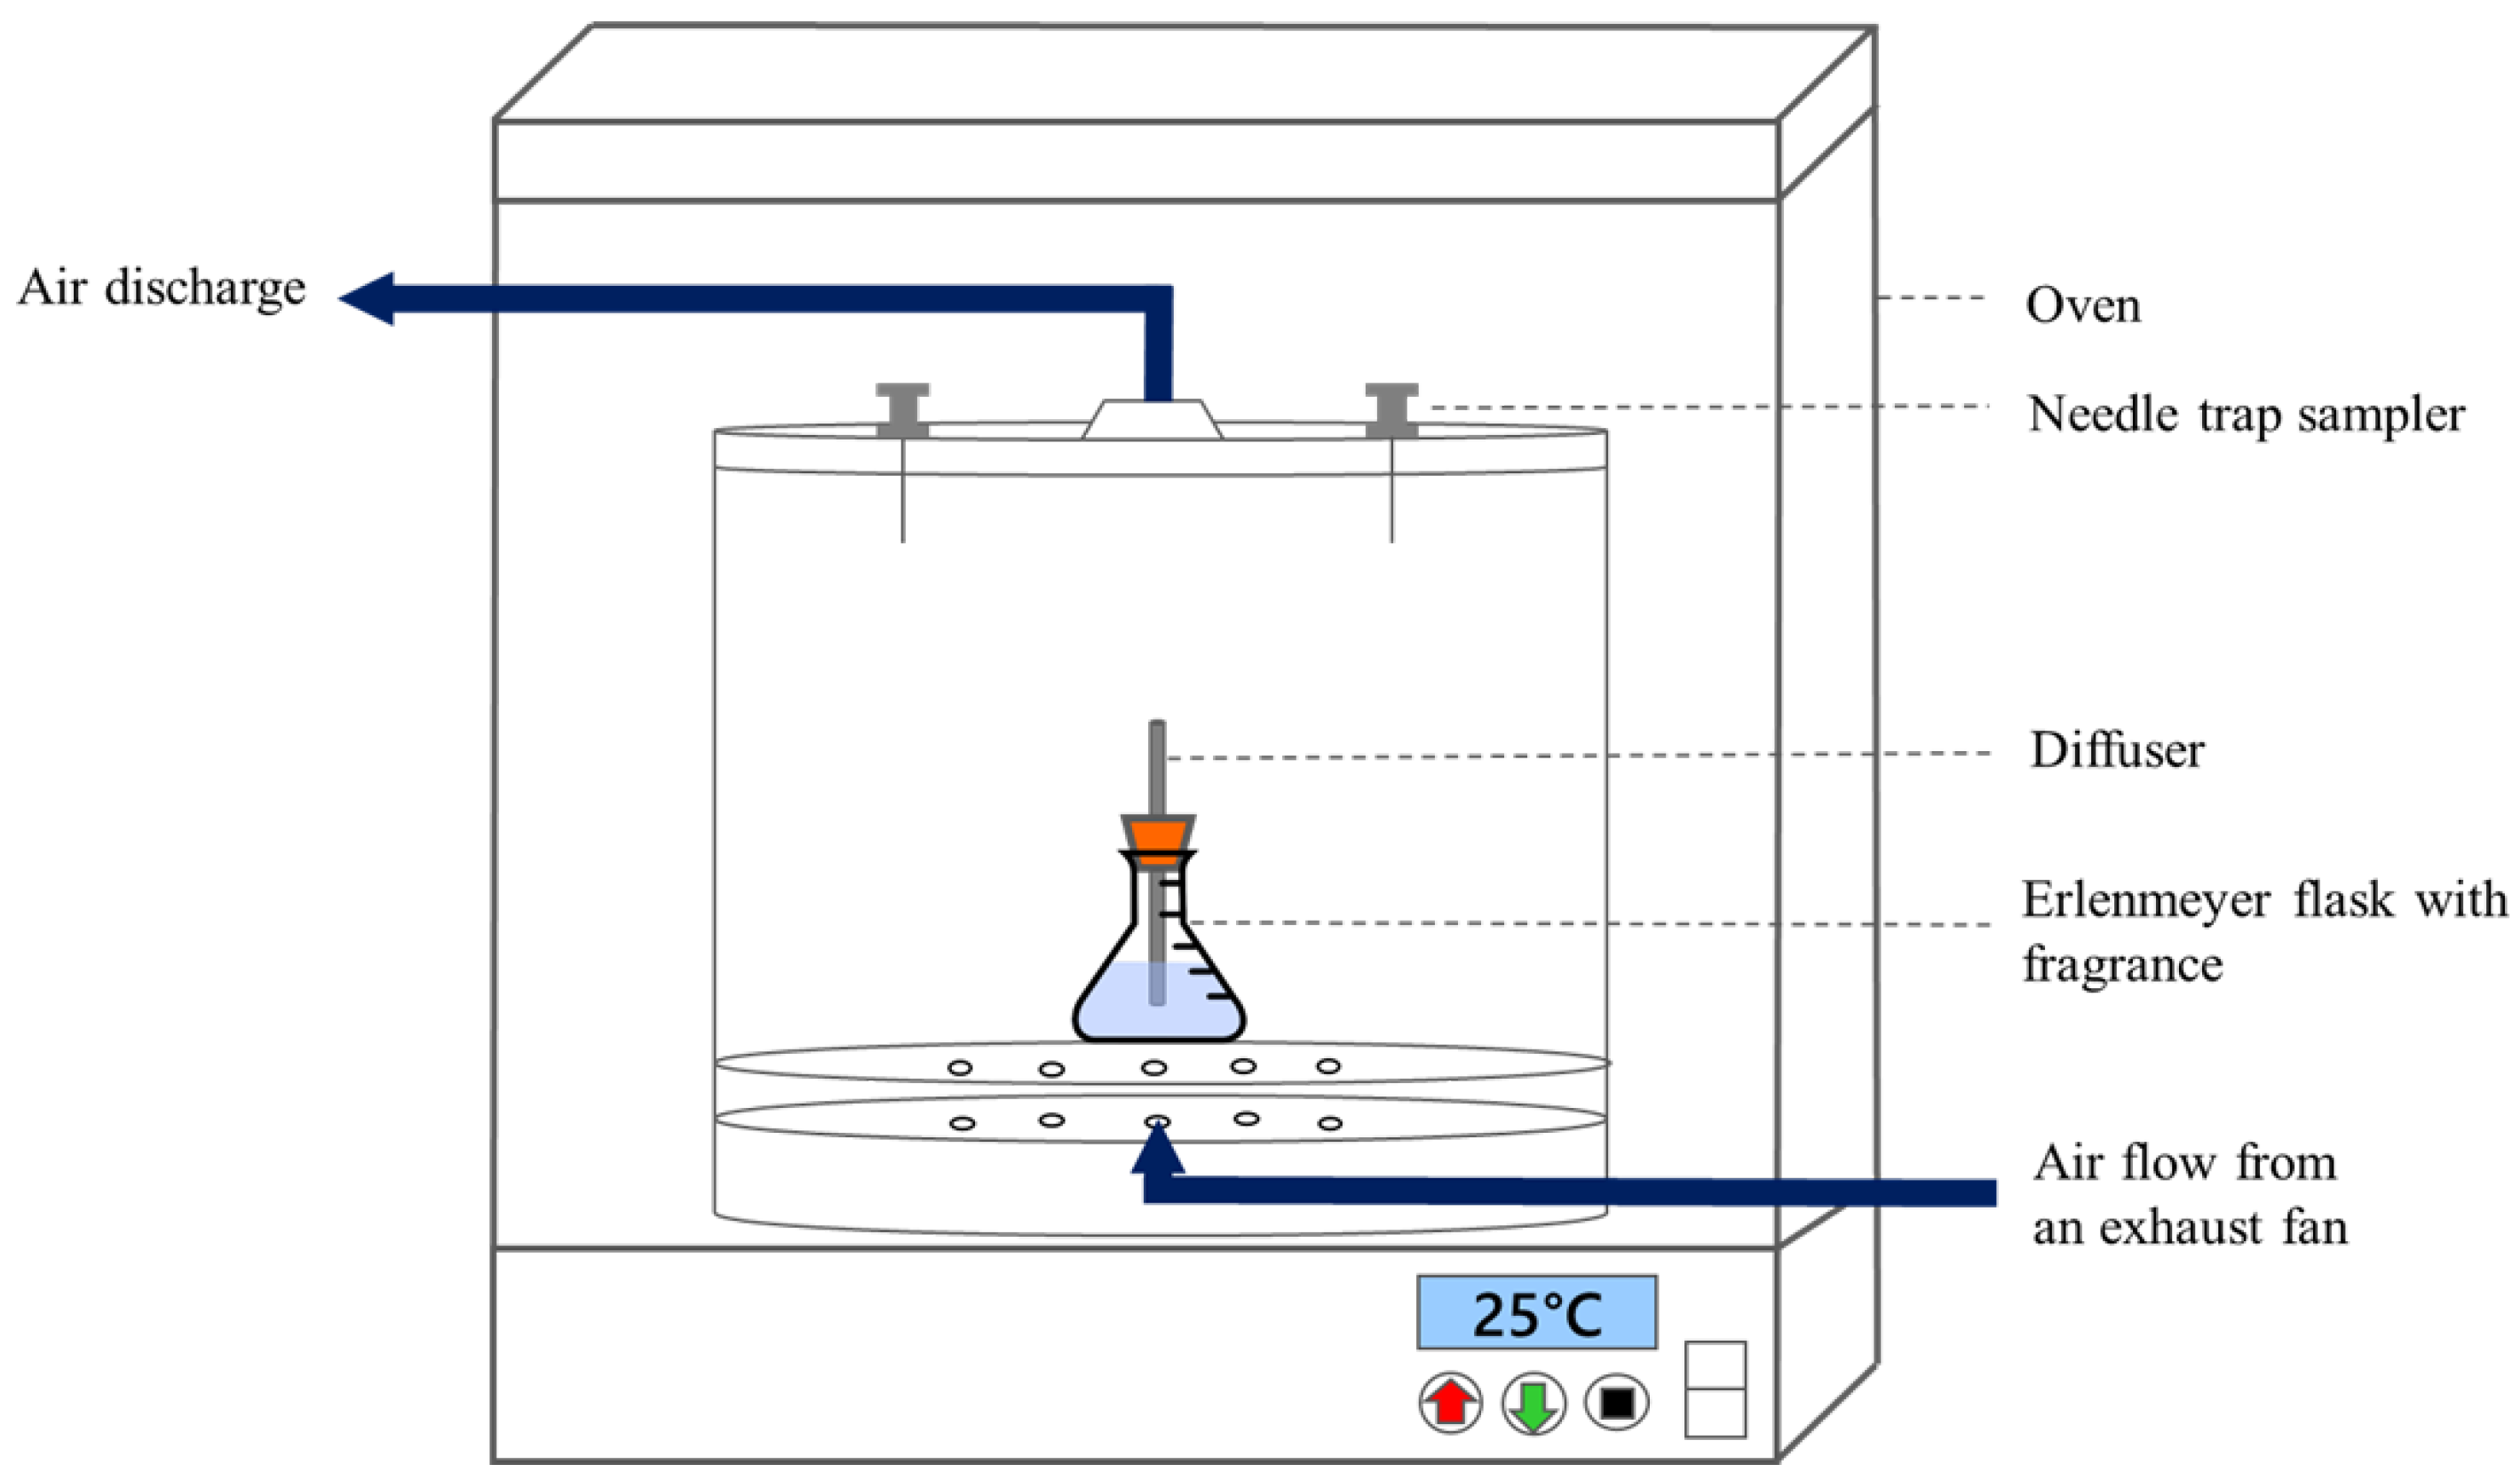
2.1. Sampling in a Control Chamber and in the Field

Based on previous research [11,13,14,15,16,17], emitted compounds from indoor VOC fugitive sources within a controlled space were collected using a circular glass chamber (inner dimensions: diameter, 30 cm; height, 30 cm; total volume: approximately 18 L). Air was pumped into the chamber at a flow rate of 0.8 L/min. To accurately measure the volume of liquid fragrance, a 250 mL Erlenmeyer flask was used to hold the liquid for testing, as shown in Figure 3. Notably, only one diffuser stick was used in a batch of diffusion tests. The temperature in the chamber was kept at 25 °C using a thermostatic oven. The NTSs were inserted into the chamber to adsorb VOCs in a passive sampling mode.
Field samplings were carried out in bathrooms A and B in a students’ rental building. Figure 4 presents the layouts and inner dimensions of the bathrooms. Typically, the bathrooms are ventilated by starting an exhaust fan when the user turns on the light and allowing air to flow through the open window. To collect representative air samples that contain a sufficient amount of VOCs, the software SolidWorks [18] was used to simulate and draw the streamlines of the indoor airflow. Based on the results of this simulation using SolidWorks, the NTSs were placed downstream of the fragrance bottle on the sink. The normal frequencies of use of the toilet and sink were maintained, but bathing was temporarily halted to prevent the bathing products from interfering with the analysis of the VOCs.

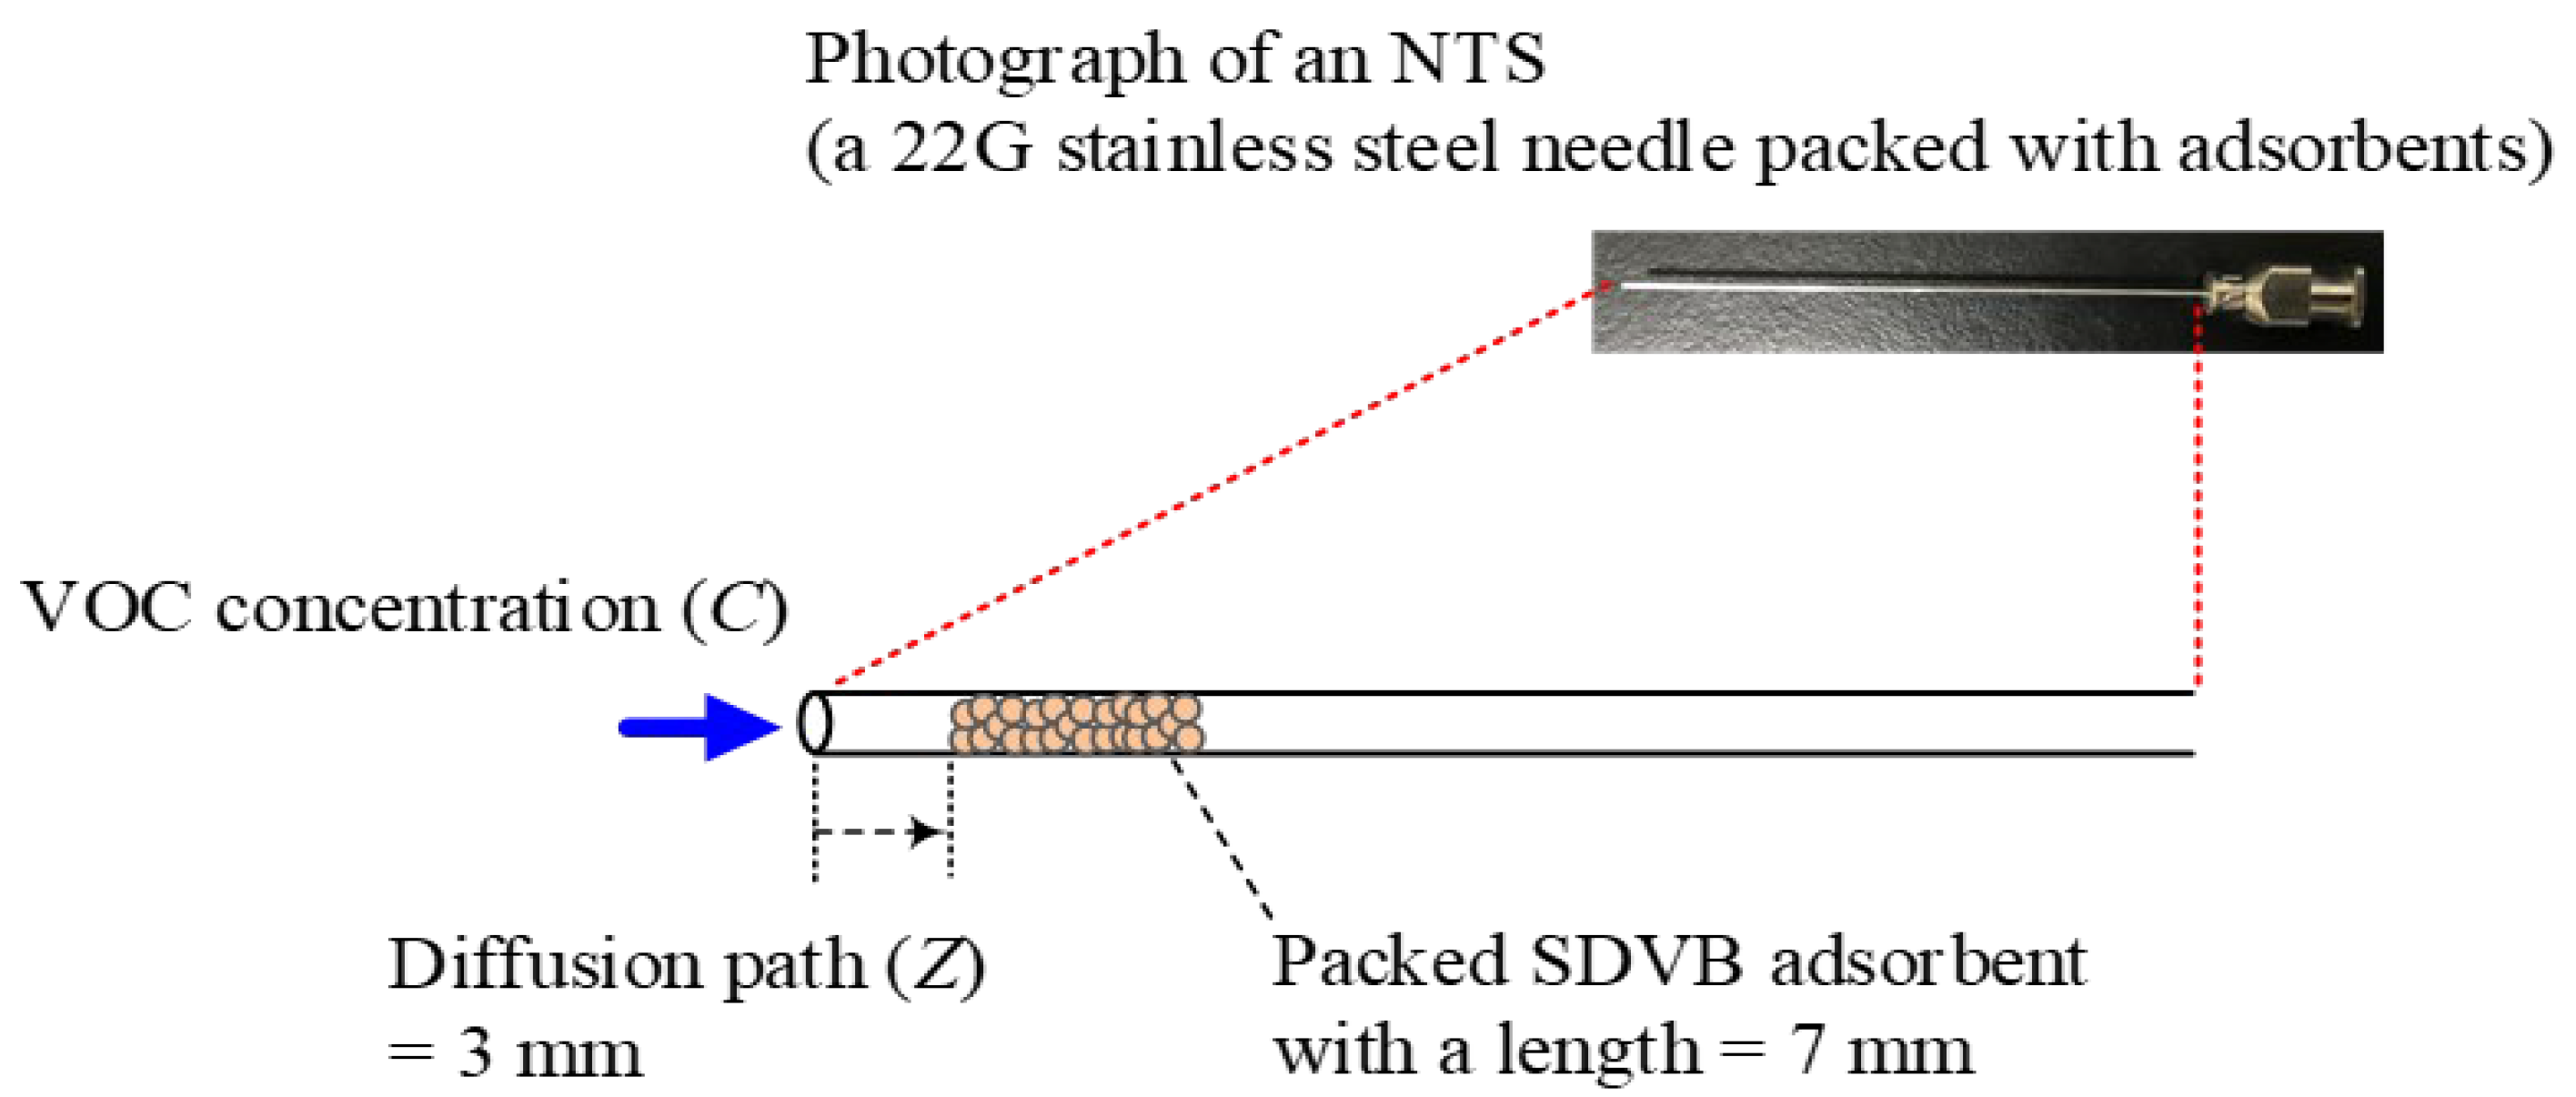
2.2. Preparation of Needle Trap Samplers for Extracting VOCs

A novel micro adsorption sampler, an NTS, was used to extract the VOCs that were emitted by the fragrances. Figure 2 displays the structure of an NTS in detail. Each NTS was made from locally purchased 22G stainless steel needles (ID 0.41 mm and OD 0.71 mm), and 60–80 mesh divinylbenzene (DVB, Bellefonte, PA, USA) particles were packed inside it as an adsorbent. Sulfonation had been conducted in advance to increase the affinity of DVB for hydrophilic VOCs. Sulfonated DVB (SDVB) has been proven to adsorb alcohol and ketone better than pure DVB [19].
Following Lord et al. [20], the VOCs were extracted through the needle in an NTS by diffusion; during this process, the linear VOC concentration profile (C(Z), Figure 2) was established along the diffusion path (Z), and the volume of the adsorbent phase is characterized by the opening area (A) and the diffusion path length. The total amount of analyte that was extracted (n) during time interval (t) is estimated using Equation (1) [20].
n = D m A Z C t d t
where Dm are the diffusion coefficients of components that were sampled by the adsorbents inside the needle. The quality of the extracted analyte is expected to be proportional to the integrated sample concentration over time (C(t)) for a constant Dm, a uniform needle opening, and a uniform diffusion path length. Equation (1) is valid only when the amount of adsorbed analyte is a small fraction of the equilibrium amount for the concentration of VOCs in the sample.
The procedure for fabricating an NTS that was developed by Cheng et al. [19,21] was followed exactly. When the laboratory member made an NTS, they had to use the negative pressure pump to suck the SDVB adsorbent particles into the stainless steel needle almost one by one. When the packed adsorption layer of SDVB was up to 0.7 cm (Figure 2), it was fixed with a very small amount of glue and then dried for at least one day for use. All NTSs that were completely prepared in the laboratory were examined to ensure that they provided the desired sampling flow rates when the air was drawn using an aspirating pump (AP-20, Kawasaki, Japan) through the packed phase. When the relative standard deviations (RSDs) across the triplicate tests of the sampling flow rates did not exceed 5%, the SDVB in the NTSs was considered to be uniformly immobilized. Additionally, the reproducibility was verified by comparing the adsorbed masses of standard mixed VOCs (ethanol, methyl ethyl ketone (MEK), benzene, toluene, ethylbenzene, and o-xylene (BTEX)) in different NTSs, with the RSD limit set to 5% for a batch of fabricated samplers.

2.3. Chemicals, Materials, and Analysis of VOCs

A commonly used fragrance with the smell of freesia and English pear in a bottle and two types of long-stick diffusers (polyester and bamboo) were purchased in a shopping mall in Kaohsiung City, Taiwan. All gases (Jing-De Gas Co., Ltd., Kaohsiung, Taiwan) that were used in the chromatographic analyses were of ultra-high purity. All chemicals that were used in the qualitative and quantitative analysis and sulfonation synthesis were obtained from Sigma-Aldrich (Munich, Germany).
In order to confirm the VOC adsorption efficiencies of the self-fabricated NTSs, each NTS was initially tested for qualification. The tested NTSs for extracting ethanol, MEK, and BTEX was inserted into the injection port of a gas chromatographer that was equipped with a flame ionization detector (GC-FID, 6890N, Agilent, Wilmington, DE, USA) to desorb VOCs for analysis. The desorption time and temperature at the injection port were 30 s and 250 °C, respectively. The temperature of the GC was increased from 50 °C in increments of 15 °C/min to 180 °C, which was held for 2 min. The FID detector was heated to 300 °C. The flow rate of the carrier gas, nitrogen, was 1.2 mL/min. The splitless operating mode was used for analysis. These analysis procedures confirmed no carryovers of analytes based on Cheng et al.’s studies [13,14,19,21] and this work. Unknown emitted compounds that were emitted from fragrances that were sampled using the NTSs were identified to determine the constituents using another GC, which was connected to a mass spectroscopy detector (MS 5973, Agilent). Blank tests for the gas chromatographic instruments were also conducted before daily analysis work, and the instrument was confirmed ready for analysis if no peaks were detected.
To conduct a calibration analysis of the air sample that was taken using an NTS in the passive sampling mode of mass diffusion, the assistant in the laboratory prepared chemicals at specified concentrations (C1) in a glass bulb and used an NTS to adsorb VOCs from the bulb for analysis by GC-MS with an extraction time of 60 min by mass diffusion. The concentration of VOCs (C2), that were identified using an NTS, was determined using a proportional relationship by substituting the integrated area under the diagram peaks of GC-MS analysis from the calibration analysis into Equation (2):
C 2 = A 2 A 1 × 60 t × C 1
where the area obtained by NTS analysis using GC-MS is A1; A2 is the area obtained by VOC analysis following NTS sampling in the chamber or in the field; and t (min) is the extraction time with the NTS in the sampling period. From the minimum detected signals which were examined by the GC-MS, the method detection limits (MDLs) for the VOCs that were sampled by the NTS in passive sampling mode were: BTEX = 8 ppb, ethanol = 15 ppb, propylene glycol = 20 ppb, and 3-ethylbenzaldehyde = 2 ppb.

3. Result

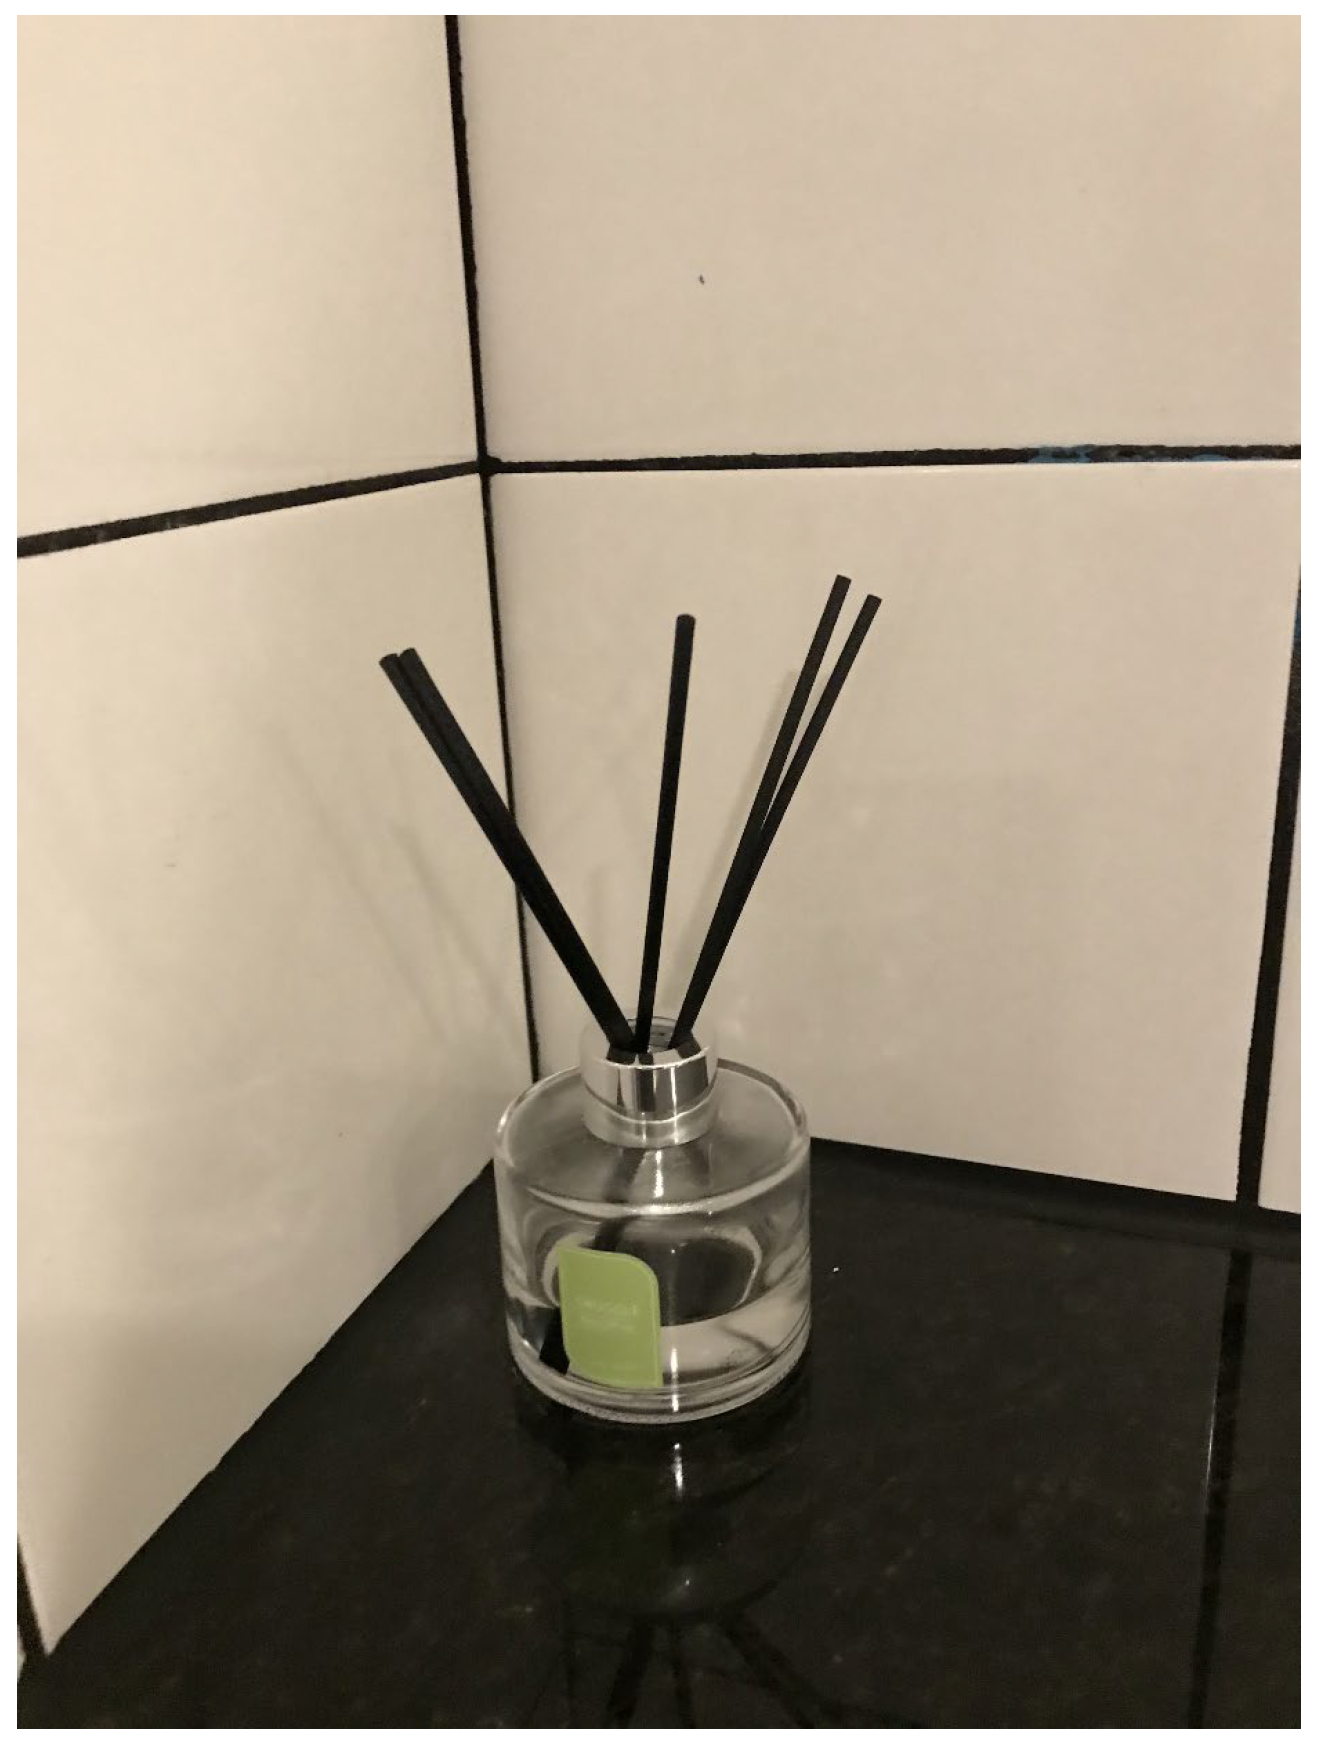
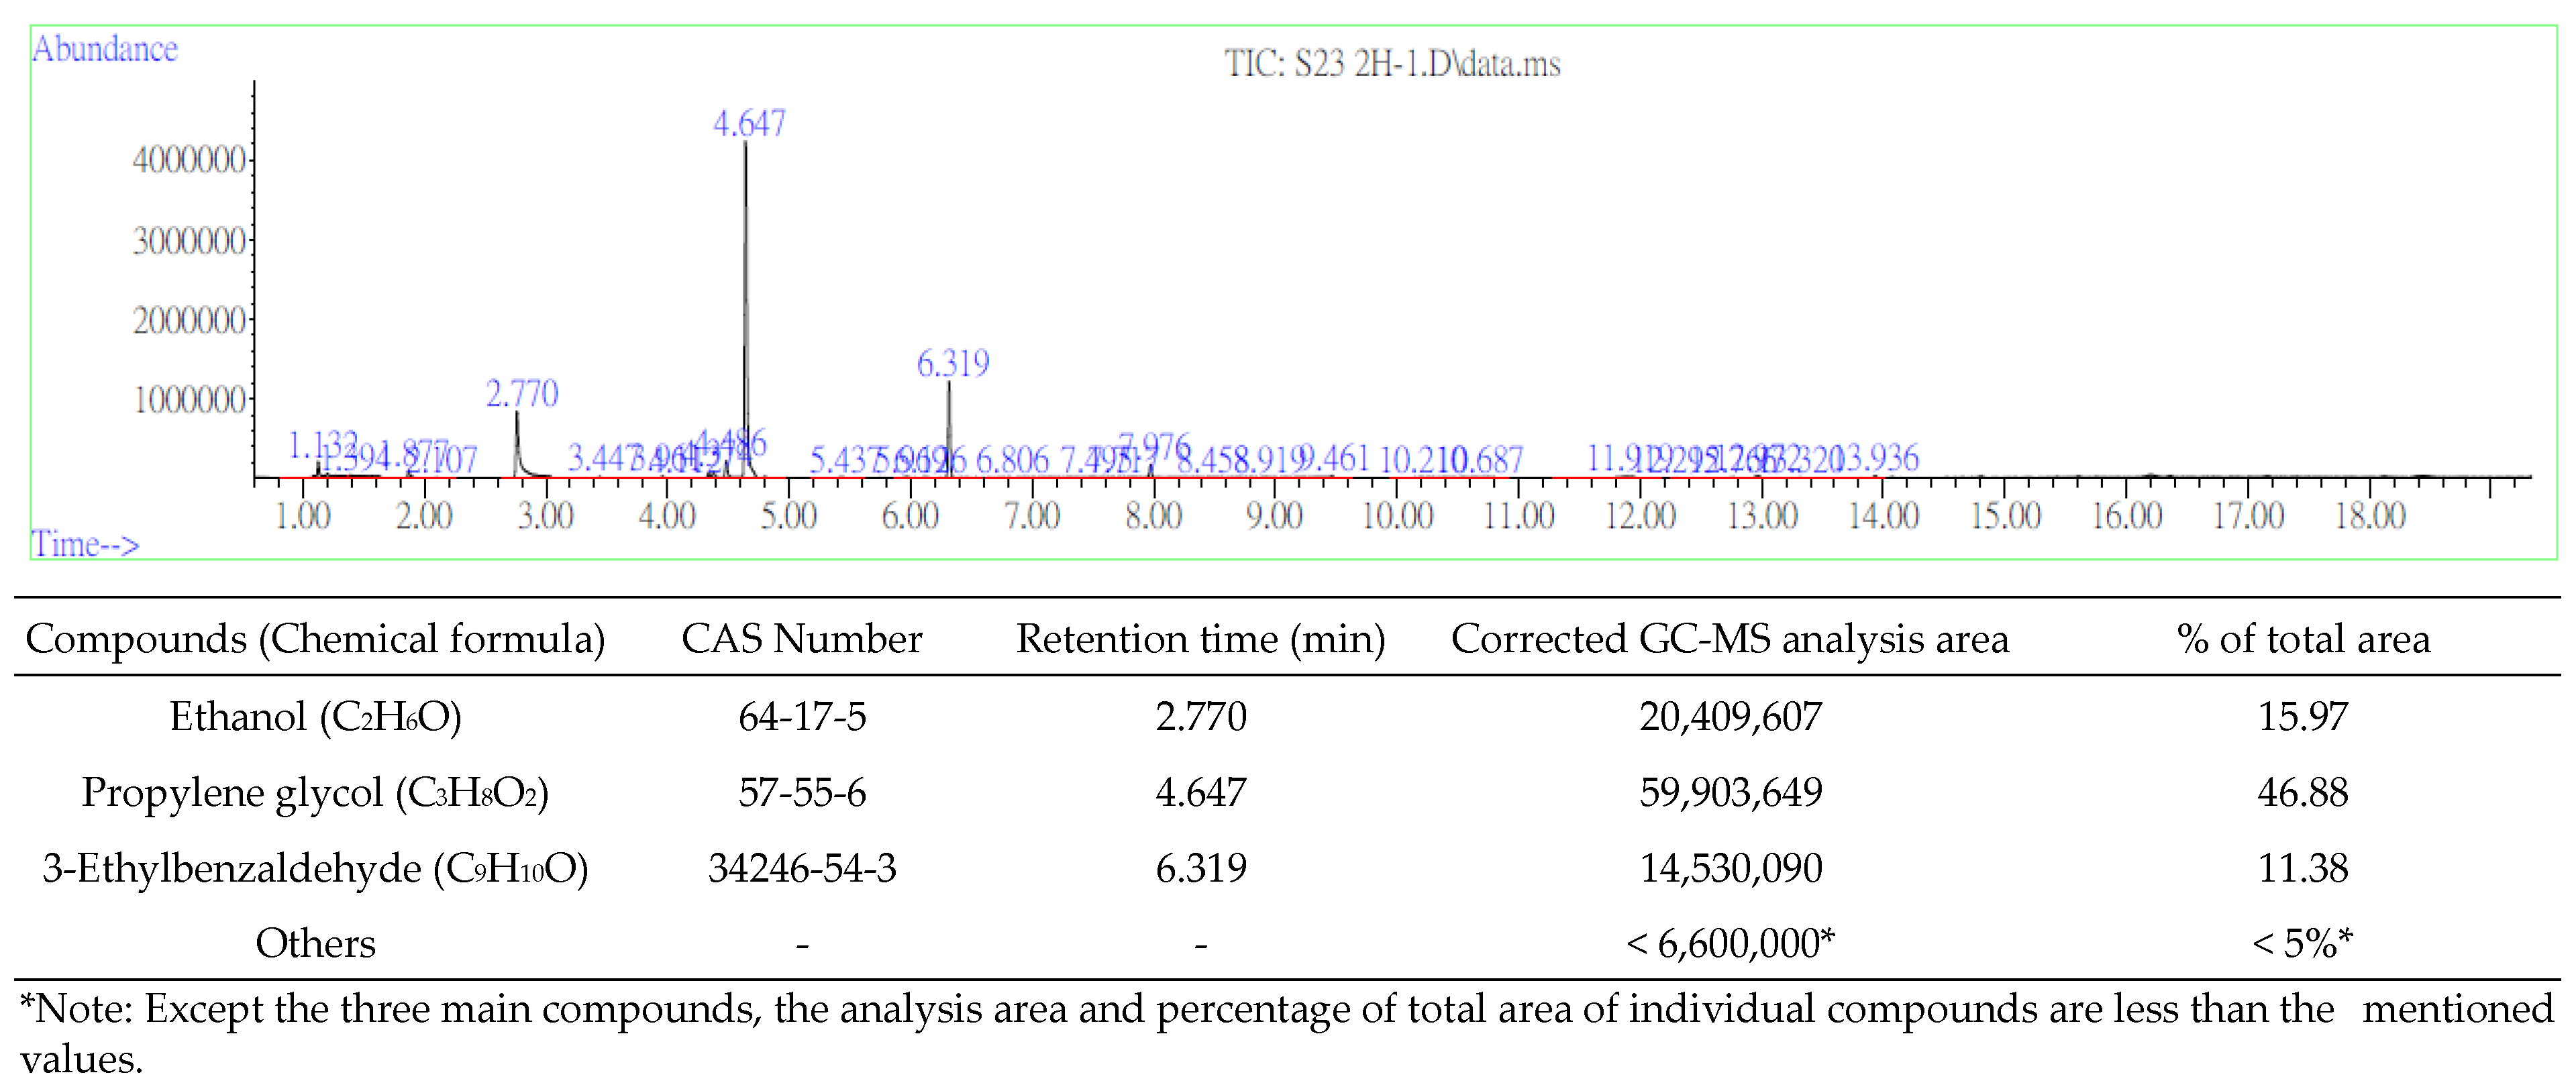
3.1. Identifying VOCs Emitted from the Liquid in Fragrance Bottles in a Chamber

Figure 5 presents a typical chromatograph of VOCs that were emitted from the fragrance bottle in the chamber; the main compounds are ethanol, propylene glycol, and 3-ethylbenzaldehyde. Other analytes that were detected using GC-MS had very small peaks on the chromatograph, indicating concentrations of less than 2 ppb. Table 1 presents the adsorbed mass of ethanol, propylene glycol, and 3-ethylbenzaldehyde. Notably, the VOC adsorption capacities of SDVB in two hours were almost double those in one hour; therefore, the adsorbed amounts of VOCs in the adsorption chamber did not reach the saturation adsorption capacities of the SDVB that was packed into the NTS during the extraction period of 1–2 h. Since the amounts of VOCs that were diffused by the bamboo diffuser significantly exceeded those diffused by the polyester diffuser, the subsequent on-site sampling tests were performed using the bamboo diffusers.
Ethanol is commonly emitted from aroma products and was detected in the target fragrance in this study [2,14,22,23]. Propylene glycol is commonly used as an additive in food, drugs, cosmetics, and e-liquids, so emissions from these products often contain it [24,25]. However, 3-ethylbenzaldehyde is an irritant to the skin, eyes, and respiratory tract [26]. The threshold limit on the concentration of 3-ethylbenzaldehyde cannot be found in the literature, but this compound may be associated with most irritations that are caused by fragrance products.

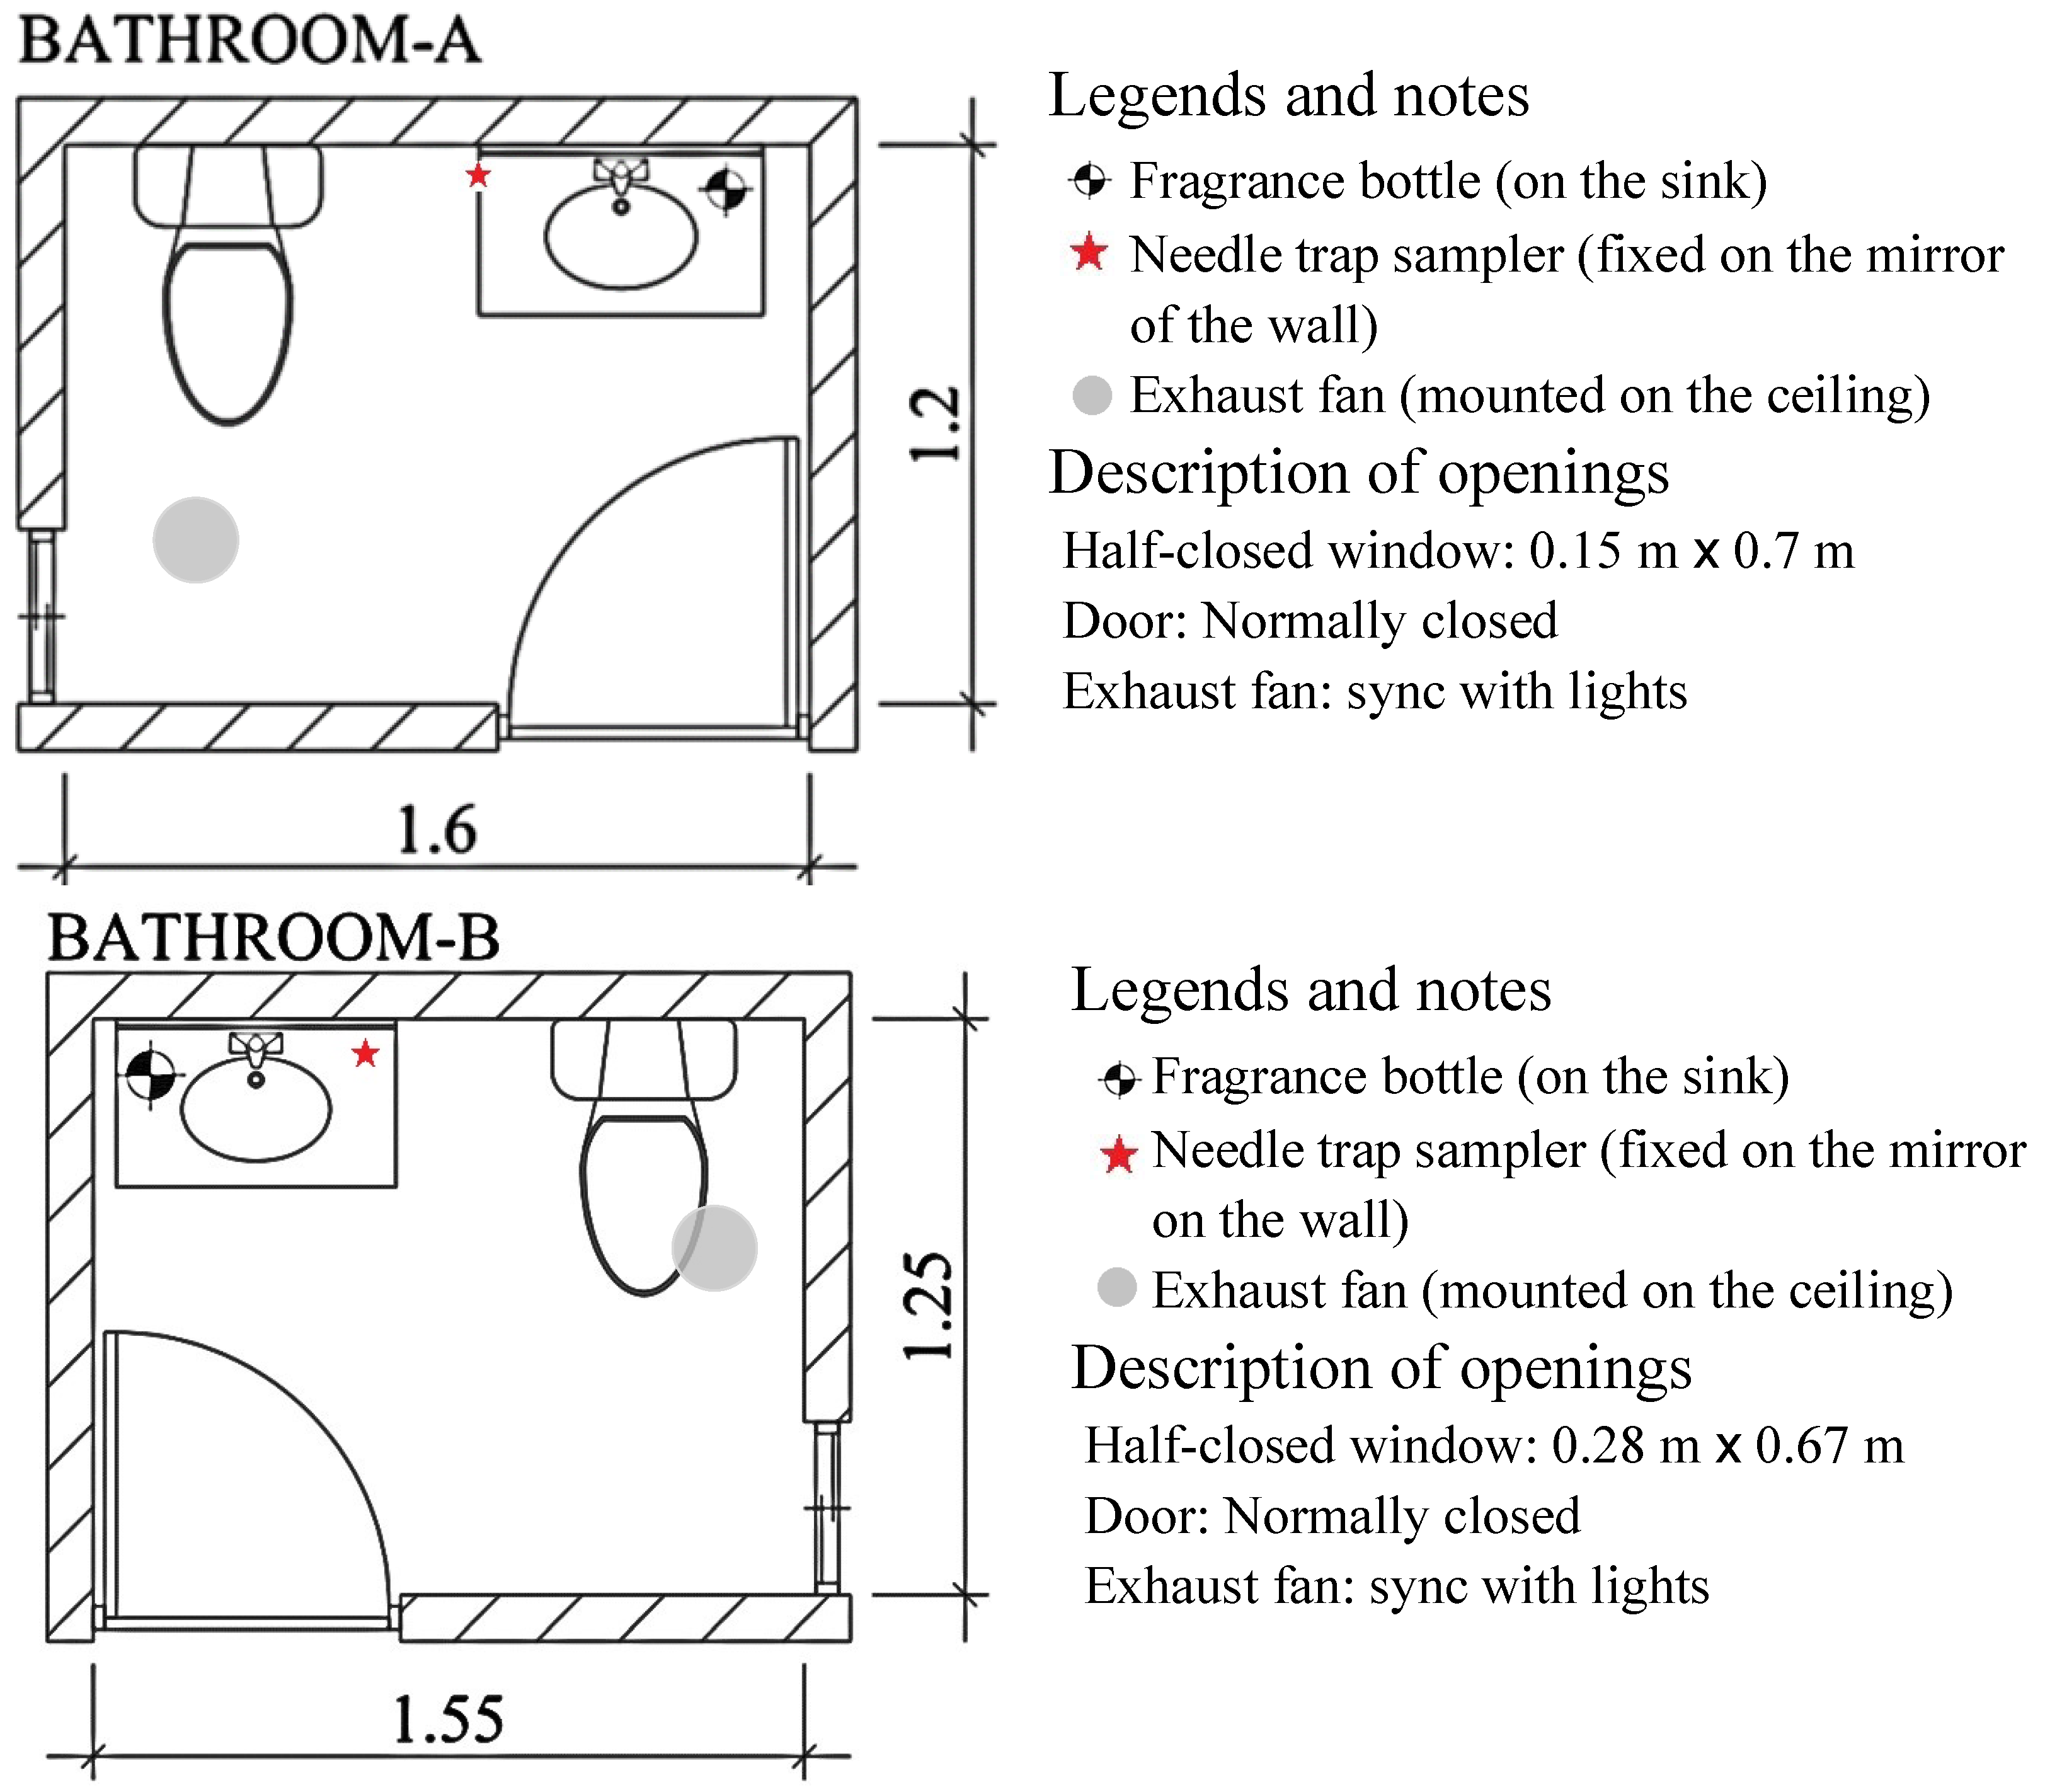
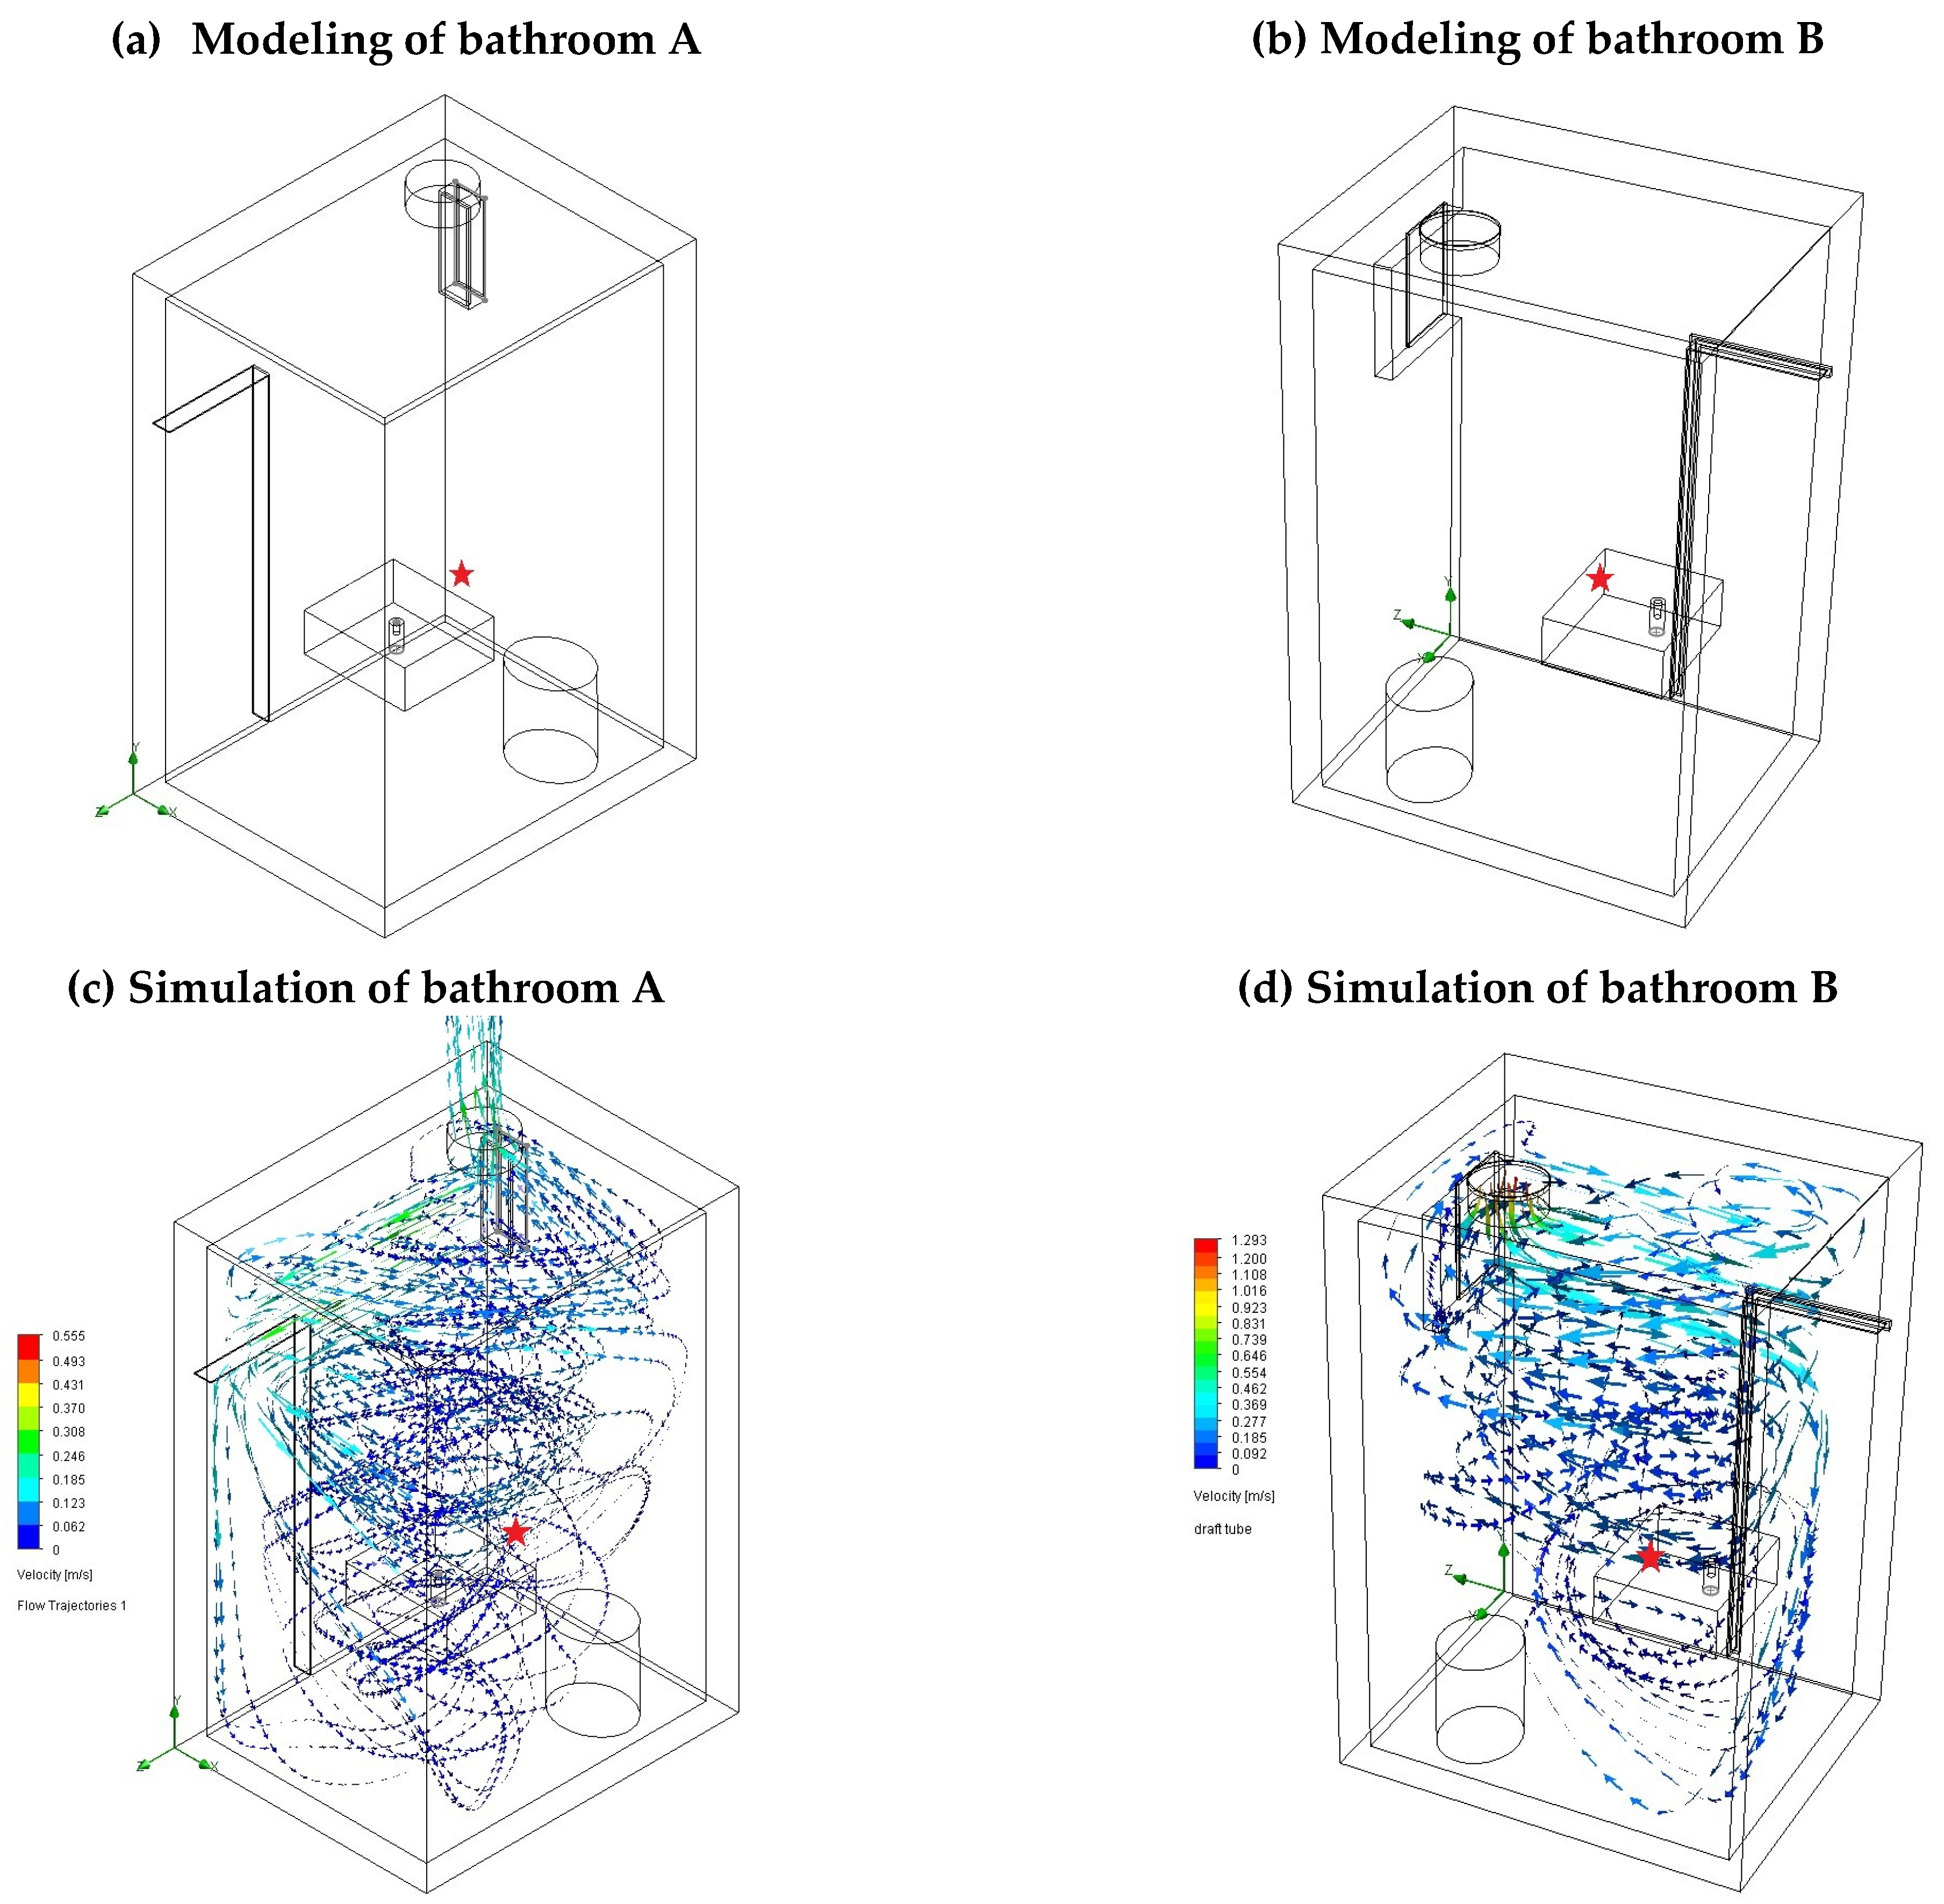
3.2. Characteristics of Emitted VOCs in Fragrances in Bathrooms

Two samplings were performed in each of the bathrooms, A and B. The first and second sampling periods were five and four days, respectively. Figure 6 presents the simulated directions and intensities of airflow through the window opening due to the operation of exhaust fans in bathrooms A and B. The optimum sampling locations of NTSs are indicated. Table 2 presents the time-weighted average (TWA) concentrations of VOCs that were emitted from the fragrance bottle. These compounds were ethanol, propylene glycol, and 3-ethylbenzaldehyde, which were also identified in the chamber tests, along with toluene. Inside the two bathrooms, ethanol had the highest concentrations; this was followed by propylene glycol and then 3-ethylbenzaldehyde, which had the lowest concentrations. Notably, toluene, which was not detected in the chamber tests, was present in both bathrooms during the first collection of samples at concentrations from 29.6 to 101.7 ppb. The on-site investigation demonstrated that toluene was emitted from paints that had been used to decorate the residence upstairs and had entered the bathrooms through the open windows.

4. Discussion

The results in Table 2 reveal that the indoor air change rate is inversely proportional to the emission concentrations of VOCs: a low flow rate of air may allow VOCs to accumulate in the bathrooms. The effect of a high or low indoor air change rate on indoor air quality has also been identified elsewhere [1,3,12]. The impact of external air pollutants (i.e., toluene in this study) on indoor air quality should be properly considered to eliminate associated health effects; however, the short-term VOC exposure concentrations from specific outdoor anthropogenic activities, especially vehicle exhausts, and industrial pollution, are lower than those from indoor pollutants [27,28,29]. Therefore, long-term exposure to indoor VOCs must be given priority for prevention.
The TWA concentrations of VOCs that are emitted in fragrances and those in outdoor vapors from paints in bathrooms were much less than 1 ppm. Bathrooms are some of the most frequently used spaces in the home. Many researchers [30,31] have focused on the risks associated with exposure to fumes in kitchens but more studies on emitted pollutants in cleaning fluids and fragrances in bathrooms must be conducted because restrooms and bathrooms are also the spaces that are frequently used in people’s daily lives.
NTS, which are micro samplers, were used to monitor exposure to VOC emissions from several indoor fragrances, including essential oils and air fresheners [13,14]. Passive sampling using adsorption devices was verified to be a satisfactory method for extracting VOCs indoors; their use is especially favorable because they can be reused more than ten times [32]. Most ingredients in fragrances are not clearly specified, and even when labels indicated that they are natural, sampling tests have proven that most use artificial chemical additives [2,7]. An NTS in passive sampling mode is a lightweight and reusable sampler that can be used to evaluate the hazards of indoor VOC emission sources.

5. Conclusions

Fragrances have been used for thousands of years [2]. Since smells that are emitted in fragrances are used to cover odors, they are widely used in restrooms and bathrooms. In recent years, the chemical components that are emitted by indoor fragrances have been found to have adverse effects on indoor air quality and human health. Therefore, we suggest that artificial chemical fragrances should not be used indoors to reduce long-term exposure to VOCs. Restrooms and bathrooms should be cleaned more frequently, and be kept moderately dry to prevent odors, or natural plants such as flowers should be used instead of fragrances.

Author Contributions

Conceptualization, W.-H.C. and S.-Y.S.; methodology, W.-H.C. and S.-Y.S.; software, Y.-C.C.; validation, W.-H.C. and Y.-C.C.; investigation, S.-Y.S.; resources, W.-H.C.; data curation, W.-H.C. and S.-Y.S.; writing—original draft preparation, W.-H.C.; writing—review and editing, W.-H.C.; visualization, W.-H.C., Y.-C.C. and S.-Y.S.; supervision, W.-H.C. All authors have read and agreed to the published version of the manuscript.

Funding

This research received no external funding.

Institutional Review Board Statement

Not applicable.

Informed Consent Statement

Not applicable.

Data Availability Statement

Not applicable.

Acknowledgments

Authors would like to thank Chia-Yu Chang for her assistance in instrumental analysis.

Conflicts of Interest

The authors declare no conflict of interest.

References

  1. Al-Alam, J.; Sonnette, A.; Delhomme, O.; Alleman, L.Y.; Coddeville, P.; Millet, M. Pesticides in the Indoor Environment of Residential Houses: A Case Study in Strasbourg, France. Int. J. Environ. Res. Public Health 2022, 19, 14049. [Google Scholar] [CrossRef]
  2. Steinemann, A. The fragranced products phenomenon: Air quality and health, science and policy. Air Qual. Atmos. Health 2021, 14, 235–243. [Google Scholar] [CrossRef]
  3. Mečiarová, L.; Vilčeková, S.; Burdová, E.K.; Kiselák, J. Factors effecting the total volatile organic compound (TVOC) concentrations in Slovak households. Int. J. Environ. Res. Public Health 2017, 14, 1443. [Google Scholar] [CrossRef] [PubMed] [Green Version]
  4. Balducci, C.; Cerasa, M.; Avino, P.; Ceci, P.; Bacaloni, A.; Garofalo, M. Analytical determination of allergenic fragrances in indoor air. Separations 2022, 9, 99. [Google Scholar] [CrossRef]
  5. Jia, C.; Batterman, S.; Godwin, C. VOCs in industrial, urban and suburban neighborhoods-Part 2: Factors affecting indoor and outdoor concentrations. Atmos. Environ. 2008, 42, 2101–2116. [Google Scholar] [CrossRef]
  6. Vardoulakis, S.; Giagloglou, E.; Steinle, S.; Davis, A.; Sleeuwenhoek, A.; Galea, K.S.; Dixon, K.; Crawford, J.O. Indoor exposure to selected air pollutants in the home environment: A systematic review. Int. J. Environ. Res. Public Health 2020, 17, 8972. [Google Scholar] [CrossRef]
  7. Wolff, P. Improving indoor air quality in health care settings by controlling synthetic fragrance: What you as a nurse can do. Md. Nurse 2006, 61, 7–9. [Google Scholar]
  8. Wolff, P.; Nielsen, G.D. Effects by inhalation of abundant fragrances in indoor air—An overview. Environ. Int. 2017, 101, 96–107. [Google Scholar] [CrossRef]
  9. Carslaw, N.; Shaw, D. Modification cleaning product formulations could improve indoor air quality. Indoor Air 2022, 32, e13021. [Google Scholar] [CrossRef]
  10. Singer, B.C.; Destaillats, H.; Hodgson, A.T.; Nazaroff, W.W. Cleaning products and air fresheners: Emissions and resulting concentrations of glycol ethers and terpenoids. Indoor Air 2006, 16, 179–191. [Google Scholar] [CrossRef] [Green Version]
  11. Du, B.; Schwartz-Narbonne, H.; Tandoc, M.; Heffernan, E.M.; Mack, M.L.; Siegel, J.A. The impact of emissions from an essential oil diffuser on cognitive performance. Indoor Air 2022, 32, e12919. [Google Scholar] [CrossRef]
  12. Wolff, P. Fragrances/odours in indoor air and health effects? Occup. Environ. Med. 2018, 75, A198. [Google Scholar] [CrossRef] [Green Version]
  13. Cheng, W.-H.; Lai, C.-H. Sampling gaseous compounds from essential oils evaporation by solid phase microextraction devices. Atmos. Environ. 2014, 99, 124–129. [Google Scholar] [CrossRef]
  14. Cheng, W.-H.; Tsai, D.-Y.; Lu, J.-Y.; Lee, J.-W. Extracting emissions from air fresheners using solid phase microextraction devices. Aerosol Air Qual. Res. 2016, 16, 2362–2367. [Google Scholar] [CrossRef] [Green Version]
  15. Angulo-Milhem, S.; Verriele, M.; Nicolas, M.; Thevenet, F. Indoor use of essential oils: Emission rates, exposure time and impact on air quality. Atmos. Environ. 2021, 244, 117863. [Google Scholar] [CrossRef]
  16. Zeng, J.; Zhang, Y.; Zhang, H.; Song, W.; Wu, Z.; Wang, X. Design and characterization of a semi-open dynamic chamber for measuring biogenic volatile organic compound (BVOC) emissions from plants. Atmos. Meas. Tech. 2022, 15, 79–93. [Google Scholar] [CrossRef]
  17. Silva, G.V.; Martins, A.O.; Martins, S.D.S. Indoor air quality: Assessment of dangerous substances in incense products. Int. J. Environ. Res. Public Health 2021, 18, 8086. [Google Scholar] [CrossRef] [PubMed]
  18. SolidWorks Company. SOLIDWORKS Simulation Premium, Dassault Systemes; SolidWorks Company: Waltham, MA, USA, 2022. [Google Scholar]
  19. Huang, P.J.; Cheng, W.H.; Chang, C.Y. Sulfonation of divinylbenzene adsorbents packed in a micro sampler to extract airborne organic compounds. Aerosol Air Qual. Res. 2021, 21, 210157. [Google Scholar] [CrossRef]
  20. Lord, H.; Zhan, W.; Pawliszyn, J. Fundamentals and applications of needle trap devices. Anal. Chim. Acta 2010, 677, 3–18. [Google Scholar] [CrossRef] [PubMed]
  21. Cheng, W.H.; Chen, N.Y. Abnormal respiratory symptoms of workers and extracting organic vapors using micro samplers in a golf ball manufacturing factory. Aerosol Air Qual. Res. 2022, 22, 220087. [Google Scholar] [CrossRef]
  22. Itoh, T.; Masuda, Y.; Matsubara, I.; Arai, J.; Shin, W. Examination of VOC Concentration of aroma essential oils and their major VOCs diffused in room air. Int. J. Environ. Res. Public Health 2022, 19, 2904. [Google Scholar] [CrossRef] [PubMed]
  23. Nematollahi, N.; Kolev, S.D.; Steinemann, A. Volatile chemical emissions from essential oils. Air Qual. Atmos. Health 2018, 11, 949–954. [Google Scholar] [CrossRef]
  24. Division of Toxicology and Environmental Medicine ToxFAQs: Propylene Glycol; Agency for Toxic Substances and Disease Registry (ATSDR): Atlanta, GA, USA, 1997. Available online: https://www.atsdr.cdc.gov/toxfaqs/tfacts189.pdf (accessed on 8 June 2023).
  25. Cheng, W.H.; Chang, C.Y.; Chen, Y.Y.; Su, H.W. Chemical composition of aerosols of an electronic cigarette. Aerosol Air Qual. Res. 2021, 21, 200672. [Google Scholar] [CrossRef]
  26. PubChem: Ethylbenzaldehyde. National Center for Biotechnology Information. Available online: https://pubchem.ncbi.nlm.nih.gov/compound/118623 (accessed on 18 June 2022).
  27. Liddament, M.W. A Review of ventilation and the quality of ventilation air. Indoor Air 2000, 10, 193–199. [Google Scholar] [CrossRef]
  28. Suryawanshi, S.; Chauhan, A.S.; Verma, R.; Gupta, T. Identification and quantification of indoor air pollutant sources within a residential academic campus. Sci. Total Environ. 2016, 569–570, 46–52. [Google Scholar] [CrossRef]
  29. Domínguez-Amarillo, S.; Fernández-Agüera, J.; Cesteros-García, S.; González-Lezcano, R.A. Bad air can also kill: Residential indoor air quality and pollutant exposure risk during the COVID-19 crisis. Int. J. Environ. Res. Public Health 2020, 17, 7183. [Google Scholar] [CrossRef] [PubMed]
  30. Sun, L.; Wallace, L.A. Residential cooking and use of kitchen ventilation: The impact on exposure. J. Air Waste Manag. Assoc. 2021, 71, 830–843. [Google Scholar] [CrossRef]
  31. Huang, K.; Wang, R.; Feng, G.; Wang, J.; Yu, M.; He, N. Ventilation status of the residential kitchens in severe cold region and improvement based on simulation: A case of Shenyang, China. J. Air Waste Manag. Assoc. 2022, 72, 935–950. [Google Scholar] [CrossRef]
  32. Li, H.; Bi, C.; Li, X.; Xu, Y. A needle trap device method for sampling and analysis of semi-volatile organic compounds in air. Chemosphere 2020, 250, 126284. [Google Scholar] [CrossRef]
Figure 1. Diffuser sticks with the fragrance bottle. This photo was taken by the authors in a public restroom.
Atmosphere 14 01012 g001
Figure 2. Schematic needle trap sampler and its detailed structure.
Atmosphere 14 01012 g002
Figure 3. Experimental set-up for sampling of the emitted VOCs in fragrances.
Atmosphere 14 01012 g003
Figure 4. Layouts and the sampling positions of bathrooms A and B.
Atmosphere 14 01012 g004
Figure 5. Chromatograph of emitted VOCs in the fragrance and the analyses’ results.
Atmosphere 14 01012 g005
Figure 6. Simulations of air streams with indoor ventilation in bathrooms A and B using SolidWorks. Symbols indicate the sampling locations of the NTS.
Atmosphere 14 01012 g006
Table 1. Adsorption mass of VOCs by SNTS for fragrance emission exhausts.
VOCsAdsorption Mass (μg) by Different Diffusers *
PolyesterBamboo
60 min120 min60 min120 min
Ethanol35.0 ± 1.171.1 ± 1.851.0 ± 3.599.8 ± 6.0
Propylene glycol250.2 ± 5.8523.3 ± 6.9426.2 ± 3.9869.0 ± 4.8
3-Ethylbenzaldehyde74.4 ± 2.1150.2 ± 1.8112.5 ± 2.4220.1 ± 8.4
* Note: Values of adsorption mass are expressed as (average ± range).
Table 2. Detected concentrations of VOCs emitted from the fragrance via bamboo diffusers in the bathrooms. The air change rates of the two bathrooms are indicated at the bottom of the table.
VOCsConcentrations of VOCs (ppb) 1
Bathroom ABathroom B
Ethanol40.5 ± 7.519.2 ± 2.8
Propylene glycol527.9 ± 81.9273.4 ± 40.4
3-Ethylbenzaldehyde12.4 ± 0.63.8 ± 0.6
Toluene 2101.7229.62
Air change rate (1/h)2.77.7
Calculation specificationIndoor space volume
= 1.2 m × 1.6 m × 2.2 m = 4.2 m3
Air flowrate through the window
= 11.34 m3/h
Air exchange rate of bathroom A
= (11.34 m3/h)/(4.2 m3) ≈ 2.7/h
Indoor space volume
= 1.25 m × 1.55 m × 2.25 m = 4.4 m3
Air flowrate through the window
= 33.77 m3/h
Air exchange rate of bathroom B
= (33.77 m3/h)/(4.4 m3) ≈ 7.7/h
Notes: 1 Values of concentration are expressed as (average ± range). 2 Toluene was only detected in the first sampling period, and its detection was caused by outdoor pollution.
Disclaimer/Publisher’s Note: The statements, opinions and data contained in all publications are solely those of the individual author(s) and contributor(s) and not of MDPI and/or the editor(s). MDPI and/or the editor(s) disclaim responsibility for any injury to people or property resulting from any ideas, methods, instructions or products referred to in the content.

