Review

Review on Source Profiles of Volatile Organic Compounds (VOCs) in Typical Industries in China

1
School of Environmental Science and Engineering, Nanjing Tech University, Nanjing 211800, China
2
Jiangsu Province Engineering Research Center of Synergistic Control of Pollution and Carbon Emissions in Key Industries, Jiangsu Environmental Engineering Technology Co., Ltd., Nanjing 210019, China
*
Authors to whom correspondence should be addressed.
Atmosphere 2023, 14(5), 878; https://doi.org/10.3390/atmos14050878
Submission received: 13 April 2023 / Revised: 10 May 2023 / Accepted: 15 May 2023 / Published: 17 May 2023
(This article belongs to the Section Air Pollution Control)

Abstract

:
The source profile of volatile organic compounds (VOCs) is essential for establishing reactivity- and toxicity-based emission inventories and developing effective air pollution control strategies. In this paper, the establishment of VOC source profiles and the VOC emission characteristics are reviewed in the petrochemical, solvent use, and chemical industries, and the most up-to-date profiles of the three industries in China are compiled via necessary adjustment and reconstruction of the test data from the literature. Alkanes dominated and OVOCs were often neglected in the overall petrochemical industry and refined processes. They accounted for 60.6% and 3.2% in the merged profiles. Aromatics and OVOCs dominated in the industrial solvent use industry. OVOCs were the most prevalent in the printing and dyeing industries, furniture manufacturing industries, and automobile coating process, whereas aromatics were major contributors of the total VOCs in metal surface coating, shipping coating, and other surface coating industries in the merged profiles. A wide range of products and limited profile studies were obtained in chemical industry, and the compositions of VOCs varied significantly in the production of 30 products in the merged profile. The future research directions of VOC source profiles are discussed, mainly focusing on the sampling, establishment, and evaluation of VOC profiles.

1. Introduction

Volatile organic compounds (VOCs), composed of thousands of compounds, are important precursors of tropospheric O3 and secondary organic aerosols (SOAs) [1,2]. The VOC source profiles characterize the composition of pollution source by assigning the total amount of VOC emissions to the mass fraction of individual species, reflecting the significant variations among emission sources [3]. Moreover, the profiles are essential to the establishment of reactivity- and toxicity-based pollution control strategies [4,5]. Therefore, developing a reliable source profile is of great significance for the prevention and control of air pollution.
Since the beginning of the 21st century, a large number of profile testing studies were carried out, mainly focusing on industrial processes, transportation, solvent use, biomass burning, and cooking [6,7,8,9,10]. It was reported that industrial sources are the largest sources of anthropogenic emissions in China [11,12], among which petrochemical, chemical, and solvent use industries dominate [13,14]. In recent years, great progress has been made in establishing the localized VOC profiles in these industries in China. For example, Wei et al. [15] conducted field measurements to characterize VOC profiles from the whole petroleum refinery. Zhang et al. [16] measured speciated VOC emissions in the chemical industry in eastern China. Zhong et al. [7] obtained the characteristics of VOCs emitted from the surface coating industry in the Pearl River Delta. Furthermore, studies on refined VOC profiles based on production processes have been gradually developed. For instance, Mo et al. [17] investigated process-based emission characteristics of VOCs from petrochemical facilities in the Yangtze River Delta. Many studies have been conducted on VOC profiles of the stack and fugitive emissions in the whole industry [7,18,19]. These studies provide support for the refined management and control of VOCs. Moreover, some researchers carried out reviews of VOCs profiles. For example, Mo et al. [20] studied the anthropogenic VOC profiles in China, while the profiles of industrial processes, with large VOC emissions and complex emission characteristics, are not comprehensive and the degree of refinement is low. Han et al. [21] studied the overall and process-based profiles of the petrochemical industry, but some of the profiles included in the reviews were of low quality (early test time, few quantitative species, and incomplete processes), and the influence of sampling and analysis techniques was not considered.
Although a variety of studies on VOCs profiles have been conducted on the VOCs profiles in China, there are still some limitations. Firstly, the VOCs species and their compositions involved in previous profiles varied greatly even from the same source. For example, the percentage of propane for the petrochemical industry ranged from 3.6% [10] to 19.9% in different profiles [17]. Secondly, many species were missing or underestimated owing to the measurement techniques, especially oxygenated VOCs (OVOCs) which were easily lost during sampling due to their high reactivity. It was shown that high concentrations of formaldehyde are found in exhaust gases [22], but this was neglected in early VOC profiles due to the limitation of sampling and analysis methods [23]. Lastly, it was difficult to systematically review or evaluate the data quality of the profile in compiling VOC profile databases [24]. Therefore, continuous updates and refinements of VOC profiles are necessary for further understanding the VOC emission characteristics for specific emission sources.
Developed countries such as the US and Europe experienced air pollution earlier, and air pollution prevention and control actions were carried out earlier, significantly improving air quality [25]. As the largest developing country, the Chinese government has carried out a series of large-scale air control actions, mainly including the formation mechanism of haze and photochemical smog, the whole process control of pollution sources, the improvement of air quality, and the joint prevention and control of air pollution. Efficient emission reduction of VOCs, raw material substitution, and cleaner production were conducted in the petrochemical, solvent use, and chemical industries [26]. After the above pollution prevention and control actions, China has entered a critical period of continuous improvement of air quality, and VOC emission reduction is an effective measure for air pollution prevention and control.
In this study, we firstly review the measurements and merging techniques, as well as the test data utilized of VOC source profiles reported in previous studies. Moreover, the characteristics of sector-based and process-based VOCs emissions are summarized, mainly covering the petrochemical, industrial solvent use, and chemical industries. Secondly, the most up-to-date measurement-based VOCs profiles are merged in these three industries with necessary adjustment and reconstruction, thereby eliminating earlier limitations and adding the latest industrial emission characteristics. Therefore, the up-to-date and process-based VOCs profiles are compiled, supplementing the missing species in previous studies. Lastly, the outlook for future research directions is discussed. More attention needs to be paid to the regulation of sampling and analytical methods, the establishment of process-based profiles, the measurement of more subsector sources, and the evaluation of VOC profiles in the future.

2. The Establishment of VOC Source Profile

In this study, a total of 219 Chinese and English studies on related topics was retrieved from the CNKI and Web of Science databases in the past 15 years (2008–2023), including 56 in the petrochemical industry (keywords: VOC profile, petrochemical), 134 in the solvent use industry (keywords: VOC profile, solvent use), and 29 in the chemical industry (keywords: VOCs profile, basic chemical, ink and paint, synthetic material). There were 161 articles on VOC profiles testing (101 articles with detailed test data) and eight reviews on VOC profiles.

2.1. Measurements of VOC Source Profile

2.1.1. Sample Collection

Sample locations and sample materials are two important factors of sample collection. According to the sample locations possible, VOC sampling of industrial sources can be divided into outlet sampling, workshop sampling, and environmental sample collection in industrial sources [17,27,28,29]. Outlet samplings are utilized in characterizing stack emissions of VOCs, and workshop samplings are commonly used in characterizing fugitive emissions [27,29]. Furthermore, the environmental samples collected at upwind sites serve as a background sample [15], and those collected at downwind sites are believed to reflect combined emissions which are highly susceptible to other emission sources [30]. Due to the large number of industry categories and production facilities in China, there are different applicable sampling locations for a particular industry. Table 1 lists the VOCs sampling in typical domestic industries. To be specific, outlet samplings and workshop samplings are usually used to characterize the VOCs emissions in the petrochemical industry, especially for process-based profiles [17]. Stack emissions and some processes of fugitive emissions (e.g., oil refining processes, storage tanks, and wastewater treatment) are considered to be the major emission sources of VOCs [15,31]. In addition, environmental samples are collected more commonly in the petrochemical industry than in other industries [17,23]. In the solvent use industry and chemical industry, however, there are usually fully enclosed and incompletely enclosed production units. VOC samples were collected from stacks of these industries with fully enclosed production units [32], and samples were collected from both major stacks and production areas of these industries where production units were not completely enclosed [33].
The most commonly used sampling materials were solid-phase sorbent tube sampling and container sampling (Table 2). Solid-phase sorbent tube samplings were used to collect VOC samples by filling the sorbents (porous polymers, such as Tenax) into the adsorbent tube. However, sorbent tubes were less used to collect industrial exhaust gas because high concentrations of particulate matter and moisture contents contained in the exhaust gas could adversely affect the adsorbent [38]. Due to their simplicity, container sampling methods, such as air bags and canisters, were widely applied in VOC sample collections [39]. Teflon bags and Tedlar bags were commonly used in earlier studies because of their low cost and reusability (Table 1). However, it was found that the adsorption, condensation, and/or permeation of VOCs could cause sample loss in air bags. Silica-lined or electro-polished stainless-steel canisters (i.e., SUMMA canisters) had high stability of VOCs samples compared with air bags [40]. Thus, SUMMA canisters were the most commonly used to collect industrial waste gases due to their good effects on preserving samples. In addition, to avoid the pollution of containers by the high concentration of exhaust gas, a gas dilution device was required when SUMMA canisters were used for industrial exhaust gas collection such as in the chemical industry [41].

2.1.2. Analysis Method

Offline monitoring and online monitoring were the two commonly used VOC analysis methods in the studies of VOCs profiles. As summarized in Table 3, offline monitoring was the most commonly used and recommended analysis method of VOC profiles in China, representing a qualitative and quantitative analysis method by gas separation in the laboratory [42]. It can be applied to conduct multipoint sampling of VOCs at the same time to study regional distribution. Due to its high selectivity and sensitivity, gas chromatography (GC) was one of the most commonly used offline monitoring technologies (Table 1), usually applied with mass spectrometry (MS), flame ionization detection (FID), electron capture detection (ECD), photo ionization detection (PID), etc. [39]. Moreover, high-performance liquid chromatography (HPLC) was mainly used to detect OVOC species, which are highly selective and sensitive to some specific compounds with carbonyl groups, such as aldehydes [43]. According to the statistics, 85% of the offline monitoring of VOCs profiles was carried out using GC–FID/MS, while the remainder focused on quantifying carbonyl species by applying HPLC utilizing 2,4-dinitrophenylhydrazine (DNPH) or pentafluorophenyl hydrazine (PFPH) adsorption [44].
Online monitoring was also used to establish VOC profiles, which enabled the real-time monitoring of pollutants in which the exhaust gas entered the analyzer directly through the sampling device [38]. Compared with offline monitoring, online monitoring could avoid the analysis errors caused by collection, storage, and long-distance transportation of samples, and more accurately reflect the temporal variations of VOC emissions. The structure of most online monitoring systems was basically the same, mainly including a sampling system, analysis system and auxiliary system. The main difference was in the analysis system, namely, the detector. All kinds of instruments were combined to complete VOC monitoring under the command of the system program. Online monitoring methods could be divided into two types: online automatic monitoring and on-site portable monitoring. Compared with offline monitoring, online GC–MS/FID was the mainstream method for online automatic monitoring, which directly combined pretreatment and analysis processes, as well as shorted the sampling and pretreatment time under the command of the system program [45]. In addition, proton-transfer-reaction mass spectrometry (PTR-MS) [46], time-of-flight mass spectrometry (TOF-MS) [47], and Fourier-transform infrared spectroscopy (FTIR) [48] have been applied in the quantification of VOC components. These methods generally had the advantages of fast testing, high temporal resolution, and low detection limits. However, most of the online monitoring techniques which attract extremely high costs of use and maintenance are still in the stage of equipment development upgrading [38,49,50]; they will be used more extensively in the future due to their accuracy and fast speed of testing [51,52]. Most portable monitors were equipped with MS or FTIR detectors, which were mainly used for emergency monitoring, and pollution source tracking and monitoring [38]. Compared with online automatic monitoring, the portable monitor had the advantages of small size, light weight, and easy operation. Therefore, they will play an important role in the establishment of VOCs profiles in the future. However, they cannot be adequately powered for a long time, which limits their usage.
Table 3. Advantages and disadvantages of analysis methods.
Analysis MethodsCategoryDetectorsAdvantagesDisadvantages
Offline monitoring/GC (e.g., GC, HP-7890A; MSD, HP-5975C; FID, G3431. Agilent Inc., Santa Clara, CA, USA) [53,54] High sensitivity; wide range; low detection limitComplex preprocess; expensive equipment
/HPLC (e.g.,HPLC 1100, Agilent Inc.) [39,55] Ability to analyze OVOCsHigh difficulty for low concentrations of aldehydes and ketones.
Online monitoringOnline automatic monitoringOnline GC-MS/FID (e.g., GC, HP-7890A; MSD, HP-5975C; FID, G3431. Agilent Inc.) [39] Low detection limit (5 × 10⁻¹²–7.5 × 10⁻¹¹); high time resolution; and comprehensive speciesSusceptibility to wall effects; high cost of operation and maintenance
PTR-MS (e.g., TOFWERK.; Thun, Switzerland) [56,57] High temporal resolution; high sensitivity; low detection limit (10–11)Low distinction of isomers; limited number of species
TOFMS (e.g., Waters GCT Premier Mass Spectrometer, Waters, Milford, MA, USA) [47]Fast speed of detection; wide range of molecular weightLow detection resolution; sensitive reaction
FTIR (e.g., LOPGP-FTIR, VERTEX 70v, Bruker, Mannheim, Germany) [48,49]Fast speed of detection; high resolutionExpensive and bulky equipment
On-site portable monitoringGC-MS (e.g., GC, HP-7890A; MSD, HP-5975C. Agilent Inc.) [38,58]Small size; high sensitivity; good effect of gas separationPoor stability
FTIR (e.g., LOPGP-FTIR, VERTEX 70v, Bruker, Mannheim, Germany) [58]Small size; wide spectral rangeHigh detection limit; poor gas separation; susceptibility to moisture and carbon dioxide

2.2. Merging of VOC Source Profiles

Improper sampling and analyzing methods can lead to loss or underestimation of VOCs species and then bring uncertainties to the VOCs profiles. For example, OVOCs species in air bag sampling were easily lost during sampling due to noninert inner surface of bags and GC–MS could not detect some species, especially C1 and C2 OVOCs [44]. Therefore, merging of VOC profiles was essential to developing composite VOC profiles and reducing potential uncertainty of single profiles by grouping and averaging source profiles in the same sector [24].
Firstly, the localized VOC source profiles of a specific emission sector from previous studies were collected, and their detailed information (e.g., sampling location, date, sampling and analysis methods, and species) was summarized. Moreover, the source profiles suitable for the current emission characteristics of VOCs were selected by referring to the quality evaluation standards established by Bray et al. [3], following six criteria: (1) whether or not the profile is representative of the VOC emission characteristics for the current industry situation; (2) whether or not the classification of VOC profiles is compatible with the official emission inventory; (3) the differences among profiles from different studies for the same emission sources; (4) whether or not the profile could cover typical species of the emission sources; (5) the quality of journals in which the profiles were published; (6) the geographical locations of sample collection sites. Then, the profiles with some species missing were corrected [24]. When multiple profiles were available with some VOC species missing, Li et al. [24] proposed a revision method for the VOC profiles. However, when only one VOC profile was available for an emission sector, then only the existing VOC profile could be adopted to characterize the sector even with several species missing. The supplementary method of missing species is shown in Equation (1), and the revision formula of species not missing is shown in Equation (2). Lastly, the corrected profiles were merged into one composite profile to represent the characteristics of this sector using Equation (3). If multiple source profiles could be obtained for an emission sector with relatively complete VOCs species, these profiles were directly merged into a composite profile to represent this sector using Equation (3).
P A , i , m = P BCD , i , m ¯ ,
where m is emission source, i and j are VOC species, A is the VOC profile of missing species j in emission source m, B C D are VOC profiles containing species j in emission source m , P A , i , m is fraction of i species in the A profile, and P B C D , i , m is fraction of i species in the B C D profiles.
P A , j , m = P ori A , j , m i P ori A , j , m × 1 - P BCD , i , m ¯ ,
where P A , j , m is fraction of j species in the A profile, and P ori A , j , m is fraction of j species before revision in the A profile.
P composite m , n = k P m , n , k k ,
where n is the VOC species, P c o m p o s i t e is the fraction of n species in the composite profile, P m , n , k is the fraction of n species, and k represents the number of profiles.

3. Source Profiles by Sectors

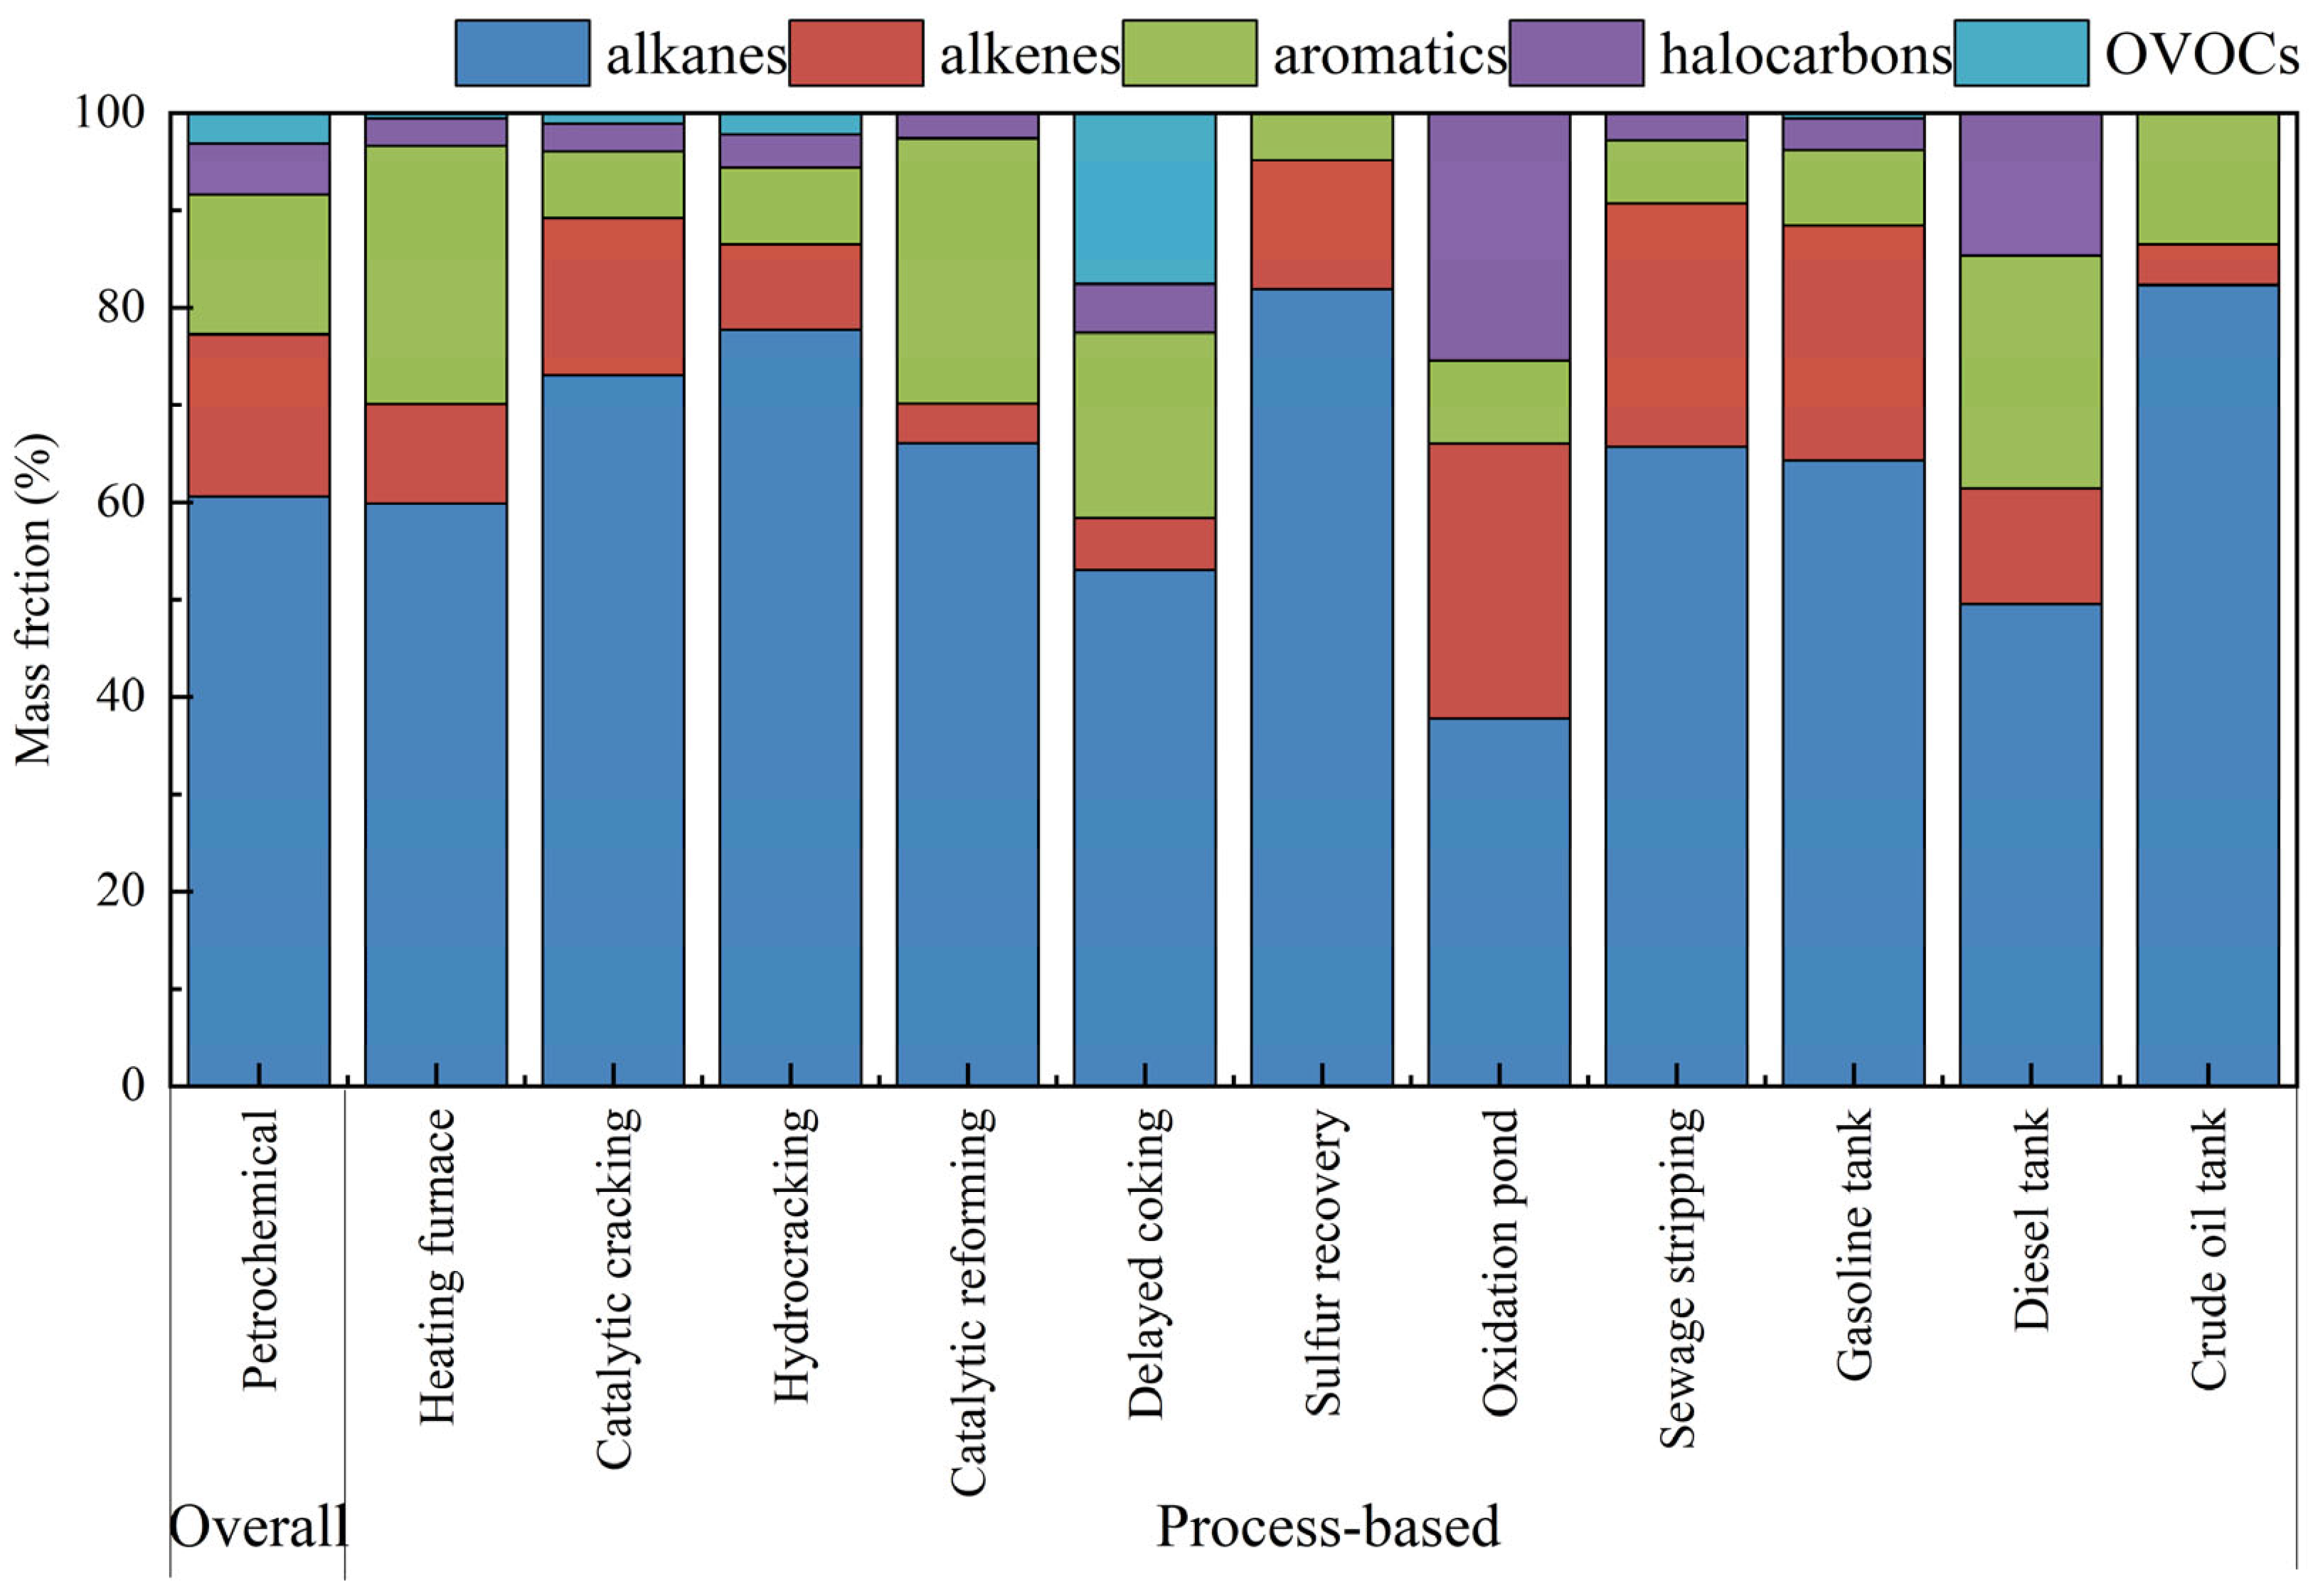
3.1. Petrochemical Industry

3.1.1. Overview of VOCs Profiles

The petrochemical industry with complex emission constituents contributes significantly to the emissions of VOCs in China, and its VOC emission characteristics have been investigated in recent years [59]. The source profiles of the petrochemical industry in China were mainly investigated from two aspects: taking the petrochemical industry as an overall source or developing refined source profiles specific to the process units [21]. The early profiles of petrochemical industry only characterized stack emissions using outlet sampling, while VOCs from fugitive emissions were neglected [15]. Subsequently, outlet and workshop samplings were used to provide more extensive information of VOCs profiles (including stack and fugitive emissions) [15,60]. More recently, detailed process-based information was collected and used to characterize process-level profiles [3].
For VOC profiles of the overall petrochemical industry, the official databases have been established and constantly updated on the basis of a large number of localized tests in the United States, Europe, and other Western countries, while the source profiles in China are still at the stage of localization testing [60]. VOC control technologies have been increasingly promoted in the petrochemical industry, leading to variations of VOC emission characteristics. For example, leak detection and repair (LDAR) was fully implemented in petrochemical industry in China by 2017 [61]. During the VOC emission reduction period of the 13th Five-Year Plan, comprehensive management of VOC emissions, such as the wide application of oil and gas separation and recovery devices, was strengthened in the petrochemical industry in China. As a result, VOC profiles of this industry have changed obviously. For instance, the oil and gas separation devices significantly reduced the contents of light hydrocarbons in the separated crude oil components; oil and gas recovery, underwater loading, and unloading of organic liquids (such as gasoline) and hazardous chemicals (such as benzene) reduced the contribution of alkenes and aromatics; sealing and collection in wastewater treatments also resulted in a decrease in the contributions of volatile components in general [62,63].
With the improvement of VOC pollution control requirements, VOC profiles based on processes played an important role in the refined control of VOCs in the petrochemical industry. The processes generating VOCs in the petrochemical industry included heating furnace, catalytic cracking, hydrocracking, catalytic reforming, delayed coking, sulfur recovery, storage tanks, and wastewater [64]. VOC profiles based on the production processes in petrochemical industry were not comprehensive in early studies, in which only processes with large emissions were investigated, such as oil refining processes, storage tanks, and wastewater [65,66]. More recently, information on comprehensive processes from large petrochemical plants was collected and used to establish process-based VOCs profiles [17,66].
Figure 1 compares the VOC profiles of the petrochemical industry in China that have been published. The tests mentioned in these early studies were all carried out by collecting gaseous samples in SUMMA canisters and analyzing them using GC–MS/FID; thus, the test data were reliable and highly comparative. Figure 1a presents the overall characteristics of VOC profiles [10,15,17,23,66], which were relatively consistent. It is obvious that alkanes represented a much higher percentage of the total VOCs in all the studies. This is related to the high content of alkanes in crude oil, which is the most important raw material in the petrochemical industry. The major compositions were consistent with the results reported in a Greek oil refinery [67]. However, the percentages of chemical groups varied greatly in the petrochemical industry. For example, the percentages of aromatics measured by Liu et al. [23] and Wei et al. [15] were relatively high (with values of 14.6% and 19.2%, respectively), maybe caused by the fact that these studies were conducted in earlier years, and oil and gas recovery devices were not installed during the loading and unloading process of benzene, toluene, xylene, and other hazardous chemicals [62,63]. In addition, the sampling site was close to the nitrobenzene production site in Liu et al. [23], which could have resulted in high levels of benzene and toluene [23]. On the other hand, a relatively small proportion of aromatics (9.3%) was found in Mo et al. [17], which may have been caused by the raw materials and the production of products. Halocarbons accounted for a small proportion in most studies. However, methyl chloride was the main component of VOCs in a Turkish petroleum refinery, which may have been related to the chlorine content of gasoline additives [68]. The latest study suggested that OVOCs made up a small percentage (3.2%) of the petrochemical industry [10], while they were not evaluated in previous studies [15,17]. Obviously, the processes were incomplete, and the profiles were inaccurate in these previous studies.
Figure 1b shows the process-based characteristics of VOC profiles for the petrochemical industry [10,17,66]. As a whole, alkanes were the dominant chemical groups for almost all the processes, similar to the overall characteristics in the petrochemical industry (Figure 1a). The second largest groups emitted from heating, catalytic reforming, and delayed coking were aromatics, while other processes were mainly contributed by alkenes; which were mainly caused by different raw materials. For example, the use of reformate resulted in high levels of aromatics in catalytic reforming, and the use of polyacrylamide (producing propene) resulted in high levels of alkenes in wastewater treatment [17,66]. There were also discrepancies even in one process, where alkanes (60.3%) were dominant in Mo et al. [17], while alkenes (82.3%) contributed the most in Qi et al. [66] for storage tanks, which might be attributed to the different substances (gasoline or crude oil) stored in these tanks.
To sum up, the VOC profiles in the petrochemical industry were dominated by alkanes (55.6–69.8%), followed by alkenes (9.5–20.4%) and aromatics (9.3–19.2%). Halocarbons and OVOCs accounted for a small proportion, and OVOCs were often neglected in the petrochemical industry. As for refined profiles, alkanes were the most prevalent for almost processes, and the second contributors were aromatics or alkenes.

3.1.2. Merging of VOC Profiles Based on Previous Studies

A few studies of the merging or revision of VOCs profiles have been carried out. Using the method proposed by Li et al. [24], Mo et al. [69] revised and reconstructed the source profiles without OVOCs to obtain the normalized VOC source profile. Sha et al. [44] and Zhou et al. [70] also collected domestic source profiles of the petrochemical industry from the literature, and established the latest VOC profile dataset in China. Although the studies above collected a large number of domestic measurements in the petrochemical industry, some of the tests were carried out about 15 years ago, resulting in inaccurate VOC emission characteristics owing to the out-of-date data. In this study, the VOC test data before 2010 were eliminated, and the VOCs profiles in the past 5 years were complemented to compile the latest VOC profile of the petrochemical industry. OVOC species were added to the merged profile, which were often neglected in previous profiles. The merged profile could supplement the missing components in previous studies and reduce the potential uncertainty of individual measurements.
The merging of VOC profiles in this study was also used to compile process-based profiles, which played a significant role in the refined control of VOC emissions. Given the obvious discrepancies in VOC profiles caused by different substances stored in tanks in the petrochemical industry, the storage tanks were divided into three categories, i.e., gasoline, diesel, and crude oil tanks, and the corresponding source profiles were obtained. More details on VOC profile merging can be found in the Supplementary Materials (Tables S1 and S2).
Figure 2 presents the merged profiles for overall and process-based characteristics of VOCs for the petrochemical industry in China. As a whole, VOCs were mainly contributed by alkanes (60.6%), followed by alkenes (16.7%) and aromatics (14.4%), in the overall characteristics of the petrochemical industry. Although OVOCs contributed less to the total VOCs (3.2%), they were also complemented in this study. In the refining process of heating furnace, catalytic cracking, hydrocracking, catalytic reforming, delayed coking, and sulfur recovery, the percentages of alkanes were much higher, with a range of 53.0–77.7%. For wastewater treatment of sewage stripping and oxidation pond, the percentages of alkenes were commensurate, but alkanes were higher in sewage stripping. Alkanes were the most prevalent in gasoline, diesel, and crude oil tank, while the percentages of alkenes were relatively higher in gasoline tank, and aromatics were higher in diesel tank. In this study, we included relatively comprehensive chemical groups of VOCs and provided a more detailed classification of the production processes in the petrochemical industry.

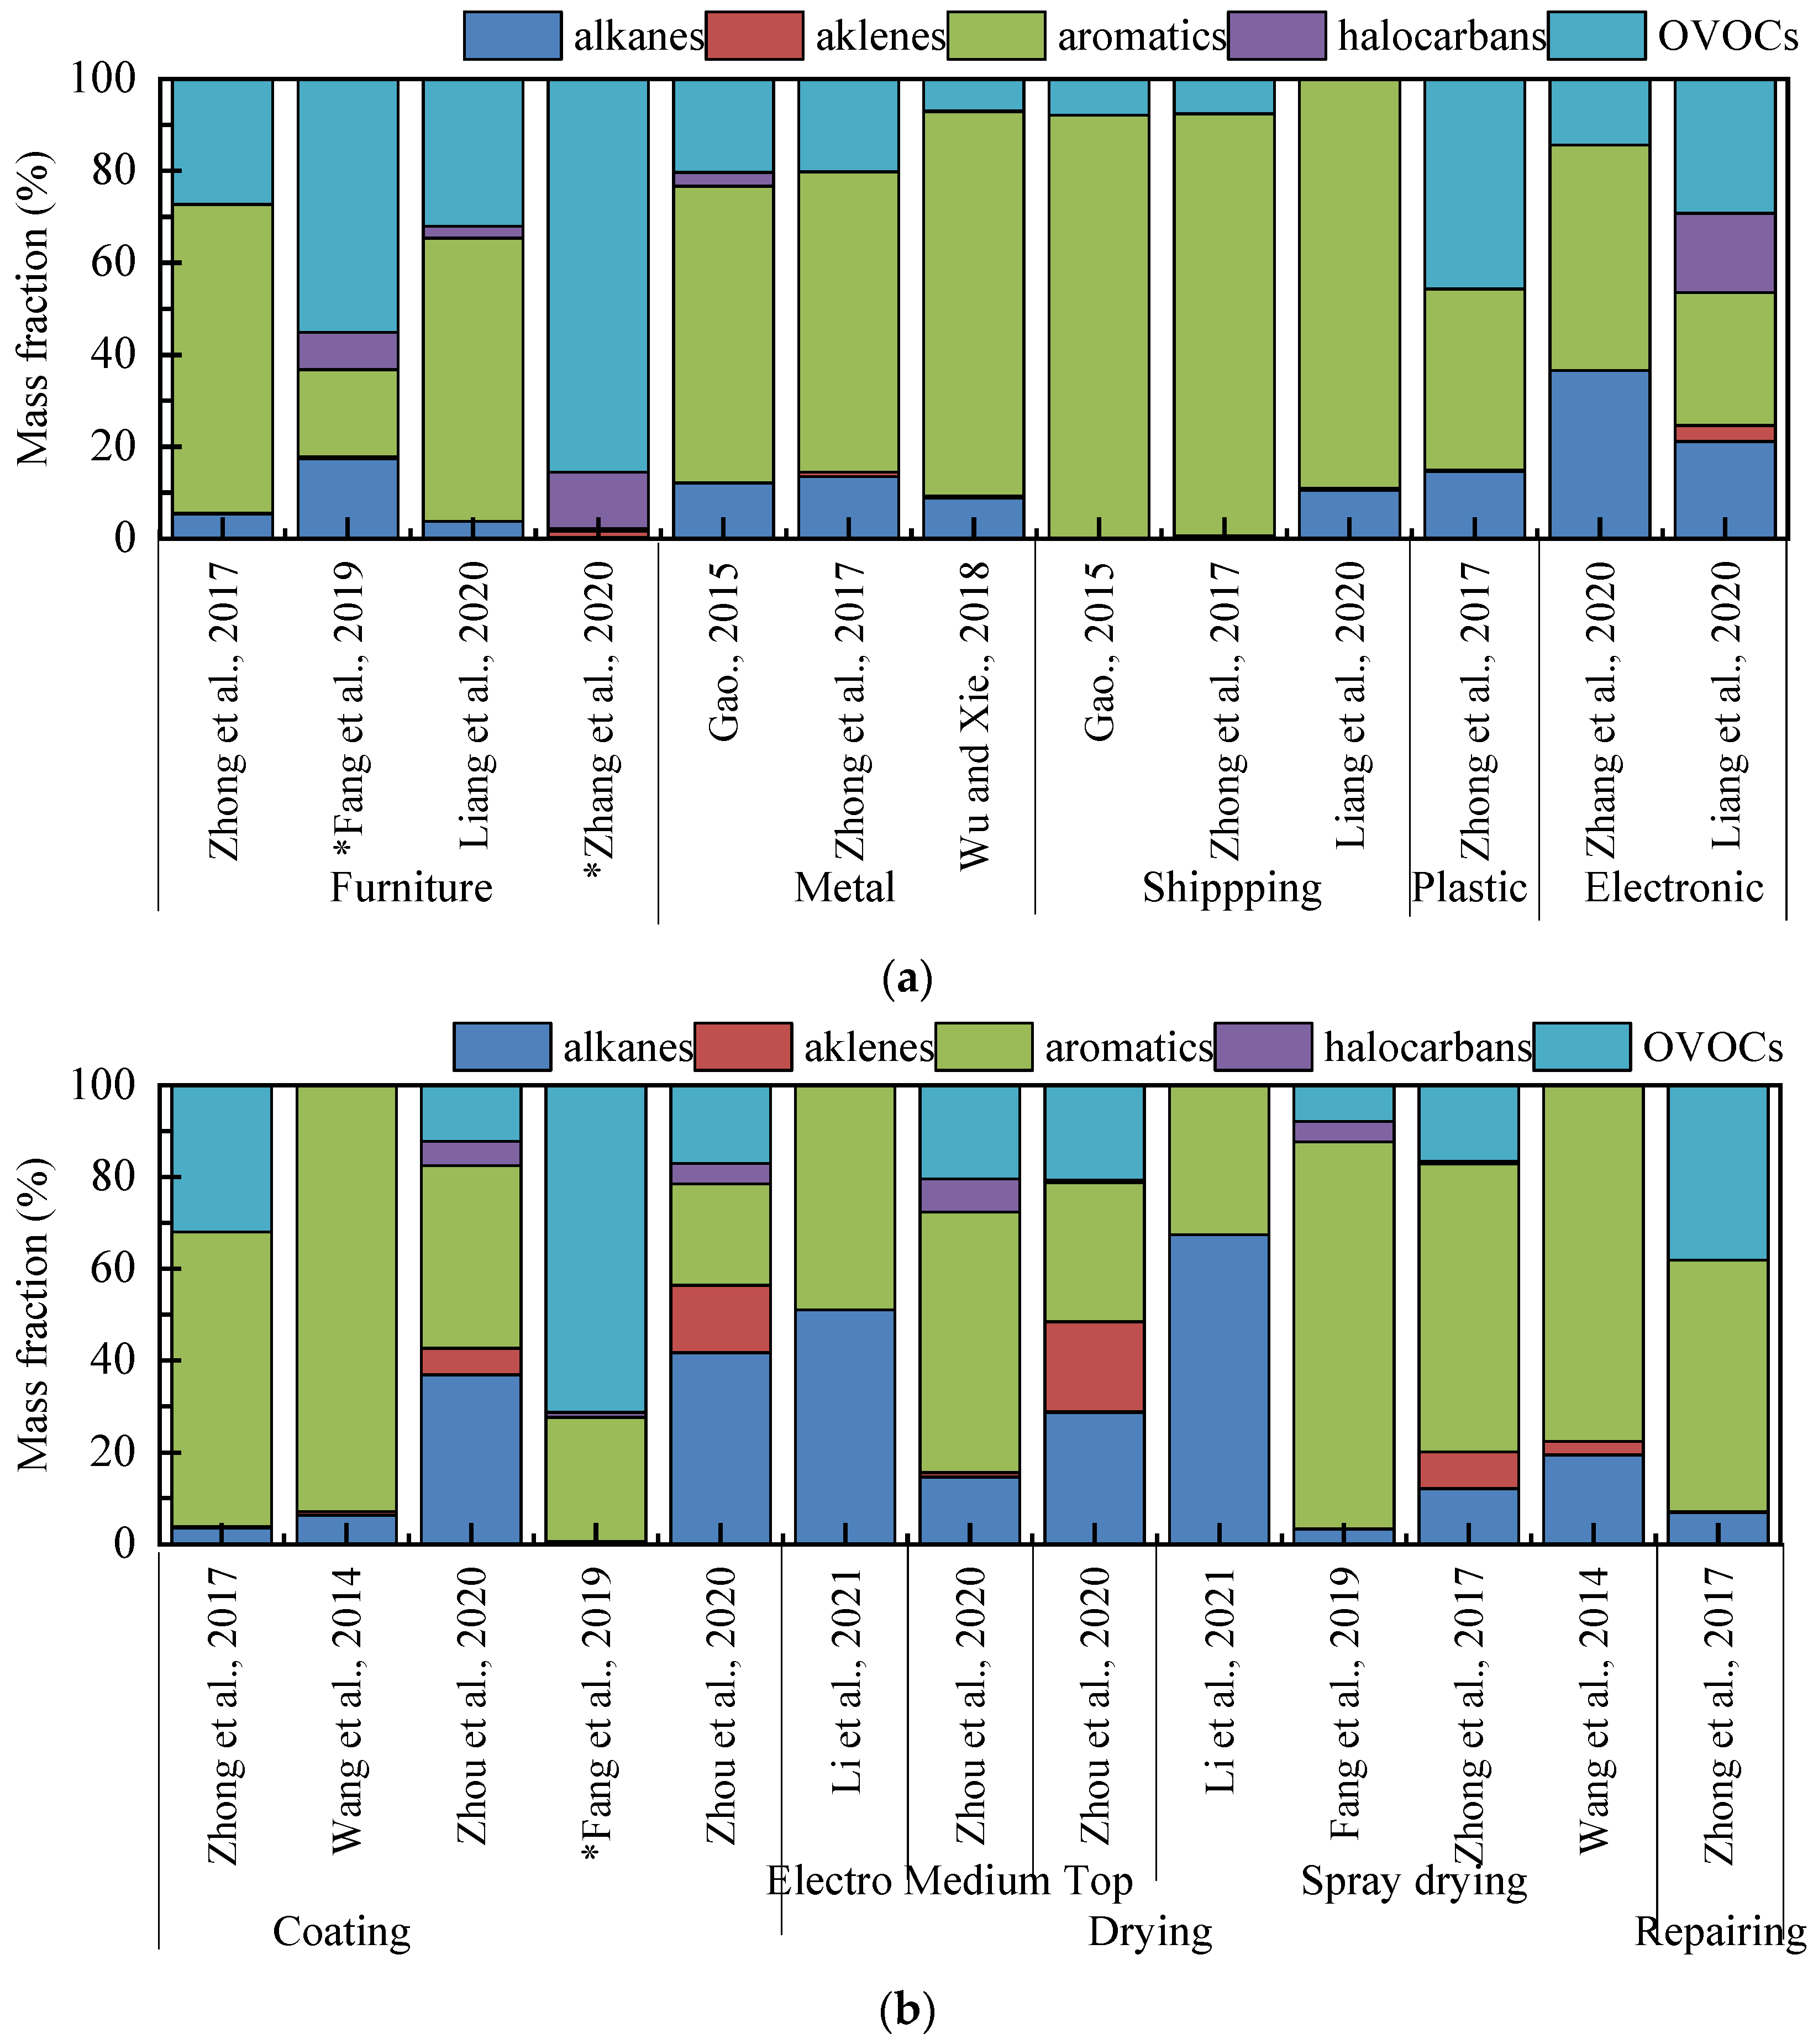
3.2. Industrial Solvent Use Industry

3.2.1. Overview of VOC Profile

The industrial solvent use industry is considered to be a significant emission source of anthropogenic VOCs, responsible for more than 15% of total VOC emissions in China [11,14,71]. According to the Chinese official Classification System, this industry can be divided into two types: printing/dyeing and surface coating; their source profiles in China were mainly determined on the basis of sectors and processes. In early studies, the measurements of single outlet sampling were conducted commonly in the industrial solvent use industry. The measurements of VOC profiles of both outlet and workshop sampling were carried out in recent years, thereby improving the accuracy of VOCs profiles in this industry [19,23]. In addition, OVOC species were included in the profiles [37].
During the VOC emission reduction period (13th Five-Year Plan), VOC emission control measurements including raw material substitution, process improvement, and waste gas treatment were widely carried out in the industrial solvent use industry. For example, in the automobile industry and wooden furniture manufacturing industry, water-based paints with OVOCs as the main components gradually replaced solvent-based paints with a high content of aromatics. Furthermore, the process units were required to be fully enclosed in the industrial solvent use industry, thus reducing the VOC emissions [72,73]. The effects of these measurements were reflected in the localized source profiles in the industrial solvent use industry in China [30,74,75,76], where OVOCs replaced aromatics and became the dominant chemical group.
In addition to sector-based profiles of the industrial solvent use industry in China, the process-based profiles were also studied in certain subsectors [19,34]. In the printing and dyeing industry, the overall VOC profiles of different manufacturing technologies were established due to simple production processes (gravure printing, letterpress printing, etc.) [10,19]. Process-based profiles were established in the surface coating industry, while they were not comprehensive in general. For instance, process-based VOCs profiles in the automobile manufacturing industry were established, covering comprehensive production processes (coating, drying and repairing) [7,34]. However, only VOC profiles for stack and fugitive emission were established in most surface coating industries [19,77], which did not involve specific processes.
The chemical groups emitted from the printing and dyeing industry are illustrated in Figure 3. The chemical groups emitted from the sector-based surface coating industry and the process-based profiles of the automobile industry are shown in Figure 4 [7,18,34,36,74,77,78,79,80,81,82]. Most of the measurements mentioned in Figure 3 and Figure 4 were collected in SUMMA canisters and analyzed by GC–MS; thus, the profiles were reliable and highly comparative. As can be seen, aromatics and OVOCs were the dominant chemical groups for almost all industrial solvent use industries, while there were large differences in the composition characteristics among different industries. For example, OVOCs were the predominant contributors (36.6–87.8%) in the printing industry, while aromatics (49.0–92.2%) were the most abundant chemical compounds in the surface coating industry. This is consistent with the facts that toluene accounted over 50% in the process of paint coating in Mexica, mainly due to the predominance of aromatics in the paints [83]. The differences were related to the high content of OVOCs in inks and large amounts of aromatics in solvent-based paints.
Moreover, chemical groups emitted from different processes of the industrial solvent use industry varied greatly. Through the detailed comparison of raw and auxiliary materials, it was pointed out that the discrepancies were caused by the comprehensive effect of inks, thinners, and cleaning solvents [7]. VOC emission characteristics were different in each production process studied in automobile manufacturing industry. OVOCs (71.3%) were the most important contributors to paint coating, and aromatics (84.1%) were dominant for drying processes [34], mainly attributed to the fact that water-based paints were used in paint-coating process and solvent-based paints in the latter.
There were also discrepancies in the same industry among present studies. For instance, aromatics were the main contributors in the furniture manufacturing industry in Zhong et al. [7] and Liang et al. [79], whereas OVOCs were the dominant components in Fang et al. [34] and Zhang et al. [77] (Figure 4a). The main reason can be attributed to the fact that solvent-based paints were used in the former and water-based paints were applied in the latter, as mentioned above. Moreover, additional measurements by GC–MS/FID were conducted by Fang et al. [34], which showed a high level of ethanol and led to the relatively high contribution of OVOCs (55.1%). Furthermore, as shown Figure 4b, different conclusions were found, even for the same process. For example, OVOCs were found to be the main contributor in Fang et al. [34] in the electrophoretic drying process, while the proportions of alkanes and aromatics were high in Zhou et al. [18]. This was attributed to the water-based paints and solvent-based paints used in the sampling objects, respectively. Compared with the two studies above, OVOC components were not detected in Li et al. [82], probably owing to the loss of OVOC species due to air bag sampling.
In summary, OVOCs were the most prevalent components in the printing and dyeing industry, contributing 34.4–87.8% of the total VOCs. The VOCs emitted by the industrial surface coating industry with solvent-based paints were mainly aromatics (65.1–96.6%), whereas OVOCs (55.1–85.5%) dominated in the water-based surface coating industry.

3.2.2. Merging of VOC Profiles Based on Previous Studies

In previous studies, domestic profiles were collected from the literature, and databases of VOC profiles were compiled in the industrial solvent use industry in China [44,70]. At present, the control measurement of raw material substitution (i.e., oil-to-water transformation) is supposed to be completed in some industries, including furniture manufacturing and the coating process of the automobile manufacturing industry [75]. However, due to the focus on solvent-based VOCs profiles and the lack of tests of water-based profiles in early studies, the consequence of these control measurements was not taken into account in the compiled profiles in these industries. Therefore, the domestic VOC profiles of these two industries using water-based paints as their raw materials were collected and merged using the latest test data from literature [7,34,77,84]. Although the oil-to-water transformation had not yet been completed in other industries (metal surface coating, shipping manufacturing industries, etc.), the early profiles were unable to reflect the existing emission characteristics due to the change in raw materials. Therefore, the profiles in early studies were eliminated. More details on the original and merged VOC profiles can be found in the Supplementary Materials (Tables S3 and S4).
Figure 5 displays the compositions of chemical groups in merged VOC profiles from the industrial solvent use industry, as well as the differences between the printing/dyeing and surface coating industries. OVOCs were the most dominant compounds in the printing and dyeing industry where inks with a high content of OVOCs were commonly applied, ranging from 38.6% to 59.7%. In the surface coating industry, OVOCs were the most prevalent in processes with water-based paints, such as furniture manufacturing industries and the automobile coating process. Solvent-based paints with high amounts of aromatics were frequently applied in metal surface coating, shipping coating, and other surface coating industries, and aromatics were major contributors of the total VOCs in these industries. Environmentally friendly coating products such as water-based paints are suggested by the Chinese government at present; therefore, studies of VOC profiles based on water-based paints should be strengthened in the future.

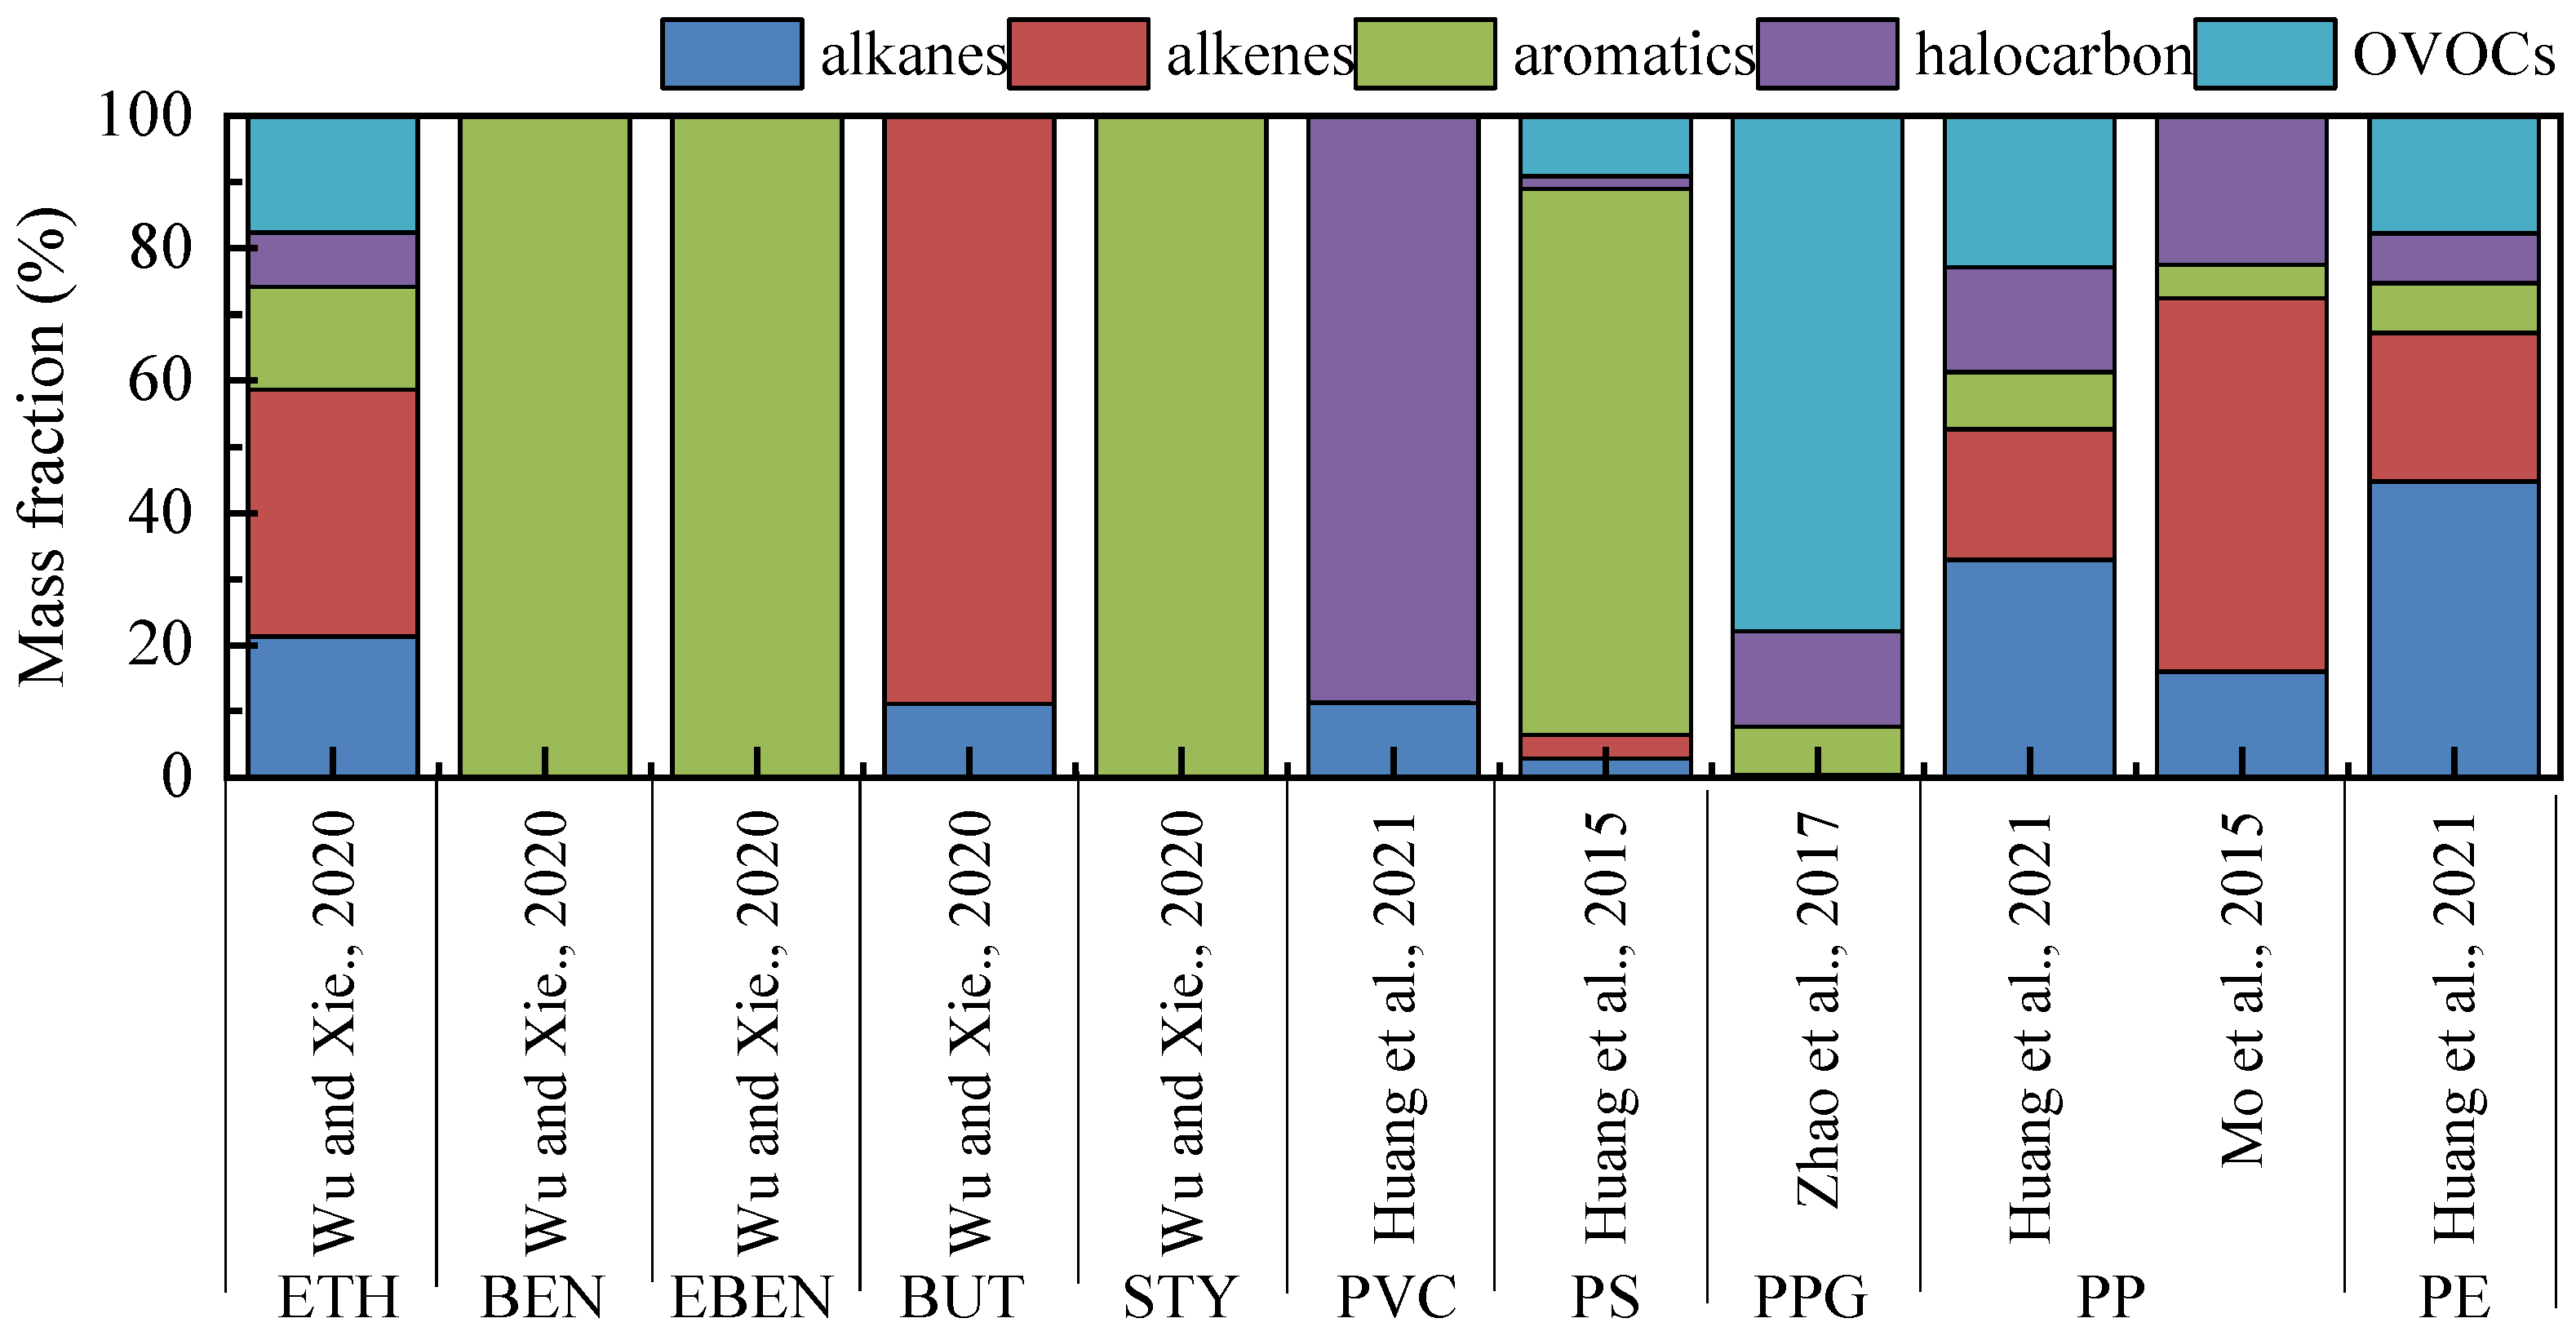
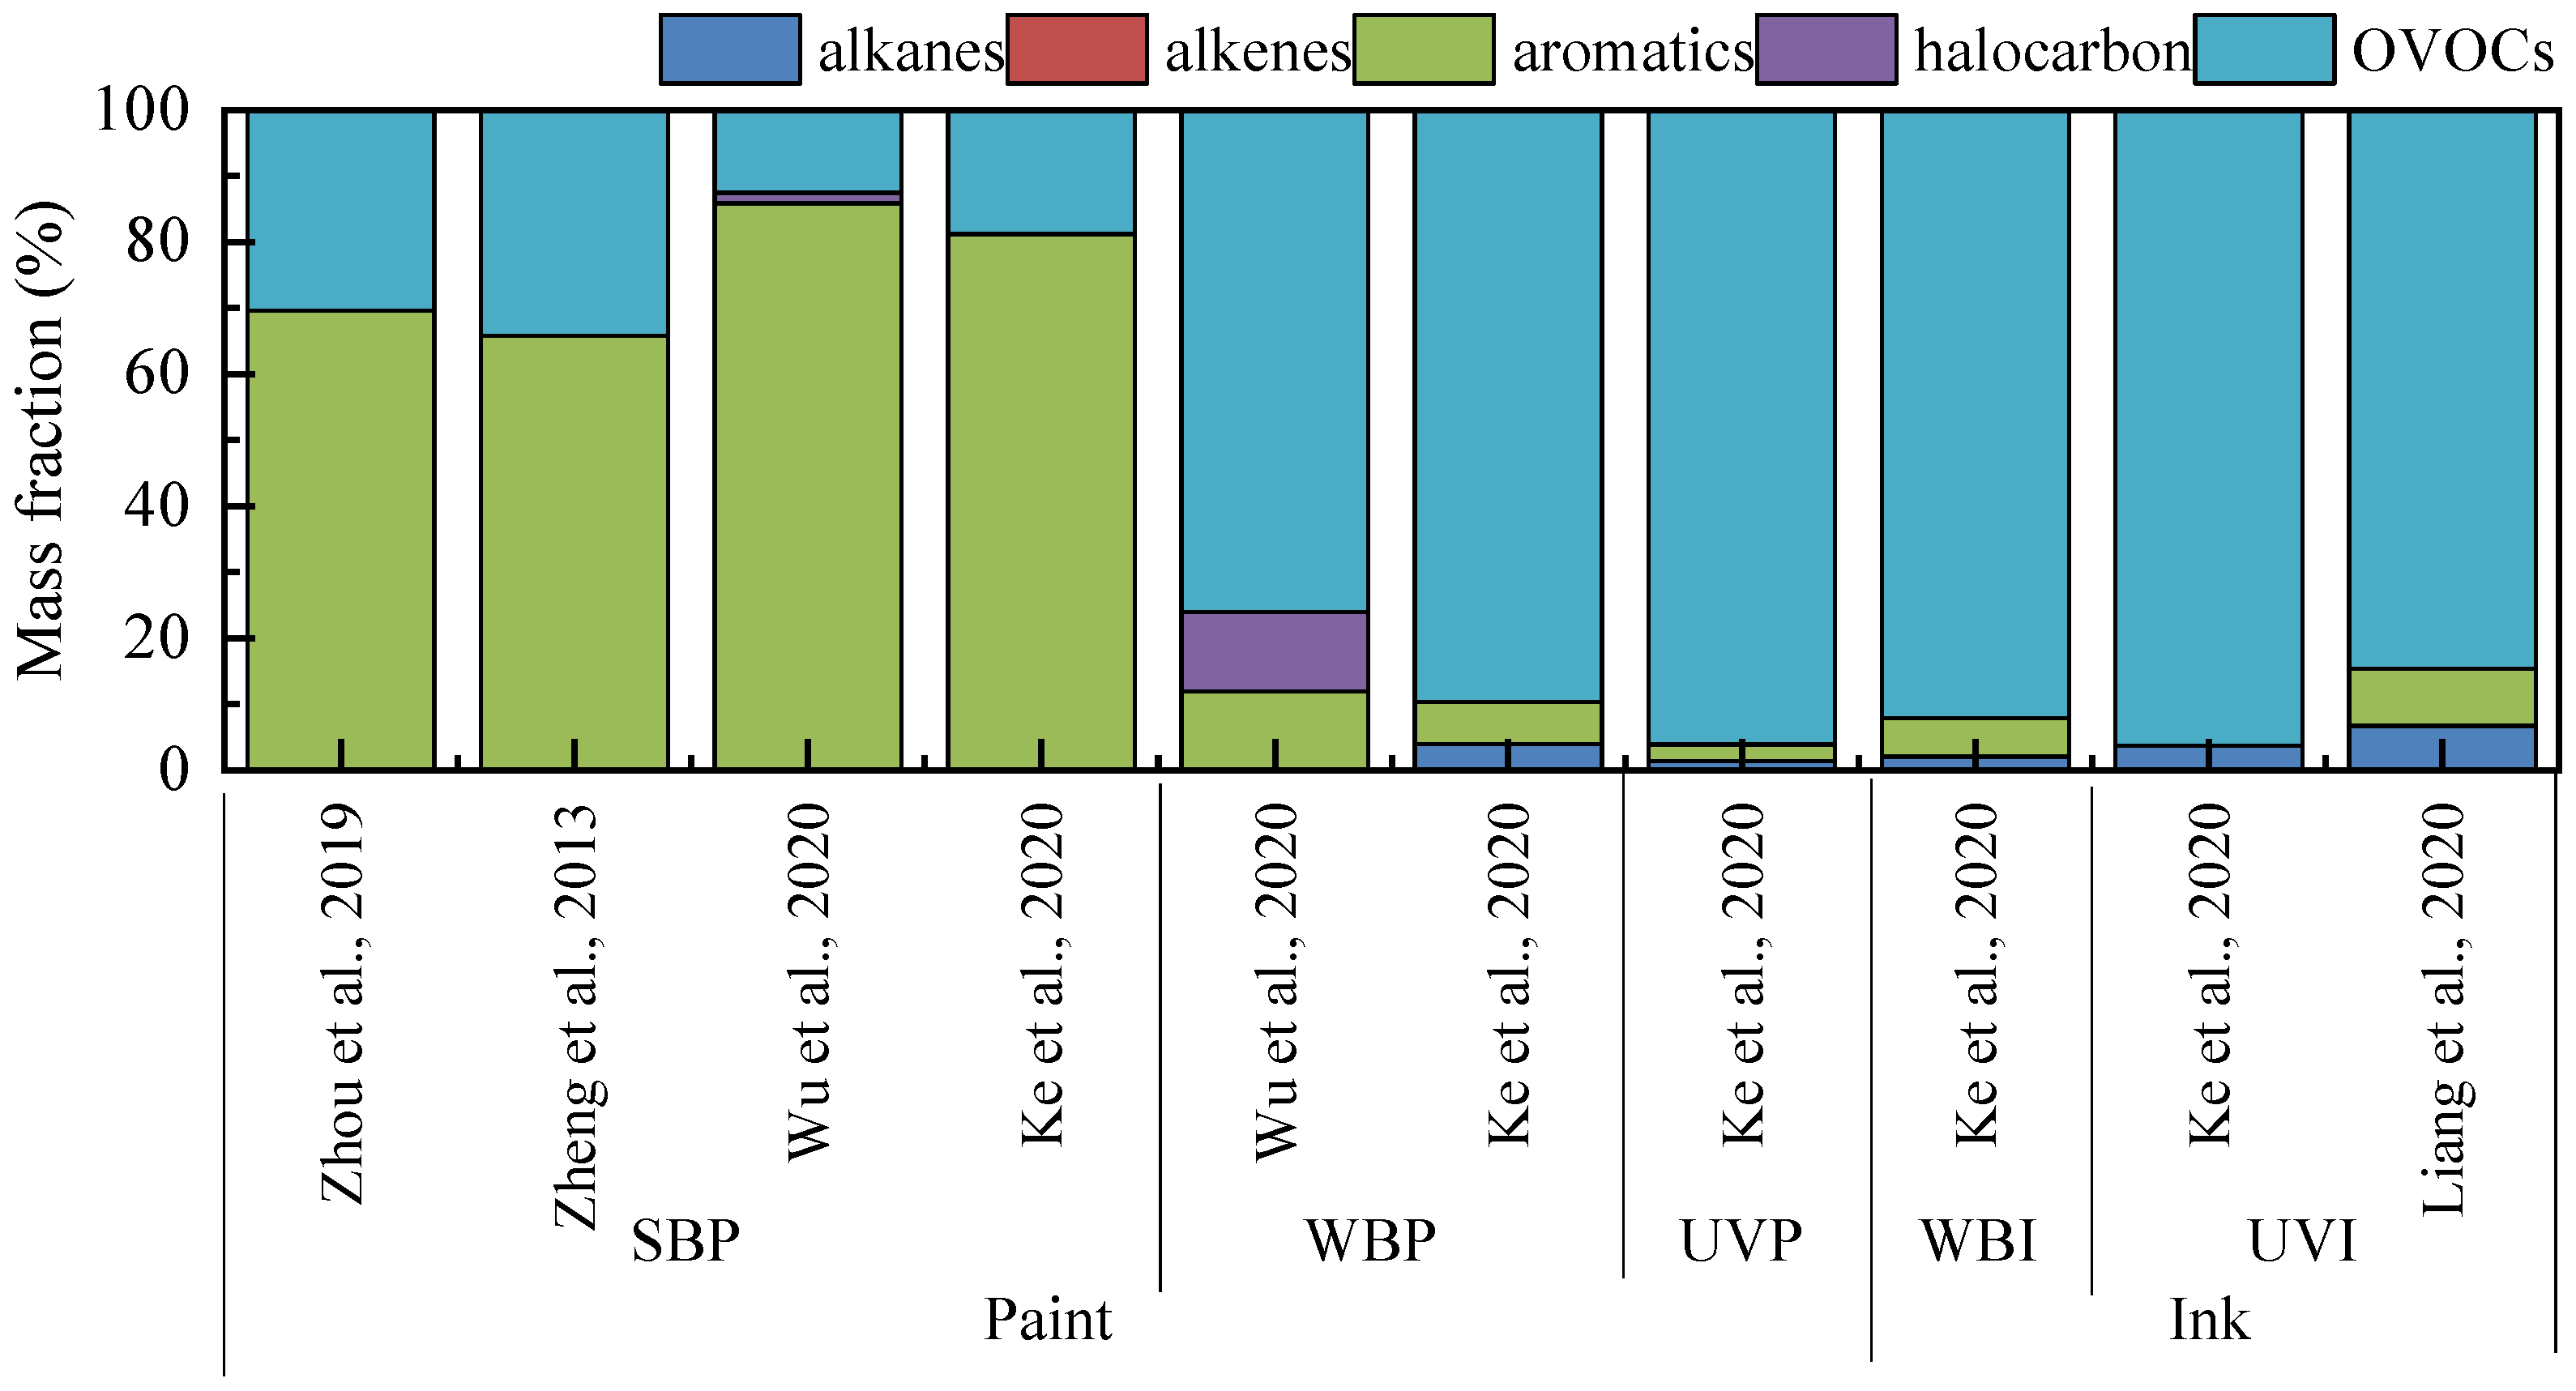
3.3. Chemical Industry

3.3.1. Overview of VOC Profiles

The chemical industry, which serves as an important component of the economic development of China, is complex and involves many subindustries: the basic chemical industry, synthetic material manufacturing, paint and ink production, and other industries [85]. In previous studies, samples of the chemical industry were mainly collected from the flues of enclosed plants, from stacks, and within production areas of incompletely enclosed plants [32,41]. Usually, product-based VOC profiles were carried out in the basic chemical industry and synthetic material manufacturing industry [28,33,41], whereas the profiles based on solvent properties were extensively studied in the paint and ink production industries [82].
The compositions of chemical groups in VOC profiles in studies from the three industries above are displayed in Figure 6, Figure 7 and Figure 8 [14,16,17,32,33,41,79,81,86,87,88,89]. The samples were all collected in SUMMA canisters and analyzed by GC–MS and/or GC–MS/FID. As shown in these figures, the compositions of VOCs in different sectors varied significantly. The dominant chemical groups differed in subsectors in the basic chemical industry (Figure 6). For example, aromatics (82.6–100%) predominated in VOC emissions from chemical production related to aromatics (e.g., benzene (BEN), ethylbenzene (EBEN), styrene (STY), and polystyrene (PS)). Similarly, alkenes (37.1–50.0%) dominated in the production processes related to alkenes (e.g., ethylene (ETH), butadiene (BUT), and polyethylene (PE)). Halocarbons (88.7%) and OVOCs (77.9%) dominated in the polyvinylchloride (PVC) and polypropylene glycol production processes, respectively.
In general, similar to the basic chemical industry, the main compositions of VOCs varied in subsectors of the synthetic material manufacturing industry (Figure 7). Specifically, VOC emissions from productive processes of SIS rubber (SIS), SEBS rubber (SEBS), styrene butadiene rubber (SBR), and acrylic resin (AR) were dominated by alkanes (49.7–85.8%), while those from phenol formaldehyde resin (PF), epoxy resin (ER), coating resins (CR), and acrylonitrile–butadiene–styrene (ABS) production were mainly contributed by aromatics (46.3–96.5%). Furthermore, the VOCs emitted from the production of ethylene propylene diene monomer (EPD) and polyethylene terephthalate (PET) were dominated by halocarbons (46.2%) and OVOCs (87.1%), respectively. However, there were discrepancies even in the same production process among studies due to the monitoring methods and pollution control technologies. For example, GC–MS was used to analyze the samples in Huang et al. [32], revealing that OVOCs accounted for 22.9% in PP production process (Figure 6). Although GC–MS/FID was applied in Mo et al. [17], OVOC species were not identified and quantified, probably because they were lost during sampling. Moreover, as shown in Figure 7, aromatics contributed to 96.5% [16], 57.2% [33], and 20.2% [32] of the three PF production studies. It is possible that water curtain absorption was applied in the plant measured by Ma et al. [33], whereas alkali spray, water spray, and activated carbon adsorption were used in Zhang et al. [32]; the pollution control devices were not explained in Huang et al. [32]. The strong adsorption capacity of activated carbon for aromatics [90] was the main reason for the low contribution of aromatics in Zhang et al. [16]. As shown in Figure 8, in the paint and ink production industry, aromatics (45.3–81.8%) were mainly released in the productive processes of solvent-based paint in the paint and ink production industries, while OVOCs (46.5–96.1%) dominated those of water-based paint and inks, similar to VOCs emitted from the solvent use industries.
In general, the compositions of VOCs in different production processes varied significantly across the basic chemical industry and synthetic material industry. Alkanes (33.0–85.8%) were predominant in the production of alkane-related products, and alkenes had a mass fraction of 37.1–80.0% in that of alkene-emitting products. Aromatics accounted for 55.2–100.0% in processes of aromatics products. Halocarbons accounted for 46.2% and 71.9% in the production of EPD and PC, respectively. The production processes of OVOC-emitting products were contributed by OVOCs, with emission contributions of 32.4–87.1%. For the paint and ink production industry, aromatics and OVOCs represented a much higher percentage of the total VOCs.

3.3.2. Merging of VOC Profiles Based on Previous Studies

In previous studies, domestic profiles were collected from test data, and the databases of VOCs profiles involving the chemical industry were established, including the production of basic chemical products, synthetic rubber, resin, and paint [44,70]. However, due to the wide range of products involved in the chemical industry, the product types were still limited in these databases. In this study, the VOC profiles for 30 chemical products (including 11 basic chemical products, 14 synthetic rubbers and resins, and five coatings and inks) were further collected and merged to establish a more comprehensive profile of the chemical industry. More details on VOC profile merging can be found in the Supplementary Materials (Tables S5 and S6).
Figure 9 illustrates the chemical groups in merged VOC profiles compiled in this study for the chemical industry in China. As shown in the figure, chemical groups were quite different among various production processes. Obviously, the composition of VOCs for the basic chemical industry were determined by the components in products. ETH, BUT, and PP were alkane-related products, and the contribution of alkanes in their production processes was 34.2–88.9%. As the main raw materials, aromatics has a mass fraction of 82.5–100% in the production processes of BEN, EBEN, STY, and PS. In addition, halocarbons accounted for 88.6% in the production processes of PVC, and OVOCs accounted for 77.9% in PPG production. For the synthetic material manufacturing industry, the proportion of alkanes in the production processes of alkane-emitting products (SISR, SEBSR, SBR, and AR) ranged from 59.8% to 85.8%, and aromatics contributed 40.0–64.0% for PU, PF, ER, CR, and ABS. Moreover, the contribution of OVOCs in ERP, PET, and FR production was 36.3–87.6%, and the share of halocarbons in EPD and PC production was 49.6% and 48.0%, respectively. OVOCs (76.5–96.2%) were the largest contributors in the paint and ink industry, except for SBP production where aromatics contributed to 75.1%, followed by OVOCs (23.0%). Although VOC profiles of the production of 30 products in the chemical industry were compiled, the source profiles were still limited. This was attributed to the fact that the chemical industry has a variety of subsectors and a wide range of products, whereas the source profiles from the production of the products were limited. More profiles of production processes need to be measured to improve the recognition of the VOC emission characteristics in the chemical industry in the future.

4. Conclusions and Outlook

In recent years, great progress has been made in establishing localized VOC source profiles in the petrochemical, solvent use, and chemical industries in China, including both sector-based and process-based profiles. However, some of these profiles are outdated or lack scientific corrections. According to previous studies, the most up-to-date measurement-based VOCs profiles of the petrochemical, solvent use, and chemical industries were developed in this study, increasing the knowledge of VOC source profiles of typical industries. Specifically, the early profiles which are unable to represent the VOC emission characteristics at present were eliminated, and the updated profiles that characterize the latest industrial emission characteristics (e.g., water-based solvent use industry) were added. In the profiles compiled in this study, missing species, particularly OVOC species, were supplemented, and process-based profiles (petrochemical and automobile manufacturing industry) were merged on the basis of domestic measurements. As a result, more refined profiles were obtained in typical industries, thus further improving the cognition of VOC profiles.
The conclusions were as follows:
(1) Alkanes (55.6–69.8%) dominated in the overall petrochemical industry and most processes, followed by alkenes (9.5–20.4%) and aromatics (9.3–19.2%). Halocarbons and OVOCs accounted for a small proportion, and OVOCs were often neglected in the petrochemical industry. These groups accounted for 60.6%, 16.7%, 14.4%, 5.3%, and 3.2% via adjustment and reconstruction of the test data from the literature.
(2) Aromatics and OVOCs dominated in the solvent use industry. According to the selection and integration of profiles, OVOCs were the most prevalent in printing and dyeing industries, furniture manufacturing industries, and automobile coating processes, whereas aromatics were the major contributors of the total VOCs in metal surface coating, shipping coating, and other surface coating industries.
(3) The compositions of VOCs in different production processes varied significantly in the chemical industry, mainly related to the raw materials used in the products. Although VOC profiles of the production of 30 products in chemical industry were compiled, the source profiles were still limited due to the wide range of products and limited profile studies.
In the future, it will be essential to carry out more studies on VOC profiles related to the sampling, establishment, and evaluation methods. Firstly, it is suggested to strengthen the regulation of sampling and analytical methods for VOC profiles to establish more reliable and representative profiles. Secondly, the establishment of process-based profiles for all industries should be further studied. It is not only essential to accurately acknowledge the emission characteristics from various pollution sources, but also important to formulate cost-effective VOC pollution control strategies. Thirdly, the measurements for industrial and other sources need to be strengthened and updated to establish up-to-date source profiles of VOCs. Lastly, the evaluation of VOC profiles should be further studied to provide reliable support for the applications of VOC profiles, such as air quality modeling, source allocation, and policy formulation.

Supplementary Materials

The following supporting information can be downloaded at https://www.mdpi.com/article/10.3390/atmos14050878/s1: Table S1 The mass fraction of chemical groups of original profiles for petrochemical industry. Table S2 The mass fraction of chemical groups of merged profiles for petrochemical industry. Table S3 The mass fraction of chemical groups of original profiles for industrial solvent-used industry. Table S4 The mass fraction of chemical groups of merged profiles for industrial solvent-used industry. Table S5 The mass fraction of chemical groups of original profiles for chemical industry. Table S6 The mass fraction of chemical groups of merged profiles for chemical industry. References [91,92,93] are cited in the Supplementary Materials.

Author Contributions

Conceptualization, Z.S.; methodology, S.W.; investigation, S.W. and Z.S.; data curation, S.W.; writing—original draft preparation, S.W. and Y.Z.; writing—review and editing, S.W., Y.Z., and L.W.; supervision, H.W. and J.Z. All authors read and agreed to the published version of the manuscript.

Funding

This research was funded by the Provincial Ecological Environment Research Achievements Transformation and Promotion Project (2022004), the Science and Technology Planning Project of the Jiangsu Provincial Environmental Protection Group (No. JSEP-GJ20212002-RE-JT), and the Research and Development Project of Jiangsu Environmental Engineering Technology Co., Ltd. (JSEP-GJ202220014-RE-ZL).

Institutional Review Board Statement

Not applicable.

Informed Consent Statement

Not applicable.

Data Availability Statement

Not applicable.

Acknowledgments

The authors acknowledge the support received from Jie Zhang and Hailing Wang. The authors sincerely thank the editors for their valuable input that improved the quality of the paper.

Conflicts of Interest

The authors declare no conflict of interest.

References

  1. Peter, E.; Steven, B.; James, R.; Ravan, A.; Robert, B.; Joost, d.; William, D.; Robert, F.; James, F.; Jessica, G.; et al. High winter ozone pollution from carbonyl photolysis in an oil and gas basin. Nature 2014, 514, 351–354. [Google Scholar]
  2. Huang, R.; Zhang, Y.; Carlo, B.; Ho, K.; Cao, J.-J.; Han, Y.; Kaspar, D.; Jay, S.; Stephen, P.; Francesco, C. High secondary aerosol contribution to particulate pollution during haze events in China. Nature 2014, 514, 218–222. [Google Scholar] [CrossRef]
  3. Bray, C.D.; Strum, M.; Simon, H.; Riddick, L.; Kosusko, M.; Menetrez, M.; Hays, M.D.; Rao, V. An Assessment of Important Speciate Profiles in the Epa Emissions Modeling Platform and Current Data Gaps. Agric. Week 2019, 207, 93–104. [Google Scholar] [CrossRef]
  4. Ou, J.; Zheng, J.; Li, R.; Huang, X.; Zhong, Z.; Zhong, L.; Lin, H. Speciated OVOC and VOC emission inventories and their implications for reactivity-based ozone control strategy in the Pearl River Delta region, China. Sci. Total Environ. 2015, 530, 393–402. [Google Scholar] [CrossRef]
  5. Alastair, L.; Jim, H.; David, C.; Jacqueline, H. An increasing role for solvent emissions and implications for future measurements of volatile organic compounds. Philos. Trans. Ser. A Math. Phys. Eng. Sci. 2020, 378, 20190328. [Google Scholar]
  6. Wang, M.; Li, S.; Zhu, R.; Zhang, R.; Zu, L.; Wang, Y.; Bao, X. On-road tailpipe emission characteristics and ozone formation potentials of VOCs from gasoline, diesel and liquefied petroleum gas fueled vehicles. Atmos. Environ. 2020, 223, 117294. [Google Scholar] [CrossRef]
  7. Zhong, Z.; Sha, Q.; Zheng, J.; Yuan, Z.; Gao, Z.; Ou, J.; Zheng, Z.; Li, C.; Huang, Z. Sector-based VOCs emission factors and source profiles for the surface coating industry in the Pearl River Delta region of China. Sci. Total Environ. 2017, 583, 19–28. [Google Scholar] [CrossRef]
  8. Niu, Z.-Z.; Kong, S.-F.; Yan, Q.; Zheng, S.-R.; Zheng, H.; Zeng, X.; Yao, L.-Q.; Wu, J.; Zhang, Y.; Wu, F.-Q.; et al. Profile Characteristics of VOCs from Wood and Economic Crop Burning. Huan Jing Ke Xue Huanjing Kexue 2020, 41, 1107–1115. [Google Scholar] [PubMed]
  9. He, W.; Shi, A.; Shao, X.; Nie, L.; Wang, T.; Li, G. Insights into the comprehensive characteristics of volatile organic compounds from multiple cooking emissions and aftertreatment control technologies application. Atmos. Environ. 2020, 240, 804. [Google Scholar] [CrossRef]
  10. Shen, L.; Xiang, P.; Liang, S.; Chen, W.; Wang, M.; Lu, S.; Wang, Z. Sources Profiles of Volatile Organic Compounds (VOCs) Measured in a Typical Industrial Process in Wuhan, Central China. Atmosphere 2018, 9, 297. [Google Scholar] [CrossRef]
  11. Sun, W.; Shao, M.; Granier, C.; Liu, Y.; Ye, C.S.; Zheng, J.Y. Long-Term Trends of Anthropogenic SO2, NOx, CO, and NMVOCs Emissions in China. Earths Future 2018, 6, 1112–1133. [Google Scholar] [CrossRef]
  12. Wu, R.; Bo, Y.; Li, J.; Li, L.; Li, Y.; Xie, S. Method to establish the emission inventory of anthropogenic volatile organic compounds in China and its application in the period 2008–2012. Atmos. Environ. 2016, 127, 244–254. [Google Scholar] [CrossRef]
  13. Simayi, M.; Hao, Y.; Li, J.; Wu, R.; Shi, Y.; Xi, Z.; Zhou, Y.; Xie, S. Establishment of county-level emission inventory for industrial NMVOCs in China and spatial-temporal characteristics for 2010–2016. Atmos. Environ. 2019, 211, 194–203. [Google Scholar] [CrossRef]
  14. Zhao, Y.; Mao, P.; Zhou, Y.; Yang, Y.; Zhang, J.; Wang, S.; Dong, Y.; Xie, F.; Yu, Y.; Li, W. Improved provincial emission inventory and speciation profiles of anthropogenic non-methane volatile organic compounds: A case study for Jiangsu, China. Atmos. Chem. Phys. 2017, 17, 7733–7756. [Google Scholar] [CrossRef]
  15. Wei, W.; Cheng, S.; Li, G.; Wang, G.; Wang, H. Characteristics of volatile organic compounds (VOCs) emitted from a petroleum refinery in Beijing, China. Atmos. Environ. 2014, 89, 358–366. [Google Scholar] [CrossRef]
  16. Zhang, L.; Zhu, X.; Wang, Z.; Zhang, J.; Liu, X.; Zhao, Y. Improved speciation profiles and estimation methodology for VOCs emissions: A case study in two chemical plants in eastern China. Environ. Pollut. 2021, 291, 118192. [Google Scholar] [CrossRef]
  17. Mo, Z.; Shao, M.; Lu, S.; Qu, H.; Zhou, M.; Sun, J.; Gou, B. Process-specific emission characteristics of volatile organic compounds (VOCs) from petrochemical facilities in the Yangtze River Delta, China. Sci. Total Environ. 2015, 533, 422–431. [Google Scholar] [CrossRef]
  18. Zhou, Z.; Deng, Y.; Zhou, X.; Wu, K.; Tan, Q.; Yin, D.; Song, D.; Chen, Q.; Zeng, W. Source Profiles of Industrial Emission-Based VOCs in Chengdu. Huan Jing Ke Xue Huanjing Kexue 2020, 41, 3042–3055. [Google Scholar]
  19. Zheng, J.; Yu, Y.; Mo, Z.; Zhang, Z.; Wang, X.; Yin, S.; Peng, K.; Yang, Y.; Feng, X.; Cai, H. Industrial sector-based volatile organic compound (VOC) source profiles measured in manufacturing facilities in the Pearl River Delta, China. Sci. Total Environ. 2013, 456–457, 127–136. [Google Scholar] [CrossRef]
  20. Mo, Z.; Shao, M.; Lu, S. Review on volatile organic compounds (VOCs) source profiles measured in China. Acta Sci. Circumstantiae 2014, 34, 2179–2189. [Google Scholar]
  21. Xu, H.; Tian, M.S.; Wei, W.; Song, C.; Liu, Y.R. Progress in the study of volatile organic compound composition of petrochemical industry in China. Pet. Process. Petrochmicals 2022, 53, 9–16. [Google Scholar]
  22. Pang, X.; Mu, Y.; Yuan, J.; He, H. Carbonyls emission from ethanol-blended gasoline and biodiesel-ethanol-diesel used in engines. Atmos. Environ. 2008, 42, 1349–1358. [Google Scholar] [CrossRef]
  23. Liu, Y.; Shao, M.; Fu, L.; Lu, S.; Zeng, L.; Tang, D. Source profiles of volatile organic compounds (VOCs) measured in China: Part I. Atmos. Environ. 2008, 42, 6247–6260. [Google Scholar] [CrossRef]
  24. Li, M.; Zhang, Q.; Streets, D.G.; He, K.B.; Cheng, Y.F.; Emmons, L.K.; Huo, H.; Kang, S.C.; Lu, Z.; Shao, M.; et al. Mapping Asian anthropogenic emissions of non-methane volatile organic compounds to multiple chemical mechanisms. Atmos. Chem. Phys. 2014, 14, 5617–5638. [Google Scholar] [CrossRef]
  25. Simon, H.; Beck, L.; Bhave, P.V.; Divita, F.; Hsu, Y.; Luecken, D.; Mobley, J.D.; Pouliot, G.A.; Reff, A.; Sarwar, G.; et al. The development and uses of EPA’s SPECIATE database. Atmos. Pollut. Res. 2010, 1, 196–206. [Google Scholar] [CrossRef]
  26. Wang, L.; Wang, L.; Zhang, W. Science and Technology Progress on Air Pollution Prevention and Control in Recent Ten Years and Future Prospect in China. Clim. Environ. Res. 2022, 27, 787–794. [Google Scholar]
  27. Cheng, N.; Jing, D.; Zhang, C.; Chen, Z.; Li, W.; Li, S.; Wang, Q. Process-based VOCs source profiles and contributions to ozone formation and carcinogenic risk in a typical chemical synthesis pharmaceutical industry in China. Sci. Total Environ. 2021, 752, 141899. [Google Scholar] [CrossRef]
  28. Mo, Z.; Niu, H.; Lu, S.; Shao, M.; Gou, B. Process-based Emission Characteristics of Volatile Organic Compounds (VOCs) from Paint Industry in the Yangtze River Delta, China. Huanjing Kexue 2015, 36, 1944–1951. [Google Scholar]
  29. Wang, H.; Xiang, Z.; Wang, L.; Jing, S.; Lou, S.; Tao, S.; Liu, J.; Yu, M.; Li, L.; Lin, L.; et al. Emissions of volatile organic compounds (VOCs) from cooking and their speciation: A case study for Shanghai with implications for China. Sci. Total Environ. 2018, 621, 1300–1309. [Google Scholar] [CrossRef]
  30. Yuan, B.; Shao, M.; Lu, S.; Wang, B. Source profiles of volatile organic compounds associated with solvent use in Beijing, China. Atmos. Environ. 2010, 44, 1919–1926. [Google Scholar] [CrossRef]
  31. Pandya, G.H.; Gavane, A.G.; Bhanarkar, A.D.; Kondawar, V.K. Concentrations of volatile organic compounds (VOCs) at an oil refinery. Int. J. Environ. Stud. 2006, 63, 337–351. [Google Scholar] [CrossRef]
  32. Huang, Y.Y.; Xiu, G.; Lu, Y.; Gao, S.; Li, L.; Chen, L.; Huang, Q.; Yang, Y.; Che, X.; Chen, X.; et al. Application of an emission profile-based method to trace the sources of volatile organic compounds in a chemical industrial park. Sci. Total Environ. 2021, 768, 144694. [Google Scholar] [CrossRef]
  33. Ma, Y.; Fu, S.; Gao, S.; Zhang, S.; Che, X.; Wang, Q.; Jiao, Z. Update on volatile organic compound (VOC) source profiles and ozone formation potential in synthetic resins industry in China. Environ. Pollut. 2021, 291, 118253. [Google Scholar] [CrossRef] [PubMed]
  34. Fang, L.; Liu, W.-w.; Chen, D.-n.; Li, G.H.; Wang, D.; Shao, X.; Nie, L. Source Profiles of Volatile Organic Compounds (VOCs) from Typical Solvent-based Industries in Beijing. Environ. Sci. 2019, 40, 4395–4403. [Google Scholar]
  35. He, M.; Wang, N.; Chen, Y.; Wu, Z.; Chen, J.D.; Fan, Y.L.; Ye, D.Q. Emission characteristics of volatile organic compounds (VOCs) from electronic manufacturing factory of Guangdong Province. Acta Sci. Circumstantiae 2016, 36, 1581–1588. [Google Scholar]
  36. Xie, Y.; Zheng, X.; Liu, C. Source Profiles and Ozone Formation Potental of Volatile Organic Compounds from Printing Industry in Nanjing. Environ. Sci. Technol. 2018, 31, 64–67. [Google Scholar]
  37. Bao, Y.; Wang, B.; Deng, Y.; Zhou, Z. Source profiles and ozone formation potential of VOCs emitted from typical industries using organic solvents in Chengdu. Acta Sci. Circumstantiae 2020, 40, 76–82. [Google Scholar]
  38. Wang, Y. Exploration of monitoring technology of volatile organic compounds in fixed source exhaust gas. New Technol. New Prod. China 2020, 4, 32–133. [Google Scholar]
  39. Han, C.; Zhao, X.; Shan, Y.; Zhang, X.; Yin, T.; Zhang, C.; Lin, Y. A Review of Researches on Atmospheric VOCs Monitoring Technique and Pollution Characteristics in China. J. Ecol. Rural. Environ. 2018, 34, 114–123. [Google Scholar]
  40. Tan, P.; Lian, J.; Li, X. Stability of volatile organic compounds in three sampling devices. Chin. J. Anal. Chem. 2006, S1, 187–191. [Google Scholar]
  41. Ma, Y.; Gao, S.; Wang, Q.; Cui, H.; Wu, S.; Fu, Q.; Duan, Y.; Wu, J.; Jiao, Z. Source profiles and impact of volatile organic compounds in the synthetic resin industry. China Environ. Sci. 2020, 40, 3268–3274. [Google Scholar]
  42. Esselin, N.; Portolan, F.; Domloge, N.; Clark, R.B.; Musa, O.M.; Pilard, J.-F. Offline Monitoring of Hydroxyethyl Methacrylate and 3-Dimethylaminopropyl Methacrylamide Copolymerization: Correlation Between FTIR and GC Quantifications. Spectrosc. Lett. 2015, 48, 53–58. [Google Scholar] [CrossRef]
  43. William, A.J.; Royston, G. An introduction to liquid chromatography-mass spectrometry instrumentation applied in plant metabolomic analyses. Phytochem. Anal. PCA 2010, 21, 33–47. [Google Scholar]
  44. Sha, Q.e.; Zhu, M.; Huang, H.; Wang, Y.; Huang, Z.; Zhang, X.; Tang, M.; Lu, M.; Chen, C.; Shi, B.; et al. A newly integrated dataset of volatile organic compounds (VOCs) source profiles and implications for the future development of VOCs profiles in China. Sci. Total Environ. 2021, 793, 148348. [Google Scholar] [CrossRef] [PubMed]
  45. Wang, M.; Zeng, L.; Lu, S.; Min, S.; Xinglong, L.; Xuena, Y.; Wentai, C.; Bin, Y.; Qian, Z.; Min, H.; et al. Development and validation of a cryogen-free automatic gas chromatograph system (GC-MS/FID) for online measurements of volatile organic compounds. Anal. Methods 2014, 6, 9424–9434. [Google Scholar] [CrossRef]
  46. Maleknia, S.D.; Bell, T.L.; Adams, M.A. PTR-MS analysis of reference and plant-emitted volatile organic compounds. Int. J. Mass Spectrom. 2006, 262, 203–210. [Google Scholar] [CrossRef]
  47. Tanimoto, H.; Aoki, N.; Inomata, S.; Hirokawa, J.; Sadanaga, Y. Development of a PTR-TOFMS instrument for real-time measurements of volatile organic compounds in air. Int. J. Mass Spectrom. 2007, 263, 1–11. [Google Scholar] [CrossRef]
  48. Ketola, R.A.; Kiuru, J.T.; Tarkiainen, V.; Kokkonen, J.T.; Räsänen, J.; Kotiaho, T. Detection of volatile organic compounds by temperature-programmed desorption combined with mass spectrometry and Fourier transform infrared spectroscopy. Anal. Chim. Acta 2006, 562, 245–251. [Google Scholar] [CrossRef]
  49. HJ 919-2017; Ambient Air-Determination of Volatile Organic Compounds-Portable Fourier Infrared Spectrometer Method. Ministry of Ecology and Environment of the People’s Republic of China: Beijing, China, 2017.
  50. HJ 1010-2018; Specifications and Test Procedures for Ambient Air Quality Continuous Monitoring System with Gas Chromatography for Volatile Organic Compounds. Ministry of Ecology and Environment of the People’s Republic of China: Beijing, China, 2018.
  51. Zhou, G.; Wang, Q.; Zhong, Q.; Zhao, J.; Yang, K. Iop: Status and Needs Research for On-line Monitoring of VOCs Emissions from Stationary Sources. In Proceedings of the 3rd International Conference on Environmental Science and Material Application (ESMA), Seoul, Republic of Korea, 24–26 October 2022. [Google Scholar]
  52. Ge, M.; Han, G.; Ding, J.; Zhang, D.; Wang, X.; Zhang, S.; Liu, Z. Effects of Injection Methods of VOCs On-line Monitoring on the Determination of Non-methane Hydrocarbons. Environ. Monit. China 2020, 36, 146–152. [Google Scholar]
  53. Budiman, H.; Nuryatini; Zuas, O. Comparison between GC-TCD and GC-FID for the determination of propane in gas mixture. Int. Symp. Appl. Chem. 2015, 16, 465–472. [Google Scholar] [CrossRef]
  54. Xian, Y. Comparison of International Standards Methods for Determination of Volatile Organic Compounds in Coating and Research Progress of Application of GC-MS to Determination of Volatile Organic Compounds. Phys. Test. Chem. Anal. Part B Chem. Anal. 2019, 55, 483–488. [Google Scholar]
  55. HJ 1154-2020; Ambient Air-Determination of Aldehyde and Ketone Compounds-Solution Absorption-High Performance Liquid Chromatography. Ministry of Ecology and Environment of the People’s Republic of China: Beijing, China, 2020.
  56. Cui, L.; Zhang, Z.; Huang, Y.; Lee, S.C.; Blake, D.R.; Ho, K.F.; Wang, B.; Gao, Y.; Wang, X.M.; Louie, P.K.K. Measuring OVOCs and VOCs by PTR-MS in an urban roadside microenvironment of Hong Kong: Relative humidity and temperature dependence, and field intercomparisons. Atmos. Meas. Tech. 2016, 9, 5763–5779. [Google Scholar] [CrossRef]
  57. Dunne, E.; Galbally, I.E.; Cheng, M.; Selleck, P.; Molloy, S.B.; Lawson, S.J. Comparison of VOC measurements made by PTR-MS, adsorbent tubes–GC-FID-MS and DNPH derivatization–HPLC during the Sydney Particle Study, 2012: A contribution to the assessment of uncertainty in routine atmospheric VOC measurements. Atmos. Meas. Tech. 2018, 11, 141–159. [Google Scholar] [CrossRef]
  58. Zhang, J.; Cao, J.; Niu, Q.; Qiu, Y. Research on Comparison of Portable GC-MS and Portable FTIR Detecting Gaseous Pollutants in Environmental Emergency Mon. Guangdong Chem. Ind. 2016, 43, 217, 257–258. [Google Scholar]
  59. Zhang, X.; Sha, Q.; Lu, M.; Wang, Y.; Rao, S.; Ming, G.; Li, Q.; Wu, S.; Zheng, J. Volatile Organic Compound Emission Characteristics and Influences Assessment of a Petrochemical Industrial Park in the Pearl River Delta Region. Huan Jing Ke Xue Huanjing Kexue 2022, 43, 1766–1776. [Google Scholar]
  60. Liang, Z.F.; He, J.; Zeng, B.; Zhou, X.X.; Liang, S.W.; Xiong, X.Y.; Liu, Q.Y. Advances in source profiles of volatile organic compounds (VOCs) in petrochemical industry of China. Shandong Chem. Ind. 2018, 47, 53–54, 56. [Google Scholar]
  61. Ke, J.; Sun, H.; Zhao, D.; Li, S.; Sun, L.; Tian, X. VOCs Emissions from Several Typical Units in Different Refineries with LDAR Technology. Acta Pet. Sin. Pet. Process. Sect. 2019, 35, 534–539. [Google Scholar]
  62. MEE. Comprehensive remediation plan for volatile organic compounds in the petrochemical industry. Chem. Saf. Environ. 2014, 27, 3–4. [Google Scholar]
  63. MEE. Comprehensive treatment plan for volatile organic compounds in key industries. Environ. Pollut. Control. 2019, 41, 870. [Google Scholar]
  64. Yen, C.; Horng, J. Volatile organic compounds (VOCs) emission characteristics and control strategies for a petrochemical industrial area in middle Taiwan. J. Environ. Sci. Health Part A-Toxic/Hazard. Subst. Environ. Eng. 2009, 44, 1424–1429. [Google Scholar] [CrossRef]
  65. Lu, J. A study on VOCs emission inventory of typical petrochemical plant and its local emission factor. Environ. Pollut. Control 2017, 39, 604–609. [Google Scholar]
  66. Qi, Y. Emission Characteristic and Environmental Impact Analysis of Volatile Organic Compounds (VOCs) in Petrochemical Industry. Master’s Thesis, Shandong University, Shandong, China, 2018. [Google Scholar]
  67. Kalabokas, P.D.; Hatzianestis, J.; Bartzis, J.G.; Papagiannakopoulos, P. Atmospheric concentrations of saturated and aromatic hydrocarbons around a Creek oil refinery. Atmos. Environ. 2001, 35, 2545–2555. [Google Scholar] [CrossRef]
  68. Cetin, E.; Odabasi, M.; Seyfioglu, R. Ambient volatile organic compound (VOC) concentrations around a petrochemical complex and a petroleum refinery. Sci. Total Environ. 2003, 312, 103–112. [Google Scholar] [CrossRef] [PubMed]
  69. Mo, Z.; Shao, M.; Lu, S. Compilation of a source profile database for hydrocarbon and OVOC emissions in China. Atmos. Environ. 2016, 143, 209–217. [Google Scholar] [CrossRef]
  70. Zhou, Z.; Tan, Q.; Deng, Y.; Song, D.; Wu, K.; Zhou, X.; Huang, F.; Zeng, W.; Lu, C. Compilation of emission inventory and source profile database for volatile organic compounds: A case study for Sichuan, China. Atmos. Pollut. Res. 2020, 11, 105–116. [Google Scholar] [CrossRef]
  71. Jiang, P.; Chen, X.; Li, Q.; Mo, H.; Li, L. High-resolution emission inventory of gaseous and particulate pollutants in Shandong Province, eastern China. J. Clean. Prod. 2020, 259, 120806. [Google Scholar] [CrossRef]
  72. Huang, H.; Sha, Q.; Zhu, M.; Wang, Y.; Lu, M.; Zhang, X.; Tang, M.; Huang, Z.; Shi, B.; Bai, L.; et al. Evolution of emission characteristics and species of industrial VOCs emission in Pearl River Delta Region, 2010~2017. China Environ. Sci. 2020, 40, 4641–4651. [Google Scholar]
  73. CNCIA. Interpretation of Recent Coatings and Coatings Application Policies and Regulations. China Coat. 2021, 36, 9–17. [Google Scholar]
  74. Wang, H.; Qiao, Y.; Chen, C.; Lu, J.; Dai, H.; Qiao, L.; Lou, S.; Huang, C.; Li, L.; Jing, S. Source Profiles and Chemical Reactivity of Volatile Organic Compounds from Solvent Use in Shanghai, China. Aerosol Air Qual. Res. 2014, 14, 301–310. [Google Scholar] [CrossRef]
  75. Mo, Z.; Lu, S.; Li, Y.; Shao, M.; Qu, H. Emission characteristics of volatile organic compounds (VOCs) from typical solvent use factories in Beijing. China Environ. Sci. 2015, 35, 374–380. [Google Scholar]
  76. Wu, K.; Duan, M.; Zhou, J.; Zhou, Z.; Tan, Q.; Song, D.; Lu, C.; Deng, Y. Sources Profiles of Anthropogenic Volatile Organic Compounds from Typical Solvent Used in Chengdu, China. J. Environ. Eng. 2020, 146, 05020006. [Google Scholar] [CrossRef]
  77. Zhang, Y.; Li, C.; Yan, Q.; Han, S.; Zhao, Q.; Yang, L.; Liu, Y.; Zhang, R. Typical industrial sector-based volatile organic compounds source profiles and ozone formation potentials in Zhengzhou, China. Atmos. Pollut. Res. 2020, 11, 841–850. [Google Scholar] [CrossRef]
  78. Yang, Y.; Yang, J.; Yin, S.; Yu, Y.; Zheng, J.; Mo, Z. Speciated VOCs Emission Inventory and Key Species from Printing Industry in the Pearl River Delta Region. Res. Environ. Sci. 2013, 26, 326–333. [Google Scholar]
  79. Liang, X.; Sun, X.; Xu, J.; Ye, D. Improved emissions inventory and VOCs speciation for industrial OFP estimation in China. Sci. Total Environ. 2020, 745, 473. [Google Scholar] [CrossRef]
  80. Gao, Z. Source Characteristics of VOC Emissions from Typical Industrial Painting Sources. Master’s Thesis, South China University of Technology Guangzhou, Guangzhou, China, 2015. [Google Scholar]
  81. Wu, R.; Xie, S. Spatial Distribution of Secondary Organic Aerosol Formation Potential in China Derived from Speciated Anthropogenic Volatile Organic Compound Emissions. Environ. Sci. Technol. 2018, 52, 8146–8156. [Google Scholar] [CrossRef]
  82. Li, Z.; Li, W.; Zhou, R.; Miao, X.; Lu, J.; Wang, Z.; Yang, Z.; Wu, J. Process-based VOCs Source Profiles and Contributions to Ozone Formation in Typical Organic Solvent-used Industries in Hangzhou. Aerosol Air Qual. Res. 2021, 21, 1–14. [Google Scholar] [CrossRef]
  83. Seila, R.L.; Main, H.H.; Arriaga, J.L.; Martínez, G.; Ramadan, A.B. Atmospheric volatile organic compound measurements during the 1996 Paso del Norte Ozone Study. Sci. Total Environ. 2001, 276, 153–169. [Google Scholar] [CrossRef]
  84. Zhai, Z.; Meng, H.; Wang, H.; Zhai, Y.C.; Cao, Y.; Zou, K.H. Emission Characteristics and Characteristic Substance Identification of Volatile Odorous Organic Compounds in Industries Using Organic Solvents. Huanjing Kexue 2018, 39, 3557–3562. [Google Scholar] [PubMed]
  85. MEE. 2014. Available online: https://www.mee.gov.cn/gkml/hbb/bgg/201408/W020140828351293705457.pdf (accessed on 19 August 2014).
  86. Zheng, C.; Shen, J.; Zhang, Y.; Zhu, X.; Wu, X.; Chen, L.; Gao, X. Atmospheric Emission Characteristics and Control Policies of Anthropogenic VOCs from Industrial Sources in Yangtze River Delta Region, China. Aerosol Air Qual. Res. 2017, 17, 2263–2275. [Google Scholar] [CrossRef]
  87. Ke, Y.; Sun, Y.; Cheng, H.; Liu, R.Y.; Huang, H.M.; Fan, Y.L.; Dai-Qi, Y. Characteristics of Volatile Organic Compounds in Wood Coatings and Automotive Coatings in China. Huanjing Kexue 2020, 41, 4446–4454. [Google Scholar] [PubMed]
  88. Wu, J.; Gao, S.; Chen, X.; Yang, Y.; Fu, Q.Y.; Che, X.; Jiao, Z. Source Profiles and Impact of Volatile Organic Compounds in the Coating Manufacturing Industry. Huanjing Kexue 2020, 41, 1582–1588. [Google Scholar] [PubMed]
  89. Zhou, Z.; Deng, Y.; Wu, K.; Tan, Q.W.; Zhou, X.L.; Song, D.L.; Huang, F.X.; Zeng, W.H. Source profiles of VOCs associated with typical industrial processes in Chengdu. Huanjing Kexue 2019, 40, 3949–3961. [Google Scholar] [PubMed]
  90. Yang, X.N.; Ren, X.L.; Yan, X.Q.; Wu, Z.Q.; Yang, G.D. A review on VOCs adsorption by activated carbon. Mater. Rep. 2021, 35, 17111–17124. [Google Scholar]
  91. Wang, J.; Jin, D.; Gu, Z.; Lu, J.H.; Ye, Z.P.; Dong, S.B. The VOCs emission characteristics ofmetal surface coating industryand its emission factors. China Environ. Sci. 2020, 40, 1940–1945. [Google Scholar]
  92. Teng, F.; Miu, X.; Xiong, M.; Zhao, N.; Jin, D.J.; He, L.; Zhang, Q.Y.; Dong, S.B. Component characteristics and emission coefficient of VOCs from ship manufacturing and repairing industry in Zhenjiang Province. Environ. Pollut. Control 2022, 44, 476–480+505. [Google Scholar]
  93. Wang, R.; Yuan, Z.; Zheng, J.; Li, C.; Huang, Z.; Li, W.; Xie, Y.; Wang, Y.; Yu, K.; Duan, L. Characterization of VOC emissions from construction machinery and river. J. Environ. Sci. 2020, 96, 138–150. [Google Scholar] [CrossRef]
Figure 1. The mass fraction of chemical groups for the whole petrochemical industry (a) and process-based petrochemical industry (b) [10,15,17,23,66]. Abbreviations: heating furnace (HEA), catalytic cracking (CAC), hydrocracking (HYC), catalytic reforming (CAR), delayed coking (DEC), sulfur recovery (SUL), wastewater treatment (WAS), storage tanks (TAN), oxidation pond (OP), sewage stripping (SS), gasoline tank (GT), diesel tank (DT), crude oil tank (CT).
Atmosphere 14 00878 g001
Figure 2. The mass fraction of chemical groups for the petrochemical industry.
Atmosphere 14 00878 g002
Figure 3. The mass fraction of chemical groups for printing and dyeing industry [36,78,79].
Atmosphere 14 00878 g003
Figure 4. The mass fraction of chemical groups for sector-based surface coating industry (a) and process-based automobile manufacturing (b) [7,18,34,74,77,79,80,81,82]. Abbreviations: * oil-to-water transformation.
Atmosphere 14 00878 g004
Figure 5. The mass fraction of chemical groups for industrial solvent use industry.
Atmosphere 14 00878 g005
Figure 6. The mass fraction of chemical groups for the basic chemical industry [14,17,32,81]. Abbreviations: ethylene (ETH), benzene (BEN), ethylbenzene (EBEN), butadiene (BUT), styrene (STY), polyvinylchloride (PVC), polystyrene (PS), polypropylene glycol (PPG), polypropylene (PP), polyethylene (PE).
Atmosphere 14 00878 g006
Figure 7. The mass fraction of chemical groups for the synthetic material manufacturing industry [14,16,17,32,33,41]. Abbreviations: SIS rubber (SIS), SEBS rubber (SEBS), styrene butadiene rubber (SBR), ethylene propylene rubber (ERP), ethylene propylene diene monomer (EPD), polyurethane (PU), phenol formaldehyde resin (PF), polyethylene terephthalate (PET), polycarbonate (PC), epoxy resin (ER), coating resins (CR), acrylic resin (AR), acrylonitrile–butadiene–styrene (ABS), furan resin (FR).
Atmosphere 14 00878 g007
Figure 8. The mass fraction of chemical groups for the paint and ink production industry [79,86,87,88,89]. Abbreviations: solvent-based paint (SBP), water-based paint (WBP), UV paint (UVP), water-based ink (WBI), UV ink (UVI).
Atmosphere 14 00878 g008
Figure 9. The mass fraction of chemical groups for chemical industry.
Atmosphere 14 00878 g009
Table 1. Measurements of VOC profiles from typical industries.
No.SourcesLocation, TimeSource CategorySample LocationSampling Methods (No. Samples)Analysis Method and Analytical Components (No. Species)
1Petrochemical industryThe Pearl River Delta, 2005 [23]Petrochemical industryWorkshop sampling and environmental sample collection- (4)GC–MS/FID: alkanes, alkenes, aromatics, and halocarbons (92)
2Beijing [15]Petroleum refineryWorkshop sampling and environmental sample collectionSUMMA canister (101)GC–MS/FID: alkanes, alkenes, aromatics, and halocarbons (56)
3The Yangtze River Delta [17]Petrochemical industryOutlet sampling and workshop samplingSUMMA canister (-)GC–MS/FID: alkanes, alkenes, aromatics, and halocarbons (-)
4Wuhan, 2016–2017 [10]Petrochemical industryOutlet sampling and workshop samplingStainless-steel canister (35)GC–MS/FID: alkanes, alkenes, aromatics, halocarbons, and OVOCs (86)
5Solvent-used industryThe Pearl River Delta [19]Printing, wood furniture coating, shoemaking, and metal surface coatingOutlet sampling and workshop samplingStainless-steel canister (72)GC–MS; DNPH–HPLC: alkanes, alkenes, aromatics, halocarbons, and OVOCs (102)
6The Pearl River Delta [7]Shipbuilding, wood furniture, metal surface, plastic surface, automobile, and fabric surface coating industry-SUMMA canister (116)GC–MS: alkanes, alkenes, aromatics, and OVOCs (-)
7Beijing [34]Automobile coating, wood furniture coating, and printing industryWorkshop sampling- (39)GC–MS/FID: alkanes, alkenes, aromatics, halocarbons, and OVOCs (106)
8Guangdong Province [35]Electronic equipment manufacturingOutlet sampling and workshop samplingTenax tube (-)GC–MS: alkanes, alkenes, aromatics, halocarbons, and OVOCs (17)
9Nanjing [36]PrintingOutlet samplingTeflon bag (-)GC–MS: alkanes, alkenes, aromatics, halocarbons, and OVOCs (47)
10Chengdu, 2018 [37]Packaging/printing, wood-based panel manufacturing, furniture manufacturing, and shoemakingOutlet sampling and workshop samplingTedlar bag (-)GC–MS: alkanes, alkenes, aromatics, halocarbons, and OVOCs (65)
11Chemical industryShanghai, 2019 [33]Synthetic resins industryOutlet samplingSUMMA canister (52)GC–MS/FID: alkanes, alkenes, aromatics, halocarbons, and OVOCs (106)
12The Yangtze River Delta, 2018–2019 [32]Chemical industryOutlet sampling and workshop samplingSUMMA canister (148)GC–MS/FID: alkanes, alkenes, aromatics, halocarbons, and OVOCs (107)
Table 2. Advantages and disadvantages of sampling methods.
Sampling MethodsCategoryAdvantagesDisadvantages
Solid-phase sorbent tube samplingAdsorption tubes [35,38]Small size; long-distance transportation; high reusabilityUnsuitability for highly volatile compounds; susceptibility to particulate matter and moisture
Container samplingAir bags [36,37]Low cost; large sampling volume; high reusabilityLow stability for samples
Canisters [17,32,34]High stability for samplesHigh cost; high demand for gas dilution and canister cleaning
Disclaimer/Publisher’s Note: The statements, opinions and data contained in all publications are solely those of the individual author(s) and contributor(s) and not of MDPI and/or the editor(s). MDPI and/or the editor(s) disclaim responsibility for any injury to people or property resulting from any ideas, methods, instructions or products referred to in the content.

