
Spatiotemporal Precipitation Trends and Associated Large-Scale Teleconnections in Northern Pakistan
 , , , , and
Abstract
:1. Introduction
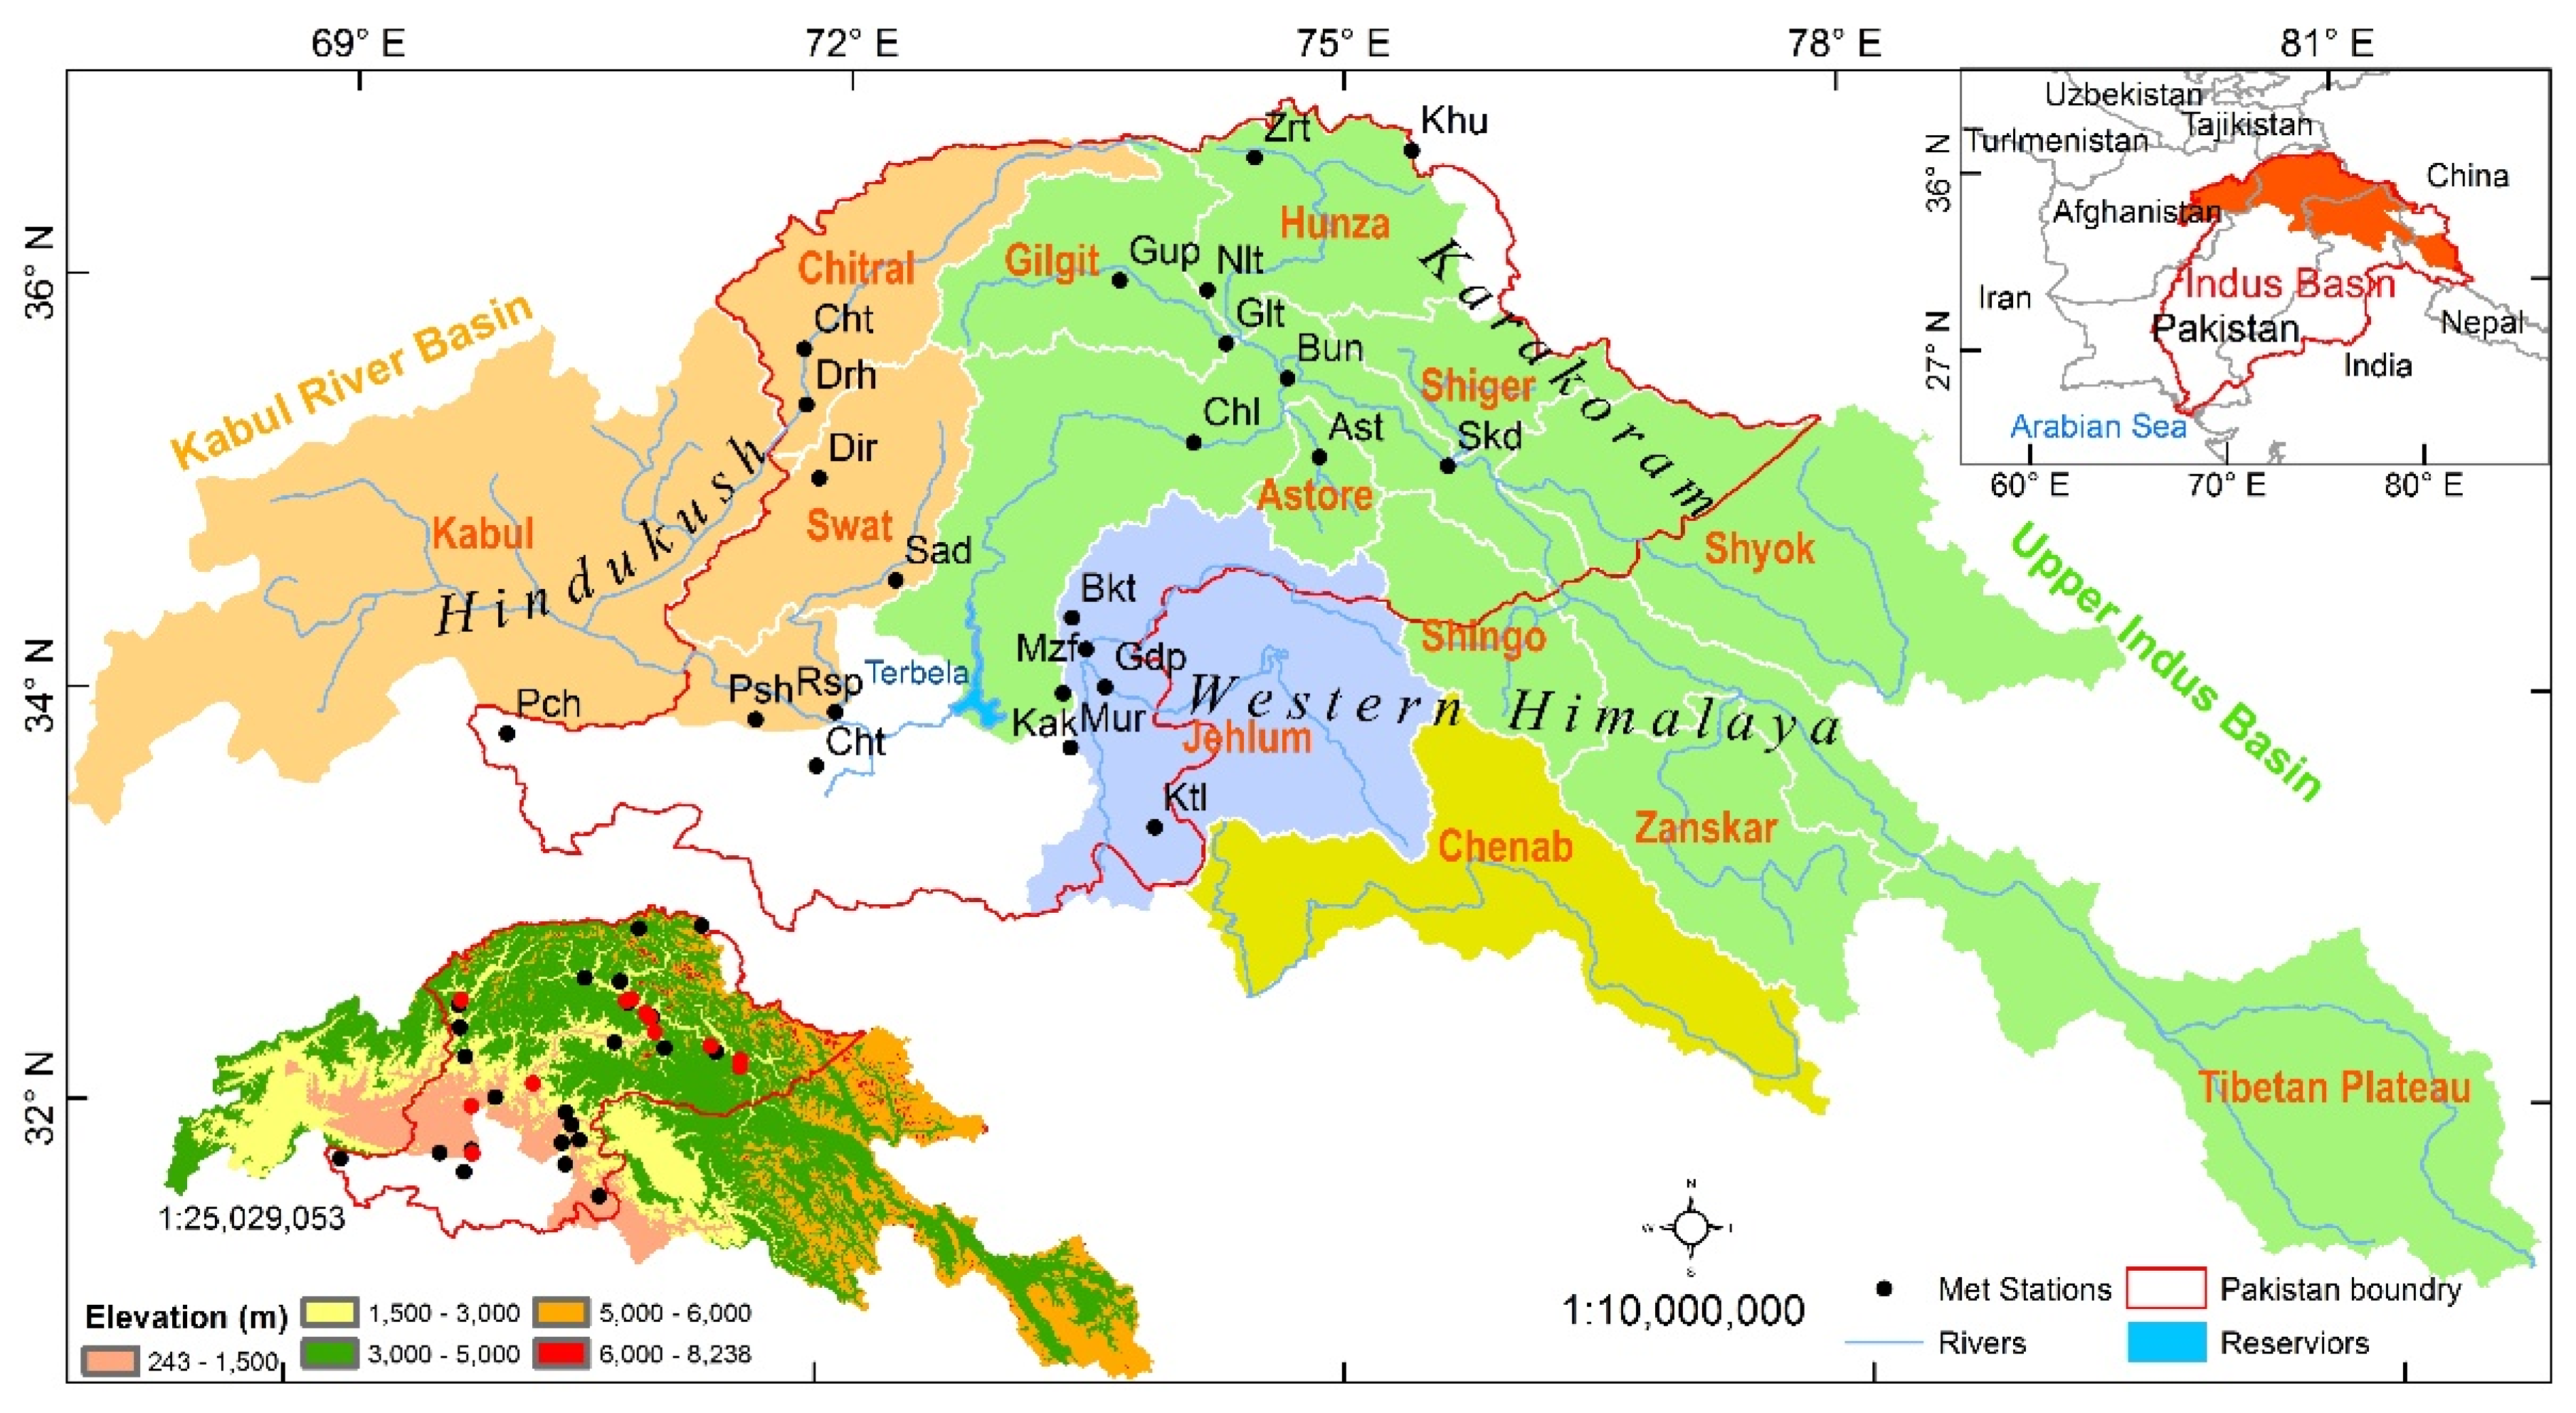
2. Study Area
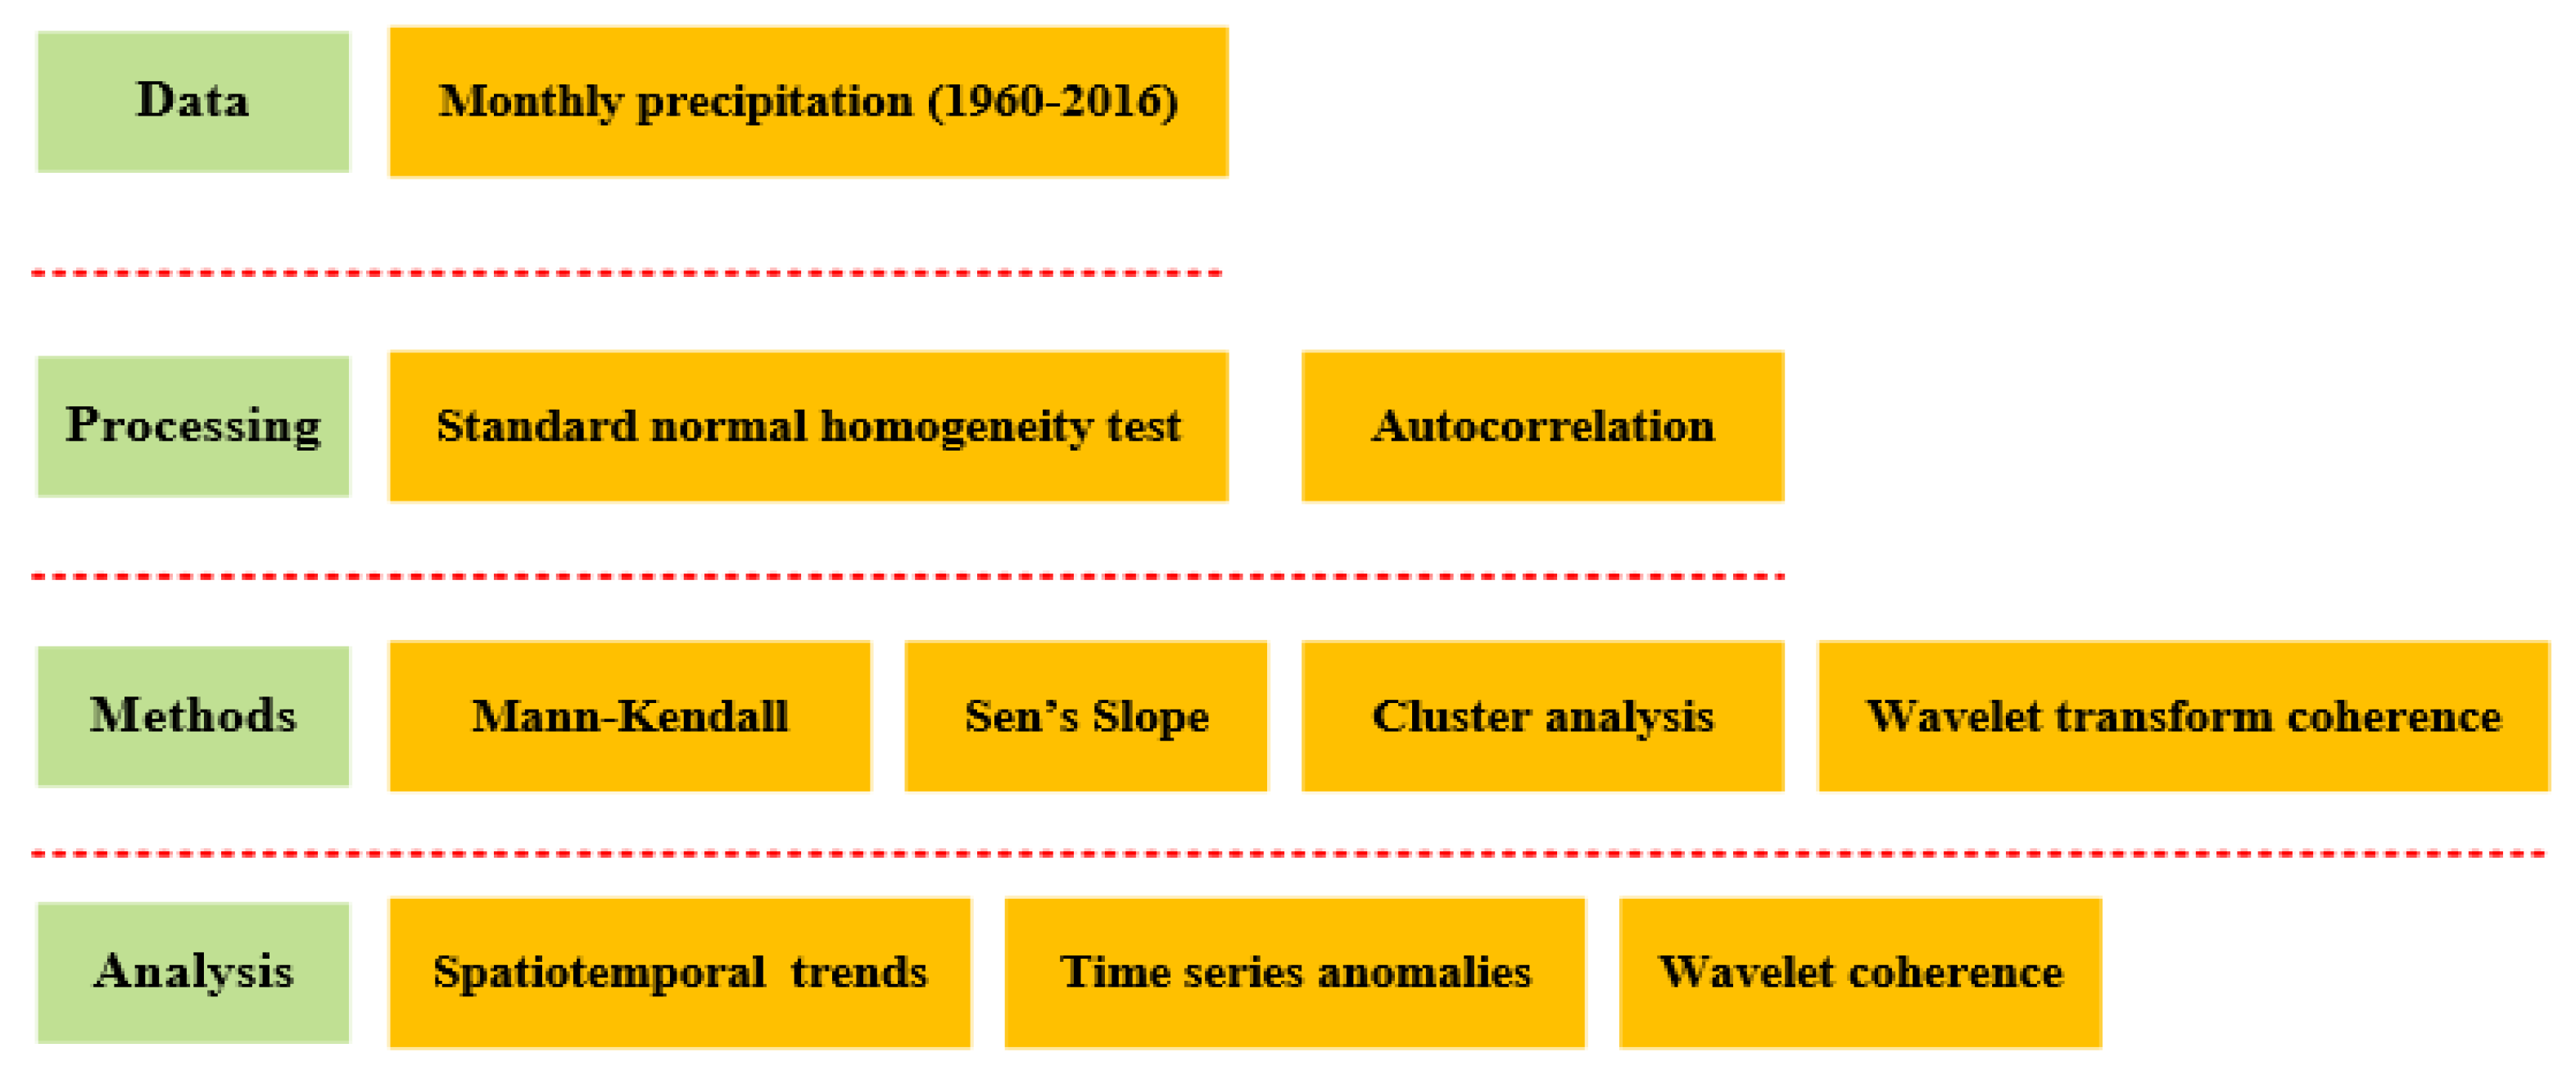
3. Materials and Methods
3.1. Dataset and Preprocessing
3.2. Mann−Kendall Test and Sen’s Slop Estimator
3.3. The Sequential Mann–Kendall Test (SQMK) Test
3.4. Cluster Analysis
3.5. WTC Analysis
4. Results
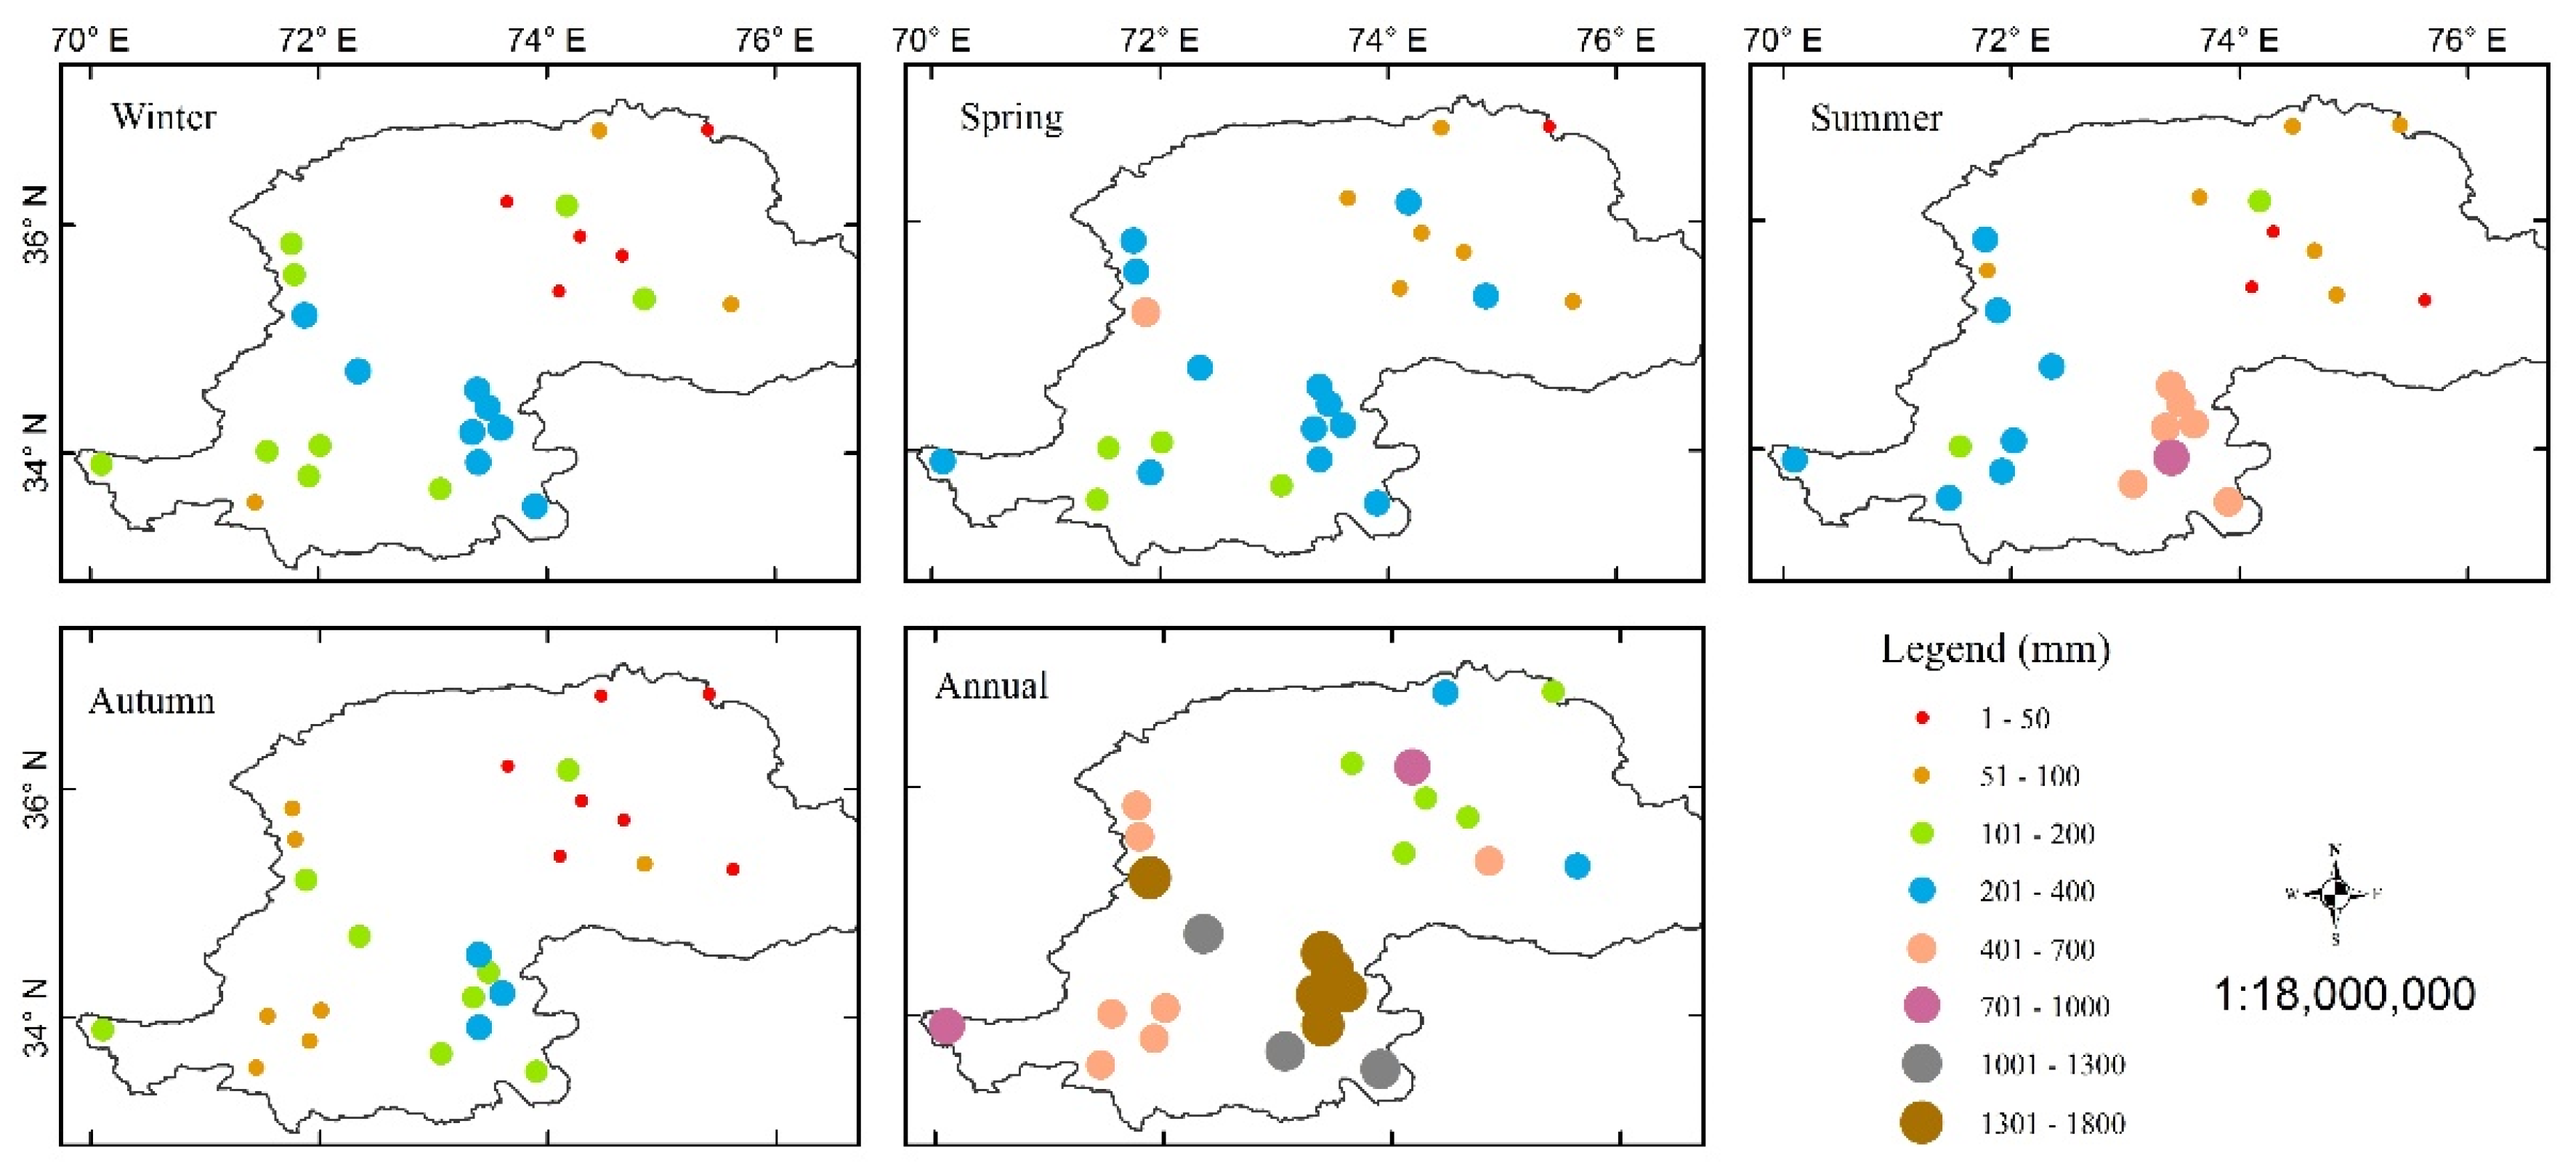
4.1. Climatology
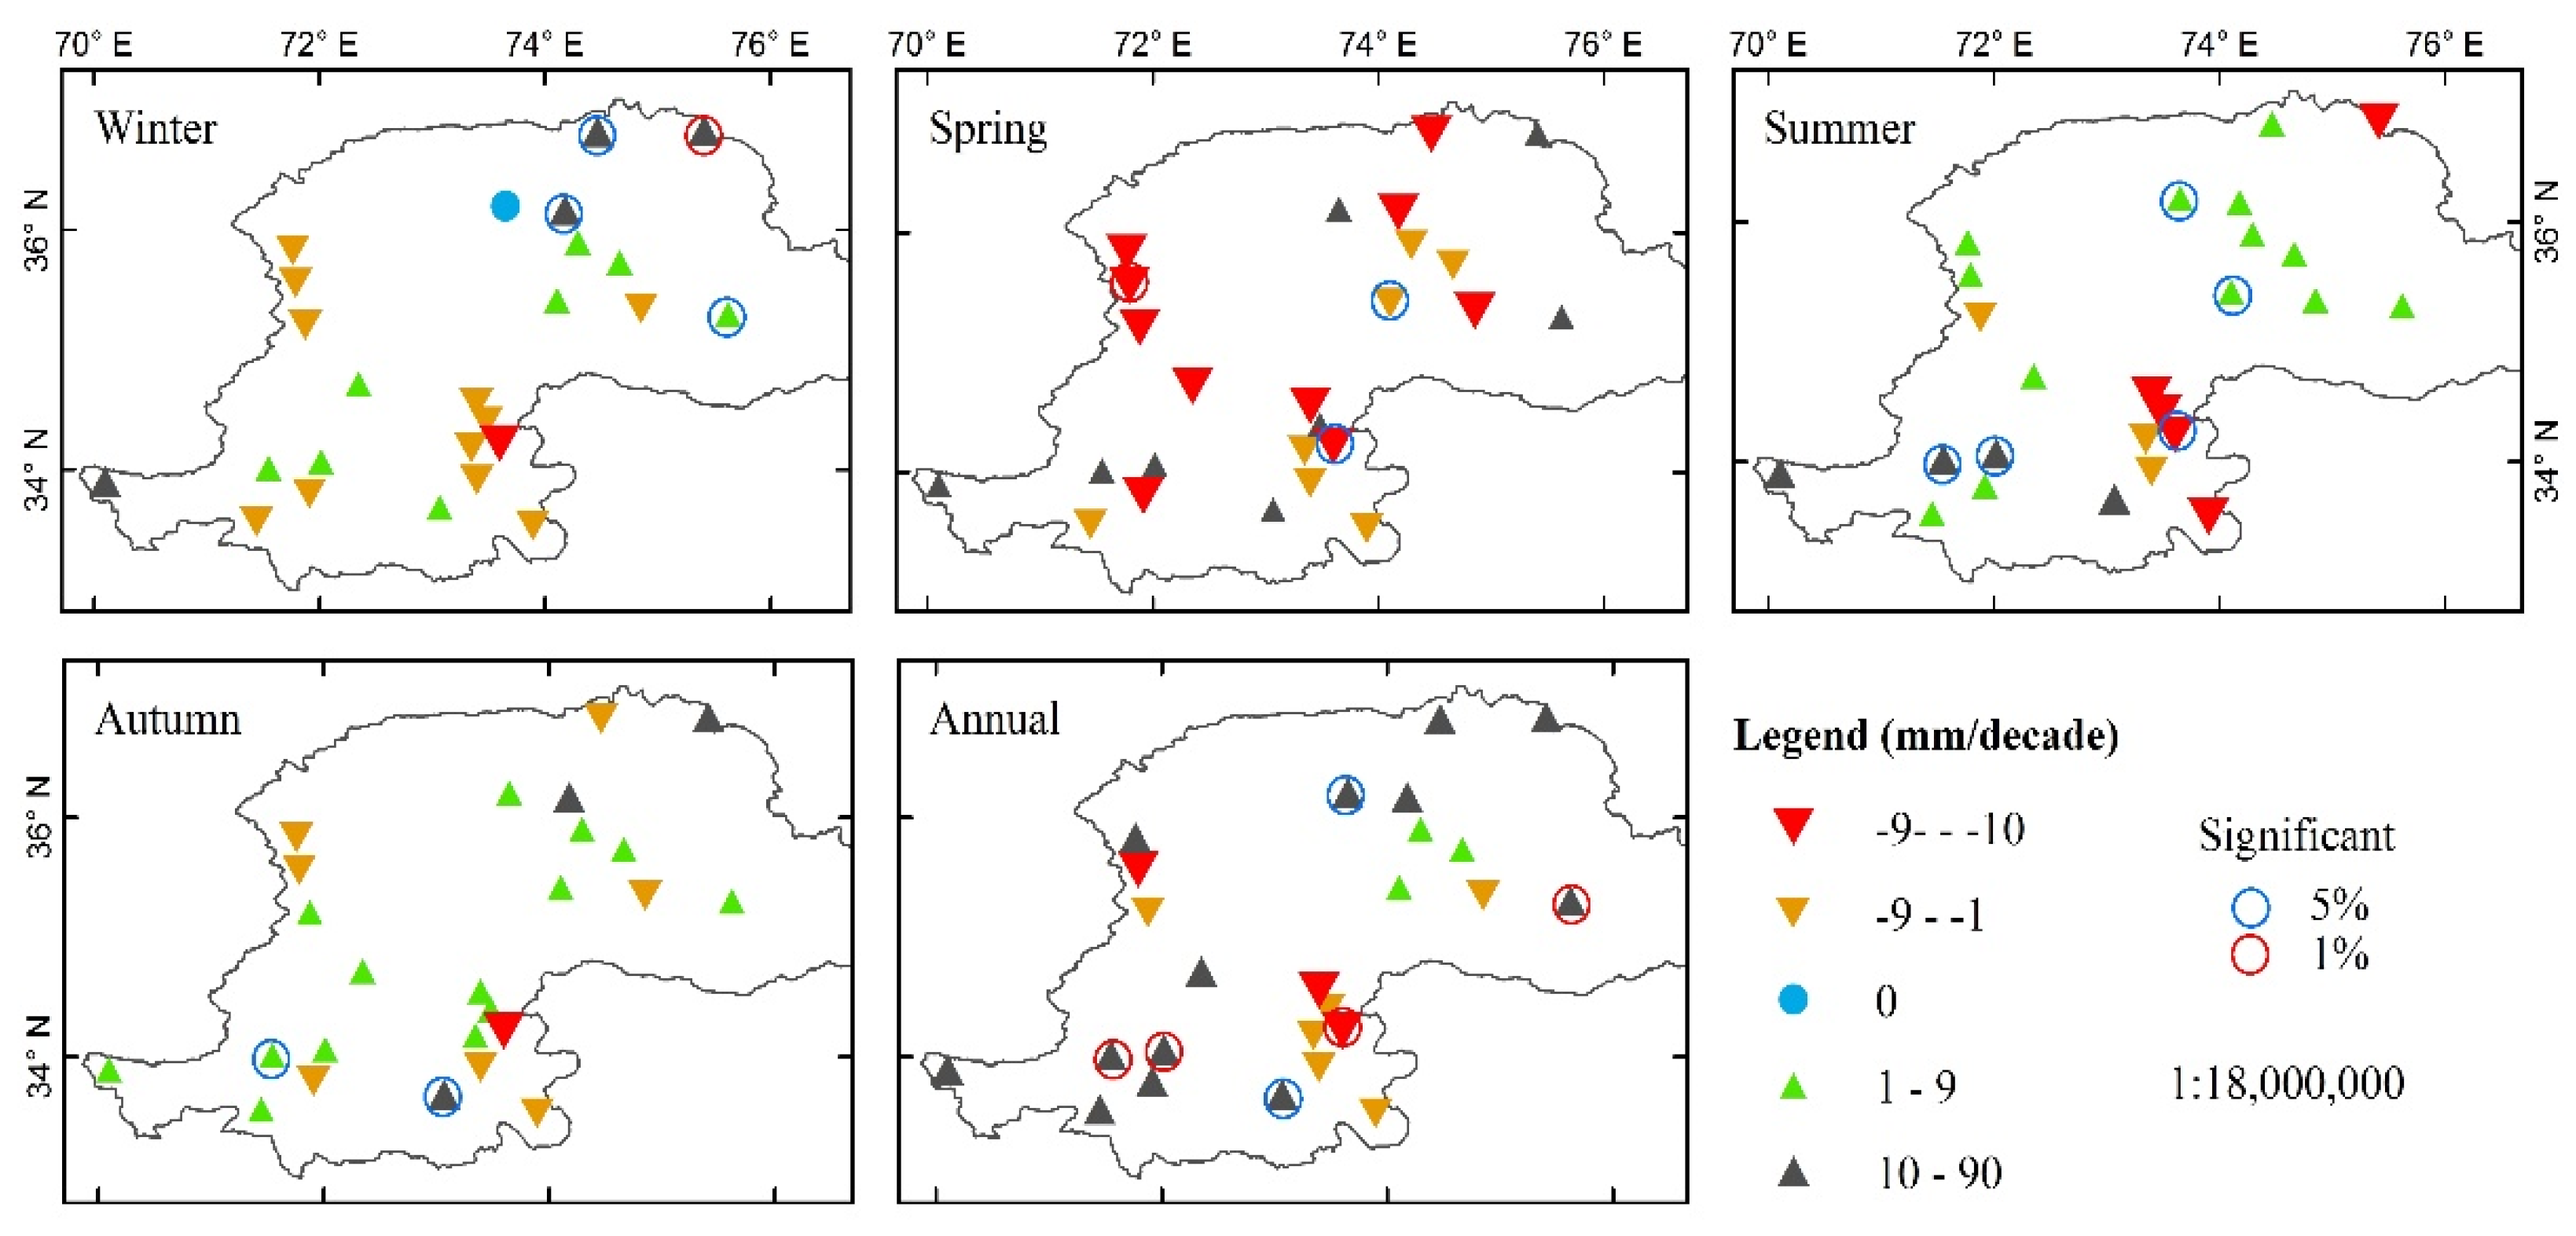
4.2. Spatiotemporal Trends
4.3. Temporal Variations
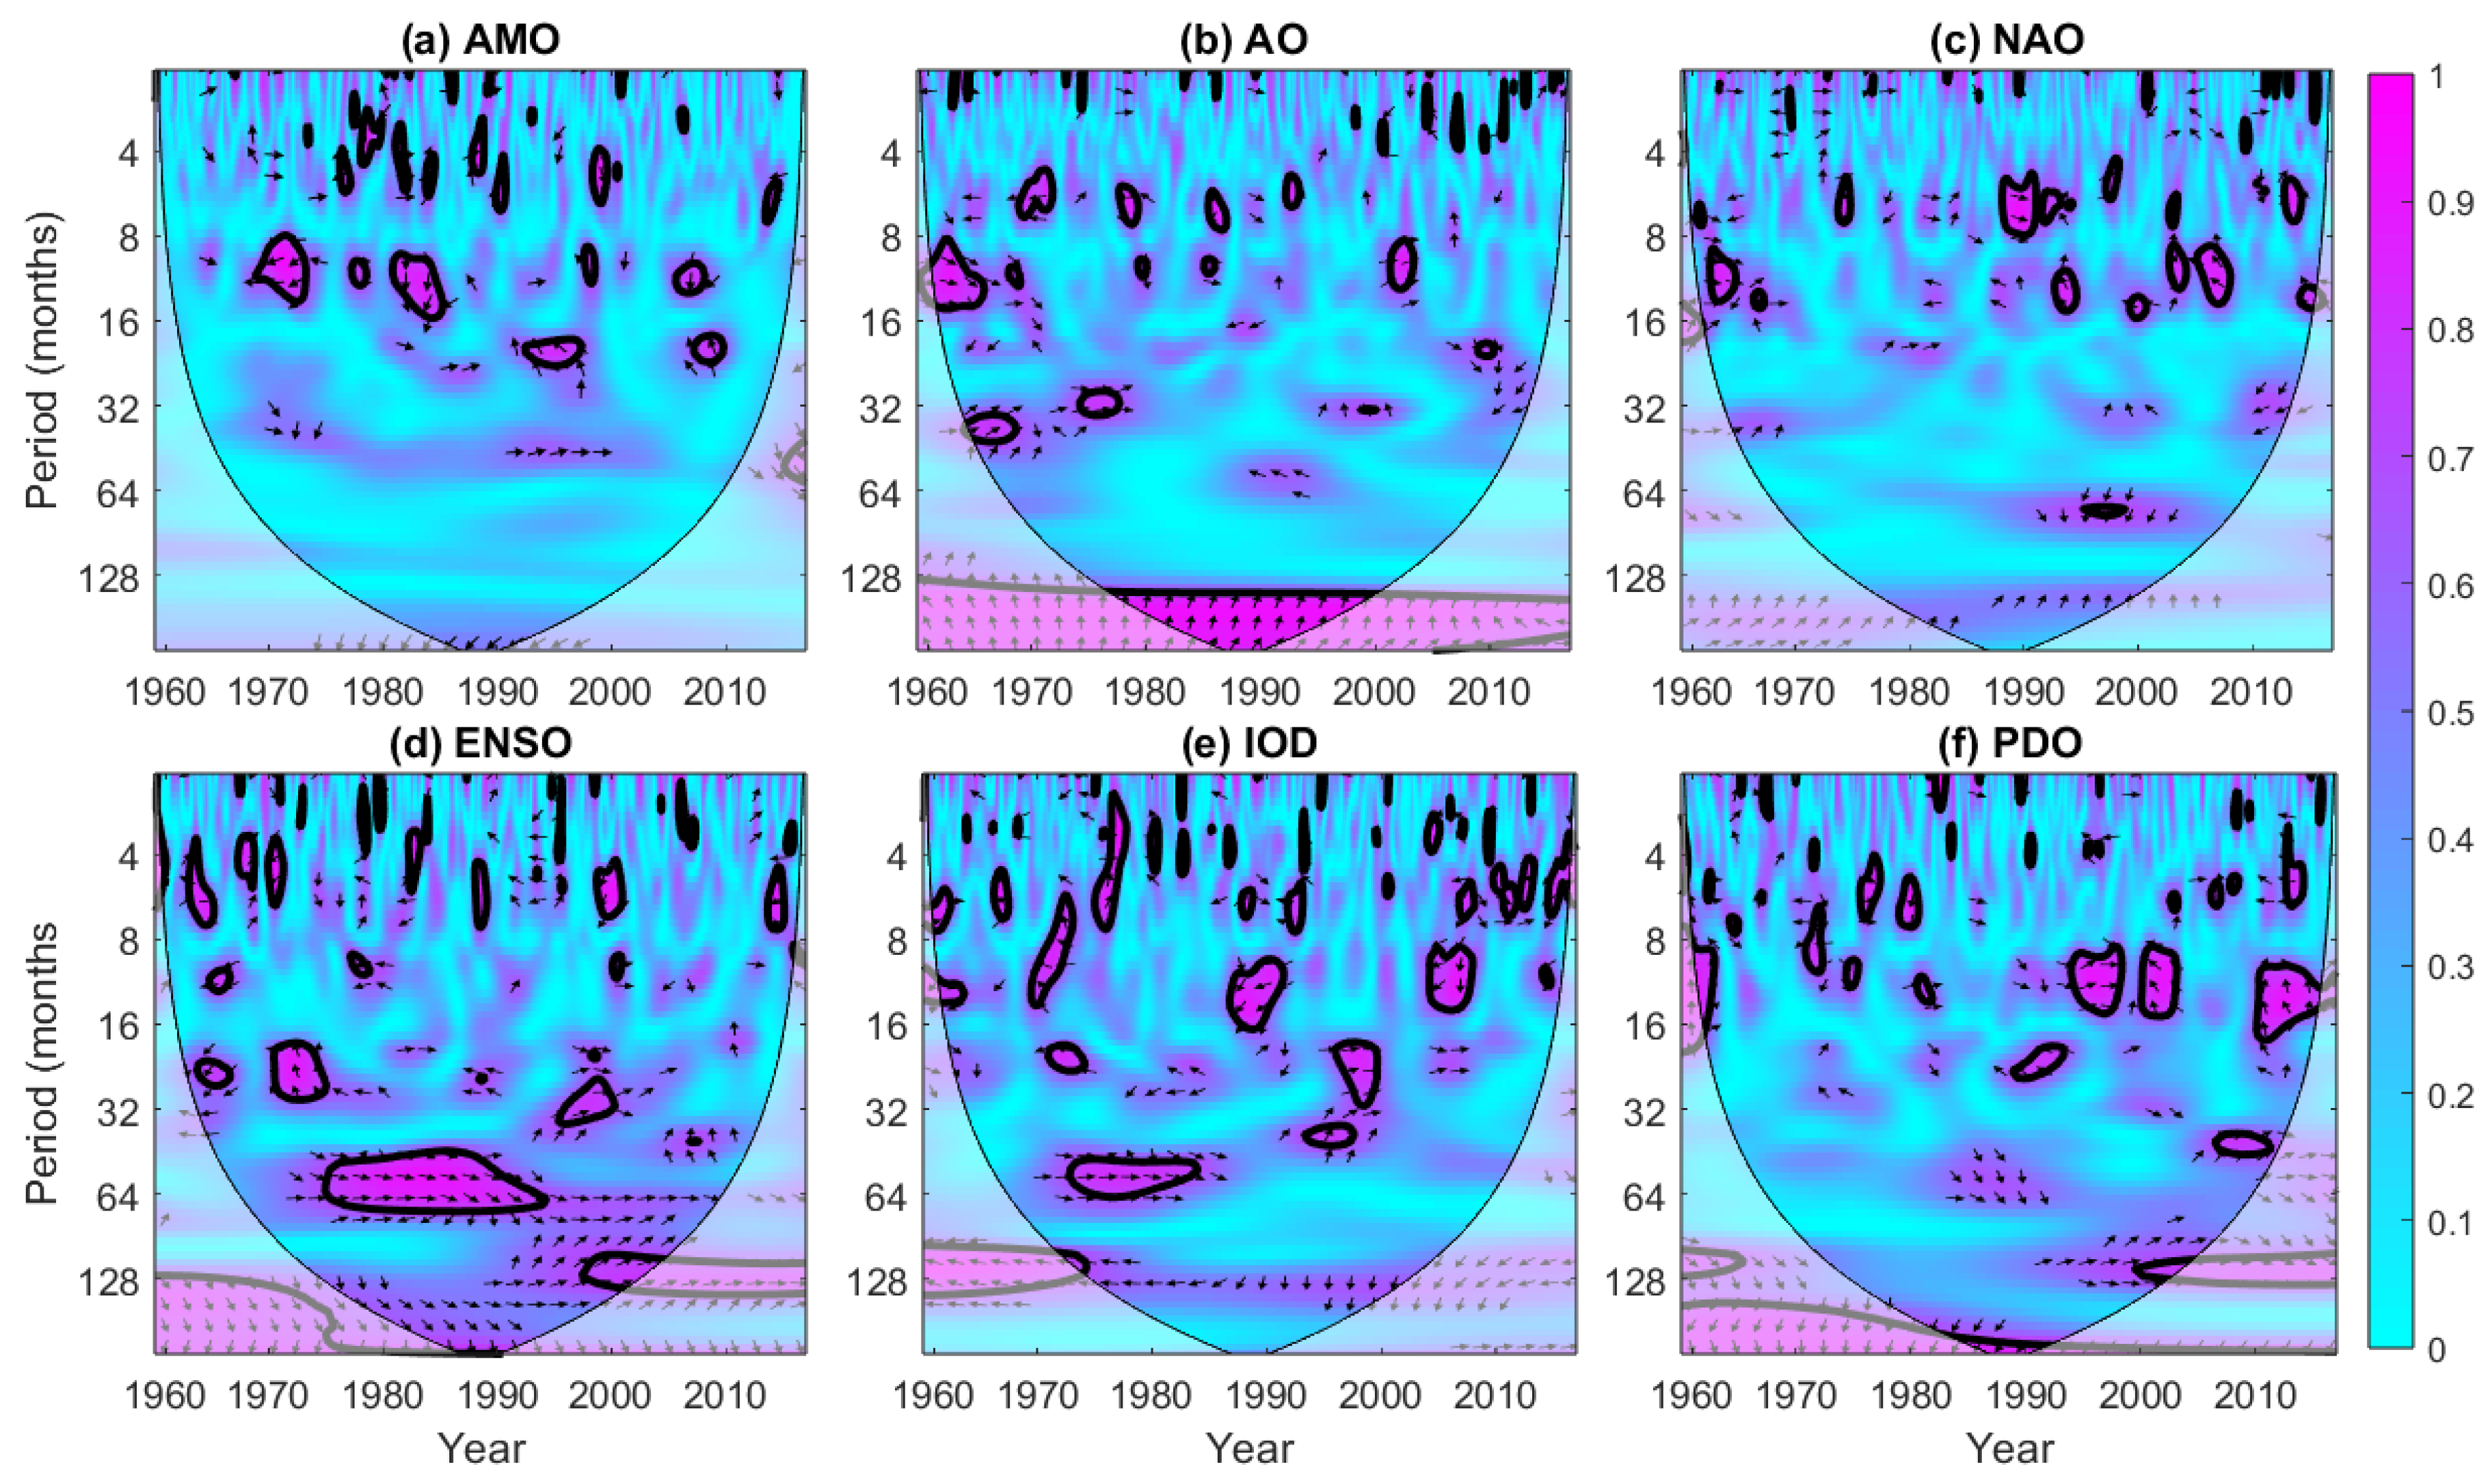
4.4. Coherence of Precipitation with Teleconnections
5. Discussion
6. Conclusions
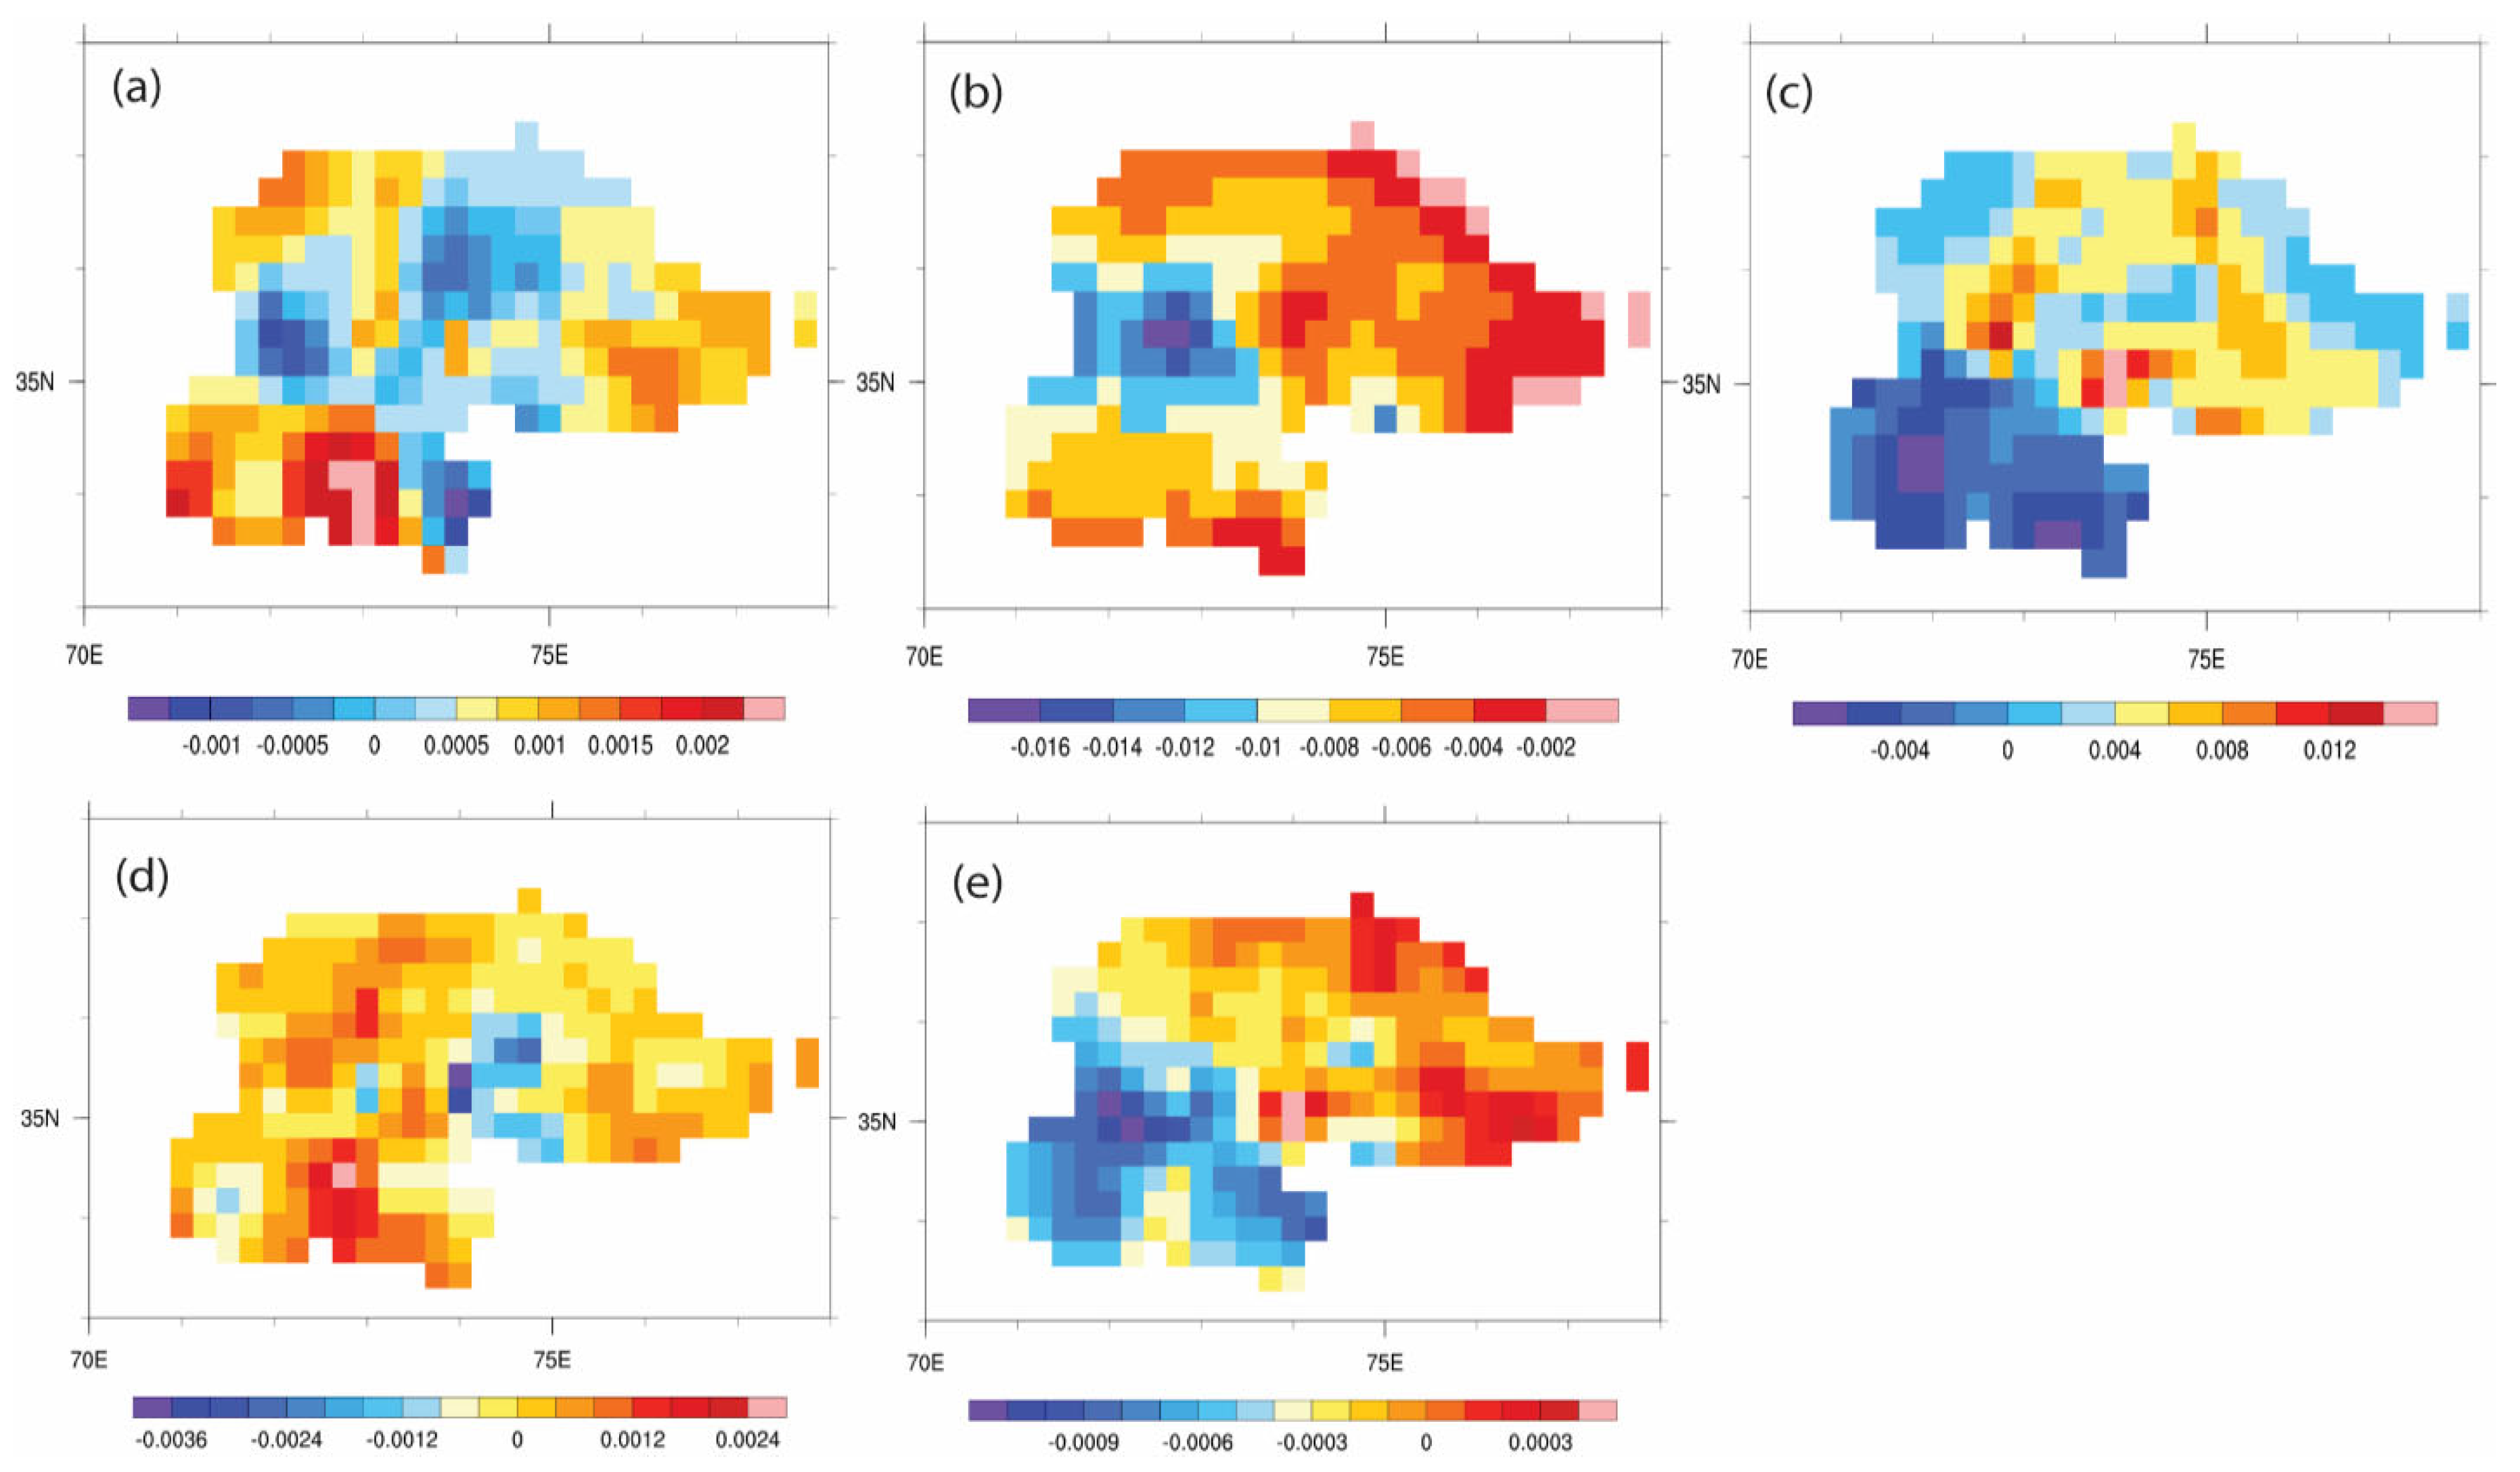
- In the spatial distribution of mean seasonal and annual precipitation, all regions received the highest precipitation annually. R-II received the highest precipitation at seasonal and annual scales, followed by R-III and I. At the same time, R-I and III received seasonal and annual precipitation below 250 and 700 mm, respectively. Generally, maximum precipitation is observed in summer, followed by spring and winter. According to the MK and SS, most stations in R-I and III observed increasing trends, while decreased in R-II were observed for annual precipitation. Moreover, R-I and III observed significant increasing trends in annual precipitation and decreasing trends in R-II and NP during 1960–2016. Moreover, the spatial trends for observed data and ERA-5 reanalysis datasets were almost similar in winter, spring, and autumn; however, some disagreements were observed in both datasets in summer and annual precipitation trends in NP.
- The whole period was divided into two sub-periods, which were 1960–1988 and 1989–2016. In winter, precipitation in R-I, II, III, and NP decreased during 1960–1988, which was also prominent in the second period. For spring, precipitation increased during the first period in NP while decreasing during the second time scale; however, mixed trends prevailed in both time scales. Summer precipitation increased in the first period in all sub-regions and NP, while a decrease was observed in R-I, II, and NP. Autumn showed steadily increasing trends in both periods in all sub-regions. Furthermore, annual precipitation in NP increased in the first period and decreased in the second.
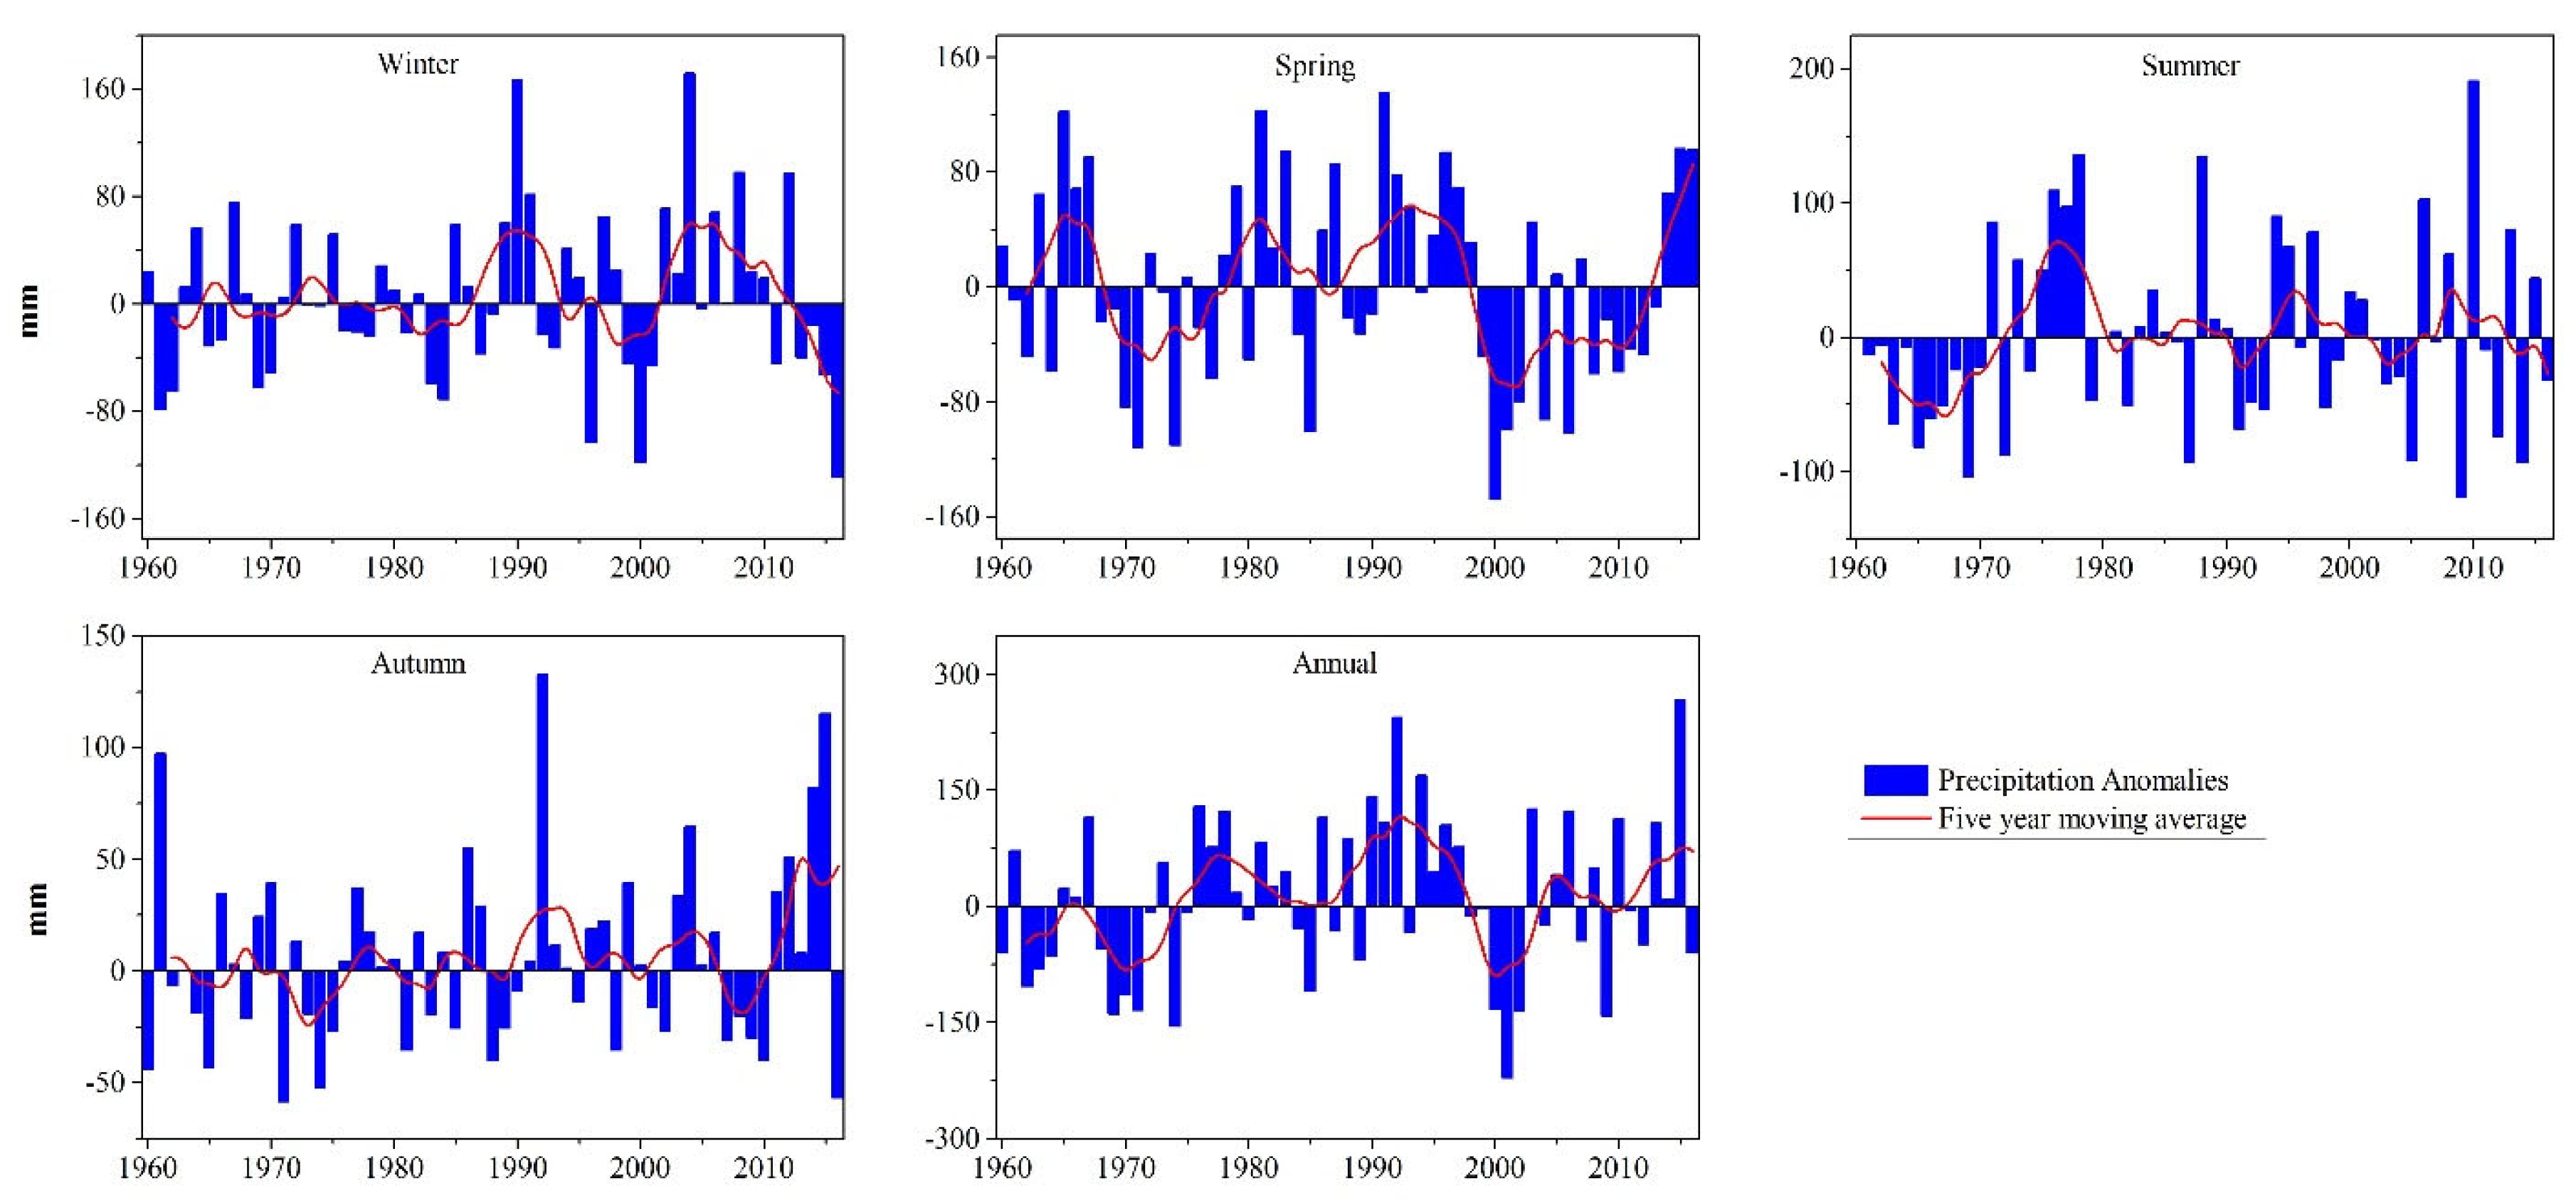
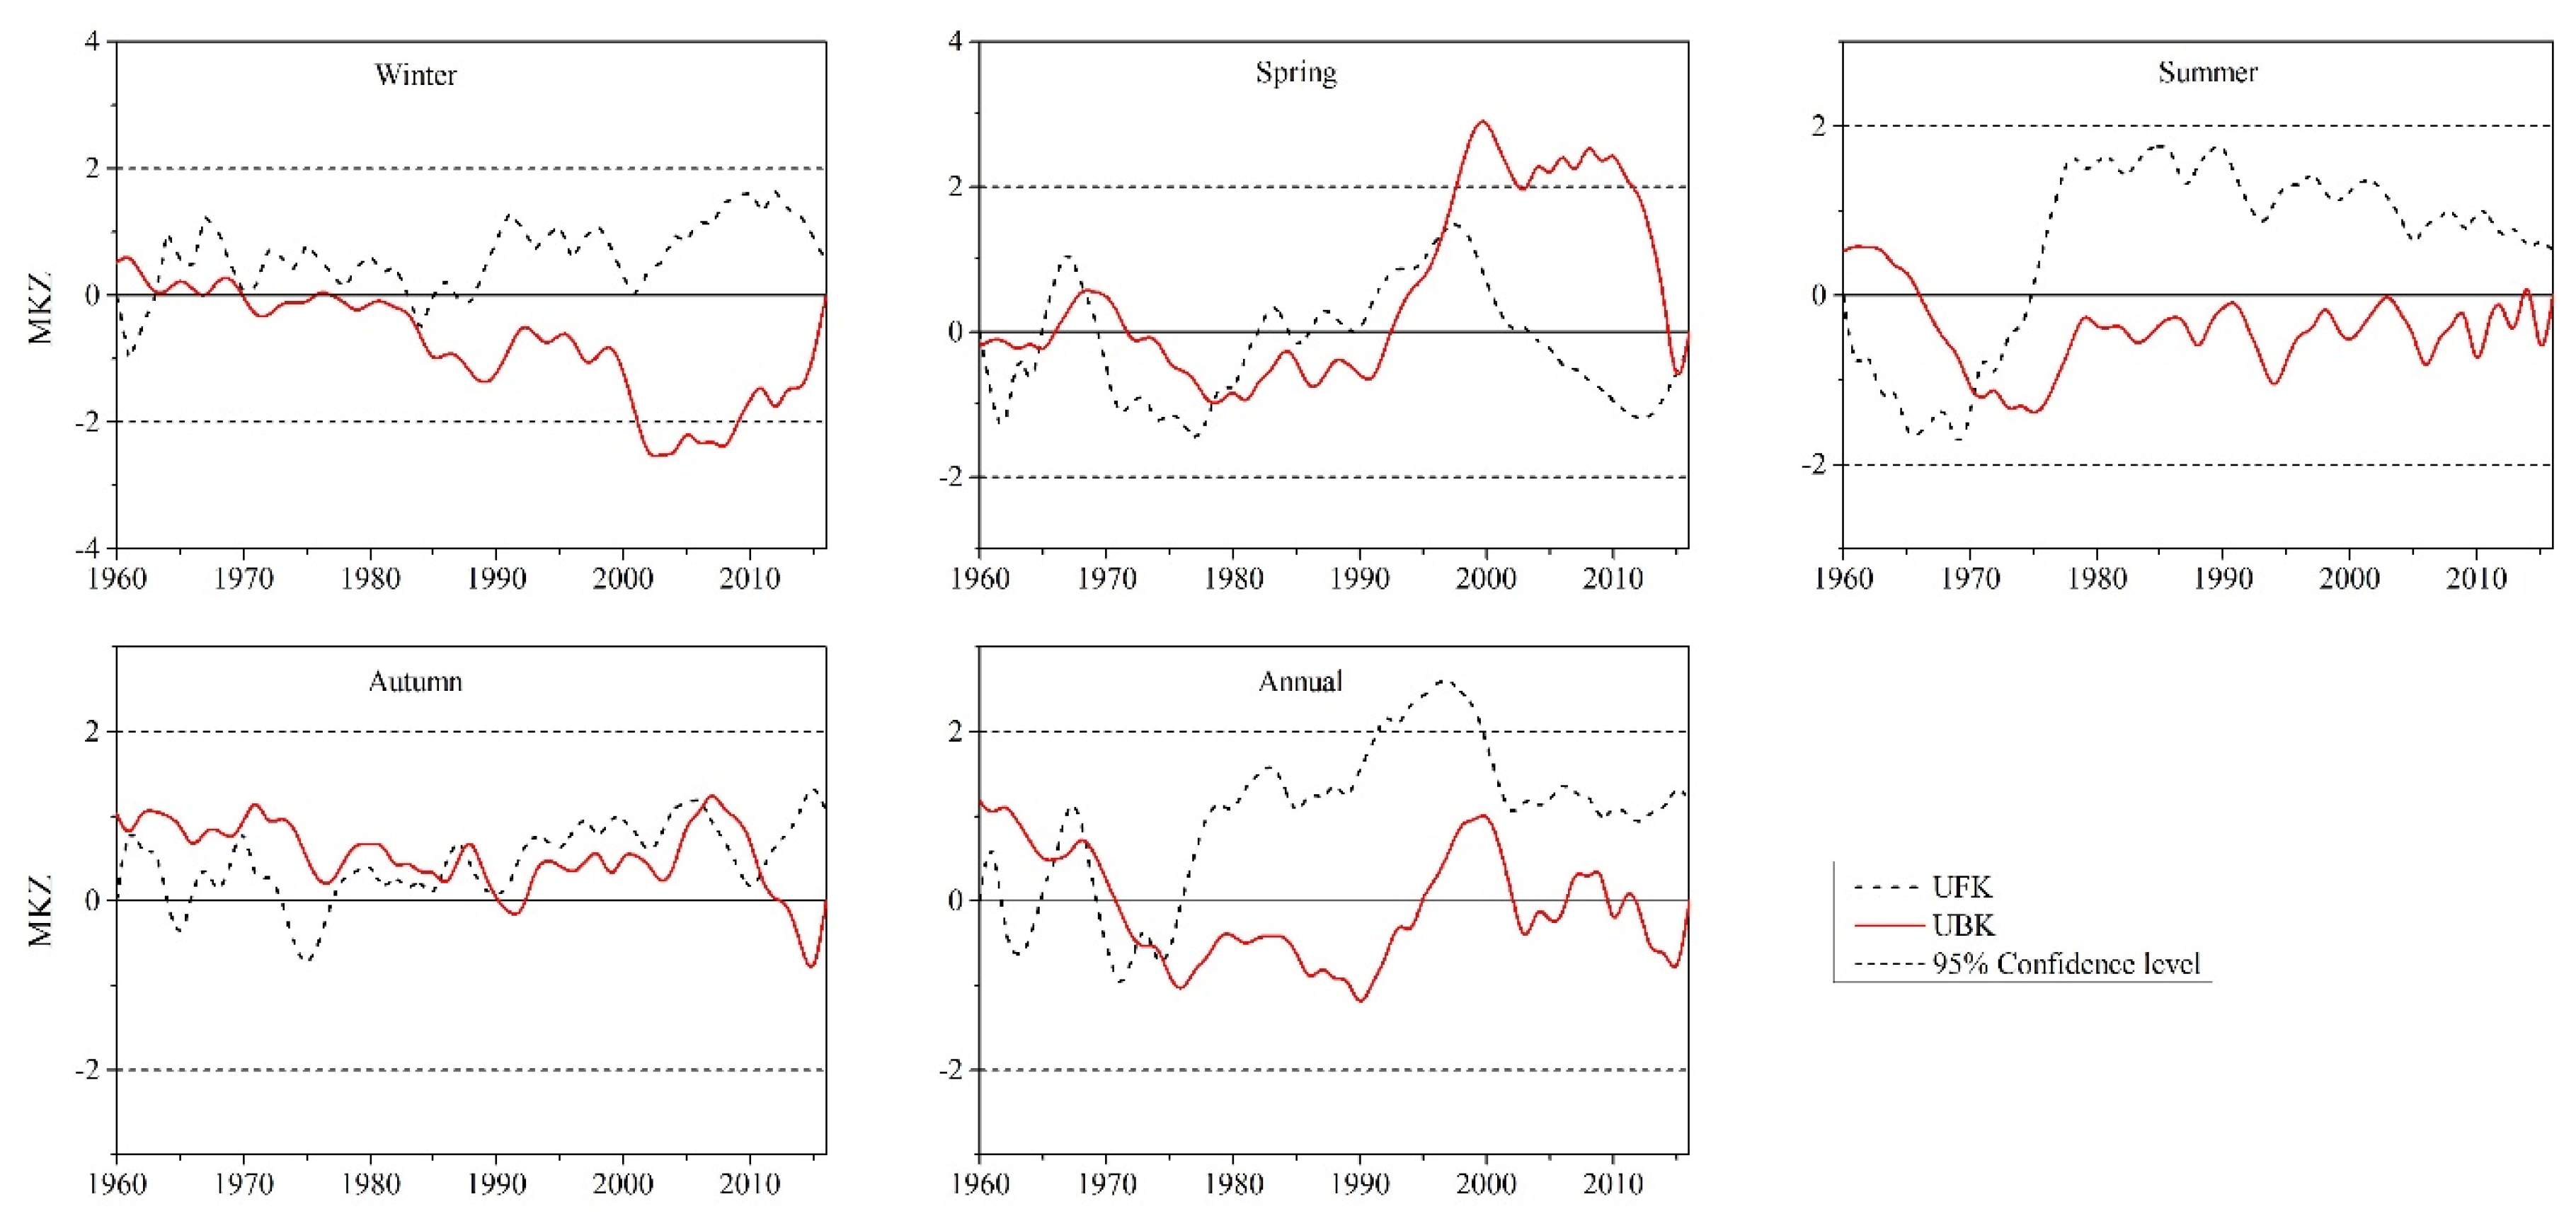
- In temporal variations, no clear trend was observed in all seasons except in annual and winter periods. An increasing trend was evident in annual and winter periods during 1985–2016 and 1985–2005, respectively. According to the SQMK, most trends increased in all seasons until 1980, and a downward shift occurred after 2010.
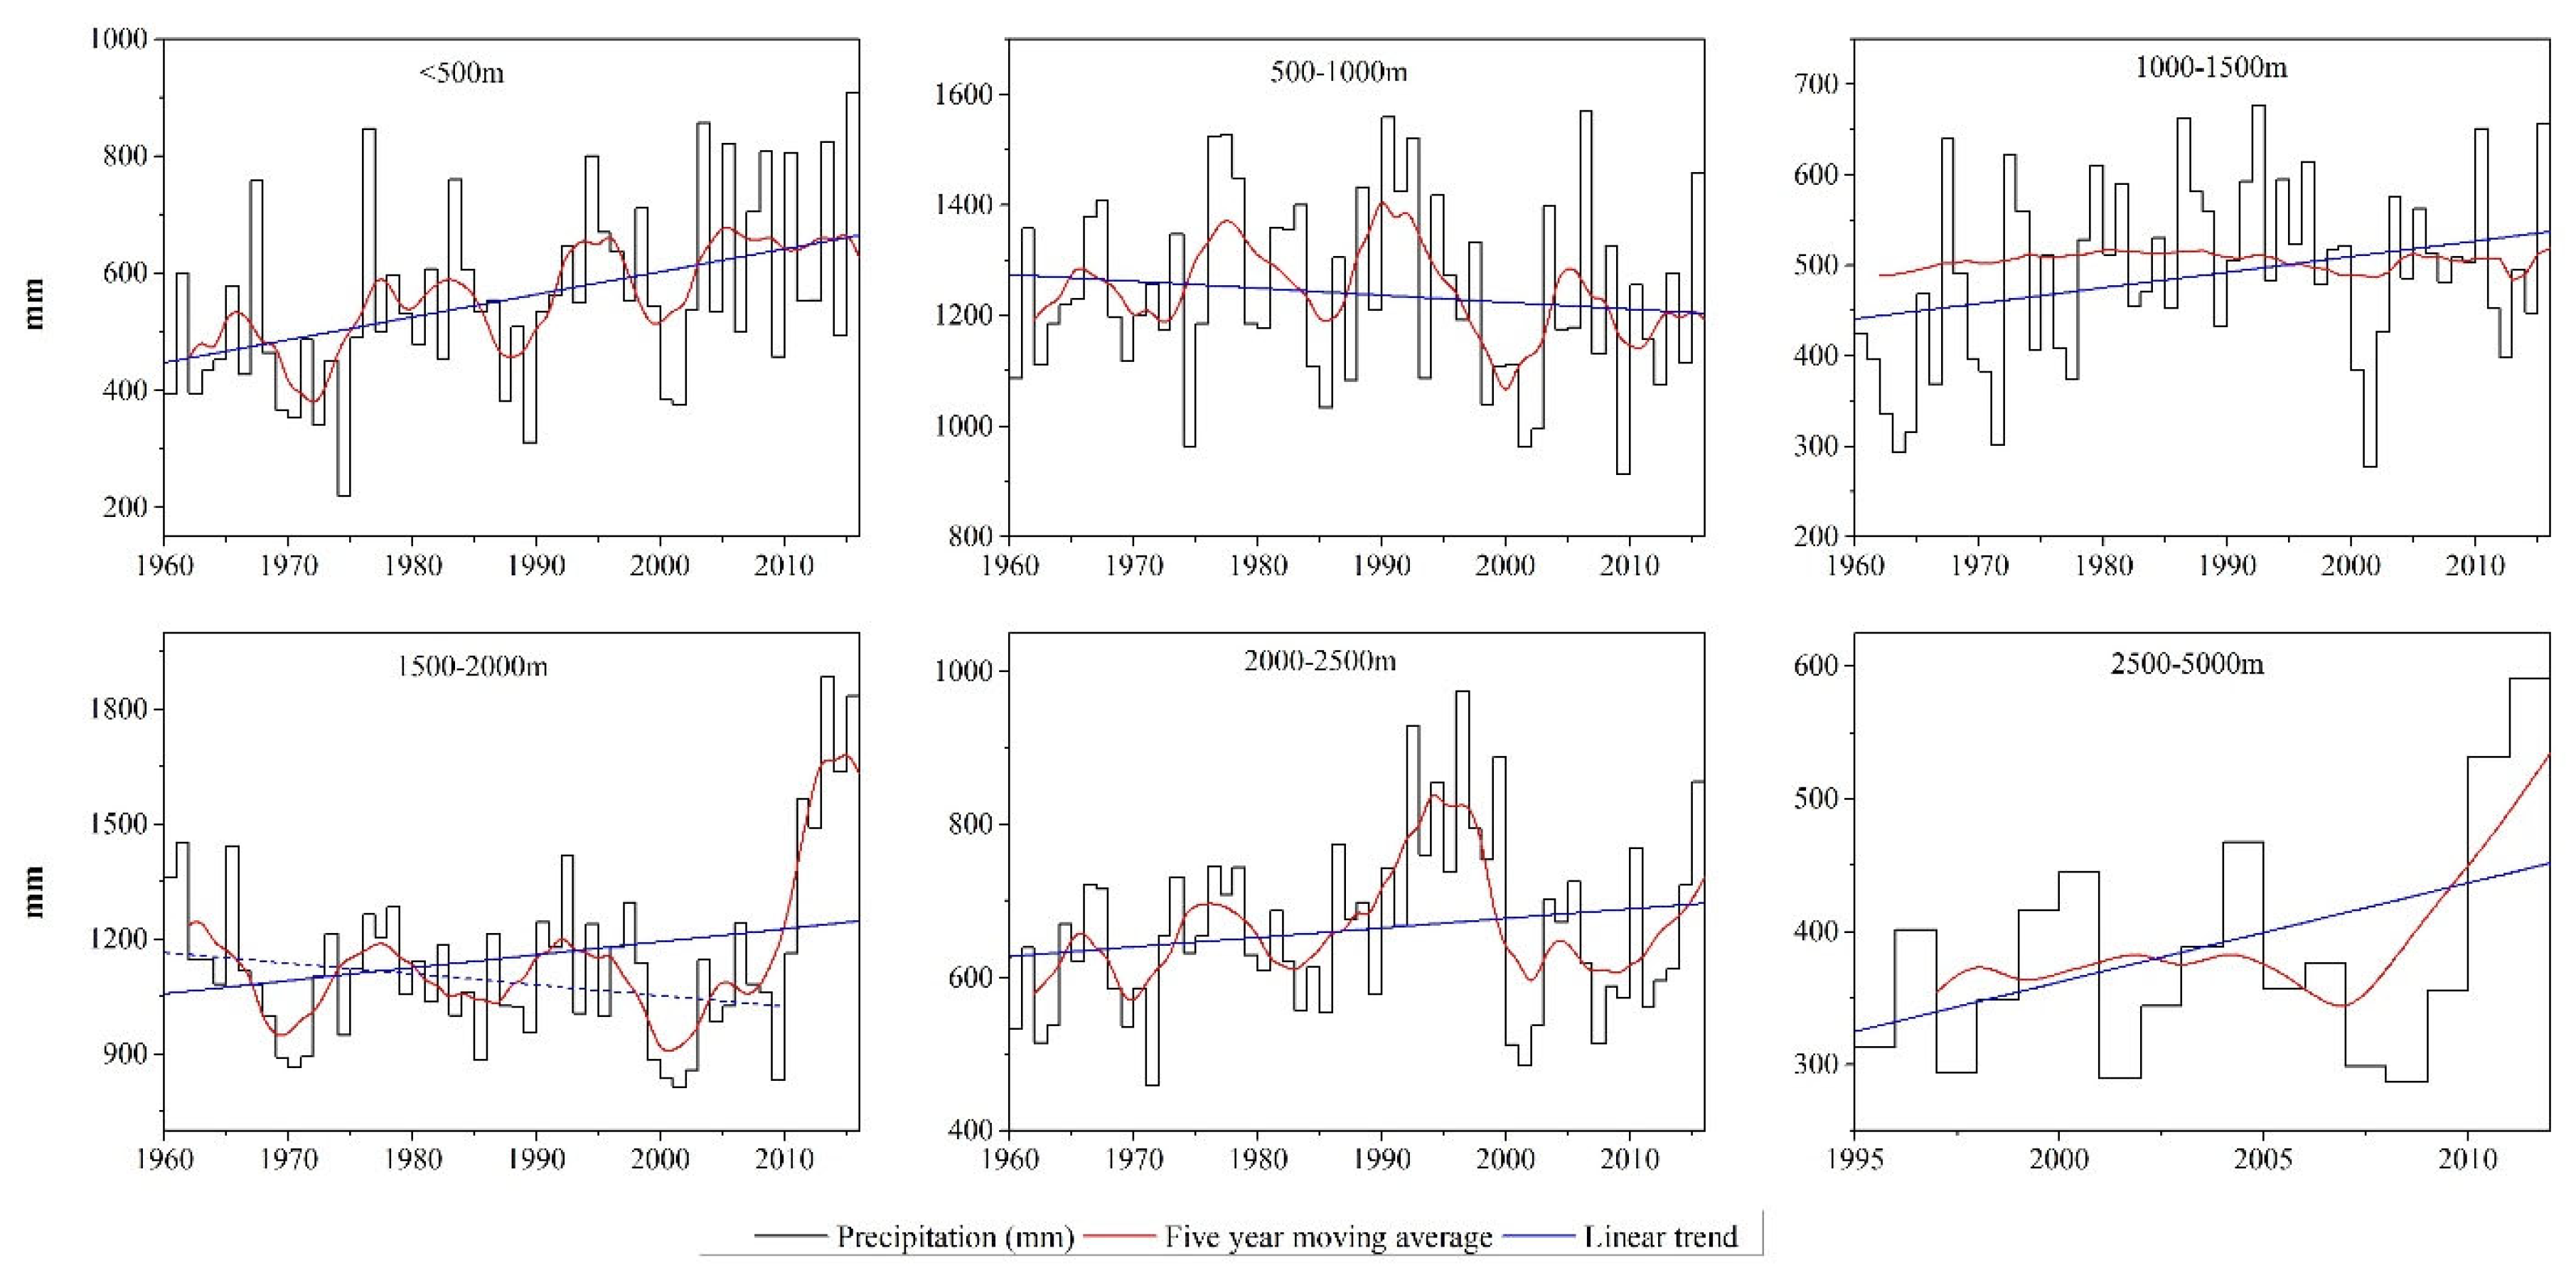
- The temporal trends in annual precipitation were assessed over six elevations. The annual precipitation showed an increasing trend at <500 m, 100–1500 m, 1500–2000 m, 2000–2500 m, and 2500–5000 m, whereas the decreasing trend is observed at 500–1000 m. According to WTC, the AO, ENSO, and IOD witnessed higher coherence with precipitation in NP, whereas the AMO, NAO, and PDO observed fewer coherences.
- Winter precipitation had a higher linear regression with AO and spring with ENSO, while the AO, IOD, and PDO have higher influences on summer precipitation, whereas the AO and ENSO were dominant at the annual time scale.
Author Contributions
Funding
Institutional Review Board Statement
Informed Consent Statement
Data Availability Statement
Acknowledgments
Conflicts of Interest
References
- Perotti, E.; Huguenin-Elie, O.; Meisser, M.; Dubois, S.; Probo, M.; Mariotte, P. Climatic, soil, and vegetation drivers of forage yield and quality differ across the first three growth cycles of intensively managed permanent grasslands. Eur. J. Agron. 2021, 122, 126194. [Google Scholar] [CrossRef]
- Palmer, M.; Ruhi, A. Linkages between flow regime, biota, and ecosystem processes: Implications for river restoration. Science 2019, 365, eaaw2087. [Google Scholar] [CrossRef] [PubMed]
- Li, X.; Zhang, K.; Gu, P.; Feng, H.; Yin, Y.; Chen, W.; Cheng, B. Changes in precipitation extremes in the Yangtze River Basin during 1960–2019 and the association with global warming, ENSO, and local effects. Sci. Total Environ. 2021, 760, 144244. [Google Scholar] [CrossRef]
- Hrudya, P.; Varikoden, H.; Vishnu, R. A review on the Indian summer monsoon rainfall, variability and its association with ENSO and IOD. Meteor. Atmos. Phy. 2021, 133, 1–14. [Google Scholar] [CrossRef]
- Papalexiou, S.M.; Montanari, A. Global and regional increase of precipitation extremes under global warming. Water Resour. Res. 2019, 55, 4901–4914. [Google Scholar] [CrossRef]
- Reichle, R.H.; Koster, R.D.; De Lannoy, G.J.; Forman, B.A.; Liu, Q.; Mahanama, S.P.; Touré, A. Assessment and enhancement of MERRA land surface hydrology estimates. J. Clim. 2011, 24, 6322–6338. [Google Scholar] [CrossRef]
- Zhang, Y.; You, Q.; Ullah, S.; Chen, C.; Shen, L.; Liu, Z. Substantial increase in abrupt shifts between drought and flood events in China based on observations and model simulations. Sci. Total Environ. 2023, 876, 162822. [Google Scholar] [CrossRef]
- Yu, Y.; You, Q.; Zuo, Z.; Zhang, Y.; Cai, Z.; Li, W.; Jiang, Z.; Ullah, S.; Tang, X.; Zhang, R. Compound climate extremes in China: Trends, causes, and projections. Atmos. Res. 2023, 286, 106675. [Google Scholar] [CrossRef]
- Tuel, A.; Martius, O. A global perspective on the sub-seasonal clustering of precipitation extremes. Weather. Clim. Extrem. 2021, 33, 100348. [Google Scholar] [CrossRef]
- Rivera-ferre, M.; Di Masso, M.; Vara, I.; Cuellar, M.; López-i-Gelats, F.; Bhatta, G.; Gallar, D. Traditional agricultural knowledge in land management: The potential contributions of ethnographic research to climate change adaptation in India, Bangladesh, Nepal, and Pakistan. Clim. Develop. 2021, 13, 644–661. [Google Scholar] [CrossRef]
- Waqas, H.; Lu, L.; Tariq, A.; Li, Q.; Baqa, M.F.; Xing, J.; Sajjad, A. Flash Flood Susceptibility Assessment and Zonation Using an Integrating Analytic Hierarchy Process and Frequency Ratio Model for the Chitral District, Khyber Pakhtunkhwa, Pakistan. Water 2021, 13, 1650. [Google Scholar] [CrossRef]
- Eckstein, D.; Künzel, V.; Schäfer, L. Global Climate Risk Index 2021, Who Suffers Most from Extreme Weather Events. In Weather-Related Loss Events in 2019 and 2000–2019; Germanwatch eV: Bonn, Germany, 2021. [Google Scholar]
- Abbas, A.; Bhatti, A.S.; Ullah, S.; Ullah, W.; Waseem, M.; Zhao, C.; Dou, X.; Ali, G. Projection of precipitation extremes over South Asia from CMIP6 GCMs. J. Arid Land 2023, 15, 274–296. [Google Scholar] [CrossRef]
- Hu, P.; Sharifi, A.; Tahir, M.N.; Tariq, A.; Zhang, L.; Mumtaz, F.; Shah, S.H.I.A. Evaluation of Vegetation Indices and Phenological Metrics Using Time-Series MODIS Data for Monitoring Vegetation Change in Punjab, Pakistan. Water 2021, 13, 2550. [Google Scholar] [CrossRef]
- Arshad, M.; Ma, X.; Yin, J.; Ullah, W.; Ali, G.; Ullah, S.; Liu, M.; Shahzaman, M.; Ullah, I. Evaluation of GPM-IMERG and TRMM-3B42 precipitation products over Pakistan. Atmos. Res. 2021, 249, 105341. [Google Scholar] [CrossRef]
- Ullah, W.; Wang, G.; Ali, G.; Tawia Hagan, D.F.; Bhatti, A.S.; Lou, D. Comparing multiple precipitation products against in-situ observations over different climate regions of Pakistan. Remote Sens. 2019, 11, 628. [Google Scholar] [CrossRef]
- Lau, W.K.; Kim, K.-M. The 2010 Pakistan flood and Russian heat wave: Teleconnection of hydrometeorological extremes. J. Hydromet. 2012, 13, 392–403. [Google Scholar] [CrossRef]
- Wu, H.; Guo, B.; Fan, J.; Yang, F.; Han, B.; Wei, C.; Lu, Y.; Zang, W.; Zhen, X.; Meng, C. A novel remote sensing ecological vulnerability index on large scale: A case study of the China-Pakistan Economic Corridor region. Ecologic. Indic. 2021, 129, 107955. [Google Scholar] [CrossRef]
- Heike Hartmann, H.B. Trends in Extreme Precipitation Events in the Indus River Basin and Flooding in Pakistan. Atmos. Ocean 2013, 52, 77–91. [Google Scholar] [CrossRef]
- Hussain, A.; Cao, J.; Hussain, I.; Begum, S.; Akhtar, M.; Wu, X.; Guan, Y.; Zhou, J. Observed Trends and Variability of Temperature and Precipitation and Their Global Teleconnections in the Upper Indus Basin, Hindukush-Karakoram-Himalaya. Atmosphere 2021, 12, 973. [Google Scholar] [CrossRef]
- Adnan, S.; Ullah, K.; Gao, S.; Khosa, A.H.; Wang, Z. Shifting of agro-climatic zones, their drought vulnerability, and precipitation and temperature trends in Pakistan. Int. J. Clim. 2017, 37, 529–543. [Google Scholar] [CrossRef]
- Gadiwala, M.S.; Burke, F. Climate change and precipitation in Pakistan—A meteorological prospect. Int. J. Econ. Environ. Geol. 2013, 4, 10–15. [Google Scholar]
- Ahmad, I.; Tang, D.; Wang, T.; Wang, M.; Wagan, B. Precipitation trends over time using Mann-Kendall and spearman’s rho tests in swat river basin, Pakistan. Advan. Met. 2015, 2015, 431860. [Google Scholar] [CrossRef]
- Iqbal, M.F.; Athar, H. Variability, trends, and teleconnections of observed precipitation over Pakistan. Theor. Appl. Clim. 2018, 134, 613–632. [Google Scholar] [CrossRef]
- Afzal, M.; Haroon, M.; Rana, A.; Imran, A. Influence of north Atlantic oscillations and southern oscillations on winter precipitation of northern Pakistan. Pak. J. Meteorol. 2013, 9, 18. [Google Scholar]
- Iftikhar, A.; Zhaobo, R.A.; Weitao, D. Winter-Spring Precipitation Variability in Pakistan. Am. J. Clim. Change 2015, 4, 115. [Google Scholar]
- Zaman, M.; Ahmad, I.; Usman, M.; Saifullah, M.; Anjum, M.N.; Khan, M.I.; Uzair Qamar, M. Event-Based Time Distribution Patterns, Return Levels, and Their Trends of Extreme Precipitation across Indus Basin. Water 2020, 12, 3373. [Google Scholar] [CrossRef]
- Akhtar, M.; Zhao, Y.; Gao, G.; Gulzar, Q.; Hussain, A. Assessment of spatiotemporal variations of ecosystem service values and hotspots in a dryland: A case-study in Pakistan. Land Degrad. Develop. 2022, 33, 1383–1397. [Google Scholar] [CrossRef]
- Nawaz, Z.; Li, X.; Chen, Y.; Guo, Y.; Wang, X.; Nawaz, N. Temporal and spatial characteristics of precipitation and temperature in Punjab, Pakistan. Water 2019, 11, 1916. [Google Scholar] [CrossRef]
- Hussain, A.; Cao, J.; Ali, S.; Muhammad, S.; Ullah, W.; Hussain, I.; Akhtar, M.; Wu, X.; Guan, Y.; Zhou, J. Observed trends and variability of seasonal and annual precipitation in Pakistan during 1960–2016. Int. J. Clim. 2022, 42, 8313–8332. [Google Scholar] [CrossRef]
- Bookhagen, B.; Burbank, D.W. Toward a complete Himalayan hydrological budget: Spatiotemporal distribution of snowmelt and rainfall and their impact on river discharge. J. Geophy. Res. Earth Surf. 2010, 115, 1–25. [Google Scholar] [CrossRef]
- Abbas, A.; Ullah, S.; Ullah, W.; Waseem, M.; Dou, X.; Zhao, C.; Karim, A.; Zhu, J.; Hagan, D.F.T.; Bhatti, A.S. Evaluation and projection of precipitation in Pakistan using the Coupled Model Intercomparison Project Phase 6 model simulations. Int. J. Clim. 2022, 42, 6665–6684. [Google Scholar] [CrossRef]
- Khan, I.; Waqas, T.; Ullah, S. Precipitation variability and its trend detection for monitoring of drought hazard in northern mountainous region of Pakistan. Arab. J. Geosci. 2020, 13, 698. [Google Scholar] [CrossRef]
- Abbasi, A.M.; Shah, M.H.; Khan, M.A. Pakistan and Pakistani Himalayas. In Wild Edible Vegetables of Lesser Himalayas; Springer: Berlin/Heidelberg, Germany, 2015; pp. 1–18. [Google Scholar]
- Black, M. The Atlas of Water: Mapping the World’s Most Critical Resource; Univ of California Press: Berkeley, CA, USA, 2016. [Google Scholar]
- Rondhi, M.; Fatikhul Khasan, A.; Mori, Y.; Kondo, T. Assessing the role of the perceived impact of climate change on national adaptation policy: The case of rice farming in Indonesia. Land 2019, 8, 81. [Google Scholar] [CrossRef]
- Hussain, A.; Ali, H.; Begum, F.; Hussain, A.; Khan, M.Z.; Guan, Y.; Zhou, J.; Hussain, K. Mapping of Soil Properties under Different Land Uses in Lesser Karakoram Range, Pakistan. Pol. J. Environ. Stud. 2021, 30, 1181–1189. [Google Scholar] [CrossRef]
- Azam, A.; Shafique, M. Agriculture in Pakistan and its Impact on Economy. A Review. Inter. J. Adv. Sci. Technol. 2017, 103, 47–60. [Google Scholar] [CrossRef]
- Sharma, S.; Hamal, K.; Pokharel, B.; Fosu, B.; Wang, S.Y.S.; Gillies, R.R.; Aryal, D.; Shrestha, A.; Marahatta, S.; Hussain, A.; et al. Atypical forcing embedded in typical forcing leading to the extreme summer 2020 precipitation in Nepal. Clim. Dyn. 2023, 10, 1–12. [Google Scholar] [CrossRef]
- Bhatti, A.S.; Wang, G.; Ullah, W.; Ullah, S.; Fiifi Tawia Hagan, D.; Kwesi Nooni, I.; Lou, D.; Ullah, I. Trend in extreme precipitation indices based on long term in situ precipitation records over Pakistan. Water 2020, 12, 797. [Google Scholar] [CrossRef]
- Khalil, A. Inhomogeneity detection in the rainfall series for the Mae Klong River Basin, Thailand. Appl. Water Sci. 2021, 11, 147. [Google Scholar] [CrossRef]
- Ahmed, K.; Nawaz, N.; Khan, N.; Rasheed, B.; Baloch, A. Inhomogeneity detection in the precipitation series: Case of arid province of Pakistan. Environ. Develop. Sustain. 2021, 23, 7176–7192. [Google Scholar] [CrossRef]
- Ray, S.; Das, S.S.; Mishra, P.; Al Khatib, A.M.G. Time series SARIMA Modelling and forecasting of monthly rainfall and temperature in the south Asian countries. Earth Syst. Environ. 2021, 5, 531–546. [Google Scholar] [CrossRef]
- Mirdashtvan, M.; Najafinejad, A.; Malekian, A.; Sa’doddin, A. Regional analysis of trend and non-stationarity of hydro-climatic time series in the Southern Alborz Region, Iran. Int. J. Clim. 2020, 40, 1979–1991. [Google Scholar] [CrossRef]
- Piles, M.; Muñoz-Marí, J.; Guerrero-Curieses, A.; Camps-Valls, G.; Rojo-Álvarez, J.L. Autocorrelation Metrics to Estimate Soil Moisture Persistence from Satellite Time Series: Application to Semiarid Regions. IEEE Tran. Geosci. Remote Sens. 2021, 60, 4401417. [Google Scholar] [CrossRef]
- Ullah, S.; You, Q.; Ali, A.; Ullah, W.; Jan, M.A.; Zhang, Y.; Xie, W.; Xie, X. Observed changes in maximum and minimum temperatures over China-Pakistan economic corridor during 1980–2016. Atmos. Res. 2019, 216, 37–51. [Google Scholar] [CrossRef]
- Agbo, E.P.; Ekpo, C.M.; Edet, C.O. Analysis of the effects of meteorological parameters on radio refractivity, equivalent potential temperature and field strength via Mann-Kendall test. Theor. Appl. Clim. 2021, 143, 1437–1456. [Google Scholar] [CrossRef]
- Ashraf, M.S.; Ahmad, I.; Khan, N.M.; Zhang, F.; Bilal, A.; Guo, J. Streamflow Variations in Monthly, Seasonal, Annual and Extreme Values Using Mann-Kendall, Spearmen’s Rho and Innovative Trend Analysis. Water. Res. Manag. 2021, 35, 243–261. [Google Scholar] [CrossRef]
- Karami, S.; Hossein Hamzeh, N.; Sabzezari, H.; Lo Alizadeh, M. Investigation of trend analysis of the number of dust stormy days and aerosol concentration derived from satellite in Khuzestan province by using non-parametric Mann-Kendall test. J. Clim. Res. 2021, 1399, 91–103. [Google Scholar]
- Kubiak-Wójcicka, K.; Pilarska, A.; Kamiński, D. The Analysis of Long-Term Trends in the Meteorological and Hydrological Drought Occurrences Using Non-Parametric Methods—Case Study of the Catchment of the Upper Noteć River (Central Poland). Atmosphere 2021, 12, 1098. [Google Scholar] [CrossRef]
- Ullah, S.; You, Q.; Ullah, W.; Ali, A. Observed changes in precipitation in China-Pakistan economic corridor during 1980–2016. Atmos. Res. 2018, 210, 1–14. [Google Scholar] [CrossRef]
- Seenu, P.; Jayakumar, K. Comparative study of innovative trend analysis technique with Mann-Kendall tests for extreme rainfall. Arab. J. Geosci. 2021, 14, 536. [Google Scholar]
- Mohsin, S.; Lone, M. Trend analysis of reference evapotranspiration and identification of responsible factors in the Jhelum River Basin, Western Himalayas. Mod. Earth Syst. Environ. 2021, 7, 523–535. [Google Scholar] [CrossRef]
- Baig, M.R.I.; Naikoo, M.W.; Ansari, A.H.; Ahmad, S.; Rahman, A. Spatio-temporal analysis of precipitation pattern and trend using standardized precipitation index and Mann–Kendall test in coastal Andhra Pradesh. Model. Earth. Syst. Environ. 2021, 8, 2733–2752. [Google Scholar] [CrossRef]
- Asgher, S.; Ahmad, M.; Kumar, N.; Kumari, M. Trend Analysis of Temperature and Rainfall using Mann Kendall Test and Sen’s Slope Estimator in Bhaderwah Tehsil of Doda District. Res. J. Agric. Sci. 2021, 12, 1021–1026. [Google Scholar]
- Aditya, F.; Gusmayanti, E.; Sudrajat, J. Rainfall trend analysis using Mann-Kendall and Sen’s slope estimator test in West Kalimantan. In Proceedings of the IOP Conference Series: Earth and Environmental Science, Surakarta, Indonesia, 24–25 August 2021; p. 012006. [Google Scholar]
- AlSubih, M.; Kumari, M.; Mallick, J.; Ramakrishnan, R.; Islam, S.; Singh, C.K. Time series trend analysis of rainfall in last five decades and its quantification in Aseer Region of Saudi Arabia. Arab. J. Geosci. 2021, 14, 519. [Google Scholar] [CrossRef]
- Gupta, N.; Banerjee, A.; Gupta, S.K. Spatio-temporal trend analysis of climatic variables over Jharkhand, India. Earth Syst. Environ. 2021, 5, 71–86. [Google Scholar] [CrossRef]
- Alsubih, M.; Mallick, J.; Talukdar, S.; Salam, R.; AlQadhi, S.; Fattah, M.A.; Thanh, N.V. An investigation of the short-term meteorological drought variability over Asir Region of Saudi Arabia. Theor. Appl. Clim. 2021, 145, 597–617. [Google Scholar] [CrossRef]
- Chong, K.; Huang, Y.; Koo, C.; Ahmed, A.N.; El-Shafie, A. Spatiotemporal Variability Analysis of Standardized Precipitation Indexed Droughts Using Wavelet Transform. J. Hydrol. 2021, 605, 127299. [Google Scholar] [CrossRef]
- Ullah, I.; Ma, X.; Yin, J.; Saleem, F.; Syed, S.; Omer, A.; Habtemicheal, B.A.; Liu, M.; Arshad, M. Observed changes in seasonal drought characteristics and their possible potential drivers over Pakistan. Int. J. Clim. 2021, 42, 1576–1596. [Google Scholar] [CrossRef]
- Pandey, B.K.; Khare, D.; Tiwari, H.; Mishra, P.K. Analysis and visualization of meteorological extremes in humid subtropical regions. Nat. Haz. 2021, 108, 661–687. [Google Scholar] [CrossRef]
- Sein, Z.M.M.; Zhi, X.; Ullah, I.; Azam, K.; Ngoma, H.; Saleem, F.; Xing, Y.; Iyakaremye, V.; Syed, S.; Hina, S. Recent variability of sub-seasonal monsoon precipitation and its potential drivers in Myanmar using in-situ observation during 1981–2020. Int. J. Clim. 2021, 42, 3341–3359. [Google Scholar] [CrossRef]
- Ouyang, X.; Chen, D.; Zhou, S.; Zhang, R.; Yang, J.; Hu, G.; Dou, Y.; Liu, Q. A Slight Temperature Warming Trend Occurred over Lake Ontario from 2001 to 2018. Land 2021, 10, 1315. [Google Scholar] [CrossRef]
- Hussain, A.; Cao, J.; Ali, S.; Ullah, W.; Muhammad, S.; Hussain, I.; Rezaei, A.; Hamal, K.; Akhtar, M.; Abbas, H. Variability in runoff and responses to land and oceanic parameters in the source region of the Indus River. Ecologic. Indic. 2022, 140, 109014. [Google Scholar] [CrossRef]
- Yang, M.-S.; Hussain, I. Unsupervised Multi-View K-Means Clustering Algorithm. IEEE Access 2023, 11, 13574–13593. [Google Scholar] [CrossRef]
- MacQueen, J. Some methods for classification and analysis of multivariate observations. In Proceedings of the Fifth Berkeley Symposium on Mathematical Statistics and Probability, Berkeley, CA, USA, 21 June–18 July 1967; pp. 281–297. [Google Scholar]
- Shaheen, M.; ur Rehman, S.; Ghaffar, F. Correlation and congruence modulo based clustering technique and its application in energy classification. Sustain. Comput. Infor. Syst. 2021, 30, 100561. [Google Scholar] [CrossRef]
- Hussain, A.; Cao, J.; Ali, S.; Ullah, W.; Muhammad, S.; Hussain, I.; Abbas, H.; Hamal, K.; Sharma, S.; Akhtar, M. Wavelet coherence of monsoon and large-scale climate variabilities with precipitation in Pakistan. Int. J. Clim. 2022, 42, 9950–9966. [Google Scholar] [CrossRef]
- Ikuemonisan, F.E.; Ozebo, V.C.; Olatinsu, O.B. Investigation of Sentinel-1-derived land subsidence using wavelet tools and triple exponential smoothing algorithm in Lagos, Nigeria. Environ. Earth Sci. 2021, 80, 722. [Google Scholar] [CrossRef]
- He, L.; Freudenreich, T.; Yu, W.; Pelowski, M.; Liu, T. Methodological structure for future consumer neuroscience research. Psy. Mark. 2021, 38, 1161–1181. [Google Scholar] [CrossRef]
- Vacha, L.; Barunik, J. Co-movement of energy commodities revisited: Evidence from wavelet coherence analysis. Energy Econ. 2012, 34, 241–247. [Google Scholar] [CrossRef]
- Grinsted, A.; Moore, J.C.; Jevrejeva, S. Application of the cross wavelet transform and wavelet coherence to geophysical time series. Nonlinear Process. Geophys. 2004, 11, 561–566. [Google Scholar] [CrossRef]
- Baudouin, J.-P.; Herzog, M.; Petrie, C.A. Cross-validating precipitation datasets in the Indus River basin. Hyd. Earth Syst. Sci. 2020, 24, 427–450. [Google Scholar] [CrossRef]
- Gottschalck, J.; Meng, J.; Rodell, M.; Houser, P. Analysis of multiple precipitation products and preliminary assessment of their impact on global land data assimilation system land surface states. J. Hydromet. 2005, 6, 573–598. [Google Scholar] [CrossRef]
- Safdar, F.; Khokhar, M.F.; Mahmood, F.; Khan, M.Z.A.; Arshad, M. Observed and predicted precipitation variability across Pakistan with special focus on winter and pre-monsoon precipitation. Environ. Sci. Pollut. Res. 2022, 30, 4510–4530. [Google Scholar] [CrossRef] [PubMed]
- Hussain, A.; Ali, S.; Begum, S.; Hussain, I.; Ali, H. Climate Change Perspective in Mountain Area: Impacts and Adaptations in Naltar Valley, Western Himalaya, Pakistan. Fresenius Environ. Bull. 2019, 28, 6683–6691. [Google Scholar]
- Latif, M.; Syed, F.; Hannachi, A. Rainfall trends in the South Asian summer monsoon and its related large-scale dynamics with focus over Pakistan. Clim. Dyn. 2017, 48, 3565–3581. [Google Scholar] [CrossRef]
- Islam, T.; Md, A.R.; Rahman, M.; Khatun, R.; Hu, Z. Spatiotemporal trends in the frequency of daily rainfall in Bangladesh during 1975–2017. Theor. Appl. Clim. 2020, 141, 869–887. [Google Scholar] [CrossRef]
- Yaseen, M.; Ahmad, I.; Guo, J.; Azam, M.I.; Latif, Y. Spatiotemporal Variability in the Hydrometeorological Time-Series over Upper Indus River Basin of Pakistan. Adv. Meteor. 2020, 2020, 5852760. [Google Scholar] [CrossRef]
- Ahmed, K.; Shahid, S.; Chung, E.-S.; Ismail, T.; Wang, X.-J. Spatial distribution of secular trends in annual and seasonal precipitation over Pakistan. Clim. Res. 2017, 74, 95–107. [Google Scholar] [CrossRef]
- Hanif, M.; Khan, A.H.; Adnan, S. Latitudinal precipitation characteristics and trends in Pakistan. J. Hydrol. 2013, 492, 266–272. [Google Scholar] [CrossRef]
- Ullah, W.; Wang, G.; Lou, D.; Ullah, S.; Bhatti, A.S.; Ullah, S.; Karim, A.; Hagan, D.F.T.; Ali, G. Large-scale atmospheric circulation patterns associated with extreme monsoon precipitation in Pakistan during 1981–2018. Atmos. Res. 2021, 253, 105489. [Google Scholar] [CrossRef]
- Niyogi, D.; Kishtawal, C.; Tripathi, S.; Govindaraju, R.S. Observational evidence that agricultural intensification and land use change may be reducing the Indian summer monsoon rainfall. Water Resour. Res. 2010, 46, 1–17. [Google Scholar] [CrossRef]
- Priya, P.; Mujumdar, M.; Sabin, T.; Terray, P.; Krishnan, R. Impacts of Indo-Pacific sea surface temperature anomalies on the summer monsoon circulation and heavy precipitation over northwest India–Pakistan region during 2010. J. Clim. 2015, 28, 3714–3730. [Google Scholar] [CrossRef]
- Ahmad, I.; Zhang, F.; Tayyab, M.; Anjum, M.N.; Zaman, M.; Liu, J.; Farid, H.U.; Saddique, Q. Spatiotemporal analysis of precipitation variability in annual, seasonal and extreme values over upper Indus River basin. Atmos. Res. 2018, 213, 346–360. [Google Scholar] [CrossRef]
- Hasson, S. Future water availability from Hindukush-Karakoram-Himalaya Upper Indus Basin under conflicting climate change scenarios. Climate 2016, 4, 40. [Google Scholar] [CrossRef]
- Hasson, S.; Lucarini, V.; Khan, M.R.; Petitta, M.; Bolch, T.; Gioli, G. Early 21st century snow cover state over the western river basins of the Indus River system. Hydrol. Earth Syst. Sci. 2014, 18, 4077–4100. [Google Scholar] [CrossRef]
- Bocchiola, D.; Diolaiuti, G. Recent (1980–2009) evidence of climate change in the upper Karakoram, Pakistan. Theor. Appl. Clim. 2013, 113, 611–641. [Google Scholar] [CrossRef]
- Ali, N.; Ahmad, I.; Chaudhry, A.; Raza, M. Trend analysis of precipitation data in Pakistan. Sci. Int. 2015, 27, 803–808. [Google Scholar]
- Iqbal, Z.; Shahid, S.; Ahmed, K.; Ismail, T.; Nawaz, N. Spatial distribution of the trends in precipitation and precipitation extremes in the sub-Himalayan region of Pakistan. Theor. Appl. Clim. 2019, 137, 2755–2769. [Google Scholar] [CrossRef]
- Ahmad, W.; Fatima, A.; Awan, U.K.; Anwar, A. Analysis of long term meteorological trends in the middle and lower Indus Basin of Pakistan—A non-parametric statistical approach. Glob. Planet. Chang. 2014, 122, 282–291. [Google Scholar] [CrossRef]
- Guo, X.; Wang, L.; Tian, L. Spatio-temporal variability of vertical gradients of major meteorological observations around the Tibetan Plateau. Int. J. Clim. 2016, 36, 1901–1916. [Google Scholar] [CrossRef]
- Li, Z.; He, Y.; Wang, C.; Wang, X.; Xin, H.; Zhang, W.; Cao, W. Spatial and temporal trends of temperature and precipitation during 1960–2008 at the Hengduan Mountains, China. Quat. Int. 2011, 236, 127–142. [Google Scholar] [CrossRef]
- Hussain, M.S.; Lee, S. The regional and the seasonal variability of extreme precipitation trends in Pakistan. Asia Pac. J. Atmos. Sci. 2013, 49, 421–441. [Google Scholar] [CrossRef]
- Zhou, L.; Zhu, J.; Zou, H.; Ma, S.; Li, P.; Zhang, Y.; Huo, C. Atmospheric moisture distribution and transport over the Tibetan Plateau and the impacts of the South Asian summer monsoon. Act. Meteor. Sin. 2013, 27, 819–831. [Google Scholar] [CrossRef]
- Zhang, R.; Jiang, D.; Zhang, Z.; Yu, E. The impact of regional uplift of the Tibetan Plateau on the Asian monsoon climate. Palaeogeogr. Palaeoclimatol. Palaeoecol. 2015, 417, 137–150. [Google Scholar] [CrossRef]
- Hasson, S.; Böhner, J.; Lucarini, V. Prevailing climatic trends and runoff response from Hindukush–Karakoram–Himalaya, upper Indus Basin. Earth Syst. Dyn. 2017, 8, 337–355. [Google Scholar] [CrossRef]
- Ullah, S.; You, Q.; Wang, G.; Ullah, W.; Sachindra, D.; Yan, Y.; Bhatti, A.S.; Abbas, A.; Jan, M.A. Characteristics of human thermal stress in South Asia during 1981–2019. Environ. Res. Lett. 2022, 17, 104018. [Google Scholar] [CrossRef]
- De Oliveira-Júnior, J.F.; Shah, M.; Abbas, A.; Iqbal, M.S.; Shahzad, R.; de Gois, G.; da Silva, M.V.; da Rosa Ferraz Jardim, A.M.; de Souza, A. Spatiotemporal analysis of drought and rainfall in Pakistan via Standardized Precipitation Index: Homogeneous regions, trend, wavelet, and influence of El Niño-southern oscillation. Theor. Appl. Clim. 2022, 149, 843–862. [Google Scholar] [CrossRef]
- Attada, R.; Dasari, H.P.; Chowdary, J.S.; Yadav, R.K.; Knio, O.; Hoteit, I. Surface air temperature variability over the Arabian Peninsula and its links to circulation patterns. Int. J. Clim. 2019, 39, 445–464. [Google Scholar] [CrossRef]
- De Beurs, K.M.; Henebry, G.M.; Owsley, B.C.; Sokolik, I.N. Large scale climate oscillation impacts on temperature, precipitation and land surface phenology in Central Asia. Environ. Res. Lett. 2018, 13, 065018. [Google Scholar] [CrossRef]
- Syed, F.S.; Giorgi, F.; Pal, J.; Keay, K. Regional climate model simulation of winter climate over Central–Southwest Asia, with emphasis on NAO and ENSO effects. Int. J. Clim. 2010, 30, 220–235. [Google Scholar] [CrossRef]


| No. | Code | Stations | Region | Duration | Elevation (m) | Latitude | Longitude | Coefficient of Variance |
|---|---|---|---|---|---|---|---|---|
| 1 | Nlt | Naltar | I | 1995–2012 | 2858 | 36.17 | 74.18 | 0.19 |
| 2 | Zrt | Ziarat | 1995–2012 | 3669 | 36.49 | 74.26 | 0.51 | |
| 3 | Khu | Khunjerab | 1995–2012 | 4730 | 36.84 | 75.42 | 0.31 | |
| 4 | Ast | Astor | 1960–2016 | 2168 | 35.35 | 74.86 | 0.25 | |
| 5 | Bun | Bunji | 1960–2016 | 1372 | 35.67 | 74.63 | 0.44 | |
| 6 | Chl | Chilas | 1960–2016 | 1250 | 35.42 | 74.1 | 0.48 | |
| 7 | Glt | Gilgit | 1960–2016 | 1460 | 35.92 | 74.33 | 0.35 | |
| 8 | Gup | Gupis | 1960–2016 | 2156 | 36.17 | 73.4 | 0.73 | |
| 9 | Skd | Skardu | 1960–2016 | 2317 | 35.18 | 75.68 | 0.51 | |
| 10 | Cht | Chitral | 1964–2016 | 1498 | 35.83 | 71.78 | 0.28 | |
| 11 | Drh | Drosh | 1960–2016 | 1465 | 35.55 | 71.85 | 0.24 | |
| 12 | Dir | Dir | II | 1967–2016 | 1375 | 35.2 | 71.85 | 0.19 |
| 13 | Sad | Saidu Sharif | 1974–2016 | 961 | 34.73 | 72.35 | 0.22 | |
| 14 | Gdp | Garhi Dupatta | 1960–2016 | 813 | 34.13 | 73.47 | 0.19 | |
| 15 | Ktl | Kotli | 1960–2016 | 614 | 33.31 | 73.54 | 0.21 | |
| 16 | Mzf | Muzaffarabad | 1960–2016 | 838 | 34.37 | 73.48 | 0.17 | |
| 17 | Blk | Balakot | 1960–2016 | 995 | 34.55 | 73.21 | 0.22 | |
| 18 | Mur | Murree | 1960–2016 | 2134 | 33.90 | 73.40 | 0.17 | |
| 19 | Kak | Kakul | 1960–2016 | 1775 | 34.18 | 73.15 | 0.14 | |
| 20 | Cht | Cherat | 1960–2016 | 1372 | 33.92 | 71.9 | 0.34 | |
| 21 | Isb | Islamabad | 1960–2016 | 508 | 33.80 | 73.08 | 0.25 | |
| 22 | Pch | Parachinar | III | 1960–2016 | 1775 | 33.90 | 70.10 | 0.42 |
| 23 | Psh | Peshawar | 1960–2016 | 328 | 34.02 | 71.58 | 0.34 | |
| 24 | Rsp | Risalpur | 1960–2016 | 304 | 34.07 | 71.98 | 0.29 | |
| 25 | Kht | Kohat | 1960–2016 | 564 | 33.45 | 71.53 | 0.31 |
| Region | Characteristics | Major Regions | Stations |
|---|---|---|---|
| I | Semi-arid | Gilgit–Baltistan and Chitral region, Upper Indus Basin and Chitral River Basin, Hindukush–Karakoram–Himalaya | 11 |
| II | Humid | Kakul–Cherat Hills, Swat Valley, Margalla Hills, Azad Jammu and Kashmir, Jhelum River Basin, Southwestern Himalaya | 10 |
| III | Humid | Central KPK, southern parts of Kabul River Basin | 4 |
| Winter | Spring | Summer | Autumn | Annual | |
|---|---|---|---|---|---|
| R-I | 48.42 | 103.75 | 47.68 | 28.80 | 229.54 |
| R-II | 259.59 | 324.80 | 556.88 | 178.25 | 1320.57 |
| R-III | 128.05 | 212.37 | 232.67 | 89.99 | 664.81 |
| NP | 166.48 | 237.06 | 308.63 | 110.52 | 823.80 |
| Period | Winter | Spring | Summer | Autumn | Annual | |
|---|---|---|---|---|---|---|
| 1960–1988 | R-I | −0.11 | −0.52 | 0.88 | 0.37 | 1.53 |
| R-II | −0.13 | 1.35 | 1.19 | 0.43 | 5.94 | |
| R-III | −0.98 | −1.69 | 0.84 | −1.02 | −3.35 | |
| NP | −0.18 | 0.38 | 2.07 | 0.24 | 3.33 | |
| 1989–2016 | R-I | −0.28 | −0.87 | −0.58 | 0.20 | −0.45 |
| R-II | −5.24 | −3.14 | −2.92 | −0.21 | −7.90 | |
| R-III | 0.08 | 2.80 | 5.49 | 2.24 | 12.55 | |
| NP | −2.76 | −1.19 | −0.54 | 0.43 | −1.91 | |
| 1960–2016 | R-I | 0.38 | −0.15 | 0.39 | 0.12 | 1.05 |
| R-II | −0.34 | −0.40 | −1 | 0.00 | −1.14 | |
| R-III | 0.57 | 0.20 | 1.64 | 0.63 | 3.95 | |
| NP | −0.55 | −0.75 | −1.66 | −0.19 | −2.86 |
| Season | Index | Estimate | SE | p-Value |
|---|---|---|---|---|
| Winter | AO | 3.40 | 1.08 | 0.002 |
| NAO | −2.28 | 0.77 | 0.004 | |
| ENSO | 1.97 | 0.72 | 0.008 | |
| IOD | −2.40 | 1.71 | 0.16 | |
| PDO | −1.08 | 0.45 | 0.02 | |
| Spring | AO | −0.21 | 1.22 | 0.85 |
| NAO | −0.32 | 0.87 | 0.71 | |
| ENSO | 1.86 | 0.81 | 0.02 | |
| IOD | −4.40 | 1.92 | 0.02 | |
| PDO | 0.08 | 0.52 | 0.87 | |
| Summer | AO | 1.27 | 0.78 | 0.10 |
| NAO | −1.12 | 0.56 | 0.04 | |
| ENSO | −1.33 | 0.52 | 0.01 | |
| IOD | 0.68 | 1.23 | 0.58 | |
| PDO | 1.11 | 0.33 | 0.001 | |
| Annual | AO | 3.34 | 1.54 | 0.03 |
| NAO | −1.28 | 1.10 | 0.24 | |
| ENSO | 2.19 | 1.02 | 0.037 | |
| IOD | −6.10 | 2.43 | 0.01 | |
| PDO | 0.63 | 0.65 | 0.33 |
Disclaimer/Publisher’s Note: The statements, opinions and data contained in all publications are solely those of the individual author(s) and contributor(s) and not of MDPI and/or the editor(s). MDPI and/or the editor(s) disclaim responsibility for any injury to people or property resulting from any ideas, methods, instructions or products referred to in the content. |
© 2023 by the authors. Licensee MDPI, Basel, Switzerland. This article is an open access article distributed under the terms and conditions of the Creative Commons Attribution (CC BY) license (https://creativecommons.org/licenses/by/4.0/).
Share and Cite
Rebi, A.; Hussain, A.; Hussain, I.; Cao, J.; Ullah, W.; Abbas, H.; Ullah, S.; Zhou, J. Spatiotemporal Precipitation Trends and Associated Large-Scale Teleconnections in Northern Pakistan. Atmosphere 2023, 14, 871. https://doi.org/10.3390/atmos14050871
Rebi A, Hussain A, Hussain I, Cao J, Ullah W, Abbas H, Ullah S, Zhou J. Spatiotemporal Precipitation Trends and Associated Large-Scale Teleconnections in Northern Pakistan. Atmosphere. 2023; 14(5):871. https://doi.org/10.3390/atmos14050871
Chicago/Turabian StyleRebi, Ansa, Azfar Hussain, Ishtiaq Hussain, Jianhua Cao, Waheed Ullah, Haider Abbas, Safi Ullah, and Jinxing Zhou. 2023. "Spatiotemporal Precipitation Trends and Associated Large-Scale Teleconnections in Northern Pakistan" Atmosphere 14, no. 5: 871. https://doi.org/10.3390/atmos14050871