Article

A Framework to Predict Community Risk from Severe Weather Threats Using Probabilistic Hazard Information (PHI)

1
OU Cooperative Institute for Severe and High-Impact Weather Research and Operations, Norman, OK 73072, USA
2
NOAA National Severe Storms Laboratory, Norman, OK 73072, USA
*
Author to whom correspondence should be addressed.
Atmosphere 2023, 14(5), 767; https://doi.org/10.3390/atmos14050767
Submission received: 21 March 2023 / Revised: 14 April 2023 / Accepted: 20 April 2023 / Published: 23 April 2023
(This article belongs to the Special Issue Advances in Severe Weather Forecast)

Abstract

:
Community assets, including physical structures and critical infrastructure, provide the essential services that underpin our communities. Their destruction or incapacitation from severe weather threats such as hail and tornadoes can have a debilitating impact on a community’s quality of life, economy, and public health. Recently, prototype Probabilistic Hazard Information (PHI) from the NOAA Forecasting a Continuum of Environmental Threats (FACETs) program has been developed to reflect the rapidly changing nature of severe weather threats to support forecasters, emergency management agencies, and the public. This study develops a holistic framework to merge PHI with a geodatabase of local infrastructure and community assets to predict possible impacts during events and to assist with post-event recovery. To measure the degree of damage of each building, this study uses the predicted intensity from forecasters along with damage indicators from the Enhanced Fujita scale for a range of wind speeds associated with the predicted intensity. The proposed framework provides the possibility of (1) live prediction of risks to community assets due to local vulnerability, and (2) provision of detailed damage assessments, such as degree of damage of systems or assets, and affected areas, to emergency agencies, infrastructure managers, and the public immediately following an event. With further refinement and verification, this community risk assessment prediction may be able to better communicate possible impacts and improve community resiliency from severe weather threats by supporting multiple phases of emergency management, including preparedness, response, and recovery.

1. Introduction

Community assets or resources are defined as anything that can be utilized to improve the quality of community life, such as people, physical structures/places, and services [1]. Their destruction or incapacitation from either internal or external impacts has a debilitating effect on a community’s quality of life, economy, and public health. According to the National Oceanic and Atmospheric Administration (NOAA), around 90% of major declared disasters are caused by weather-related phenomena, such as tornadoes, hurricanes, storms, and floods [2,3]. One in three U.S. adults who were polled, responded that they had been affected by an extreme weather event in the past two years [4].
An individual’s vulnerability to severe weather hazards can vary based on a multitude of variables including time of day [5], location [6], demographic [7,8], and the housing or building structure [7,8]. The overall risk is dependent upon knowledge of both the hazard (e.g., tornado and strength) and the individual’s level of vulnerability/exposure. Due to these combinations, individuals have variable risk tolerance and may need to act at different hazard levels with varying lead times. Public guidance and impact communication should not only account for the hazard itself, but also include some type of vulnerability analysis that can address the local susceptibility to the hazard (e.g., Lapietra et al., 2023 [9]).
The impacts of weather- and climate-related hazards continue to adversely affect the stability of social facilities, services, and infrastructures, such as public health care, transportation, telecommunication, and electrical grids [10,11]. These types of severe weather hazards affect communities or residents by (1) interrupting services and critical infrastructure in a community, and (2) triggering cascading failure in interdependent systems and sub-systems [12]. While these indirect impacts may not be easily converted to monetary values to measure by, they can exacerbate the direct impacts from severe weather threats. For example, the 10–11 August 2020 Midwest derecho affected the infrastructure and restoration time across multiple states—including Nebraska, Iowa, Illinois, Wisconsin, Michigan, and Indiana [13] by way of high winds (110–140 mph), tornadoes, hail-damaged residential and commercial properties, and public utility infrastructure such as powerlines and communication networks. Damaged powerlines and cell towers delayed emergency response and communications. Additionally, communication of emergency information to the public through TV and Radio platforms proved very difficult due to power outages in Linn County, Iowa [14,15]. Debris generated by the storms blocked road networks and hampered the restoration of cell towers and power poles. The FCC (2022) reported that many of the communication challenges during the derecho were associated with a lack of power resiliency (particularly interruptions to power supply and commercial assets). The estimated number of people affected by power outrages was over 4 million [16].
These impacts can cascade up from the local to state level due to the growing system of interdependency in our communities. For example, Little (2002) demonstrated that damage to the road system can cause simultaneous failures in underground water and gas supplies. Due to the lack of water supply and pressure, any fires during/after a catastrophic event cannot be fought effectively [17]. As power generators and sub-stations convey electricity, they become vulnerable to cascading failures when power fluctuations exceed the margin of tolerance. Stürmer et al. (2021) studied cascading failures in electrical grids triggered by a hurricane and demonstrated how electrical system disruptions in certain cities can trigger cascading system failures to the surrounding areas in Texas [11].
NWS commissioned the National Research Council (NRC) to recommend ways in which the organization could more effectively estimate and communicate uncertainty in weather and climate forecasts to improve public safety, property protection, and economic viability [18]. NRC recommended (1) enterprise-wide involvement in products that effectively communicate forecast uncertainty information, (2) education on uncertainty and risk communication, and (3) ensuring widespread availability of uncertainty information. Many hydrometeorological agencies are moving toward impact-based forecast and warning systems (IBFW), as encouraged by the World Meteorological Organization [19]. Potter et al. (2021) found IBFW systems can result in (1) a perceived increase in the understanding of the potential impacts by the public, (2) added awareness of the antecedent condition by weather forecasters, (3) a possible reduction in “false alarms”, and (4) increased interagency communication. They argued that IBFW should be designed for the public with an increased focus on understanding vulnerability and capacities.
The U.S. weather enterprise, its customers, other NWS stakeholders, and end-users have been accustomed to receiving and using deterministic products such as severe and tornado warnings (Figure 1). In a basic sense, the warning polygon indicates that a hazard is occurring or will occur within the polygon, and it will not occur outside the polygon. As a series of warning polygons are issued one after the other, the lead times for those who are on the border of polygons can vary [20]. Using 31 years of NWS tornado warning metrics, Brooks and Correia (2018) [21] identified that mean lead time and FAR (false alarm ratio) remained consistent through time, whereas POD (probability of detection) increased dramatically from 1986 to the mid-2000s. While the overall accuracy of warning alerts/polygons has been improved over time, static data and the visualization for severe weather threats are limited in their ability to deliver the characteristics of severe weather threats in terms of their uncertainty (Figure 1a). Following feedback from the Joplin tornado service assessment (NOAA 2011), the NWS began adding impact-based warning tags to their storm-based polygons in the central United States in 2012, expanding to the rest of the nation in 2015. For tornadoes, the damage impact tags include no tag (tornado possible, base/no tag tornado), considerable (ongoing damage, likely long-lived tornado), and catastrophic (severe threat to human life and structures, long-lived tornado).
To improve weather watch/warning systems, NOAA proposed a next-generation severe weather watch and warning system, Forecasting a Continuum of Environmental Threats (FACETs) [22]. One of the goals of FACETs is to deliver a continuously updated stream of information, from days to minutes, prior to an event to fill the gaps in the current deterministic weather watch/warning system. As part of that evolution, Probabilistic Hazard Information (PHI) was designed to provide custom user-specific products that can be tailored to adapt to a variety of needs such as longer lead times for high-risk users (Figure 1b). The probability map (i.e., PHI plume) is continuously updated in real-time to reflect the rapidly changing nature of severe weather threats and can support broadcast meteorologists, emergency management agencies, and the public in better communication and decision-making. PHI is still in the prototype stage, but multiple research efforts have already been conducted to enhance the user interface and data visualization [20,23,24,25,26]. Some of these initial studies incorporating end-users have highlighted both the advantages of PHI at providing additional lead time and likelihood of impacts, while also confirming the need for deterministic warnings for specific take-cover actions such as sounding tornado sirens. Moving forward, a combination of PHI (which will provide increased temporal and spatial coverage) and embedded deterministic warnings will likely be necessary.
Given the growing nature of cascading effects across communities, regions, and states, prediction of societal impacts from weather hazards is of utmost importance. Thus, there is a need for a holistic framework to integrate multiple different system modules, including an advanced weather forecasting system, community assets, local vulnerability to the hazard, and physical damage assessment. This framework needs to support forecasters, emergency management, and the public in making sound and timely decisions. This is true throughout the multiple phases of disaster/emergency preparedness, planning, operation, mitigation, and recovery. The goal of this study is to provide part of such a holistic framework to estimate physical impacts on local community assets to address local vulnerability and critical infrastructure using probabilistic hazard information and geodatabases.
The remainder of this study is organized as follows: Section 2 provides a systematic review of existing means for community damage assessment from severe weather threats. Section 3 describes a framework to blend three types of systems (PHI, the building/infrastructure database, and the damage estimation model) for community asset damage prediction. In Section 4, the expected outcomes of this study are demonstrated in two types of case studies. Section 5 discusses the results, limitations, and future research topics. Finally, Section 6 provides our conclusions of this study.

2. Community Damage Assessment

The fundamental principles of disaster/emergency management are based on four phases: mitigation, preparedness, response, and recovery [27]. Mitigation includes actions taken to prevent/reduce the cause, impact, and consequences of disasters. Preparedness includes planning and training activities for events that could not be mitigated such as disaster preparedness planning and exercise plans. Response includes activities taken to save lives and present further community damage in an emergency. Recovery refers to activities after an emergency such as financial assistance, debris removal, and building property restoration. Ad hoc damage assessment is designed to predict potential physical damage on a community under different severe weather scenarios. It can be utilized to support mitigation, preparedness, and response. A post hoc damage assessment is utilized to evaluate severe weather impacts on a community to then determine priority response and recovery needs.
Multiple types of post hoc damage assessments have been developed, such as (1) on-site damage surveys (e.g., Burgess et al., 2014) [28]), (2) satellite and aerial image analysis (e.g., Yuan et al., 2002 [29]), (3) unmanned aircraft data collection and analysis (e.g., Wagner et al., 2019 [30]), and (4) citizen-science based data collection (e.g., Lombardo & Meidani, 2017 [31]). Table 1 provides a summary of both the advantages and disadvantages of each approach. For example, satellite-based methods can provide an overview of the affected areas/zones after a catastrophic event. They can be very informative in understanding the magnitude of the event and its damage over the affected areas. UAV methods can provide high spatial-temporal resolutions [32]; with the benefits of technological developments (e.g., BVLOS methods, fleets of UAVs, higher performance computing for big data processing), they can cover larger areas than before.
Since 2009, The National Weather Service (NWS) Damage Assessment Toolkit (DAT) has been utilized to store datasets collected during NWS post-event damage assessments. While on-site damage surveys have been widely utilized to identify community damages, they are a labor-intensive process and can miss aspects during other disaster recovery processes in a large-scale disaster. Thus, image-based approaches have been developed with images from satellites, small planes, drones, and other UAVs [33,34,35]. Lastly, citizen science-based methods have been implemented to fulfill part of the gap in existing methods [36,37,38]. These collected data and information have been used for the development of emergency planning, debris removal operations, and reconstructions.
Numerous studies have been conducted to predict potential damages from severe weather threats. Multiple building damage models have been developed to predict hurricane damage [39], wind damage [40,41], and flooding [42,43]. In the U.S., FEMAs Hazus-MH has been widely used to predict community damages from severe weather threats, including physical damage to residential and commercial buildings, critical infrastructure, and facilities [44,45]. Additionally, it provides estimates of physical/economic loss and social impacts for developing mitigation strategies from certain types of disasters such as earthquakes, tsunamis, floods, and hurricanes.
The major strength of the modeling approaches is their ability to be utilized to project and simulate possible damages under a variety of severe weather scenarios. This allows emergency management agencies to prepare multiple hazard mitigation and operational strategies. Data from these models can also be used to develop educational materials for communities to better understand risks in their local area. One main disadvantage of these prediction models is the uncertainty in their results as it is very difficult to validate the model outputs from the real-world data after a disaster [46]. Here, NWSs DAT and other datasets accessible to the public (e.g., building damage images with DoD) may be able to support the validation process of simulation models within future studies.
Community risk from severe weather threats can be measured by two components: (1) severe weather-related data/information combined with, (2) geodatabases for community assets, including critical infrastructure (assets, systems, and networks) and residential/commercial/industrial building property. Most community damage assessment tools, including Hazus-MH, have been developed as independent systems where weather information/data were designed as static data; they may not be capable of handling the dynamic weather data retrieved from systems such as PHI in real-time. To leverage the benefits of PHI, a community damage assessment system needs to be integrated with the advanced weather forecasting system to enable it to predict impacts of severe weather threats on community assets. Most existing community damage/vulnerability assessment methods use census block and block group-level data to estimate community damage [8,44,47]. While these datasets are relatively easy to acquire and take less effort to compute, they may not be suitable for small-scale severe weather threats such as tornadoes, hail, severe/damaging wind, and lightning. For these types of hazards, a smaller entity than the census block (e.g., building footprint) is likely more suitable for estimating possible damages on community assets. Thus, this study is designed to bridge the gap between the advanced weather forecasting and community damage assessment for severe weather. In the next section, we describe the research framework and the sub-systems to predict physical impacts on community assets from severe weather threats.

3. Research Framework

To leverage the benefits of an advanced weather forecasting system under FACETS and PHI paradigms with a community asset geodatabase, a holistic approach to the development of a community damage prediction system is needed. The proposed framework integrates three sub-systems including (1) PHI/potential tornado intensity, (2) the geodatabase, and (3) a building damage estimation model to predict damages on community assets from severe weather threats. Figure 2 illustrates the three sub-systems and how data/information flows between them. The subsequent model output can be visualized on a geographical information system (GIS) platform to communicate data more effectively for decision-making between forecasters, emergency management agencies, and the public.

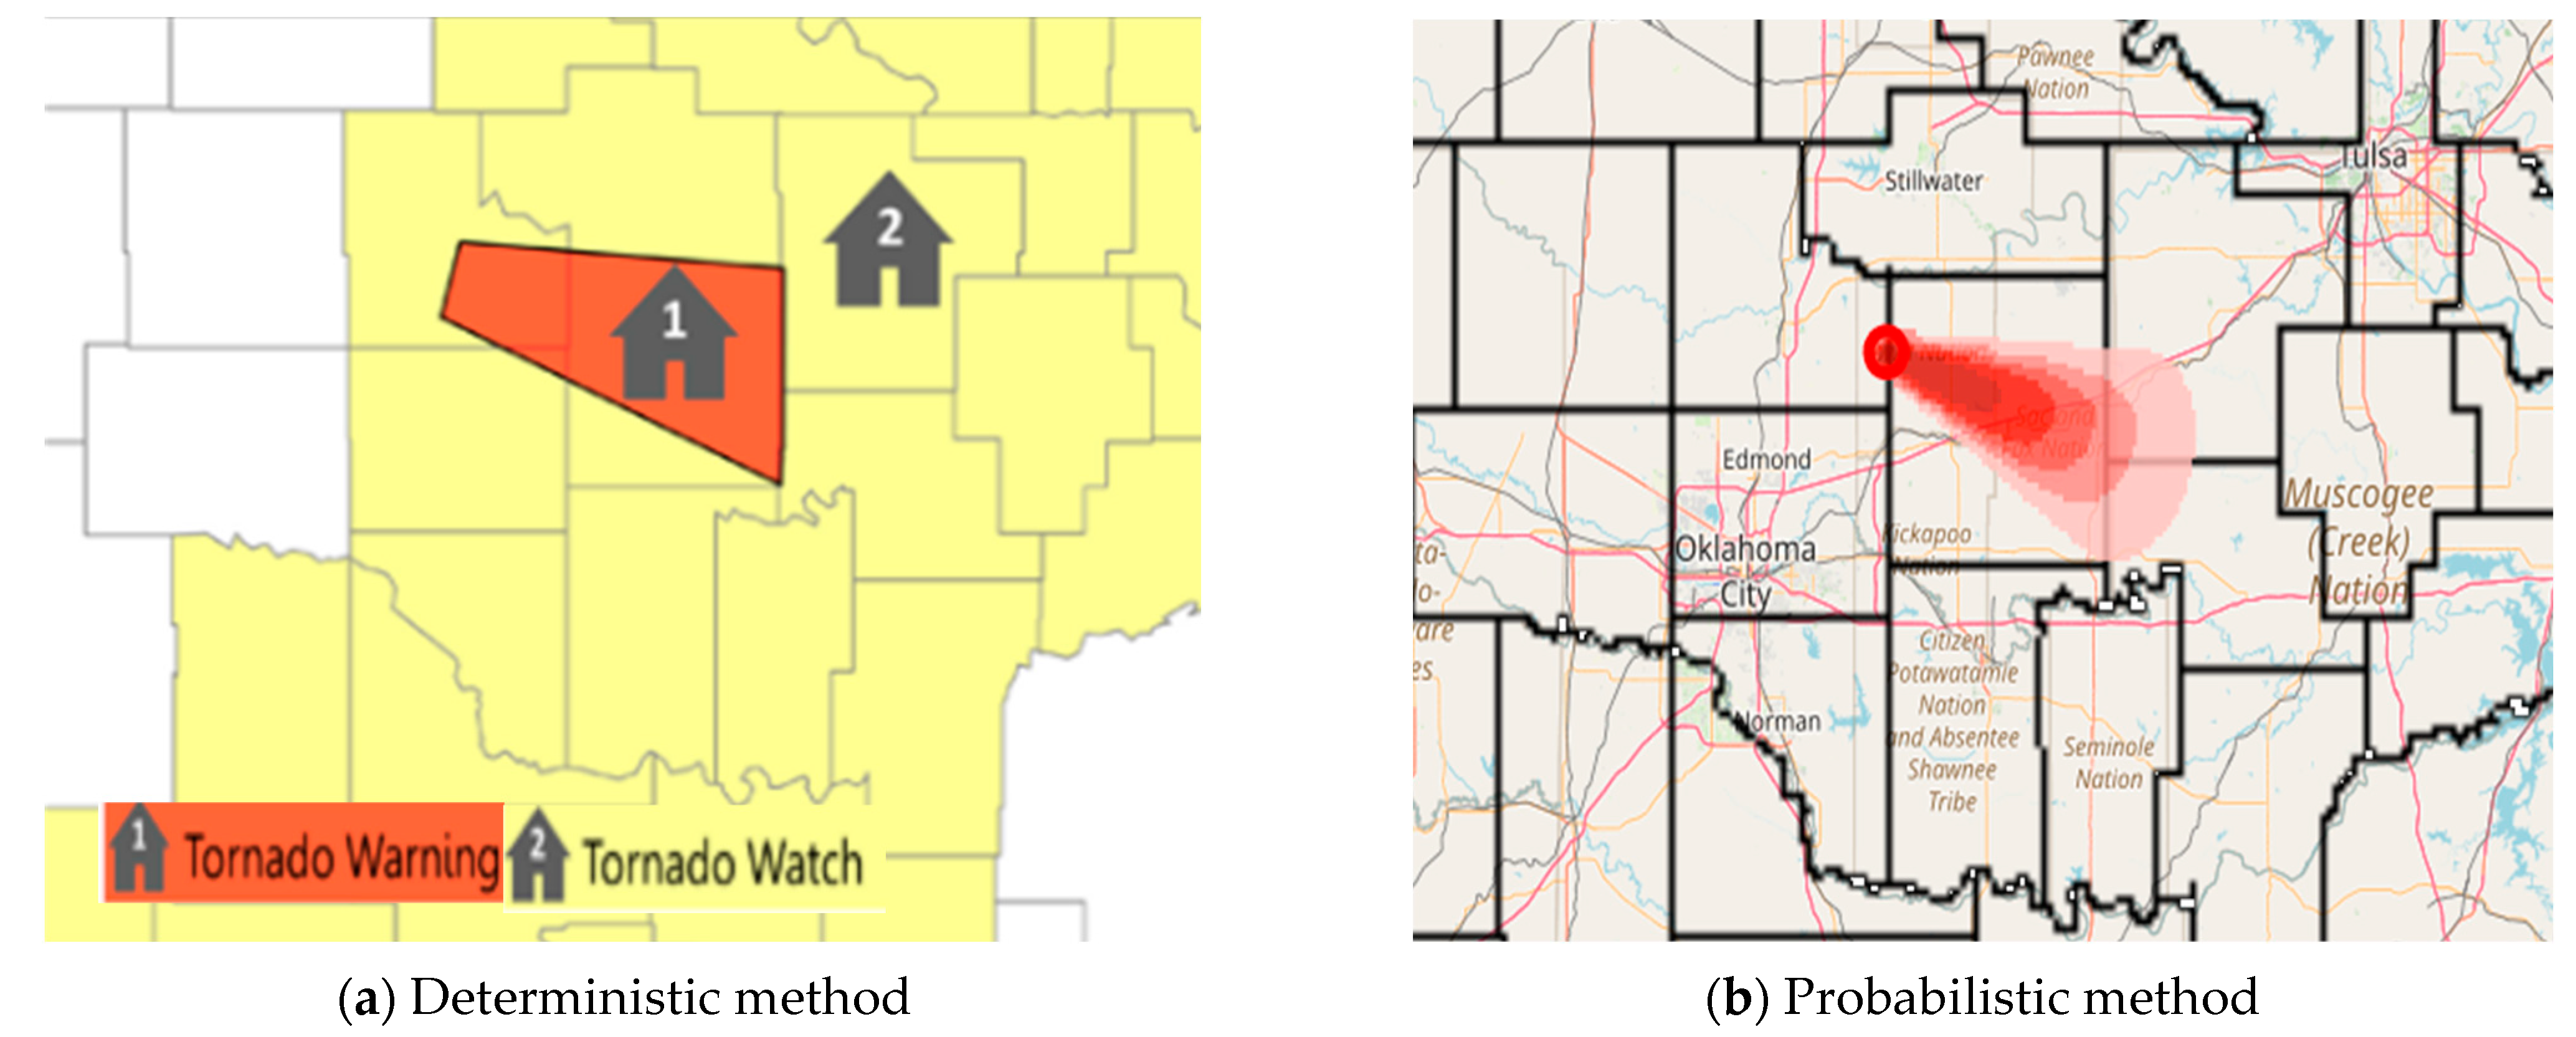
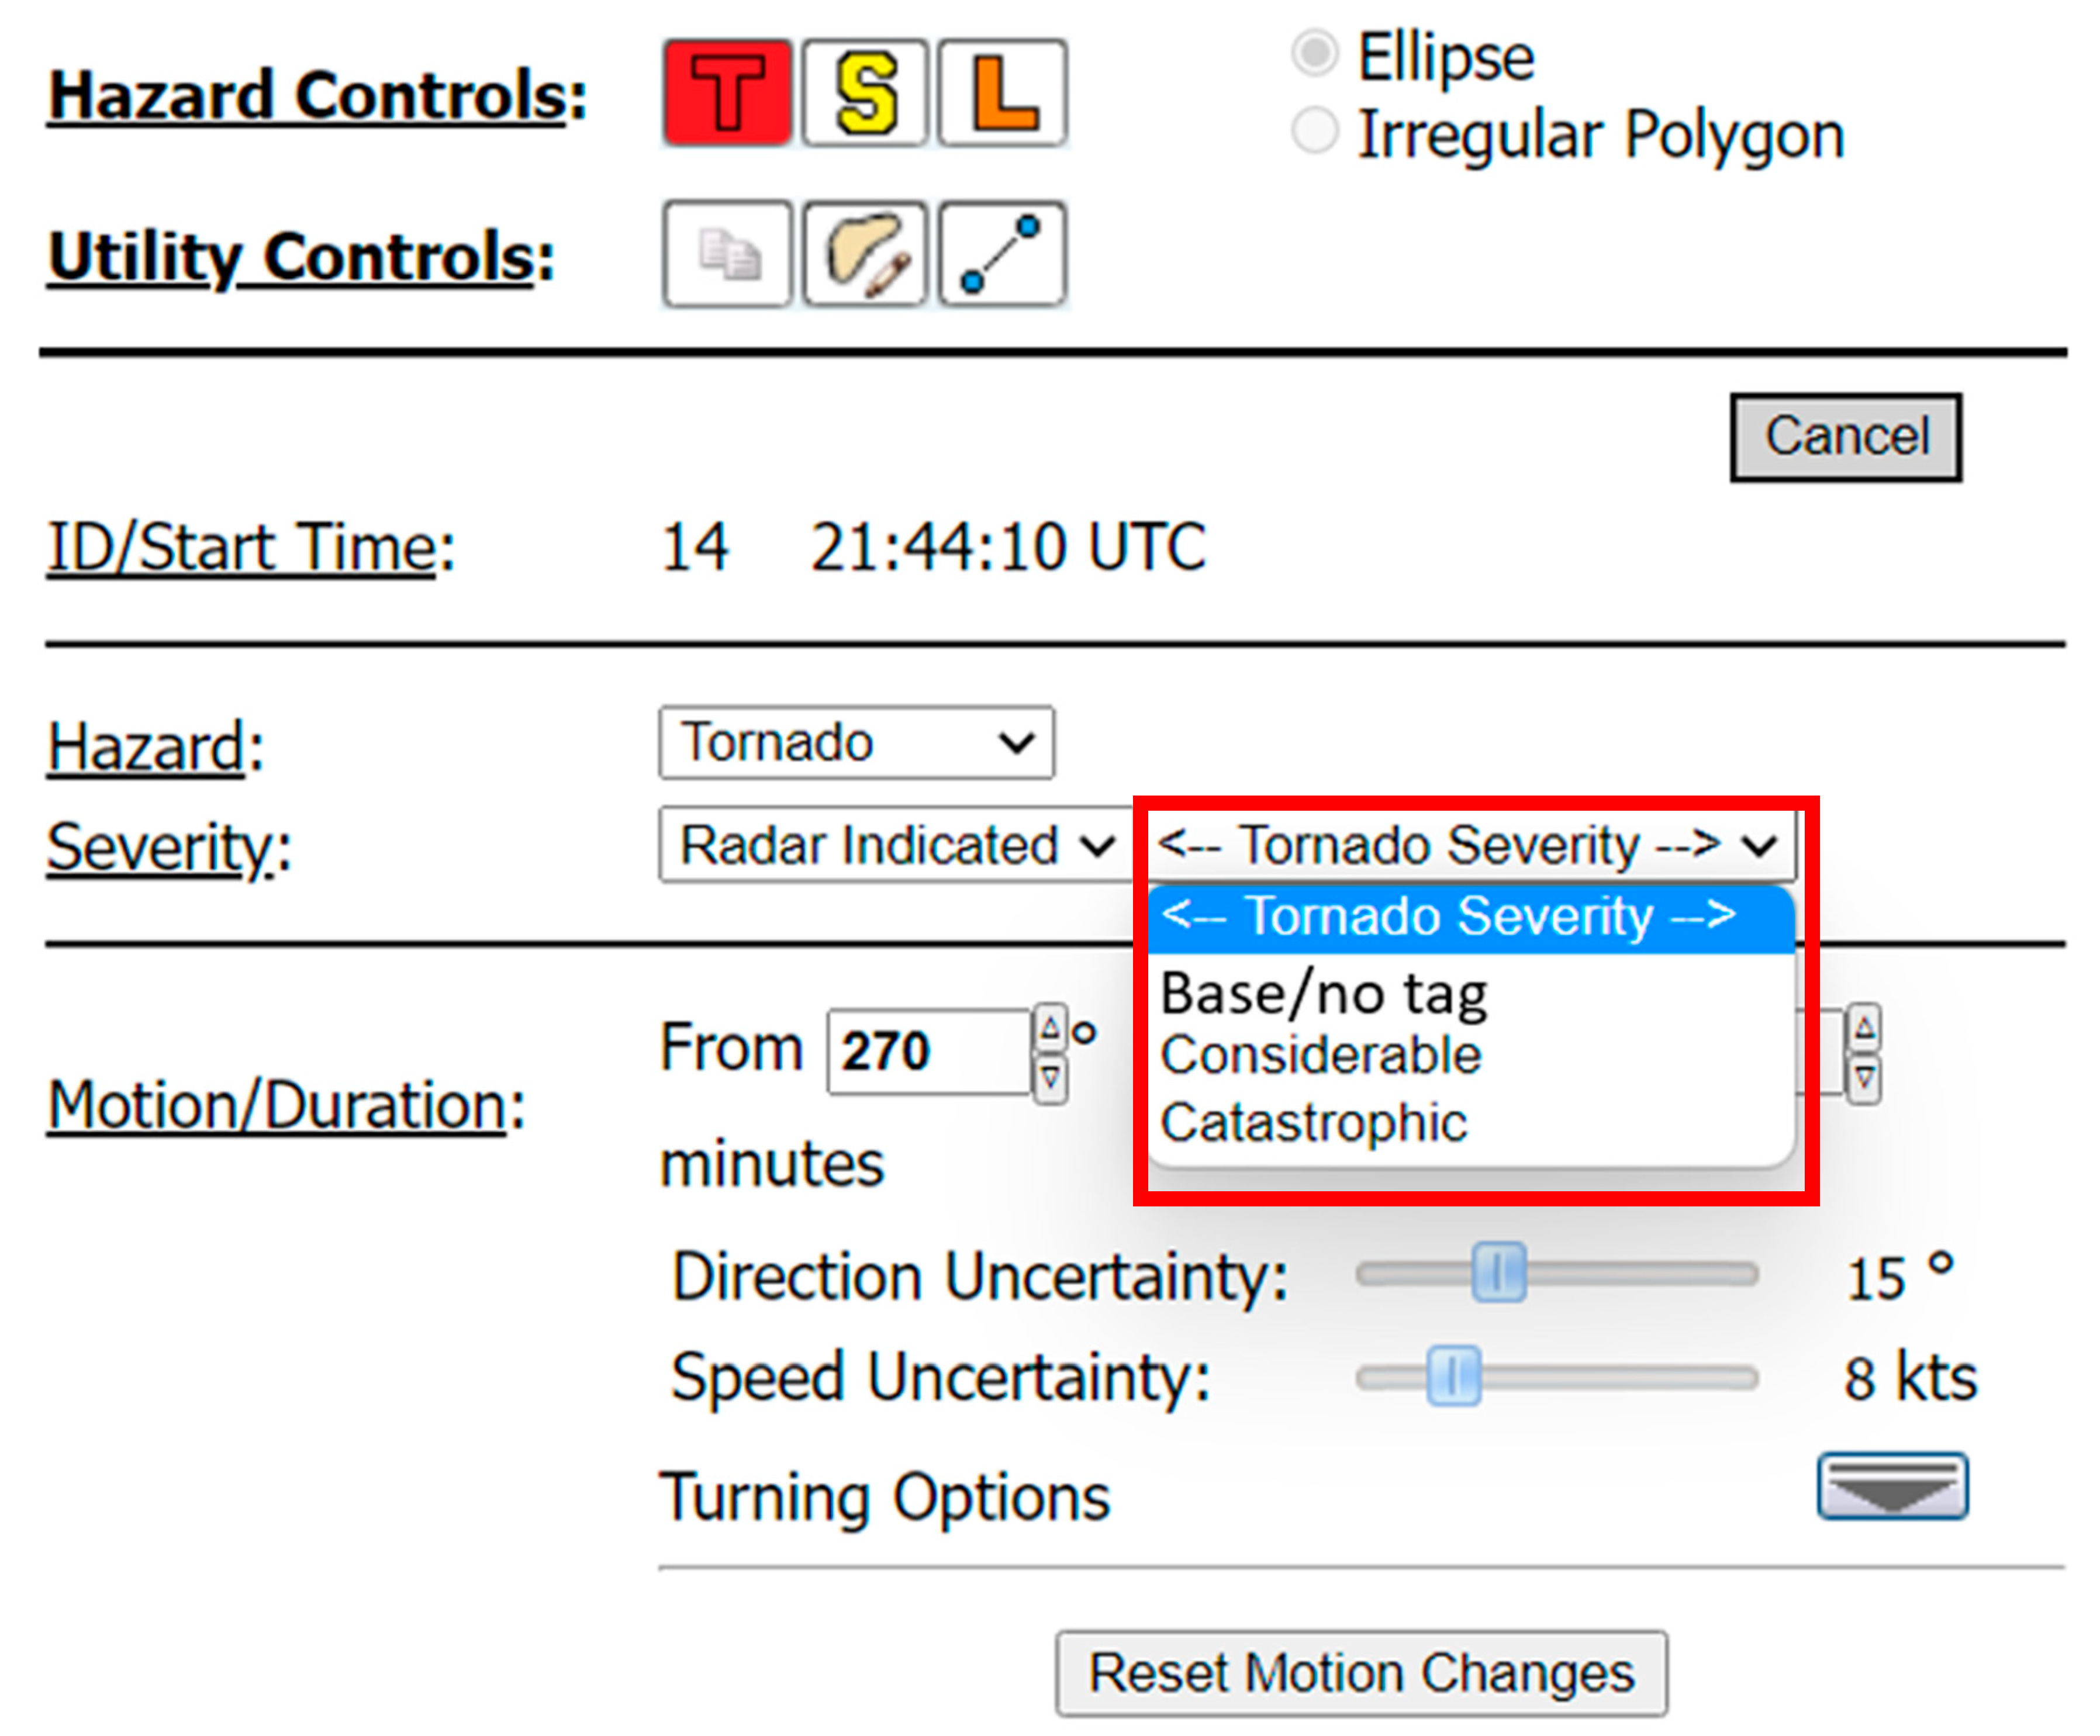
3.1. Probabilistic Hazard Information (PHI)

Storm-based PHI provides continuously updated probability of occurrence, potential impacts, and storm motion (which can be extrapolated to produce specific time-of-arrival and departure information for a location). Its attributes (geometry, duration, motion, and trend) can be modified at semi-regular intervals by forecasters (e.g., typically between 2 and 15 min) [20]. Currently, PHI also uses machine learning models to provide a first guess and to update the PHI probability, nominally set at 2 min intervals. One of these models, ProbSevere [48,49], is a storm-scale forecasting sub-system within the multi-radar multi-sensor (MRMS) system, providing storm-based probabilistic guidance to severe convective hazards using naïve Bayesian classifiers (Figure 3). For tornadoes, PHI uses guidance from the tornado probability algorithm by Sandmael et al., 2023 [50], a random-forest based model that provides the likelihood of tornado occurrence using multi-moment and polarimetric radar data. Once an initial polygon is created by either the guidance (fully automated) or forecasters, a probabilistic trend of severe weather threats, referred to as a PHI plume, is automatically generated by a Gaussian distribution function [23].
While tornado PHI plumes could be entirely automated with probabilities and storm motion derived from the machine learning processes, in practice they are currently only issued when created by NWS forecasters. Typically, the forecasters use the machine learning algorithms as a first guess and modify the attributes based on their storm interrogation and analysis (Karstens et al., 2018 [23]). For tornadoes, the PHI plumes are created within the Prototype PHI software. This software allows forecasters to modify multiple functions (motion/duration, guidance, trend interpolation) to create PHI plumes that are entirely automated, entirely manually drawn, or a combination of both (Figure 4). In addition to the probability, storm motion, and current location, forecasters are asked to provide impact-based details such as tornado intensity (base/no tag, considerable, or catastrophic) similar to the damage tags in current NWS tornado warnings, as discussed earlier [51,52] (Figure 5).

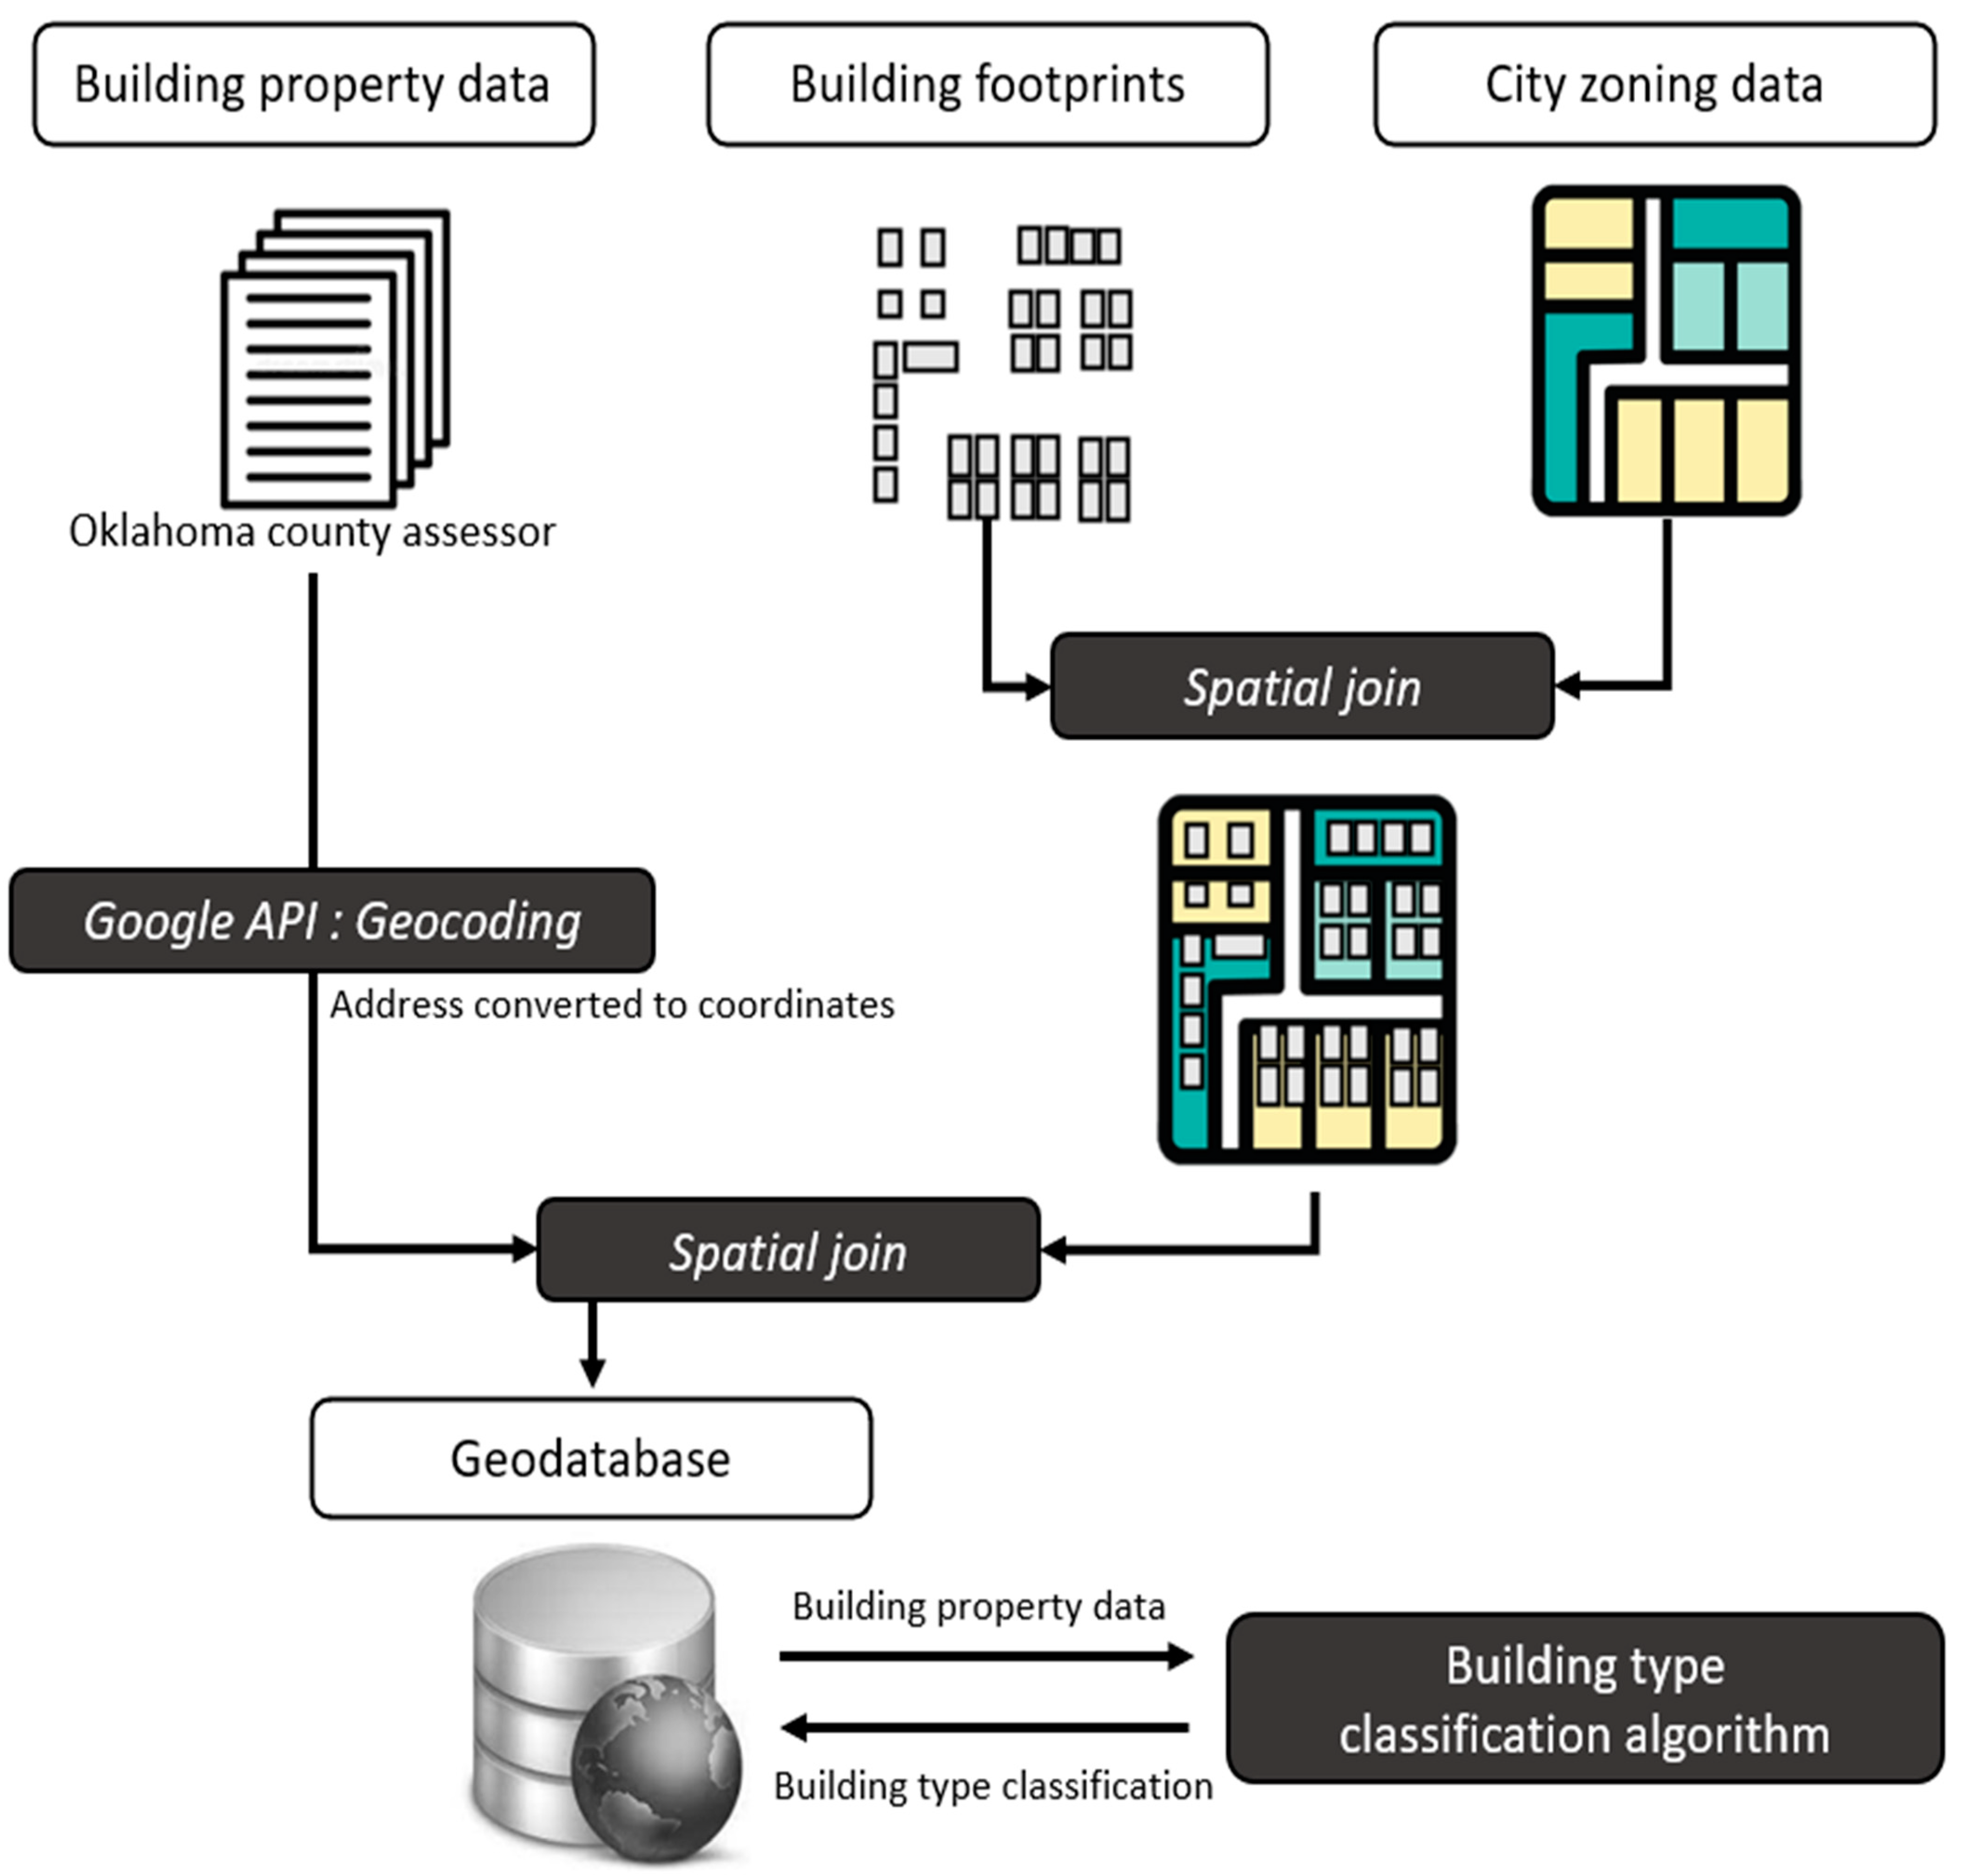
3.2. Building Geodatabase

A community asset can be defined as anything that can be used to improve the quality of community life [1]. It consists of multiple types of physical and non-physical objects such as buildings, networks, and services. These types of data/information can be represented as points, lines, or polygons in a geodatabase. A geodatabase is a data storage and data management framework for GIS, containing a collection of multiple geographic datasets, such as attribute data, geographic features, satellite and aerial images (raster data), 3D data, utility and transportation network systems, global positioning system (GPS) coordinates, etc. The main benefits of a geodatabase are (1) it offers centralized GIS data management as multiple spatial and tabular data formats that can be stored in the same geodatabase, which makes GIS data easy to manage and access; (2) geodatabases can accommodate large sets of features without tiles or other spatial partitions; and (3) it supports two-, three-, and four-dimensional vector features (x, y, z, and m values), true curves, and complex polylines. In the U.S., most emergency management agencies, and state and local municipal governments, utilize geodatabases to manage community assets, including critical infrastructure, and to share emergency information and data with the public.
In this study, we designed a geodatabase containing multiple types of residential, commercial, and industrial building data including locations, types, building footprints, etc. (Table 2). Specifically, for our case study, we include residential building property data from the Oklahoma county assessor’s office [53], city zoning data from Oklahoma City [54], and building footprints for the Oklahoma City area from Microsoft [55]. The Oklahoma county assessor data includes 152,792 records after removing properties with any missing data. Additionally, critical infrastructure geodata from FEMA, including hospitals, fire and police stations, and schools [56] are hosted in the database. The data fields include latitude, longitude, name, address, city, state, telephone, type, status, website, etc., and are detailed in Table 2.
To add geolocation data (latitude and longitude) to the residential property data from the Oklahoma county accessors, the Google geocoding API was applied to identify latitude and longitude for each building property (Figure 6). Following this, building footprints, zoning, and building property data were spatially joined in the database. Finally, the combined 139,296 geocoded buildings were added to the geodatabase. To apply building damage prediction functions in the next section, building properties in the geodatabase were classified into 28 categories defined by the Enhanced Fujita Scale (or EF-scale) damage indicators (Table 3). These damage indicators (DIs) include categories for residential, commercial, and professional buildings, other structures, and vegetation [57]. The finalized dataset has been processed to predict a DI for each building in Oklahoma metropolitan areas [58].
To enhance the level of community asset damage predictions in the future, detailed aspects of the various community assets are critical and need to be included. Property data from the city and county (e.g., assessor) provide specific information about residential properties. However, it is a cost- and time-consuming process to access and individually build data for each municipality. Kim et al. (2022) developed a random forest methodology to predict residential building types based on building footprints and city zoning data in Oklahoma [58]. The result of this study showed that building footprint and city zoning data can be applied to classify multiple building types with an accuracy of 96%. This has enabled us to acquire residential building type data in the Oklahoma metropolitan area. However, this approach may not be applicable for all commercial and industrial buildings. Thus, image-based machine learning methods [59,60] could also be necessary to analyze building types and provide data for a variety of locations and zones.

3.3. Building Damage Prediction Model

The building damage prediction model is designed to estimate building damages using data from PHI and the geodatabase. The basic functions are retrieved from damage indictors within the EF-scale (Wind Science and Engineering Center, 2006b) (Table 3). For each DI, information/data are provided as a description of typical construction, a series of degree of damages (DoDs), the lower and upper bound wind speed from the expert elicitation for each DI, and photos of DIs and DoDs. Thus, damages for 28 types of DIs can be estimated based on building structure type and wind speed. PHI provides data related to severe weather threats such as speed, direction, area (polygon), probability of occurrence, and damage impact tags. The building geodatabase provides building data (in the path of severe weather threats) to the building damage prediction model. Then, the model calculates the expected damage for each building unit using the data from PHI and the underlying geodatabase (Figure 7).
For current NWS tornado warnings, forecasters may add “considerable” and “catastrophic” impact tags representative of potential tornado damage. Smith et al., 2015 [61] link the maximum rotational velocity (vrot) from WSR-88D radar, nearly linearly, to tornado damage. Following these results, the NWS Radar and Applications Course training [62] was updated to recommend using maximum vrot thresholds (vrot ≥ 40–50 kt for considerable; vrot ≥ 70 kt for catastrophic) when determining which impact-based tag to add, if any, during warning issuance (see Figure 1 of Bentley et al., 2021 [63] for details on this guidance). For this current study, thresholds were determined using Smith et al., 2020 [64] to match potential building DIs to vrot. Following Smith et al., 2020a [64] and Smith et al., 2020b [65], we use the most likely range of wind speeds (approximately the 10th and 90th percentile for a given Vrot value from Figures 9 and 10 of Smith et al., 2020b [65]) to match the impact tags to DI wind speeds (see Table 4).
For example, for a PHI polygon with a “considerable” tag (40 kt ≤ vrot < 70 kt), the estimated wind speed is likely to be between 75 and 145 mph (Figures 9 and 10 of Smith et al., 2020b [65]). If a one- and two-family residential building is within the PHI tornado threat area, the degree of damage for the building can be estimated to be between 4 and 6. Linking this to a specific DI of 5 (the entire house shifts off the foundation; Figure 8) provides a moderate estimate of potential damage due to the tornado. For our wider application, the degree of damage within this study is estimated based on the corresponding impact tags provided within PHI by forecasters, where DIs of 4–6 ideally correspond to “considerable” tags and DIs of 7–10 correspond to “catastrophic”. Ongoing research using machine learning models may be able to provide more specific guidance to forecasters on this tag selection and increase the precise correspondence to actual damage.

4. Prototype Case Study

We conducted two types of hypothetical case studies in the Oklahoma City metropolitan area to demonstrate expected outputs from the proposed framework: (1) critical infrastructure damage assessment at a single time, and (2) accumulated PHI and predicted potential building damages over an entire event. Impact-based tags and the associated wind speed were assigned based on the statistical model simulating tornado potential and wind speed (e.g., Cohen et al., 2018 [69]).

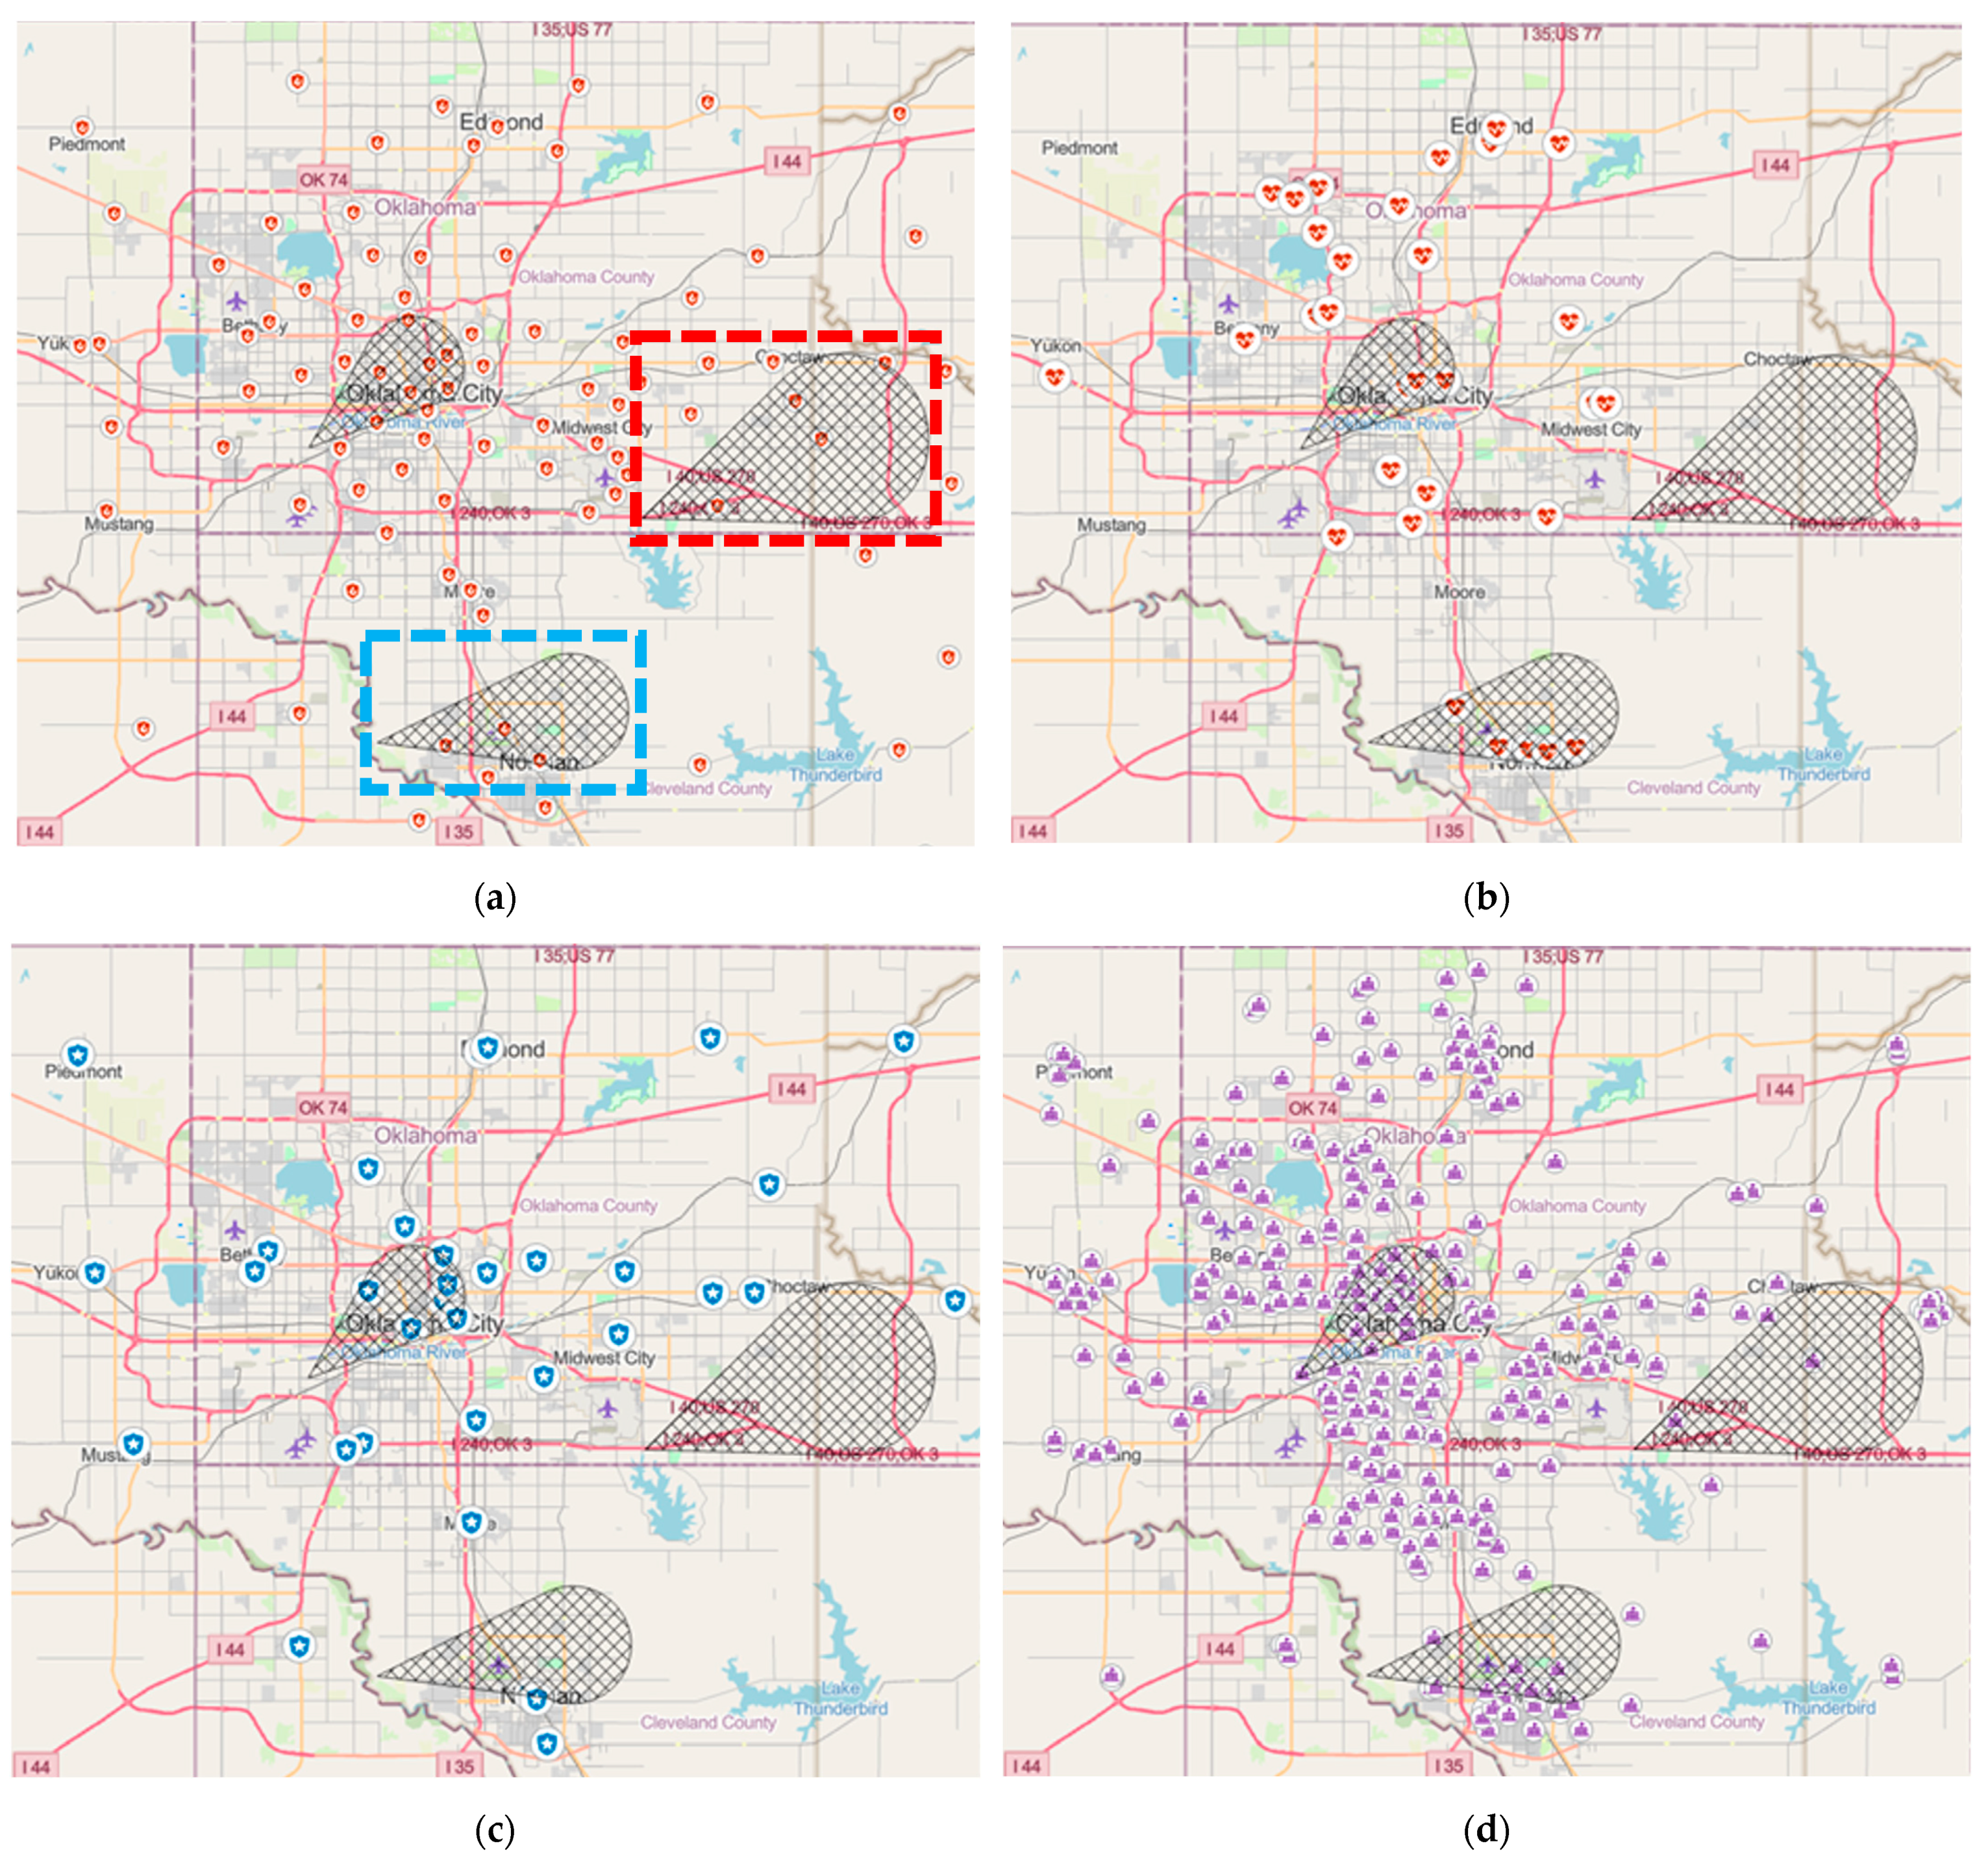
4.1. Case Study 1: Critical Infrastructure Damage Assessment

Three types of PHI plumes were created in/near the Oklahoma City metropolitan area with different wind speeds corresponding to the variable impact tags provided by forecasters when creating PHI (Figure 9). Note that “base/no tag” corresponds to 60–110 mph; “considerable”: 75–145 mph, and “catastrophic”: 95–205 mph, from adaptation of the NWS training recommendations and the corresponding 10th and 90th percentile wind estimates of Smith et al., [65] (Table 4).
Given the hypothetical PHI plumes above, the number of affected critical infrastructure (fire station, hospital, police station, and school) and the DoDs based on the range of wind speed and building types were estimated (Figure 10). We assigned (1) DI-20 for fire station, hospital, and police station; (2) DI-15 for elementary school; and (3) DI-16 for middle and high school. In this scenario, 29 schools, 13 fire stations, 10 hospitals, and 8 police stations could be affected; their degree of damage varies by DI and wind speed. A range of potential building damages (i.e., DoD) for each critical infrastructure is described in Table 5.
Most affected types of critical infrastructures are hospitals and schools in the south side of the Oklahoma City metropolitan area under the PHI with the “catastrophic” impact tag: Five hospitals and nine schools are estimated to have severe building damages (DoD 6–11). The total number of affected patient beds is 808 and the total number of students is 6034 (data was retrieved from Oklahoma state department of health [66] and National Center for Education Statistics [67]). Under the PHI with the “considerable” impact tag, only a few critical infrastructures including 4 fire stations and 3 schools are expected to have moderate building damages (DoD 3–8). The highest number of critical infrastructures are under the PHI with “base/no tag” and their DoDs are between 1–4.
Additionally, the spatial probability of a tornado occurrence within the PHI plume enables the estimation of risk probability (a conditional probability of how likely a severe weather event is to occur at that specific location) for each building (Figure 11). The risk probability supports rapid risk assessment in communities or regions and enables decision makers to prioritize in planning and mitigation strategies. For example, while potential DoDs for two fire stations (with red circles) are three, their probability of tornado occurrence (derived from PHI plume) is 50% and 20% for each. Given limited resources, these estimates could be key parameters in decision making to estimate non-serviceable areas (due to malfunction of fire stations) and to distribute critical resources to affected areas.

4.2. Case Study 2: Predicted Potential Building Damages under Accumulated PHI

When severe storms move across the city an accumulated PHI plume can represent the conditional risk for an event (Figure 12). This enables the estimation of the number of building properties at risk across the entire event, given a tornado. We estimated potential building damages for an event under two different tornado damage impact-based warning tags”: (1) the more common “base/no tag”, and (2) a worst-case scenario “catastrophic”. In this event, the total number of building properties under the path of the accumulated PHI plume (t0–t6) is 49,572.
As a PHI plume provides live probabilistic hazard grids that update as the storm moves, users can identify building properties with the highest risk of damage and how that evolves during an event. Figure 13 highlights the number of building properties within different ranges of risk probability for the entire event. For the analysis, we consider the most-likely areas of damage (probability of tornado occurrence over 80%) and the DoDs. Then, compared the results of two potential strength tornadoes scenarios: the more typical “base/no tag”, the worst-case scenario of “catastrophic” damage.
During this event, 15,870 out of 49,571 building properties are within >80% probability of occurrence of a tornado (Figure 13). Of these 15,870 building properties, the number of buildings at different estimated DoD levels in the case where the tornado is “base/no tag” (max wind speed is less than 80 mph) is 9358 (no damage), 5366 (DoD = 1), 925 (DoD = 2), 186 (DoD = 3), 29 (DoD = 4), 5 (DoD = 5), and 1 (DoD = 6) (Figure 14). When we classify DoD = 1 and 2 as minor damages, there are 221 building properties that could be severely damaged under this scenario. The majority of these severely damaged buildings are manufactured homes (single and double wide) with damage descriptions such as “Unit rolls on its side or upside down; remains essentially intact”, “Uplift of roof deck and loss of significant roof covering material”, or “Destruction of roof and walls leaving floor and undercarriage in place”.
For the same set of 15,870 buildings in the case where the tornado is “catastrophic” (max wind speed is less than 140 mph), the number of buildings at different estimated DoD levels are 758 (DoD = 2), 2014 (DoD = 3), 3304 (DoD = 4), 3809 (DoD = 5), 3188 (DoD = 6), 1967 (DoD = 7), 672 (DoD = 8), and 158 (DoD = 9). The number of buildings that may be considered as severely damaged are15,112 in this worst-case scenario (compared to the 221 building properties in the “base/no tag” scenario). In this case, manufactured homes (single and double width) could be destroyed with damage descriptions such as “Undercarriage separates from unit; rolls, tumbles, and is badly bent”, “Complete destruction of unit; debris blown away”. Additionally, most one- and two-family residences could be severely damaged with “Most walls collapsed, except small interior rooms” or “all walls collapsed”.

5. Discussion

Community impact assessment based on a combination of local vulnerability and hazard type, can provide an invaluable role in emergency planning, operations, and decision-making. Specifically, it can provide a basis for more integrated problem solving by identifying the more vulnerable buildings, blocks, or systems. FEMA (2013) highlighted the importance of identifying natural hazard disaster risks and vulnerabilities to (1) develop effective hazard mitigation planning, and (2) minimize the impact of disasters [70,71]. Recent studies have used probability to address similar impact assessments of flooding based on local hazard risk due to anthropogenic modifications [72,73]. These studies emphasize the positive impact of additional information for decision-making under uncertainty. Similarly, Ripberger et al., (2022) note that with this proper contextual information, probabilistic guidance generally improves decision making [74].
Currently, most people infer some type of uncertainty into deterministic forecasts (such as weather warnings in the United States) [75]. Due to this inherent uncertainty, individuals go searching for additional information to provide both context and confirmation of the risk of warnings [76,77]. The framework proposed in this study provides a method to supply context by assessing potential impacts within a given PHI plume or subsequent tornado warning. This additional context could be useful for both decision-makers responsible for infrastructure as well as individuals determining when and where to take shelter, as not all end-users have the same thresholds for taking actions [78].
In contrast to the existing tornado watch and warning alerts/information, which includes potential exposure at a macro level such as a possibly affected population and damages on critical infrastructure (schools, hospitals), the outcomes of this study can assess the community impacts at a micro level (i.e., building property/unit level) by leveraging PHI data and the geodatabase. More vulnerable blocks/areas or critical infrastructure in a community, predicted from this study, can be used in the assessment step of the mitigation planning process, which is the foundation of a short- and long-term strategy to reduce disaster loss and break the cycle of disaster damage, reconstruction, and repeated damage. Additionally, multiple types of scenarios can be applied to support tabletop and full-scale exercises for organizations, teams, or personnel. Such assessments may be able to reveal strengths and weaknesses in existing mitigation strategies such as plans, protocols, logistics, and equipment. Finally, the outputs of this study can be utilized to increase severe weather awareness and promote emergency preparedness for the public.
In case study 1, we demonstrated the expected DoD for different components of critical infrastructure. In this case, the geodatabase also enables decision-makers to analyze (1) the number of beds (to estimate the number of patients to be transported) for each hospital; (2) the number of students and teachers in schools; (3) shelter accessibility/availability in schools; and (4) vulnerable areas/blocks when fire stations or police offices are compromised. In case study 2, two different tornado scenarios, “base/no tag” and “catastrophic”, were conducted to examine the most likely and worst-case scenario numbers of building properties at risk. In the “base/no tag” tornado scenario, we are able to filter out 33,702 buildings under low risk (lower probability of occurrence and DoDs) out of 49,571 building properties under the path of a simulated PHI plume (Figure 13). As shown in Figure 14, only 221 out of 49,571 building properties, 0.4% of the total number of buildings, are under high risk of physical damage (DoD ≥3) in this scenario; however, these are the most vulnerable building types (such as manufactured homes). In the “catastrophic” tornado scenario, 15,112 building properties (95.2% of the total number of buildings) were at risk of severe damage. This shows that the community can have 68 times more building damages under the “catastrophic” tornado scenario compared to the “base/no tag” tornado scenario.
These types of enhanced community impact predictions can be shared with an existing communication pipeline such as NWSchat. Developed as an instant message/chat and utilized by NWS personnel to share critical warning decision expertise and other types of significant weather information; this information is shared in real-time with emergency agencies and media [79,80,81]. Shared information/data could also support emergency management agencies and other authorities in prioritizing their emergency and follow-up actions more effectively (e.g., debris removal operations, emergency medical and food services) and could help the public be well-prepared for hazards. For example, the output of this study (the number of damaged buildings and locations) can be used to estimate the required resources (e.g., loaders, hauling trucks, and capacity of temporary debris removal sites) for debris removal (e.g., Kim et al., 2018 [82]). Additionally, the results of damage assessment can be used to assess the ramifications of the loss of critical infrastructure. In the most likely case (wind speed under 80-mph), the majority of hospitals may have no, or minor, physical damages such as “Threshold of visible damage (DoD = 1)” or “Loss of roof covering (<20%) (DoD = 2)”. However, they could have severe damages under the “catastrophic” tornado case such as “Uplift of pre-case concrete roof slabs” or “Uplift of metal deck with concrete fill slab”. In this case, neighboring hospitals (which were not in the path of the tornado) could face a markedly increased volume of incoming patients from hospitals and other areas damaged by the tornado. In case study 2, six hospitals were under the accumulated PHI plumes and the total estimated number of beds was 1946. This type of data may support neighboring hospitals in anticipating patient surge and developing surge capacity strategies for each tornado intensity and associated expected severity of building damages (e.g., [83,84,85]).
Additional improvements can be made to the proposed framework. While the EF-scale provides means to measure possible damages of multiple types of community assets, the damage indicators are limited to 28 categories, including 23 buildings, electrical transmission lines, free-standing towers, free-standing light poles, and soft- and hard-wood trees. However, a few types of buildings may not be classified into one of the EF-scale damage indicators. For example, Apartments, Townhouses, and Condos (DI 3) are supposed to be limited to three stories or less in the EF-scale, but some building types —apartment, condo, or townhouse—are four stories or have an exterior type other than solid masonry. Furthermore, the building damage estimation method retrieved from EF-scale has a wide range of upper and lower bounds. For instance, the degree of damage for manufactured homes against 100 mph wind can range from unit slides off block piers but remains upright (DoD = 3) to unit rolls or vaults; roof and walls separate from floor and undercarriage (DoD = 7). Therefore, wind simulation-based building damage data/methods need to be integrated into the proposed framework so it can be enhanced to predict damages on a wide range of community assets and not be limited to certain assets provided from the EF-scale. Additionally, the framework would benefit from expanded analysis and output that could be refined into products that effectively assist in decision-making, such as added distributions of damage estimate information corresponding to the ranges of estimated wind speeds from hazards. Finally, there can be indirect damages caused by flying or wind-born debris coming from tornado-affected community assets such as roof gravel, roof tiles, framing members, etc. [86,87,88]. This debris may penetrate the building and threaten human life and property during tornado events. These types of indirect impacts from tornadoes need to be integrated into community risk models so they can be communicated to parts of the community that are most at risk.
Community asset and building type identifications are keys to enhancing building damage estimates. While our study employed building datasets from the Oklahoma county assessor, this approach can be limited when acquiring data for each county. Recently, studies have used a real estate database (e.g., Zillow ZTRAX) to understand the characteristics of community building properties such as floods [89,90] and fires [91]. Future use of similar datasets that include detailed descriptions of buildings, such as size, structure, exterior types, and building images, could be used in combination with machine learning methods to better provide damage indicators.

6. Summary and Conclusions

Community assets, including physical structures, critical infrastructure, services, and networks, play a key role in providing essential services for the community’s quality of life, economy, and public health. Around 90% of declared disasters in the U.S. have been caused by severe weather phenomena such as tornadoes, hurricanes, storms, and floods [2].
State and local governments, emergency management agencies, and weather forecasting offices make an effort to share up-to-date weather information with communities so they can minimize inevitable physical or cascading impacts on a community from severe weather threats [92,93,94,95]. In the past, the means of short-term severe weather information were often limited to deterministic forecasting such as weather warnings. However, multiple studies have shown that both key decision-makers (such as emergency managers) and individual members of the public can make use of uncertainty information to make better quality decisions when contextual data is provided. Unfortunately, existing platforms for emergency decision-making are limited in their ability to deliver the dynamics of severe weather threats and accurate levels of risks (that may change every minute or hour) and are currently often supplemented by other communication channels such as NWSchat. Thus, there are limitations in the prediction of community impacts from severe weather threats under the existing weather forecasting systems. While existing community risk management systems such as FEMAs Hazus-MH are designed to predict community risks from hurricanes, floods, and earthquakes, their prediction is based on county-level census data, except for critical infrastructure. Therefore, they may be (1) limited in their leverage of the benefits of improved storm-based weather forecasting systems (e.g., PHI and/or Warn-on-Forecast) and longer lead times, (2) unsuitable for smaller-scale severe weather threats such as tornadoes and hail, and (3) unable to provide practical information or data at an operational level during emergency response and recovery.
To overcome the bottlenecks of current severe weather forecasting systems and community risk management systems, prototype Probabilistic Hazard Information (PHI) from the NOAA Forecasting a Continuum of Environmental Threats (FACETs) program provides the future of weather forecasting and severe weather warning/watch systems. Beginning from deterministic watch-warning products to high resolution and probabilistic information of risks, to a community from severe weather threats [22]; this system is designed to deliver detailed information/probability of severe weather threats in real-time to communities. To leverage the benefits of PHI and better understand the real-time vulnerability of locality, this study proposes a holistic framework to predict community risks from severe weather threats. This framework is designed to integrate PHI information/data with a geodatabase of community assets to predict physical damage to each building property. Compared to existing community damage assessment models including FEMA HAZUS-MH, the proposed model is designed to reflect the uncertainty of severe weather threats as well as predict building damage on a micro level (i.e., possible damage for each building unit). It would be able to provide more practical risk assessment data/estimates to emergency agencies and the public for rapid disaster planning and responses. However, the benefits of this model could be limited until we expand the geodatabase to additional communities and identify a more accurate wind speed for each building block.
Future research is needed to adequately model building structures for different regions, as building codes and construction practices can vary greatly across communities. However, with further refinement/verification using NWS damage survey data and the NOAA damage assessment toolkit, this information may be able to support decision-makers in (1) live prediction of risks to community assets, and (2) provision of detailed damage assessments for an entire event, such as degree of damage of systems or assets, and affected areas, to emergency agencies, infrastructure managers, and the public.

Author Contributions

Conceptualization, J.K.; methodology, J.K.; validation, J.K.; formal analysis, J.K. and P.A.C.; investigation, J.K., P.A.C. and K.C.; data curation, J.K. and P.A.C.; writing—original draft preparation, J.K., P.A.C. and K.C.; writing—review and editing, J.K., P.A.C. and K.C.; visualization, J.K. and P.A.C.; supervision, P.A.C. and K.C.; project administration, J.K., P.A.C.; funding acquisition, P.A.C. and K.C. All authors have read and agreed to the published version of the manuscript.

Funding

This research was funded by the National Oceanic and Atmospheric Administration (NOAA) Office of Oceanic and Atmospheric Research (OAR) and the Office of Weather and Air Quality (OWAQ) Federal Grant Number: NA18OAR4590386—Implementing convective storm statistics from a large reanalysis of WSR-88D data for model verification and forecasting probabilistic uncertainty and under the NOAA-University of Oklahoma Cooperative Agreement #NA21OAR4320204. We thank the reviewers of this manuscript for their constructive feedback.

Institutional Review Board Statement

Not applicable.

Informed Consent Statement

Not applicable.

Data Availability Statement

The following datasets are available from the author (joohoya@gmail.com) upon reasonable request (building footprint, city zoning and building property data).

Conflicts of Interest

The authors declare no conflict of interest.

References

  1. Green, G.P.; Haines, A. Asset Building & Community Development; SAGE Publications, Inc.: Thousand Oaks, CA, USA, 2016; ISBN 9781483344034. [Google Scholar]
  2. FEMA. Declared Disasters. Available online: https://www.fema.gov/disaster/declarations (accessed on 28 February 2022).
  3. NOAA NCEI, U.S. Billion-Dollar Weather and Climate Disasters. Available online: https://www.ncdc.noaa.gov/billions/ (accessed on 2 February 2022).
  4. Jones, J.M. Extreme Weather Has Affected One in Three Americans. Available online: https://news.gallup.com/poll/391508/extreme-weather-affected-one-three-americans.aspx (accessed on 11 April 2022).
  5. Strader, S.M.; Ashley, W.S.; Haberlie, A.M.; Kaminski, K. Revisiting U.S. Nocturnal Tornado Vulnerability and Its Influence on Tornado Impacts. Weather Clim. Soc. 2022, 14, 1147–1163. [Google Scholar] [CrossRef]
  6. Ashley, W.S. Spatial and Temporal Analysis of Tornado Fatalities in the United States: 1880–2005. Weather 2007, 22, 1214–1228. [Google Scholar] [CrossRef]
  7. Sutter, D.; Simmons, K.M. Tornado Fatalities and Mobile Homes in the United States. Nat. Hazards 2010, 53, 125–137. [Google Scholar] [CrossRef]
  8. Strader, S.M.; Ashley, W.S. Finescale Assessment of Mobile Home Tornado Vulnerability in the Central and Southeast United States. Weather Clim. Soc. 2018, 10, 797–812. [Google Scholar] [CrossRef]
  9. Lapietra, I.; Rizzo, A.; Colacicco, R.; Dellino, P.; Capolongo, D. Evaluation of Social Vulnerability to Flood Hazard in Basilicata Region (Southern Italy). Water 2023, 15, 1175. [Google Scholar] [CrossRef]
  10. WMO. Atlas of Mortality and Economic Losses From Weather, Climate and Water Extremes (1970–2019); World Meteorological Organization (WMO): Geneva, Switzerland, 2019; ISBN 9789263112675. [Google Scholar]
  11. Stürmer, J.M.; Plietzsch, A.; Anvari, M. The Risk of Cascading Failures in Electrical Grids Triggered by Extreme Weather Events. arXiv 2021, arXiv:2107.00829. [Google Scholar]
  12. Lawrence, J.; Blackett, P.; Cradock-Henry, N.A. Cascading Climate Change Impacts and Implications. Clim. Risk Manag. 2020, 29, 100234. [Google Scholar] [CrossRef]
  13. NWS. Midwest Derecho, 10 August 2020. Available online: https://storymaps.arcgis.com/stories/f98352e2153b4865b99ba53b86021b65 (accessed on 30 August 2022).
  14. Linn County Emergency Management. Derecho After Action Report August 2020; Linn County Emergency Management: Cedar Rapids, IA, USA, 2020. [Google Scholar]
  15. CISA. Communications Dependencies Case Study: 2020 Midwest Derecho; Federal Communications Commission: Washington, DC, USA, 2022. [Google Scholar]
  16. PowerOutage.US. Major Power Outage Events. Available online: https://poweroutage.us/about/majorevents (accessed on 26 August 2022).
  17. Little, R.G. Controlling Cascading Failure: Interconnected Infrastructures. J. Urban Technol. 2002, 9, 109–123. [Google Scholar] [CrossRef]
  18. NRC. Completing the Forecast: Characterizing and Communicating Uncertainty for Better Decisions Using Weather and Climate Forecasts; National Academies Press: Washington, DC, USA, 2006; ISBN 978-0-309-10255-1. [Google Scholar]
  19. Campbell, R.; Beardsley, D.; Tokar, S. Impact-Based Forecasting and Warning: Weather Ready Nations | World Meteorological Organization. Available online: https://public.wmo.int/en/resources/bulletin/impact-based-forecasting-and-warning-weather-ready-nations (accessed on 28 February 2022).
  20. Stumpf, G.J.; Gerard, A.E. National Weather Service Severe Weather Warnings as Threats-in-Motion. Weather Forecast 2021, 36, 627–643. [Google Scholar] [CrossRef]
  21. Brooks, H.E.; Correia, J. Long-Term Performance Metrics for National Weather Service Tornado Warnings. Weather 2018, 33, 1501–1511. [Google Scholar] [CrossRef]
  22. Rothfusz, L.P.; Schneider, R.; Novak, D.; Klockow-McClain, K.; Gerard, A.E.; Karstens, C.; Stumpf, G.J.; Smith, T.M. FACETs: A Proposed Next-Generation Paradigm for High-Impact Weather Forecasting. Bull. Am. Meteorol. Soc. 2018, 99, 2025–2043. [Google Scholar] [CrossRef]
  23. Karstens, C.D.; Correia, J.; LaDue, D.S.; Wolfe, J.; Meyer, T.C.; Harrison, D.R.; Cintineo, J.L.; Calhoun, K.M.; Smith, T.M.; Gerard, A.E.; et al. Development of a Human-Machine Mix for Forecasting Severe Convective Events. Weather 2018, 33, 715–737. [Google Scholar] [CrossRef]
  24. Karstens, C.D.; Stumpf, G.; Ling, C.; Hua, L.; Kingfield, D.; Smith, T.M.; Correia, J.; Calhoun, K.; Ortega, K.; Melick, C.; et al. Evaluation of a Probabilistic Forecasting Methodology for Severe Convective Weather in the 2014 Hazardous Weather Testbed. Weather 2015, 30, 1551–1570. [Google Scholar] [CrossRef]
  25. Shivers-Williams, C.A.; Klockow-McClain, K.E. Geographic Scale and Probabilistic Forecasts: A Trade-off for Protective Decisions? Nat. Hazards 2021, 105, 2283–2306. [Google Scholar] [CrossRef]
  26. Klockow-McClain, K.E.; McPherson, R.A.; Thomas, R.P. Cartographic Design for Improved Decision Making: Trade-Offs in Uncertainty Visualization for Tornado Threats. Ann. Am. Assoc. Geogr. 2019, 110, 314–333. [Google Scholar] [CrossRef]
  27. FEMA. Preliminary Damage Assessment Guide; FEMA: Washington, DC, USA, 2021. [Google Scholar]
  28. Burgess, D.; Ortega, K.; Stumpf, G.; Garfield, G.; Karstens, C.; Meyer, T.; Smith, B.; Speheger, D.; Ladue, J.; Smith, R.; et al. 20 May 2013 Moore, Oklahoma, Tornado: Damage Survey and Analysis. Weather 2014, 29, 1229–1237. [Google Scholar] [CrossRef]
  29. Yuan, M.; Dickens-Micozzi, M.; Magsig, M.A. Analysis of Tornado Damage Tracks from the 3 May Tornado Outbreak Using Multispectral Satellite Imagery. Weather 2002, 17, 382–398. [Google Scholar] [CrossRef]
  30. Wagner, M.; Doe, R.K.; Johnson, A.; Chen, Z.; Das, J.; Cerveny, R.S. Unpiloted Aerial Systems (UASS) Application for Tornado Damage Surveys Benefits and Procedures. Bull. Am. Meteorol. Soc. 2019, 100, 2405–2409. [Google Scholar] [CrossRef]
  31. Lombardo, F.; Meidani, H. Use of Citizen Science and Social Media to Improve Wind Hazard and Damage Characterization. In Proceedings of the AGUFM, American Geophysical Union (AGU), Fall Meeting, New Orleans, LA, USA, 11–15 December 2017. [Google Scholar]
  32. Zingaro, M.; La Salandra, M.; Capolongo, D. New Perspectives of Earth Surface Remote Detection for Hydro-Geomorphological Monitoring of Rivers. Sustainability 2022, 14, 14093. [Google Scholar] [CrossRef]
  33. Radhika, S.; Tamura, Y.; Matsui, M. Use of Post-Storm Images for Automated Tornado-Borne Debris Path Identification Using Texture-Wavelet Analysis. J. Wind Eng. Ind. Aerodyn. 2012, 107–108, 202–213. [Google Scholar] [CrossRef]
  34. Cheng, C.S.; Behzadan, A.H.; Noshadravan, A. Deep Learning for Post-Hurricane Aerial Damage Assessment of Buildings. Comput.-Aided Civ. Infrastruct. Eng. 2021, 36, 695–710. [Google Scholar] [CrossRef]
  35. Wheeler, B.J.; Karimi, H.A. Deep Learning-Enabled Semantic Inference of Individual Building Damage Magnitude from Satellite Images. Algorithms 2020, 13, 195. [Google Scholar] [CrossRef]
  36. Herman Assumpção, T.; Popescu, I.; Jonoski, A.; Solomatine, D.P. Citizen Observations Contributing to Flood Modelling: Opportunities and Challenges. Hydrol. Earth Syst. Sci. Discuss. 2017, 22, 1473–1489. [Google Scholar] [CrossRef]
  37. Restemeyer, B.; Boogaard, F.C. Potentials and Pitfalls of Mapping Nature-Based Solutions with the Online Citizen Science Platform Climatescan. Land 2021, 10, 5. [Google Scholar] [CrossRef]
  38. Liu, Y.; Piyawongwisal, P.; Handa, S.; Yu, L.; Xu, Y.; Samuel, A. Going beyond Citizen Data Collection with Mapster: A Mobile+cloud Real-Time Citizen Science Experiment. In Proceedings of the 7th IEEE International Conference on e-Science Workshops, eScience, Stockholm, Sweden, 5–8 December 2011; pp. 1–6. [Google Scholar] [CrossRef]
  39. Baradaranshoraka, M.; Pinelli, J.-P.; Gurley, K.; Peng, X.; Zhao, M. Hurricane Wind versus Storm Surge Damage in the Context of a Risk Prediction Model. J. Struct. Eng. 2017, 143, 04017103. [Google Scholar] [CrossRef]
  40. Ham, H.J.; Yun, W.; Choi, S.H.; Lee, S.; Kim, H.J. Quantitative Wind Risk Assessment for Low and Mid-Rise Apartment Buildings Based on a Probabilistic Model. J. Asian Archit. Build. Eng. 2018, 17, 377–384. [Google Scholar] [CrossRef]
  41. Khajwal, A.B.; Noshadravan, A. Probabilistic Hurricane Wind-Induced Loss Model for Risk Assessment on a Regional Scale. ASCE-ASME J. Risk Uncertain. Eng. Syst. A Civ. Eng. 2020, 6, 1–9. [Google Scholar] [CrossRef]
  42. Jamali, B.; Löwe, R.; Bach, P.M.; Urich, C.; Arnbjerg-Nielsen, K.; Deletic, A. A Rapid Urban Flood Inundation and Damage Assessment Model. J. Hydrol. 2018, 564, 1085–1098. [Google Scholar] [CrossRef]
  43. Nafari, R.H.; Ngo, T.; Mendis, P. An Assessment of the Effectiveness of Tree-Based Models for Multi-Variate Flood Damage Assessment in Australia. Water 2016, 8, 282. [Google Scholar] [CrossRef]
  44. FEMA. Hazus-MH Overview. Available online: https://www.fema.gov/flood-maps/products-tools/hazus (accessed on 1 July 2022).
  45. Tate, E.; Muñoz, C.; Suchan, J. Uncertainty and Sensitivity Analysis of the HAZUS-MH Flood Model. Nat. Hazards Rev. 2014, 16, 04014030. [Google Scholar] [CrossRef]
  46. Mishra, S.; Vanli, O.A.; Alduse, B.P.; Jung, S. Hurricane Loss Estimation in Wood-Frame Buildings Using Bayesian Model Updating: Assessing Uncertainty in Fragility and Reliability Analyses. Eng. Struct. 2017, 135, 81–94. [Google Scholar] [CrossRef]
  47. Wurman, J.; Alexander, C.; Robinson, P.; Richardson, Y. Low-Level Winds in Tornadoes and Potential Catastrophic Tornado Impacts in Urban Areas. Bull. Am. Meteorol. Soc. 2007, 88, 31–46. [Google Scholar] [CrossRef]
  48. Cintineo, J.L.; Pavolonis, M.J.; Sieglaff, J.M.; Cronce, L.; Brunner, J. Noaa Probsevere v2.0—Probhail, Probwind, and Probtor. Weather 2020, 35, 1523–1543. [Google Scholar] [CrossRef]
  49. Cintineo, J.L.; Pavolonis, M.J.; Sieglaff, J.M.; Lindsey, D.T.; Cronce, L.; Gerth, J.; Rodenkirch, B.; Brunner, J.; Gravelle, C. The NOAA/CIMSS ProbSevere Model: Incorporation of Total Lightning and Validation. Weather 2018, 33, 331–345. [Google Scholar] [CrossRef]
  50. Sandmael, T.; Satrio, C.; Steeves, R.; Calhoun, K.M.; Campbell, P.A.; Hyland, P. Using Tornado Probability Guidancce from a Machine Learning Model in the 2021 Hazardous Weather Testbed Experimental Warning Program Probabilistic Hazard Information Prototype Experiment. In Proceedings of the 31st Conference on Weather Analysis and Forecasting, 2022 AMS Annual Meeting, Houston, TX, USA, 23–27 January 2022. [Google Scholar]
  51. NWS. Impact Based Warnings. Available online: http://www.weather.gov/survey/nws-survey.php?code=IBW (accessed on 11 October 2022).
  52. Luchetti, N. National Weather Service Introduces Impact-Based Warnings for Tornadoes. Available online: https://www.earthmagazine.org/article/national-weather-service-introduces-impact-based-warnings-tornadoes/ (accessed on 11 October 2022).
  53. Oklahoma County. Assessor Public Record. Available online: https://assessor.oklahomacounty.org/203/Search-Property-Records (accessed on 14 July 2020).
  54. Oklahoma City. Planning Commission City Zoning Map. Available online: https://www.okc.gov/departments/planning/planning-commission (accessed on 1 October 2020).
  55. Microsoft. Building Footprints. Available online: https://www.microsoft.com/en-us/maps/building-footprints (accessed on 1 October 2020).
  56. FEMA. FEMA Enterprise GIS Services. Available online: https://gis.fema.gov/ (accessed on 28 February 2022).
  57. Wind Science and Engineering Center. A Recommendation for an Enhanced Fujita Scale (EF-Scale); Wind Science and Engineering Center: Lubbock, TX, USA, 2006. [Google Scholar]
  58. Kim, J.; Hatzis, J.J.; Klockow, K.; Campbell, P.A. Building Classification Using Random Forest to Develop a Geodatabase for Probabilistic Hazard Information. Nat. Hazards Rev. 2022, 23. [Google Scholar] [CrossRef]
  59. Hecht, R.; Meinel, G.; Buchroithner, M. Automatic Identification of Building Types Based on Topographic Databases–A Comparison of Different Data Sources. Int. J. Cartogr. 2015, 1, 18–31. [Google Scholar] [CrossRef]
  60. Lee, J.; Jang, H.; Yang, J.; Yu, K. Machine Learning Classification of Buildings for Map Generalization. ISPRS Int. J. Geoinf. 2017, 6, 309. [Google Scholar] [CrossRef]
  61. Smith, B.T.; Thompson, R.L.; Dean, A.R.; Marsh, P.T. Diagnosing the Conditional Probability of Tornado Damage Rating Using Environmental and Radar Attributes. Weather 2015, 30, 914–932. [Google Scholar] [CrossRef]
  62. NWS. Impact-Based Convective Warnings. Available online: https://training.weather.gov/wdtd/courses/rac/warnings/IBW-content/story.html (accessed on 8 March 2023).
  63. Bentley, E.S.; Thompson, R.L.; Bowers, B.R.; Gibbs, J.G.; Nelson, S.E. An Analysis of 2016–18 Tornadoes and National Weather Service Tornado Warnings across the Contiguous United States. Weather 2021, 36, 1909–1924. [Google Scholar] [CrossRef]
  64. Smith, B.T.; Thompson, R.L.; Speheger, D.A.; Dean, A.R.; Karstens, C.D.; Anderson-Frey, A.K. Wsr-88d Tornado Intensity Estimates. Part i: Real-Time Probabilities of Peak Tornado Wind Speeds. Weather 2020, 35, 2479–2492. [Google Scholar] [CrossRef]
  65. Smith, B.T.; Thompson, R.L.; Speheger, D.A.; Dean, A.R.; Karstens, C.D.; Anderson-Frey, A.K. Wsr-88d Tornado Intensity Estimates. Part II: Real-Time Applications to Tornado Warning Time Scales. Weather 2020, 35, 2493–2506. [Google Scholar] [CrossRef]
  66. Oklahoma State Department of Health. Medical Facilities. Available online: https://oklahoma.gov/health.html (accessed on 8 March 2023).
  67. U.S. Department of Education National Center for Education Statistics (NCES). Available online: https://nces.ed.gov/ (accessed on 8 March 2023).
  68. NWS. National Weather Service Damage Assessment Toolkit. Available online: https://apps.dat.noaa.gov/stormdamage/damageviewer/ (accessed on 8 March 2023).
  69. Cohen, A.E.; Cohen, J.B.; Thompson, R.L.; Smith, B.T. Simulating Tornado Probability and Tornado Wind Speed Based on Statistical Models. Weather 2018, 33, 1099–1108. [Google Scholar] [CrossRef]
  70. FEMA. Local Mitigation Planning Handbook; FEMA: Washington, DC, USA, 2013. [Google Scholar]
  71. FEMA. The Stafford Act: Robert T. Stafford Disaster Relief and Emergency Assistance Act, as Amended; FEMA: Washington, DC, USA, 2013. [Google Scholar]
  72. Alfonso, L.; Mukolwe, M.M.; Di Baldassarre, G. Probabilistic Flood Maps to Support Decision-Making: Mapping the Value of Information. Water Resour. Res. 2016, 52, 1026–1043. [Google Scholar] [CrossRef]
  73. La Salandra, M.; Roseto, R.; Mele, D.; Dellino, P.; Capolongo, D. Probabilistic Hydro-Geomorphological Hazard Assessment Based on UAV-Derived High-Resolution Topographic Data: The Case of Basento River (Southern Italy). Sci. Total Environ. 2022, 842, 156736. [Google Scholar] [CrossRef]
  74. Ripberger, J.T.; Bell, A.; Fox, A.; Forney, A.; Livingston, W.; Gaddie, C.; Silva, C.; Jenkins-Smith, H. Communicating Probability Information in Weather Forecasts: Findings and Recommendations from a Living Systematic Review of the Research Literature. Weather Clim. Soc. 2022, 14, 481–498. [Google Scholar] [CrossRef]
  75. Morss, R.E.; Lazo, J.K.; Demuth, J.L. Examining the Use of Weather Forecasts in Decision Scenarios: Results from a US Survey with Implications for Uncertainty Communication. Meteorol. Appl. 2010, 17, 149–162. [Google Scholar] [CrossRef]
  76. Mileti, D.S.; Sorensen, J.H. Communication of Emergency Public Warnings: A Social Science Perspective and State-of-the-Art Assessment; Oak Ridge National Lab.: Oak Ridge, TN, USA, 1990. [Google Scholar]
  77. Brotzge, J.; Donner, W. The Tornado Warning Process: A Review of Current Research, Challenges, and Opportunities. Bull. Am. Meteorol. Soc. 2013, 94, 1715–1733. [Google Scholar] [CrossRef]
  78. Kox, T.; Thieken, A.H. To Act or Not To Act? Factors Influencing the General Public’s Decision about Whether to Take Protective Action against Severe Weather. Weather Clim. Soc. 2017, 9, 299–315. [Google Scholar] [CrossRef]
  79. Lazo, J.K.; Hosterman, H.R.; Sprague-Hilderbrand, J.M.; Adkins, J.E. Impact-Based Decision Support Services and the Socioeconomic Impacts of Winter Storms. Bull. Am. Meteorol. Soc. 2020, 101, E626–E639. [Google Scholar] [CrossRef]
  80. Galluppi, K.; Losego, J.; Montz, B. Weather for Emergency Management Decision Support. 2012. Available online: https://renci.org/research/weather-and-emergency-management-decision-support/ (accessed on 8 March 2023).
  81. Galluppi, K.; Losego, J.; Montz, B. Evaluation of the Effectiveness of the Central Region Impact Based Warning Demonstration Conducted by Weather for Emergency Management Decision Support. 2013. Available online: https://repository.library.noaa.gov/view/noaa/28893 (accessed on 8 March 2023).
  82. Kim, J.; Deshmukh, A.; Hastak, M. A Framework for Assessing the Resilience of a Disaster Debris Management System. Int. J. Disaster Risk Reduct. 2018, 28, 674–687. [Google Scholar] [CrossRef]
  83. HHS ASPR. Major Earthquakes & Cascading Events: Potential Health and Medical Implications; HHS ASPR: Washington, DC, USA, 2021. [Google Scholar]
  84. Chuang, S.; Woods, D.D.; Reynolds, M.; Ting, H.W.; Balkin, A.; Hsu, C.W. Rethinking Preparedness Planning in Disaster Emergency Care: Lessons from a beyond-Surge-Capacity Event. World J. Emerg. Surg. 2021, 16, 59. [Google Scholar] [CrossRef] [PubMed]
  85. Raval, D.; Rosenbaum, T.; Wilson, N.E. Using Disaster-Induced Closures to Evaluate Discrete Choice Models of Hospital Demand. RAND J. Econ. 2022, 53, 561–589. [Google Scholar] [CrossRef]
  86. Maruyama, T. Simulation of Flying Debris Using a Numerically Generated Tornado-like Vortex. J. Wind. Eng. Ind. Aerodyn. 2011, 99, 249–256. [Google Scholar] [CrossRef]
  87. Baker, C.J.; Sterling, M. Modelling Wind Fields and Debris Flight in Tornadoes. J. Wind. Eng. Ind. Aerodyn. 2017, 168, 312–321. [Google Scholar] [CrossRef]
  88. Lin, N.; Holmes, J.D.; Letchford, C.W. Trajectories of Wind-Borne Debris in Horizontal Winds and Applications to Impact Testing. J. Struct. Eng. 2007, 133, 274–282. [Google Scholar] [CrossRef]
  89. Pinter, N.; Rees, J.C. Assessing Managed Flood Retreat and Community Relocation in the Midwest USA. Nat. Hazards 2021, 107, 497–518. [Google Scholar] [CrossRef]
  90. Murfin, J.; Spiegel, M. Is the Risk of Sea Level Rise Capitalized in Residential Real Estate? Rev. Financ. Stud. 2020, 33, 1217–1255. [Google Scholar] [CrossRef]
  91. Mietkiewicz, N.; Balch, J.K.; Schoennagel, T.; Leyk, S.; St. Denis, L.A.; Bradley, B.A. In the Line of Fire: Consequences of Human-Ignited Wildfires to Homes in the U.S. (1992–2015). Fire 2020, 3, 50. [Google Scholar] [CrossRef]
  92. Potter, S.; Harrison, S.; Kreft, P. The Benefits and Challenges of Implementing Impact-Based Severe Weather Warning Systems: Perspectives of Weather, Flood, and Emergency Management Personnel. Weather Clim. Soc. 2021, 13, 303–314. [Google Scholar] [CrossRef]
  93. Kox, T.; Lüder, C.; Gerhold, L. Anticipation and Response: Emergency Services in Severe Weather Situations in Germany. Int. J. Disaster Risk Sci. 2018, 9, 116–128. [Google Scholar] [CrossRef]
  94. Kim, J.; Park, H. A Framework for Understanding Online Group Behaviors during a Catastrophic Event. Int. J. Inf. Manag. 2020, 51, 102051. [Google Scholar] [CrossRef]
  95. Kim, J.; Hastak, M. Social Network Analysis: Characteristics of Online Social Networks after a Disaster. Int. J. Inf. Manag. 2018, 38, 86–96. [Google Scholar] [CrossRef]
Figure 1. Deterministic/static weather information vs. probabilistic/dynamic weather information. (a) Tornado watch areas are represented by a yellow polygon where tornadoes are possible in and near the area. A tornado watch probability table is provided to show probabilities of two or more tornadoes, and one or more strong to violent tornadoes. Tornado warning areas are represented by a red polygon where tornadoes are expected as either indicated by weather radar or confirmed by a spotter. (b) The probability of a tornado is represented by different color schemes. Darker red (in/near the red circle) indicates a higher likelihood of a tornado and light red indicates a lower probability of a tornado. This threat moves with the storm and likelihood increases as the red circle moves closer to the user’s location.
Atmosphere 14 00767 g001
Figure 2. Research framework to predict community risk from severe weather threats.
Atmosphere 14 00767 g002
Figure 3. PHI plume generation process [20]. (a) A hazard object is generated based on current storm area with a gaussian distribution function applied to create probability (dashed circle). Red represents a higher probability of severe weather threat and blue represents lower probability of severe weather threats. A set of forecasted probabilities (represented in white-colored circles) are created based on n-minute intervals along with the predicted direction of hazard (dashed line). (b) The maximum value of probability on each grid/cell are combined to create a PHI plume.
Atmosphere 14 00767 g003
Figure 4. User interface to support the creation of PHI plume. This Prototype PHI software provides a geographical user interface where forecasters define a 2D storm with geographical extent, duration, motion, and a probability trend.
Atmosphere 14 00767 g004
Figure 5. Forecasters can input a tornado severity (base/no tag, considerable, and catastrophic) in prototype PHI software.
Atmosphere 14 00767 g005
Figure 6. The process for building a geodatabase: Addresses of the building property are converted to coordinates (latitude and longitude). Then, the three types of datasets (building property, footprints, and city zoning) are spatial joined to create a geodatabase. A building type classification algorithm [59] is performed to classify a type of building property into 28 different DIs.
Atmosphere 14 00767 g006
Figure 7. Building damage estimation logic using graph from Wind Science and Engineering Center [57], and an example of the functions used to estimate degrees of damage for the 28 damage indicators. In this case, the function for one- and two-family residents (FR12) is used. Red annotations and lines are for an example PHI plume with the “considerable” impact tag and range of wind speeds between 75 and 145 mph (DoD 4–6).
Atmosphere 14 00767 g007
Figure 8. Damages (DoD = 5, entire house shifts off foundation) on one- or two-family residence under EF = 2 as would ideally correspond to a “considerable” impact tag. All images were retrieved from NWS damage assessment toolkit [68].
Atmosphere 14 00767 g008aAtmosphere 14 00767 g008b
Figure 9. Three types of PHI plumes were created with different wind speeds (impact tag: base/no tag, considerable, and catastrophic) on the Oklahoma City metropolitan area.
Atmosphere 14 00767 g009
Figure 10. Severe weather impacts on critical infrastructure in the Oklahoma City metropolitan area. Icons under the PHI plumes represent the affected facilities from severe weather threats. (a) The DoD for the three facilities in the red-colored box is 3–7 (i.e., damage to roof and wall, loss of rooftop or HVAC equipment). The DoD for the three facilities in the blue-colored box is 6–11 (i.e., uplift or pre-cast concrete roof slabs). A user can access basic information of facilities from the geodatabase, such as name, address, telephone, number of beds, shelter availability, school capacity (number of students/teachers), and website. For example, nine middle/high schools were estimated to have severe building damages (DoD 6–10). This information can be used to estimate the affected number of students, patients, and areas with the lack of fire protection system. (a). Fire station (13 affected) Atmosphere 14 00767 i001
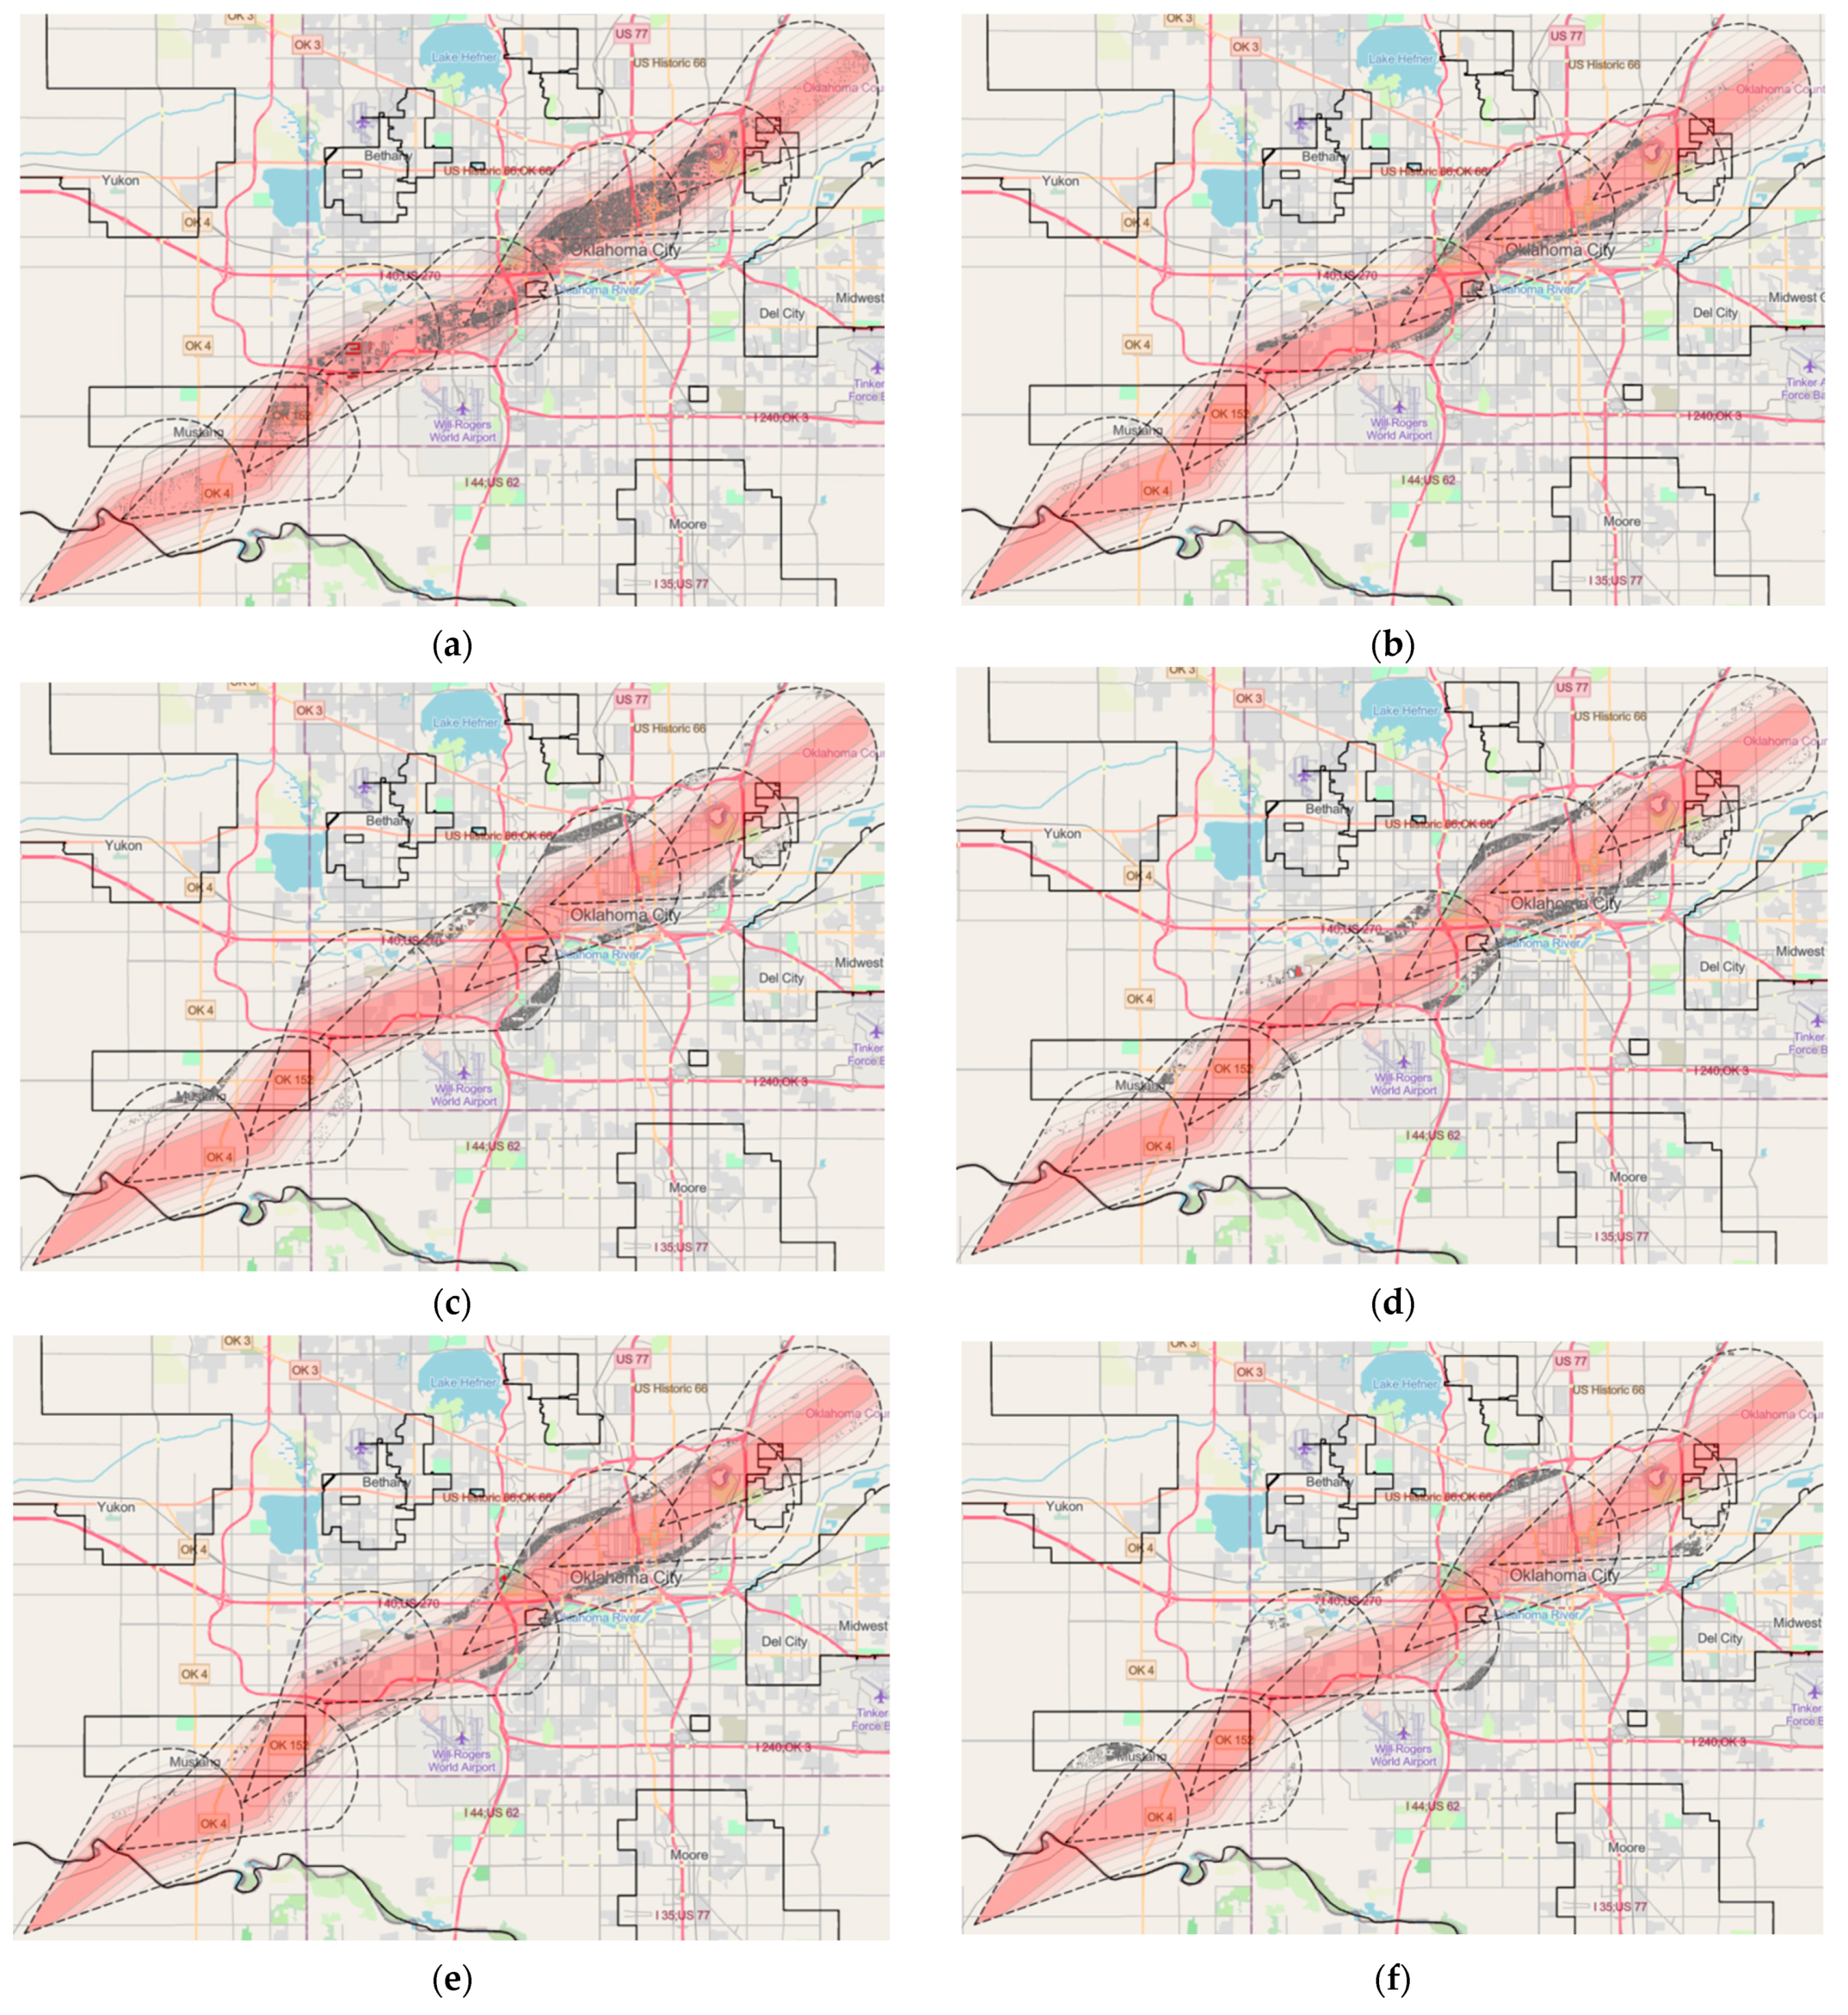
; (b). Hospital (10 affected) Atmosphere 14 00767 i002; (c). Police station (8 affected) Atmosphere 14 00767 i003; (d). School (29 affected) Atmosphere 14 00767 i004.
Atmosphere 14 00767 g010
Figure 11. Fire station—degree of damage and probability. The probability of occurrence of an event is represented with color scheme (red represents a higher probability of occurrence and blue represents a lower probability of occurrence). End users could use this information to prioritize when making decisions about risk analysis and emergency response.
Atmosphere 14 00767 g011
Figure 12. PHI path and probability over time (t0–t6). Colors represent the highest value of probability while the PHI plume moves across the city. The outline of each PHI plume at different time points are represented by black-dashed lines. Black-colored boundary represents Oklahoma City metro area) where the building data (type) is available.
Atmosphere 14 00767 g012
Figure 13. Building properties under different probabilities of hazard occurrence. Grey dots represent building properties under each probability range. The number of building properties under different probabilities are 15,870 (over 80%), 6647 (60–80%), 6231 (40–60%), 8242 (20–40%), 8045 (10–20%), and 4536 (under 10%). The number of buildings at each time step is 2557 (t0), 4243 (t1), 4460 (t2); 10,547 (t3), 22,217 (t4), 15,723 (t5), and 3805 (t6). (a) 15,870 units (within over 80% probability); (b) 6647 units (within 60–80% probability); (c) 6231 units (within 40–60 probability); (d) 8242 units (within 20–40% probability); (e) 8045 units (within 10–20% probability); (f) 4536 units (within <10% probability).
Atmosphere 14 00767 g013
Figure 14. Comparison of the number of estimated building properties (within >80% probability of tornado occurrence) associated with each DoD. In the case of a base/no tag tornado (most-likely scenario), the majority of buildings (15,649) are at no or minor damage predicted (DoD ≤ 2). Only 221 building properties (DoD ≥ 3) may have severe damages (1.4% of the buildings). In the case of a catastrophic tornado (worst-case scenario), 15,112 out of 15,870 (95% of the buildings, DoD ≥ 3) may have severe damages.
Atmosphere 14 00767 g014
Table 1. Comparision of post hoc damage assessments.
MethodAdvantagesDisadvantages
On-site damage survey
  • Higher data accuracy
  • Detailed data such as the degree of damage, structural, and foundational failure.
  • Labor-intensive process that can take days to months to complete
  • It can slow down the follow-up disaster recovery processes such as debris removal and reconstruction
Satellite and aerial image analytics (optical images, SAR, LiDAR)
  • Shorter data collection time compared to on-site damage surveys
  • Less labor-intensive process
  • Weather conditions can affect the collection of data
  • Sometimes, it requires having both pre-event and post-event imagery of the same quality and resolution for purposes of damage detection
  • Certain data may not be available/economical/practical for relatively small or isolated areas
Unmanned aircraft data collection/analytics
  • Can cover certain areas where satellite images are not accessible
  • Higher image resolutions
  • Not applicable for large areas
  • FAA restrictions for certain areas
Citizen-science based data collection and analytics
  • Cover large areas
  • Shorter data collection time
  • Not applicable for suburbs or rural areas
  • Uncertainty in data accuracy and validation process
Table 2. Data fields in the geodatabase. Field, represents the name of the field. Note, is a description of the field. Type, is the data type in terms of categorial, numeric, and identifier.
FieldNoteType
Account numberAccount number for Oklahoma County Assessor recordIdentifier
Account typeType of account for Oklahoma County Assessor recordCategorical
AreaArea of building polygon in square metersNumeric
Building NumberNumeric identifier for the building (in case parcel has multiple buildings)Numeric
Construction TypeType of building constructionCategorical
Damage IndicatorDamage indicator number from EF scale documentationCategorical
Exterior TypeType of exterior material for buildingCategorical
Feature IDUnique identifier for each building polygonIdentifier
Foundation TypeType of foundation for buildingCategorical
Number of StoriesNumber of stories for buildingNumeric
Number of VerticesNumber of vertices in building polygonNumeric
Parcel NumberReal Estate parcel ID numberIdentifier
Parcel TypeType of parcelCategorical
PerimeterPerimeter of building polygon in metersNumeric
Physical AddressPhysical address for parcel of landIdentifier
Roof Type/coveringType of roof construction and covering materialsCategorical
YearConstruction yearNumeric
Zoning OrdinanceCity zoning code for parcel where building polygon is locatedCategorical
Table 3. Damage indicators for EF-scale. EF-scale provides a description of typical construction, photos, a series of degree of damage, and a plot of expected, lower, and upper bound wind speeds.
DI No.Damage Indicator (DI)
1Small Barns or Farm Outbuildings (SBO)
2One- or Two-Family Residences (FR12)
3Manufactured Home—Single Wide (MHSW)
4Manufactured Home—Double Wide (MHDW)
5Apartments, Condos, Townhouses [3 stories or less] (ACT)
6Motel (M)
7Masonry Apartment or Motel Building (MAM)
8Small Retail Building [Fast Food Restaurants] (SRB)
9Small Professional Building [Doctor’s Office, Branch Banks] (SPB)
10Strip Mall (SM)
11Large Shopping Mall (LSM)
12Large, Isolated Retail Building [K-Mart, Wal-Mart] (LIRB)
13Automobile Showroom (ASR)
14Automobile Service Building (ASB)
15Elementary School [Single Story; Interior or Exterior Hallways] (ES)
16Junior or Senior High School (JHSH)
17Low-Rise Building [1–4 Stories] (LRB)
18Mid-Rise Building [5–20 Stories] (MRB)
19High-Rise Building [More than 20 Stories] (HRB)
20Institutional Building [Hospital, Government or University Building] (IB)
21Metal Building System (MBS)
22Service Station Canopy (SSC)
23Warehouse Building [Tilt-up Walls or Heavy-Timber Construction] (WHB)
24Electrical Transmission Lines (ETL)
25Free-Standing Towers (FST)
26Free-Standing Light Poles, Luminary Poles, Flag Poles (FSP)
27Trees: Hardwood (TH)
28Trees: Softwood (TS)
Table 4. Impact tag and wind speed range adapted from Smith et al., 2020a [66], Smith et al., 2020b [67] and NWS (2023) [62].
Impact TagVrot (kt)Wind Speed Range (mph)
Base/no tag<4060–110
Considerable40–7075–145
Catastrophic>70100–205
Table 5. Potential DoD on critical infrastructure under the three types of impact tags.
Critical Infrastructure TypeImpact-TagPotential DoD (Min–Max)
Fire station/Hospital/Police station(DI-20)Base/no tag1–3
Considerable3–7
Catastrophic6–11
Middle/High school(DI-16)Base/no tag2–4
Considerable4–8
Catastrophic7–11
Elementary School(DI-15)Base/no tag2–4
Considerable3–7
Catastrophic6–10
Note: Wind speed range: 60–110 mph (Base/no tag); 75–145 mph (considerable); and 95–205 mph (catastrophic).
Disclaimer/Publisher’s Note: The statements, opinions and data contained in all publications are solely those of the individual author(s) and contributor(s) and not of MDPI and/or the editor(s). MDPI and/or the editor(s) disclaim responsibility for any injury to people or property resulting from any ideas, methods, instructions or products referred to in the content.

