
Determining the Geogenic Radon Potential in Different Layouts and Numbers of Points

 , , , and
Abstract
:1. Introduction
2. Materials and Methods
- The ionisation chambers are vacuumed using a manual or electric pump;
- The gas sampling probes (steel pipes) are introduced in the soil at a depth of 80 cm;
- The gas from the soil is sampled using a 150 mL Janet syringe connected to the sampling probes;
- The gas sample is introduced in the ionisation chamber. Following this step, 50 mL of ambiental air is introduced into the ionisation chamber to reach a total volume of 200 mL;
- In order to eliminate any trace of thoron, the sample is left to rest for 15 min;
- After 15 min, the ionisation chamber is connected to the ERM-3 electrometer and radon activity concentration is measured. The alpha radiation emitted by radon in the ionisation chamber creates an ionisation current, which is measured for 120 s;
- After 120 s, the ERM-3 electrometer displays the radon activity concentration in volume activity units (kBq/m3) [35].
3. Results and Discussion
4. Conclusions
Author Contributions
Funding
Institutional Review Board Statement
Informed Consent Statement
Data Availability Statement
Conflicts of Interest
References
- Cosma, C.; Cucos (Dinu), A.; Dicu, T. Preliminary Results Regarding the First Map of Residential Radon in Some Regions in Romania. Radiat. Prot. Dosim. 2013, 155, 343–350. [Google Scholar] [CrossRef] [PubMed]
- Dai, D.; Neal, F.B.; Diem, J.; Deocampo, D.M.; Stauber, C.; Dignam, T. Confluent Impact of Housing and Geology on Indoor Radon Concentrations in Atlanta, Georgia, United States. Sci. Total Environ. 2019, 668, 500–511. [Google Scholar] [CrossRef] [PubMed]
- IARC Monographs on the Evaluation of the Carcinogenic Risks to Humans; International Agency for Research on Cancer: Lyon, France, 1988.
- Monitorul Oficial HG 526/2018—Planul Național de Acțiune La Radon; Nr. 645/25.VII.2018; Monitorul Oficial: Bucharest, Romania, 2018; (Official Gazette HG 526/2018—The national radon action plan; No. 645/25.VII.2018).
- EURATOM 59 Council Directive 2013/59/Euratom of 5 December 2013 Laying down Basic Safety Standards for Protection against the Dangers Arising from Exposure to Ionising Radiation, and Repealing Directives 89/618/Euratom, 90/641/Euratom, 96/29/Euratom, 97/43/Euratom; EURATOM: Rome, Italy, 2013.
- Nero, A. Earth, Air, Radon and Home. Phys. Today 1989, 42, 32–39. [Google Scholar] [CrossRef]
- Kemski, J.; Siehl, A.; Stegemann, R.; Valdivia-Manchego, M. Mapping the Geogenic Radon Potential in Germany. Sci. Total Environ. 2001, 272, 217–230. [Google Scholar] [CrossRef] [PubMed]
- Kemski, J.; Klingel, R.; Siehl, A.; Stegemann, R. Radon Transfer from Ground to Houses and Prediction of Indoor Radon in Germany Based on Geological Information. Radioact. Environ. 2005, 7, 820–832. [Google Scholar] [CrossRef]
- Ciotoli, G.; Voltaggio, M.; Tuccimei, P.; Soligo, M.; Pasculli, A.; Beaubien, S.E.; Bigi, S. Geographically Weighted Regression and Geostatistical Techniques to Construct the Geogenic Radon Potential Map of the Lazio Region: A Methodological Proposal for the European Atlas of Natural Radiation. J. Environ. Radioact. 2017, 166, 355–375. [Google Scholar] [CrossRef]
- Bossew, P. Mapping the Geogenic Radon Potential and Estimation of Radon Prone Areas in Germany. Radiat. Emerg. Med. 2015, 4, 13–20. [Google Scholar]
- Appleton, J.D. Radon: Sources, Health Risks, and Hazard Mapping. Ambio 2007, 36, 85–89. [Google Scholar] [CrossRef] [Green Version]
- Cinelli, G.; Tollefsen, T.; Bossew, P.; Gruber, V.; Bogucarskis, K.; De Felice, L.; De Cort, M. Digital Version of the European Atlas of Natural Radiation. J. Environ. Radioact. 2019, 196, 240–252. [Google Scholar] [CrossRef]
- Neznal, M.; Neznal, M.; Matolin, M.; Barnet, I.; Miksova, J. The New Method for Assessing the Radon Risk of Building Sites; Czech Geological Survey: Praga, Czech Republic, 2004. [Google Scholar]
- Mikšová, J.; Barnet, I. Geological Support to the National Radon Programme (Czech Republic). Bull. Czech Geol. Surv. 2002, 77, 13–22. [Google Scholar]
- Szabó, K.Z.; Jordan, G.; Horváth, Á.; Szabó, C. Mapping the Geogenic Radon Potential: Methodology and Spatial Analysis for Central Hungary. J. Environ. Radioact. 2014, 129, 107–120. [Google Scholar] [CrossRef]
- Planinić, J.; Vuković, B.; Radolić, V.; Stanić, D. Radon in Soil and Homes of Osijek. In Proceedings of the European IRPA Congress, Florence, Italy, 8–11 October 2002; p. 37, ISBN 88-88648-09-7. [Google Scholar]
- Chalupnik, S.; Wysocka, M. Measurement of Radon Exhalation from Soil—Development of the Method and Preliminary Results. J. Min. Sci. 2003, 39, 191–198. [Google Scholar] [CrossRef]
- Swakoń, J.; Kozak, K.; Paszkowski, M.; Gradziński, R.; Łoskiewicz, J.; Mazur, J.; Janik, M.; Bogacz, J.; Horwacik, T.; Olko, P. Radon Concentration in Soil Gas around Local Disjunctive Tectonic Zones in the Krakow Area. J. Environ. Radioact. 2005, 78, 137–149. [Google Scholar] [CrossRef]
- Friedmann, H.; Baumgartner, A.; Bernreiter, M.; Gräser, J.; Gruber, V.; Kabrt, F.; Kaineder, H.; Maringer, F.J.; Ringer, W.; Seidel, C.; et al. Indoor Radon, Geogenic Radon Surrogates and Geology—Investigations on Their Correlation. J. Environ. Radioact. 2017, 166, 382–389. [Google Scholar] [CrossRef]
- Mancini, S.; Guida, M.; Cuomo, A.; Guida, D. A Geogenic Approach for the Radon Monitoring and the Exposure Assessment at a Regional Scale: The Results of the Rad_Campania Project. Adv. Geosci. 2020, 52, 87–96. [Google Scholar] [CrossRef]
- Florică, Ş.; Burghele, B.D.; Bican-Brişan, N.; Begy, R.; Codrea, V.; Cucoş, A.; Catalina, T.; Dicu, T.; Dobrei, G.; Istrate, A.; et al. The Path from Geology to Indoor Radon. Environ. Geochem. Health 2020, 42, 2655–2665. [Google Scholar] [CrossRef]
- Cosma, C.; Baciu, C. Dinamica Radonului. In Municipiul Cluj-Napoca și zona periurbană—Studii ambientale; Editura Accent: Cluj-Napoca, Romania, 2002; (Radon dynamics. In the Cluj-Napoca City and peri-urban area—Environmental studies). [Google Scholar]
- Lupulescu, A.; Dicu, T.; Papp, B.; Cucos, A. Determination of the Monthly Variation of Radon Activity Concentration in Soil. Stud. Univ. Babeș Bolyai Ambient. 2018, 63, 49–59. [Google Scholar] [CrossRef]
- Burghele, B.; Ţenter, A.; Cucoş, A.; Dicu, T.; Moldovan, M.; Papp, B.; Szacsvai, K.; Neda, T.; Suciu, L.; Lupulescu, A.; et al. The FIRST Large-Scale Mapping of Radon Concentration in Soil Gas and Water in Romania. Sci. Total Environ. 2019, 669, 887–892. [Google Scholar] [CrossRef]
- Kemski, J.; Klingel, R.; Siehl, A. Classification and Mapping of Radon-Affected Areas in Germany. Environ. Int. 1996, 22, 789–798. [Google Scholar] [CrossRef]
- Giustini, F.; Ciotoli, G.; Rinaldini, A.; Ruggiero, L.; Voltaggio, M. Mapping the Geogenic Radon Potential and Radon Risk by Using Empirical Bayesian Kriging Regression: A Case Study from a Volcanic Area of Central Italy. Sci. Total Environ. 2019, 661, 449–464. [Google Scholar] [CrossRef]
- Alonso, H.; Rubiano, J.G.; Guerra, J.G.; Arnedo, M.A.; Tejera, A.; Martel, P. Assessment of Radon Risk Areas in the Eastern Canary Islands Using Soil Radon Gas Concentration and Gas Permeability of Soils. Sci. Total Environ. 2019, 664, 449–460. [Google Scholar] [CrossRef]
- Krautner, H. Munții Noștri: Poiana Ruscă; Editura Sport-Turism: București, Romania, 1984; (Our mountains: Poiana Rusca). [Google Scholar]
- Mamulea, A. Cercetări Geologice În Regiunea Rusca Montană—Lunca Cernii: Ședința Din 21 Martie 1952. Dări de seamă ale ședințelor 1952, 39, 172–178, (Geological research in the Rusca Montana—Lunca Cernii Region). [Google Scholar]
- Balintoni, I.; Iancu, V. Probleme de Metamorfism, Litostratigrafie Si Structura Ale Cristalinului Din Masivul Poiana Rusca. Studii si cercetari de Geologie Geofizica Geografie Seria de geologie 1986, 31, 51–67, (Problems of Metamorphism, Lithostratigraphy and Crystalline Structure from the Poiana Rusca Massif). [Google Scholar]
- Maier, O.; Solomon, I.; Zimmermann, P.; Zimmermann, V. Studiul Geologic Și Petrografic al Cristalinului Din Partea Sudică a Munților Poiana Ruscă. Anuarul Institutului Geologic și Geofizic 1975, 43, 65–189, (The Geological and Petrographic study of the Crystalline from the Southern Side of the Poiana Rusca Mountains). [Google Scholar]
- Maier, O.; Lupu, M. Harta Geologică Republica Socialistă România, Scara 1:50.000, Foaia 105a, Băuțar; Institutul de Geologie și Geofizică: București, Romania, 1979; (Geological map of the Socialist Republic of Romania, Scale 1:50000, Sheet 105a, Bautar). [Google Scholar]
- Dincă, A. Geologia Bazinului Rusca Montană. Partea de Vest. Anu. Inst. De Geol. și Geofiz. 1977, 52, 99–173, (Geology of the Rusca Montana Basin. Western Part). [Google Scholar]
- Codarcea, A.; Dimitrescu, R.; Gherasi, N.; Mureșan, M.; Mureșan, G.; Krautner, H.; Krautner, F.; Lupu, M.; Marinescu, F.; Savu, H.; et al. Harta Geologică a Republicii Socialiste România, Scara 1:200.000, L-34-XXIII 25, Deva; Comitetul de Stat pentru Geologie. Institutul Geologic: București, Romania, 1968; (Geology of the Rusca Montana Basin. Western Part). [Google Scholar]
- Radon—Measurements, research, protection, equipment. Available online: https://radon.eu/rm2.html (accessed on 21 January 2023).
- Neznal, M.; Neznal, M. Determination of Soil-Gas Radon Concentration in Low Permeability Soils. Radioact. Environ. 2005, 7, 722–725. [Google Scholar] [CrossRef]
- Matolin, M. International Comparison Measurement of Radon in Soil Gas at Radon Reference Sites Cetyne and Buk in the Czech Republic; Publisher: Prague, Czech Republic, 2021. [Google Scholar]
- Tukey, J.W. Comparing Individual Means in the Analysis of Variance. Biometrics 1949, 5, 99. [Google Scholar] [CrossRef]
- Wilcoxon, F. Individual Comparisons by Ranking Methods. Biom. Bull. 1945, 1, 80–83. [Google Scholar] [CrossRef]
- Koo, T.K.; Li, M.Y. A Guideline of Selecting and Reporting Intraclass Correlation Coefficients for Reliability Research. J. Chiropr. Med. 2016, 15, 155–163. [Google Scholar] [CrossRef] [PubMed] [Green Version]


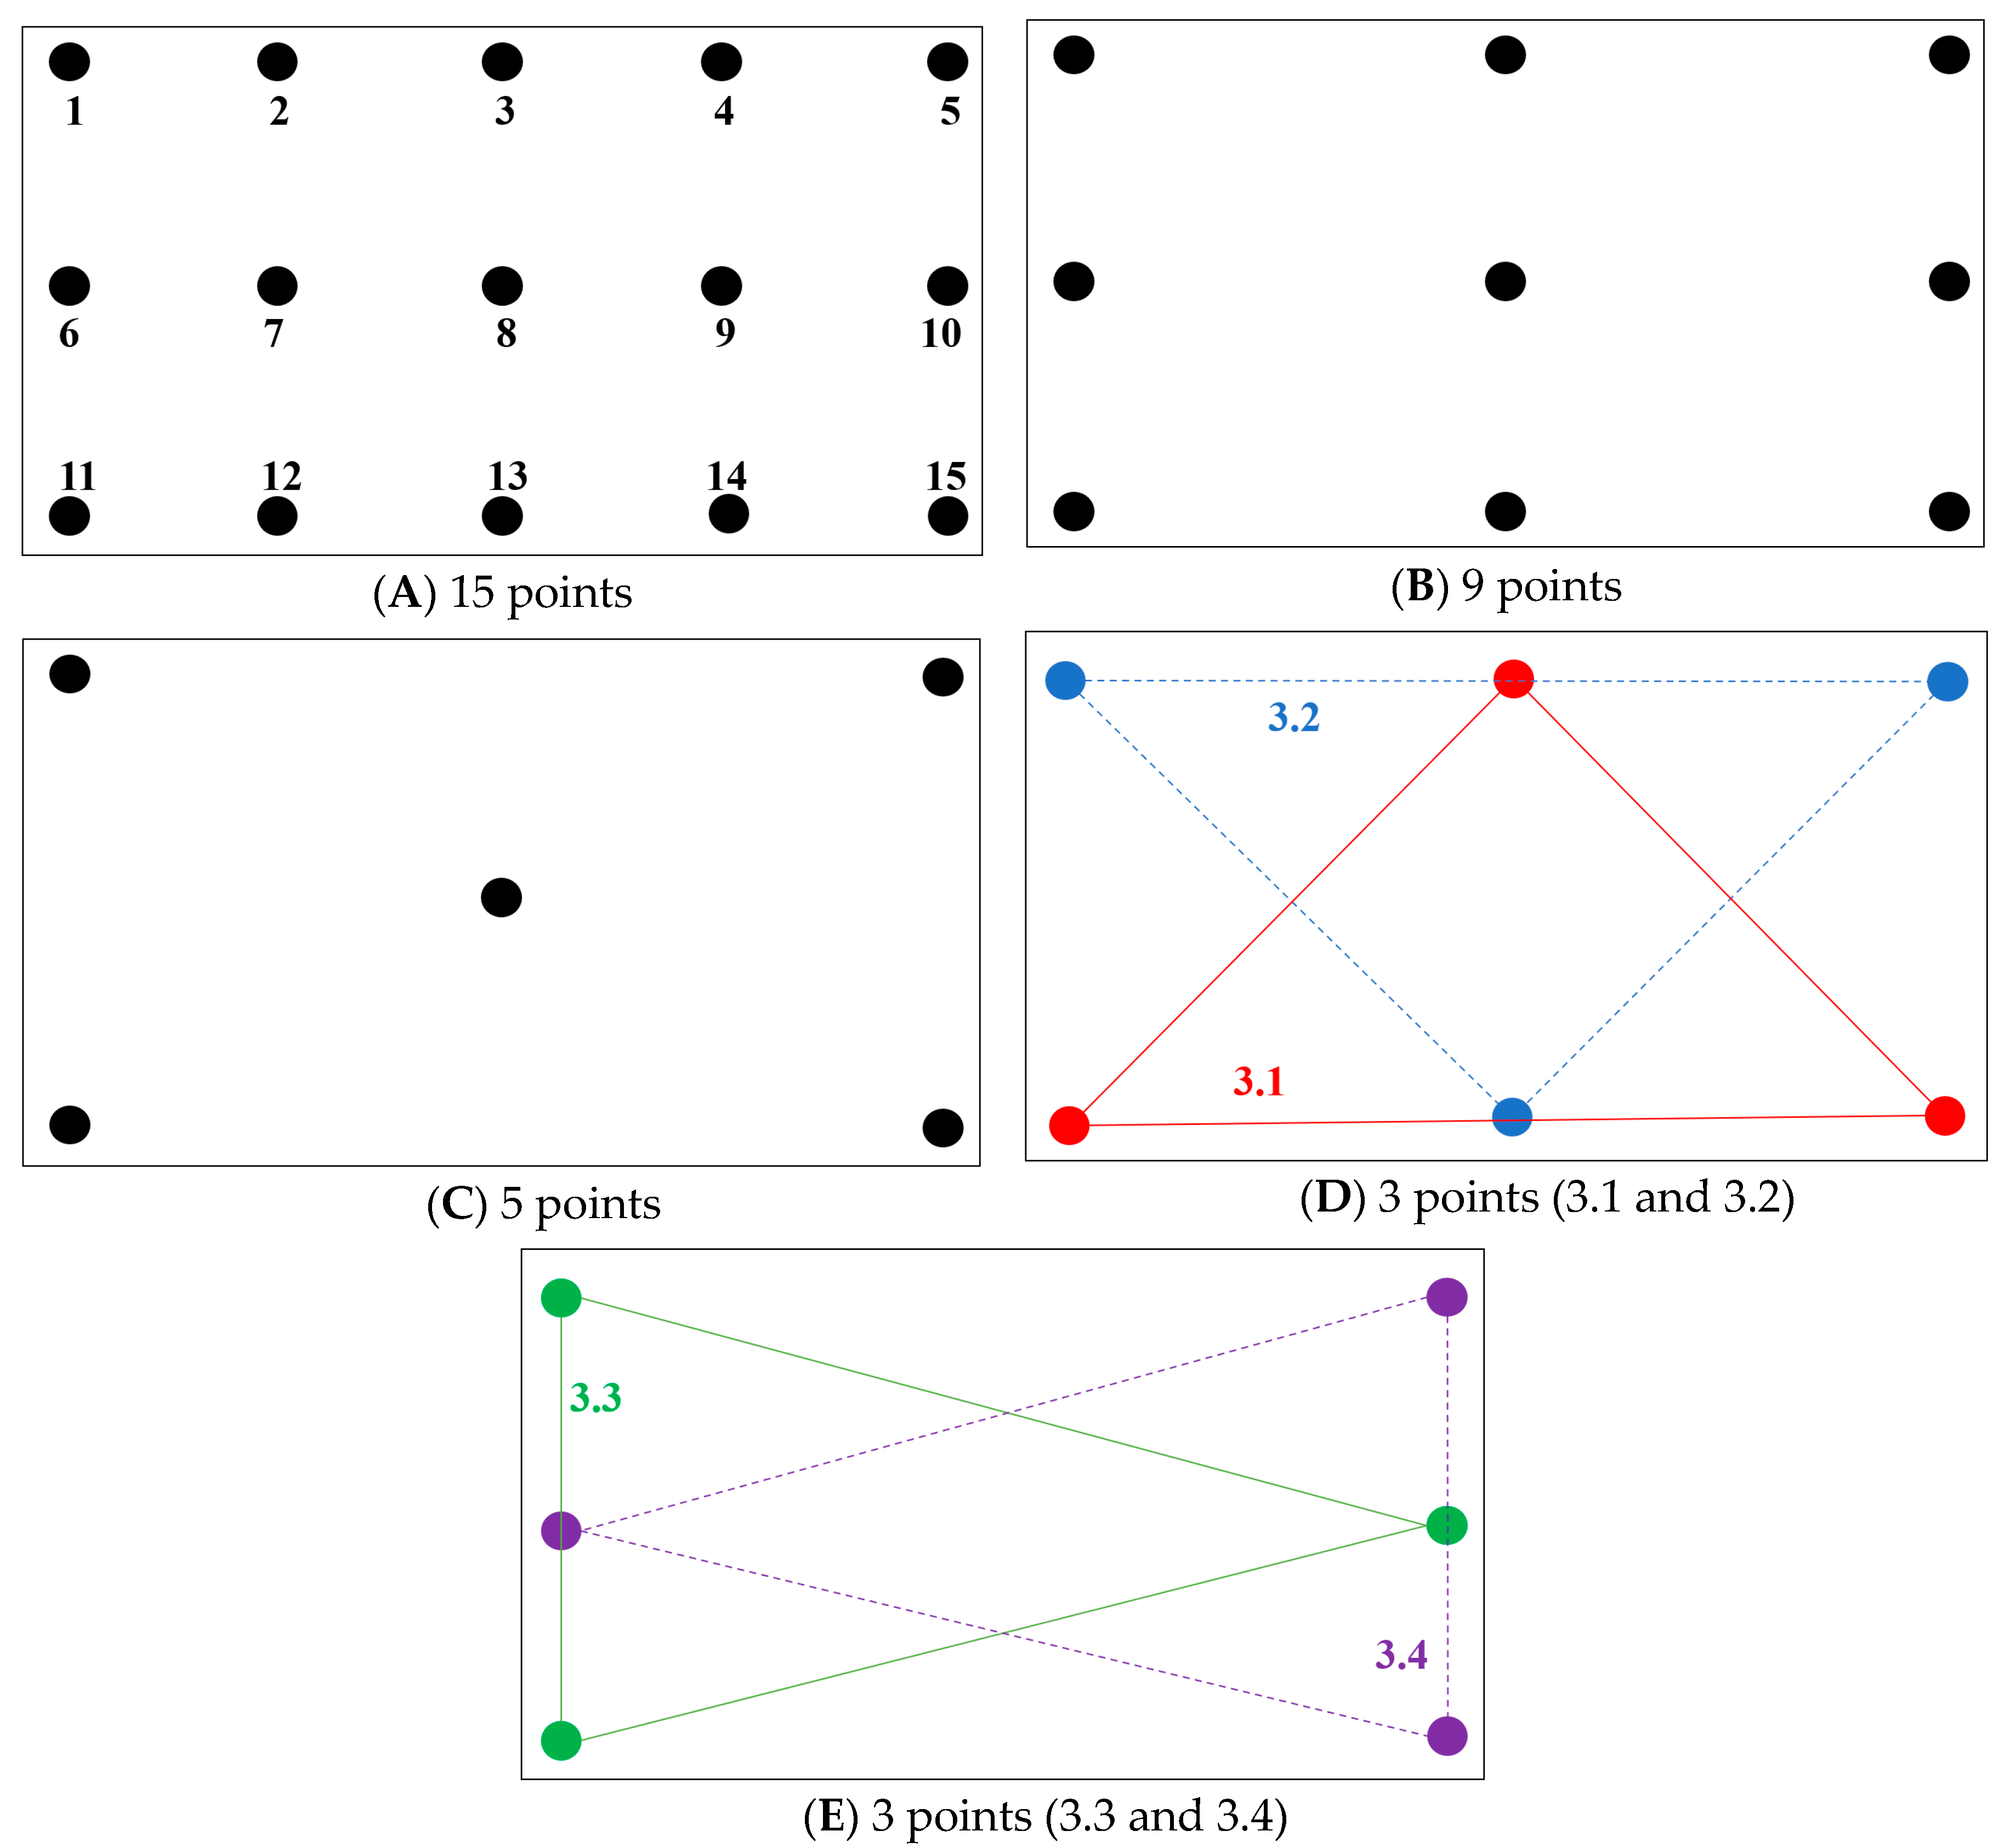
| Measurement Scheme 1 | ICC (95% CI) 2 | Min. 3 | Max. | A.M. | S.D. | G.M. | Median | CV (%) |
|---|---|---|---|---|---|---|---|---|
| 15 | 12 | 110 | 37 | 20 | 33 | 32 | 54 | |
| 9 | 0.96 (0.93–0.98) | 11 | 113 | 38 | 21 | 33 | 33 | 56 |
| 5 | 0.85 (0.73–0.92) | 12 | 100 | 36 | 19 | 32 | 33 | 52 |
| 3.1 | 0.83 (0.67–0.92) | 8 | 83 | 33 | 18 | 29 | 28 | 55 |
| 3.2 | 0.79 (0.61–0.89) | 9 | 75 | 37 | 17 | 33 | 32 | 45 |
| 3.3 | 0.77 (0.59–0.88) | 11 | 69 | 34 | 15 | 31 | 33 | 45 |
| 3.4 | 0.89 (0.80–0.95) | 6 | 124 | 36 | 23 | 31 | 31 | 61 |
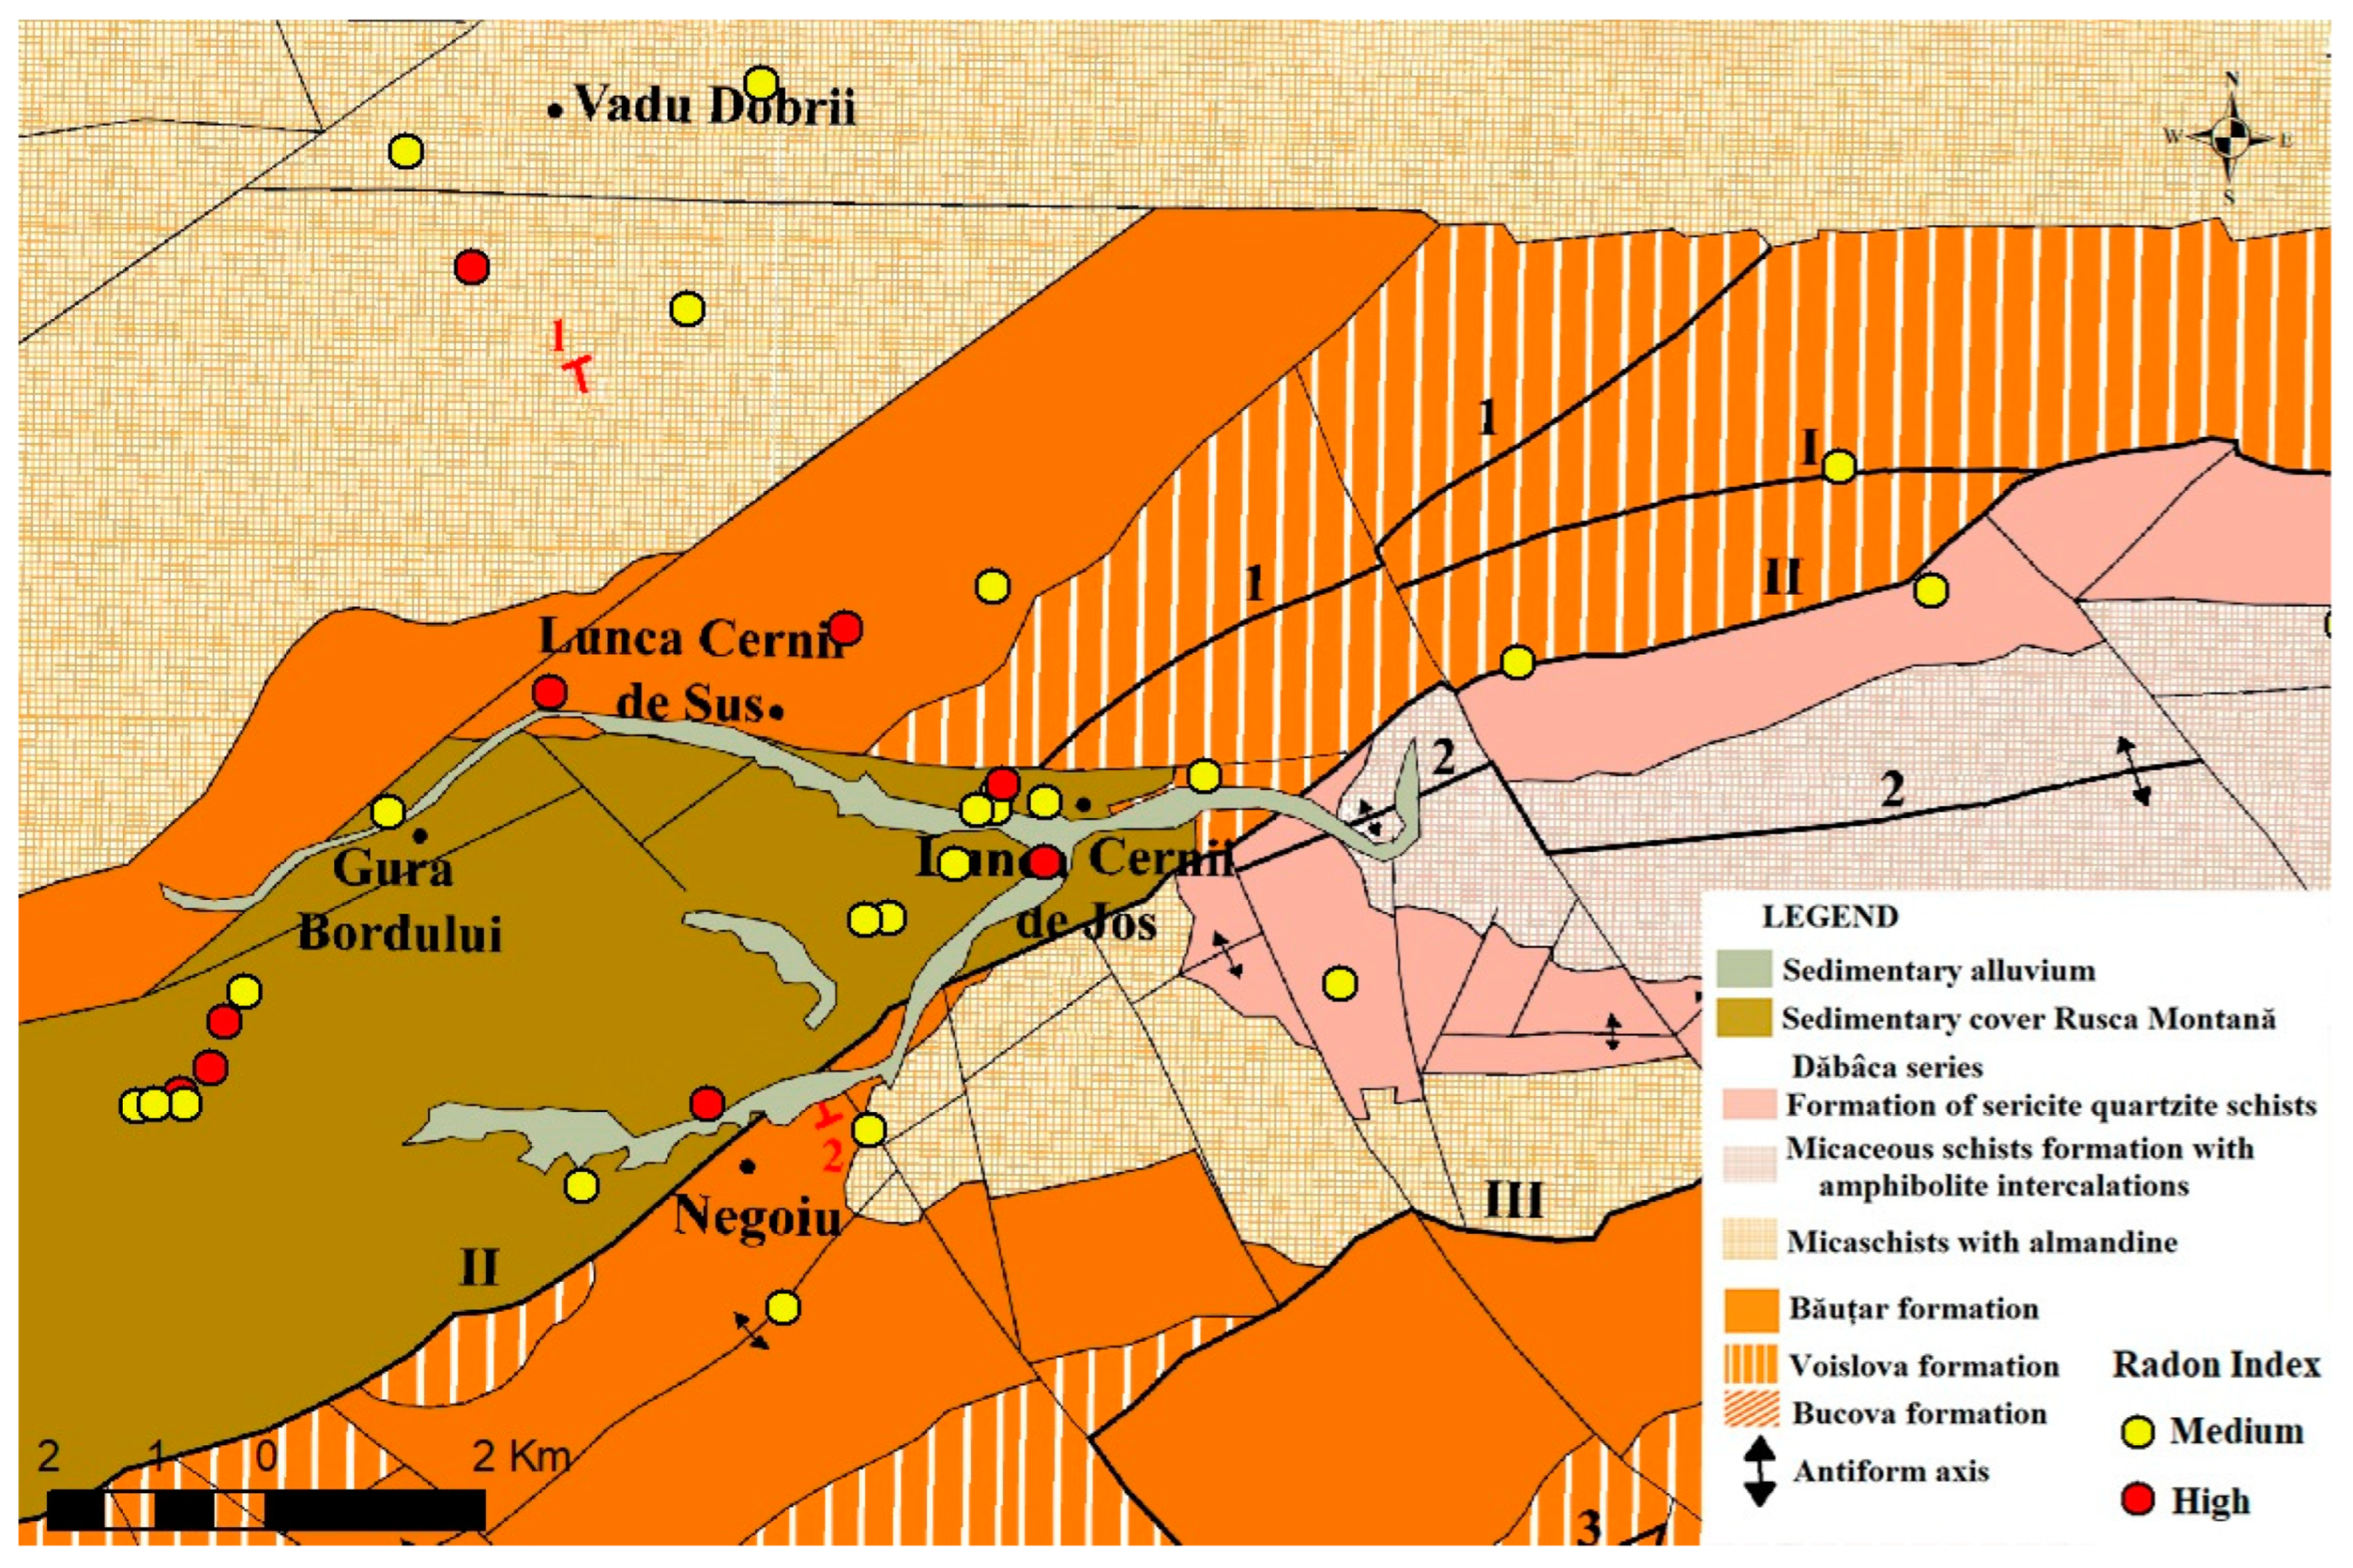
| Geological Unit | No. Meas. | Radon Concentration (kBq/m3) | Soil Permeability (m2) | GRP | |||||
|---|---|---|---|---|---|---|---|---|---|
| Min. | A.M. | Max. | A.M. | Min. | A.M. | Max. | CV(%) | ||
| Formation of sericitic quartzite schists with amphibolite intercalations (Dabaca series) | 2 | 15.6 | 27.5 | 62.2 | 2.53 × 10⁻¹² | 13 | 17 | 20 | 45 |
| Micaceous schists formation with amphibolite intercalations (Dabaca series) | 1 | 19.2 | 30.7 | 42.7 | 5.49 × 10⁻¹² | - | 29 | - | - |
| Micaschists with almandine (Sebes-Lotru series) | 5 | 21.2 | 34.8 | 53.2 | 4.38 × 10⁻¹² | 14 | 25 | 42 | 48 |
| Sedimentary cover Rusca Montana Dep. | 16 | 14.8 | 30.8 | 54.5 | 7.95 × 10⁻¹² | 11 | 33 | 90 | 53 |
| Sedimentary alluvium | 3 | 17 | 35.2 | 56.8 | 5.33 × 10⁻¹² | 27 | 31 | 39 | 55 |
| Bautar Formation | 4 | 26.7 | 37.9 | 54.1 | 1.26 × 10⁻¹¹ | 25 | 40 | 67 | 28 |
| Voislova Formation | 3 | 12.3 | 25.0 | 40.8 | 1.20 × 10⁻¹¹ | 26 | 30 | 33 | 44 |
Disclaimer/Publisher’s Note: The statements, opinions and data contained in all publications are solely those of the individual author(s) and contributor(s) and not of MDPI and/or the editor(s). MDPI and/or the editor(s) disclaim responsibility for any injury to people or property resulting from any ideas, methods, instructions or products referred to in the content. |
© 2023 by the authors. Licensee MDPI, Basel, Switzerland. This article is an open access article distributed under the terms and conditions of the Creative Commons Attribution (CC BY) license (https://creativecommons.org/licenses/by/4.0/).
Share and Cite
Lupulescu, A.; Baciu, C.; Dicu, T.; Burghele, B.-D.; Cucoș, A.L. Determining the Geogenic Radon Potential in Different Layouts and Numbers of Points. Atmosphere 2023, 14, 713. https://doi.org/10.3390/atmos14040713
Lupulescu A, Baciu C, Dicu T, Burghele B-D, Cucoș AL. Determining the Geogenic Radon Potential in Different Layouts and Numbers of Points. Atmosphere. 2023; 14(4):713. https://doi.org/10.3390/atmos14040713
Chicago/Turabian StyleLupulescu, Alexandru, Călin Baciu, Tiberius Dicu, Bety-Denissa Burghele, and Alexandra Laura Cucoș. 2023. "Determining the Geogenic Radon Potential in Different Layouts and Numbers of Points" Atmosphere 14, no. 4: 713. https://doi.org/10.3390/atmos14040713