
Understanding the Susceptibility of the Tropical Proglacial Environment in Peru Using Optical Imagery and Radon Measurements


Abstract
:1. Introduction
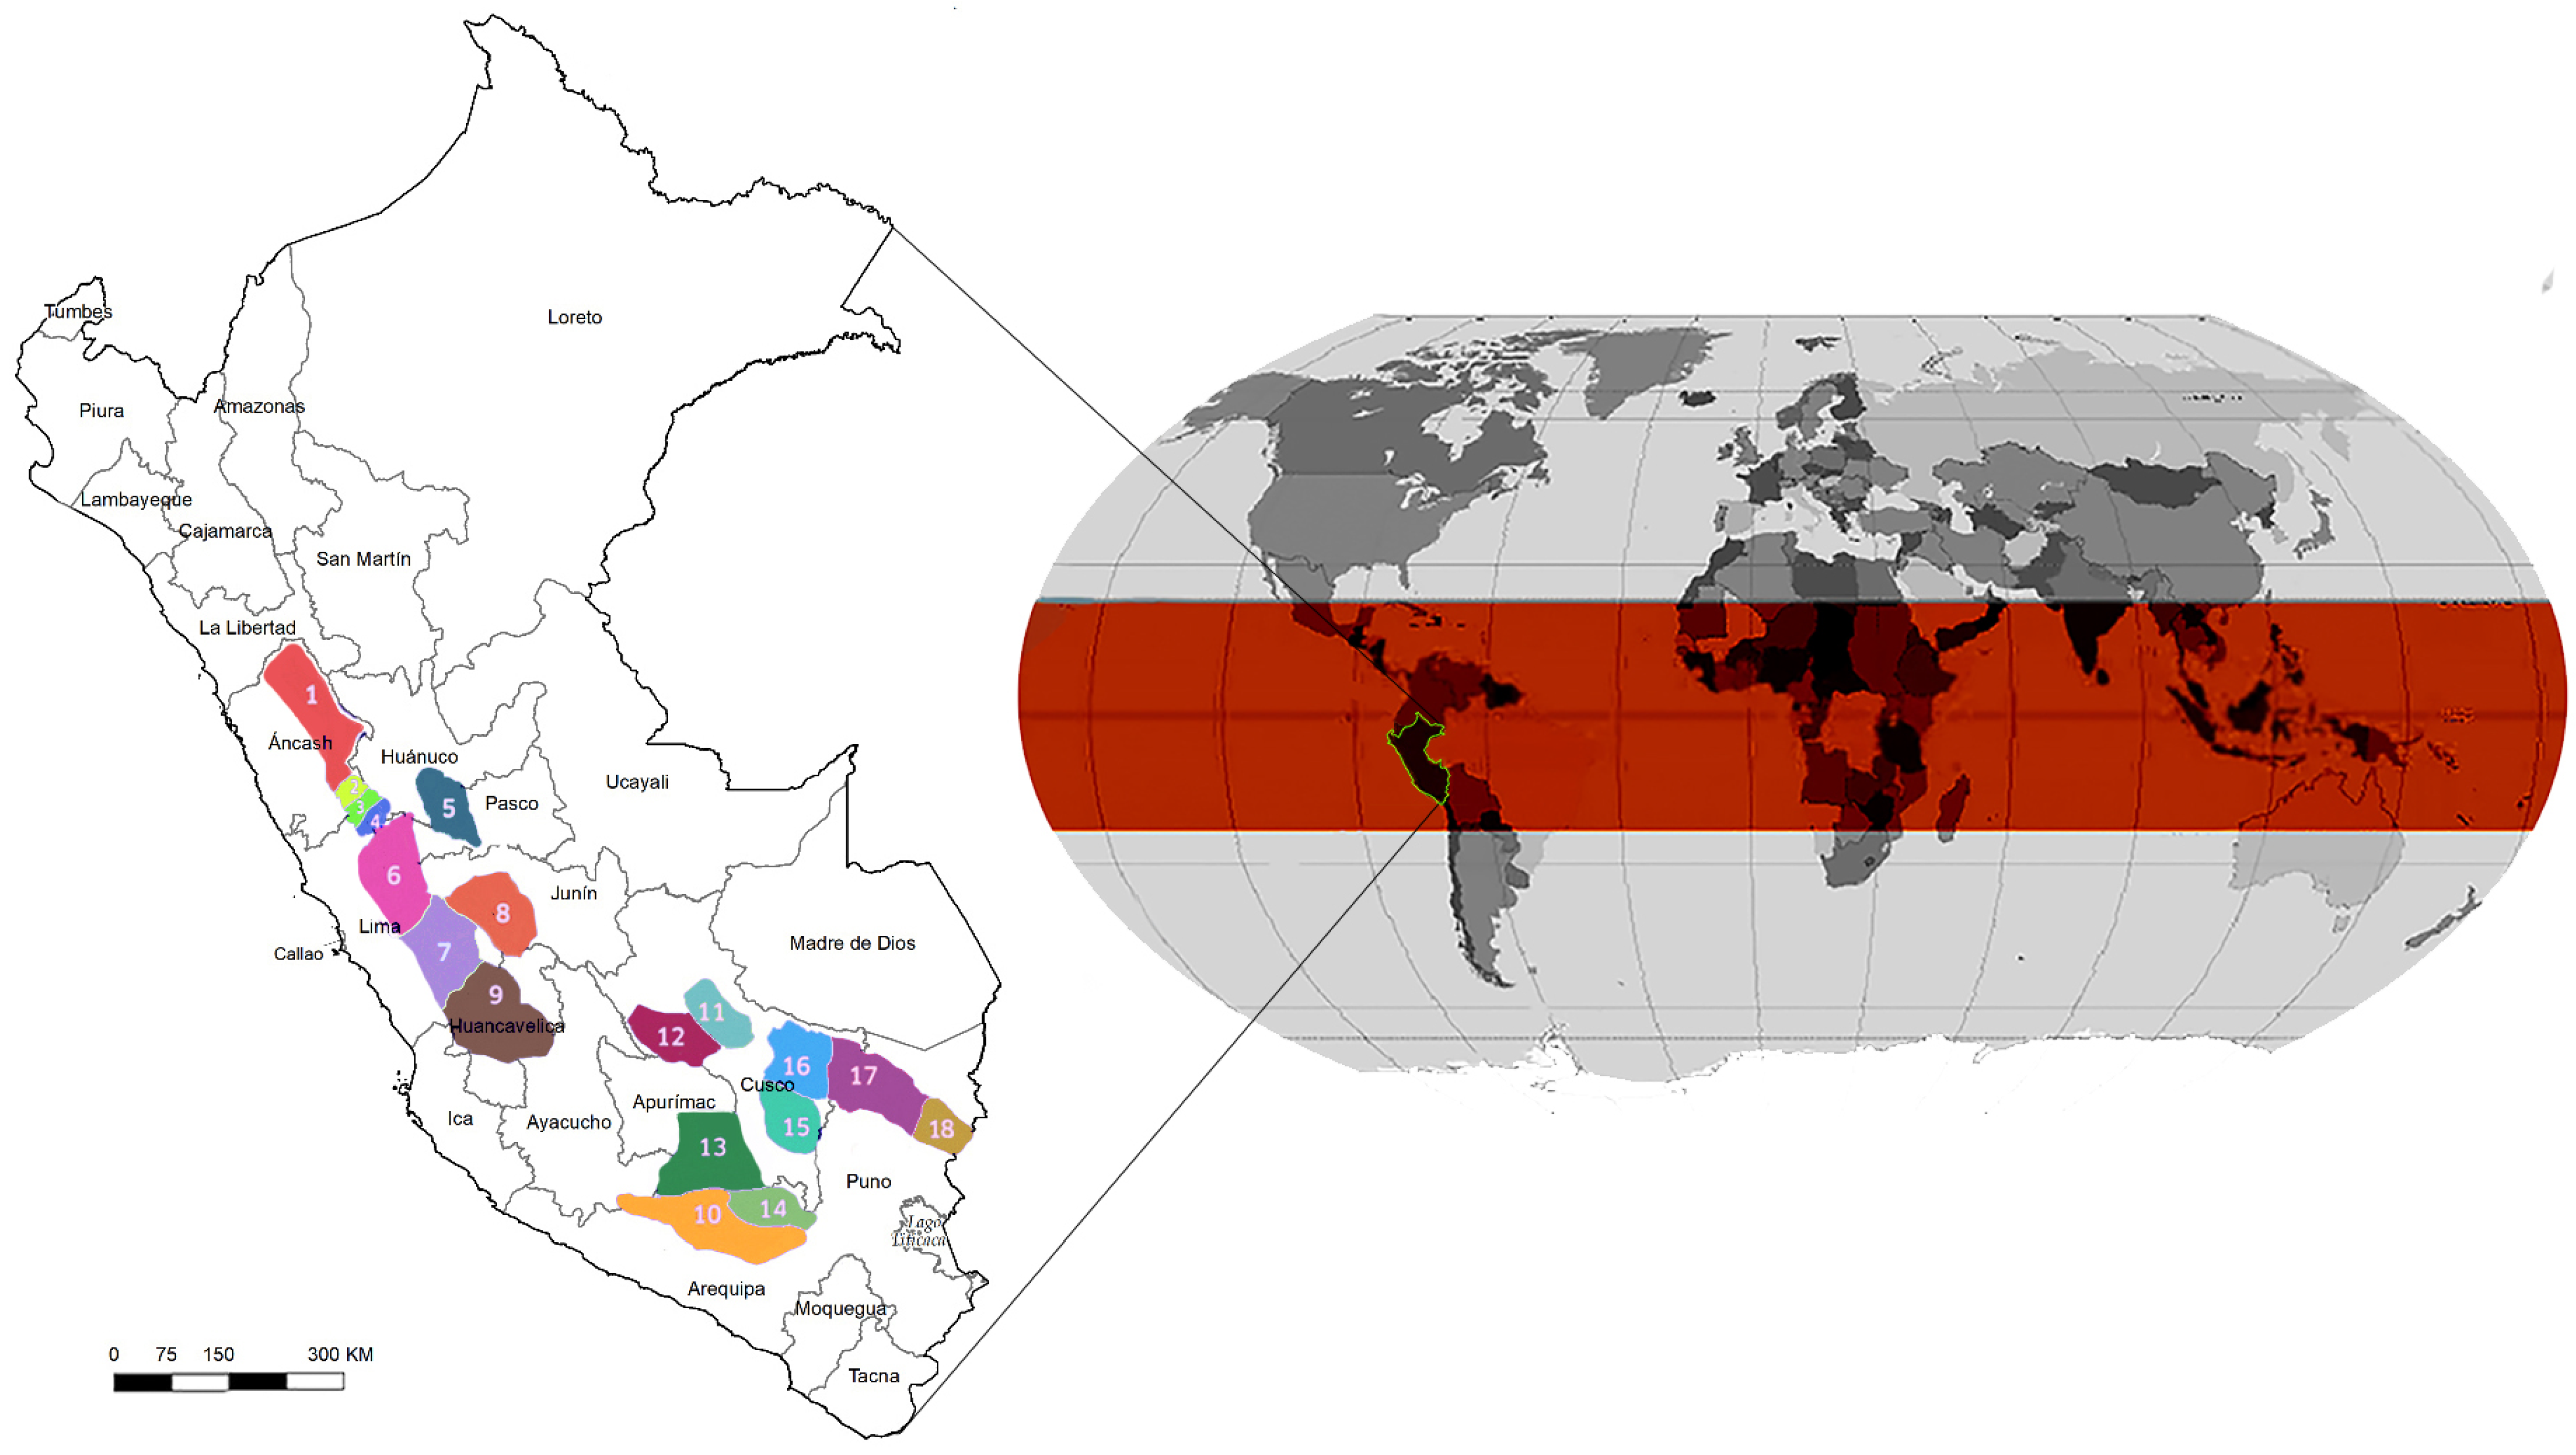
2. Study Area
2.1. Tropical Zone
2.2. Proglacial Lakes with Potential to Cause GLOFs
- A sudden release of water.
- Happens very quickly.
- Rising waters lead to large downstream discharges.
2.3. Proglacial Environment
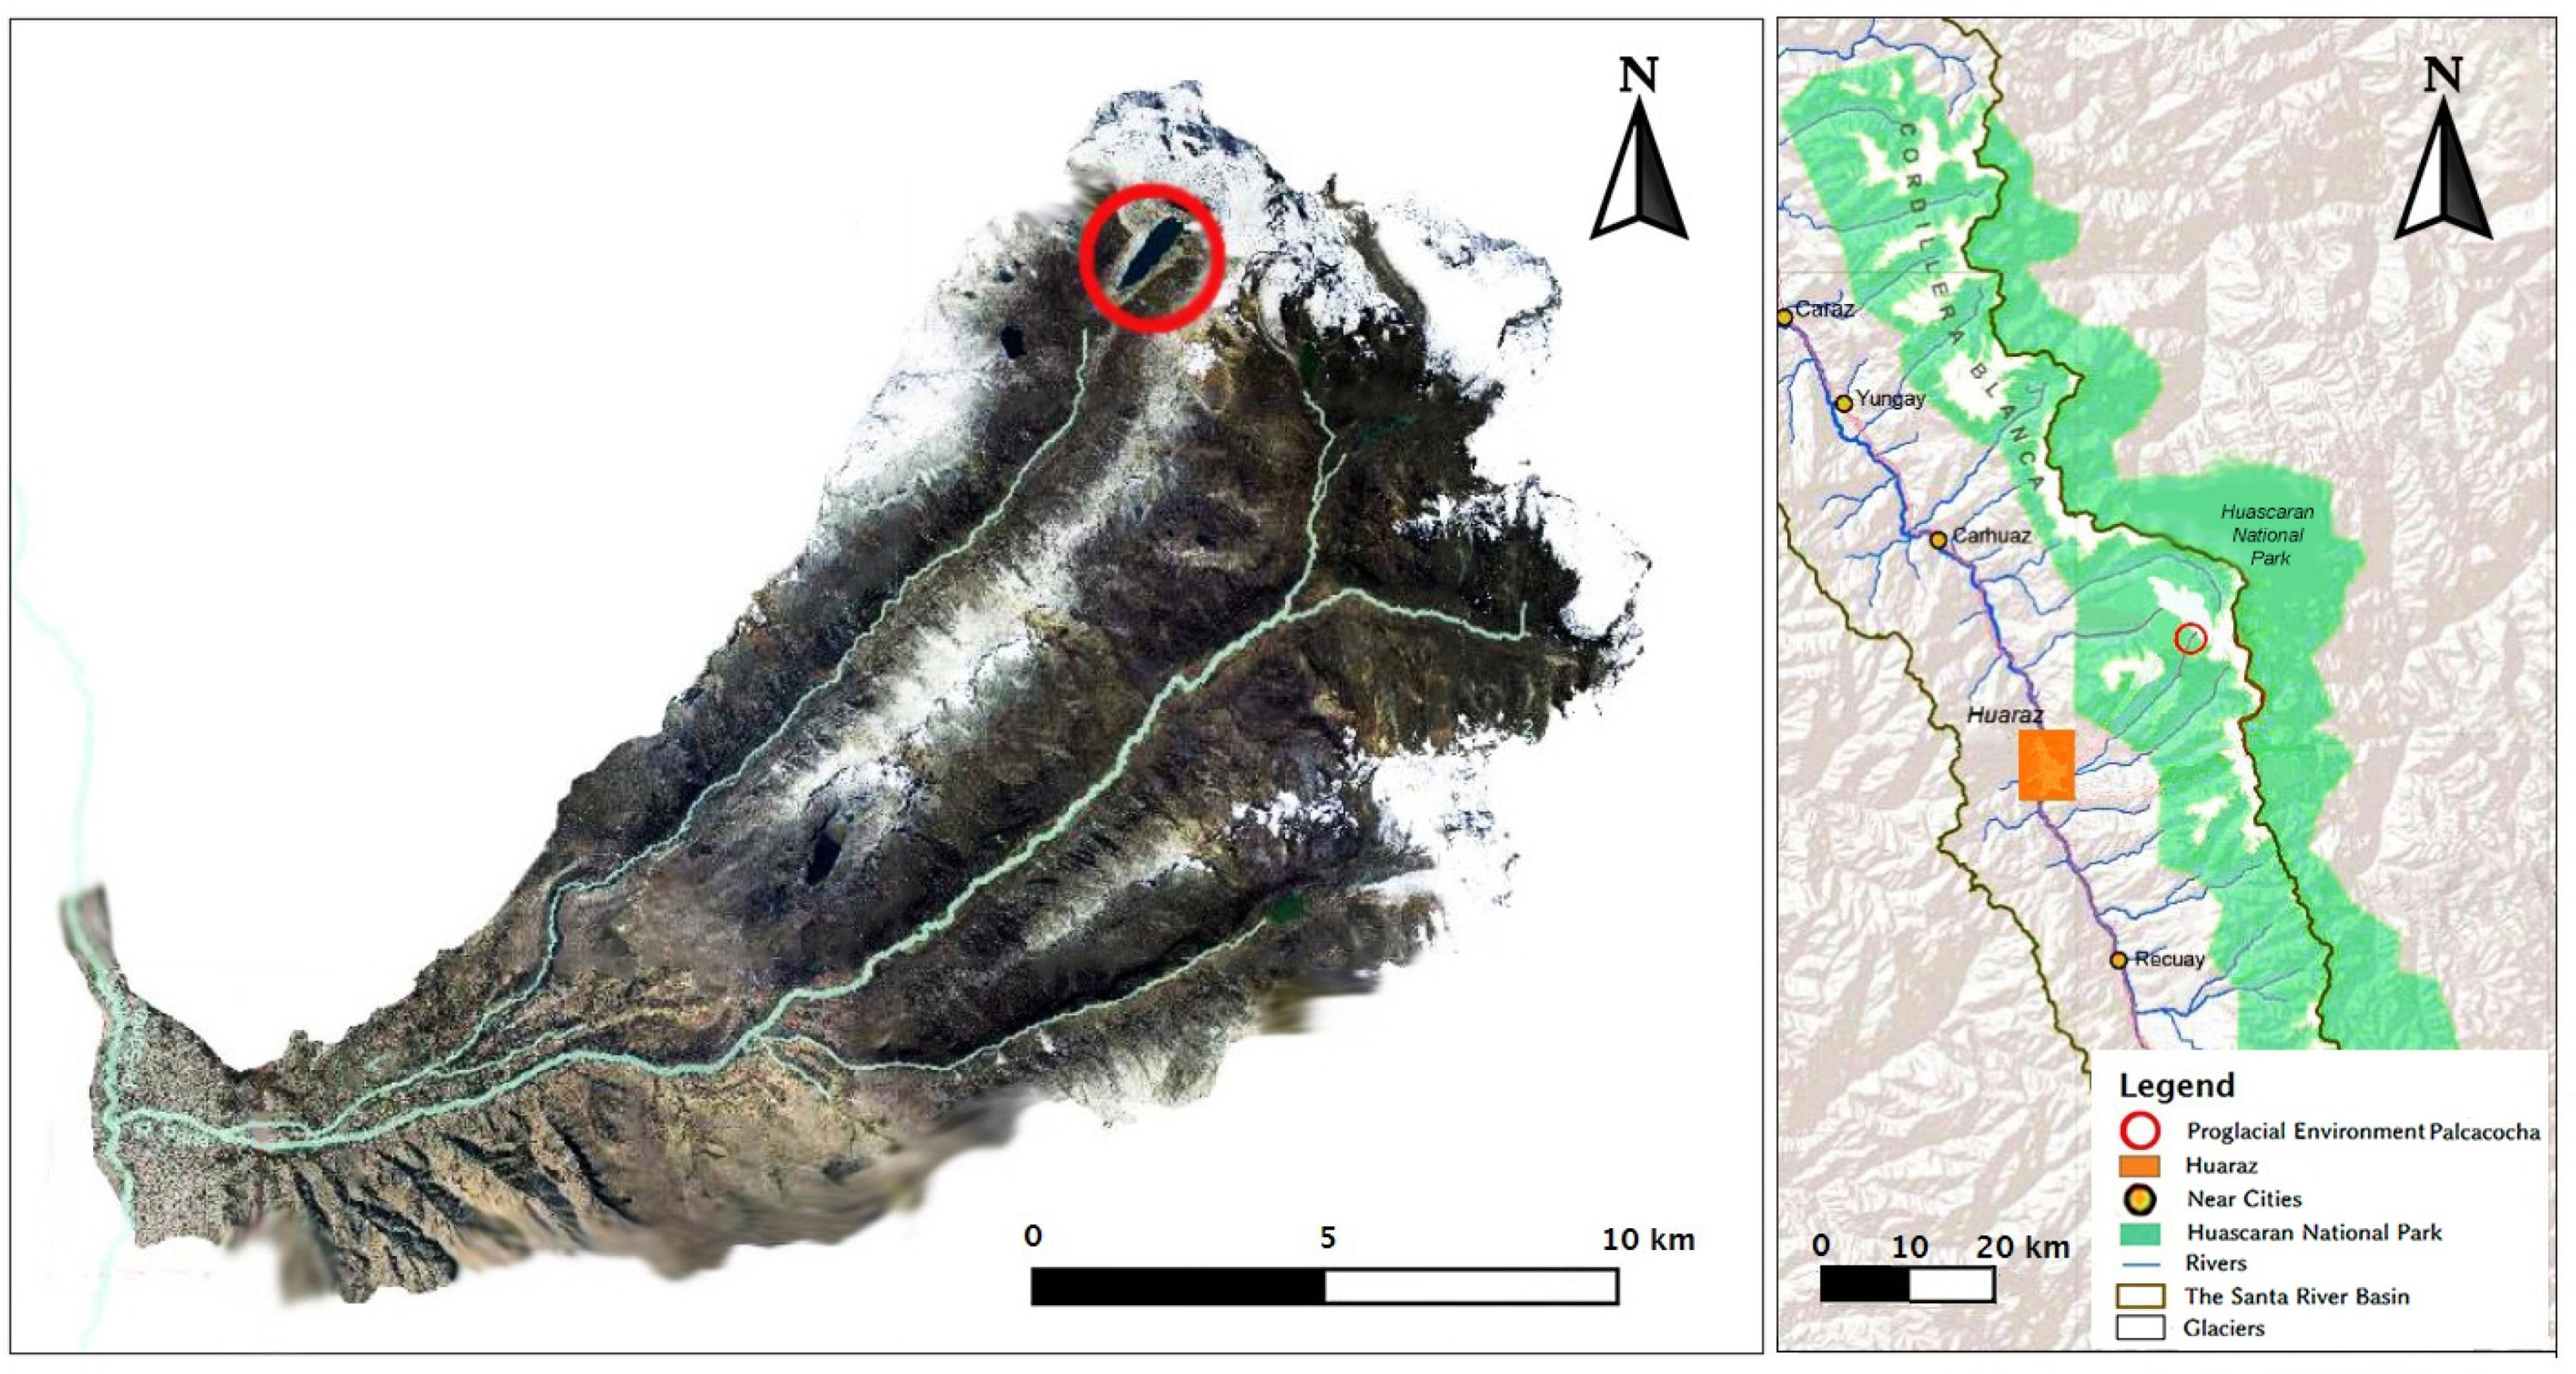
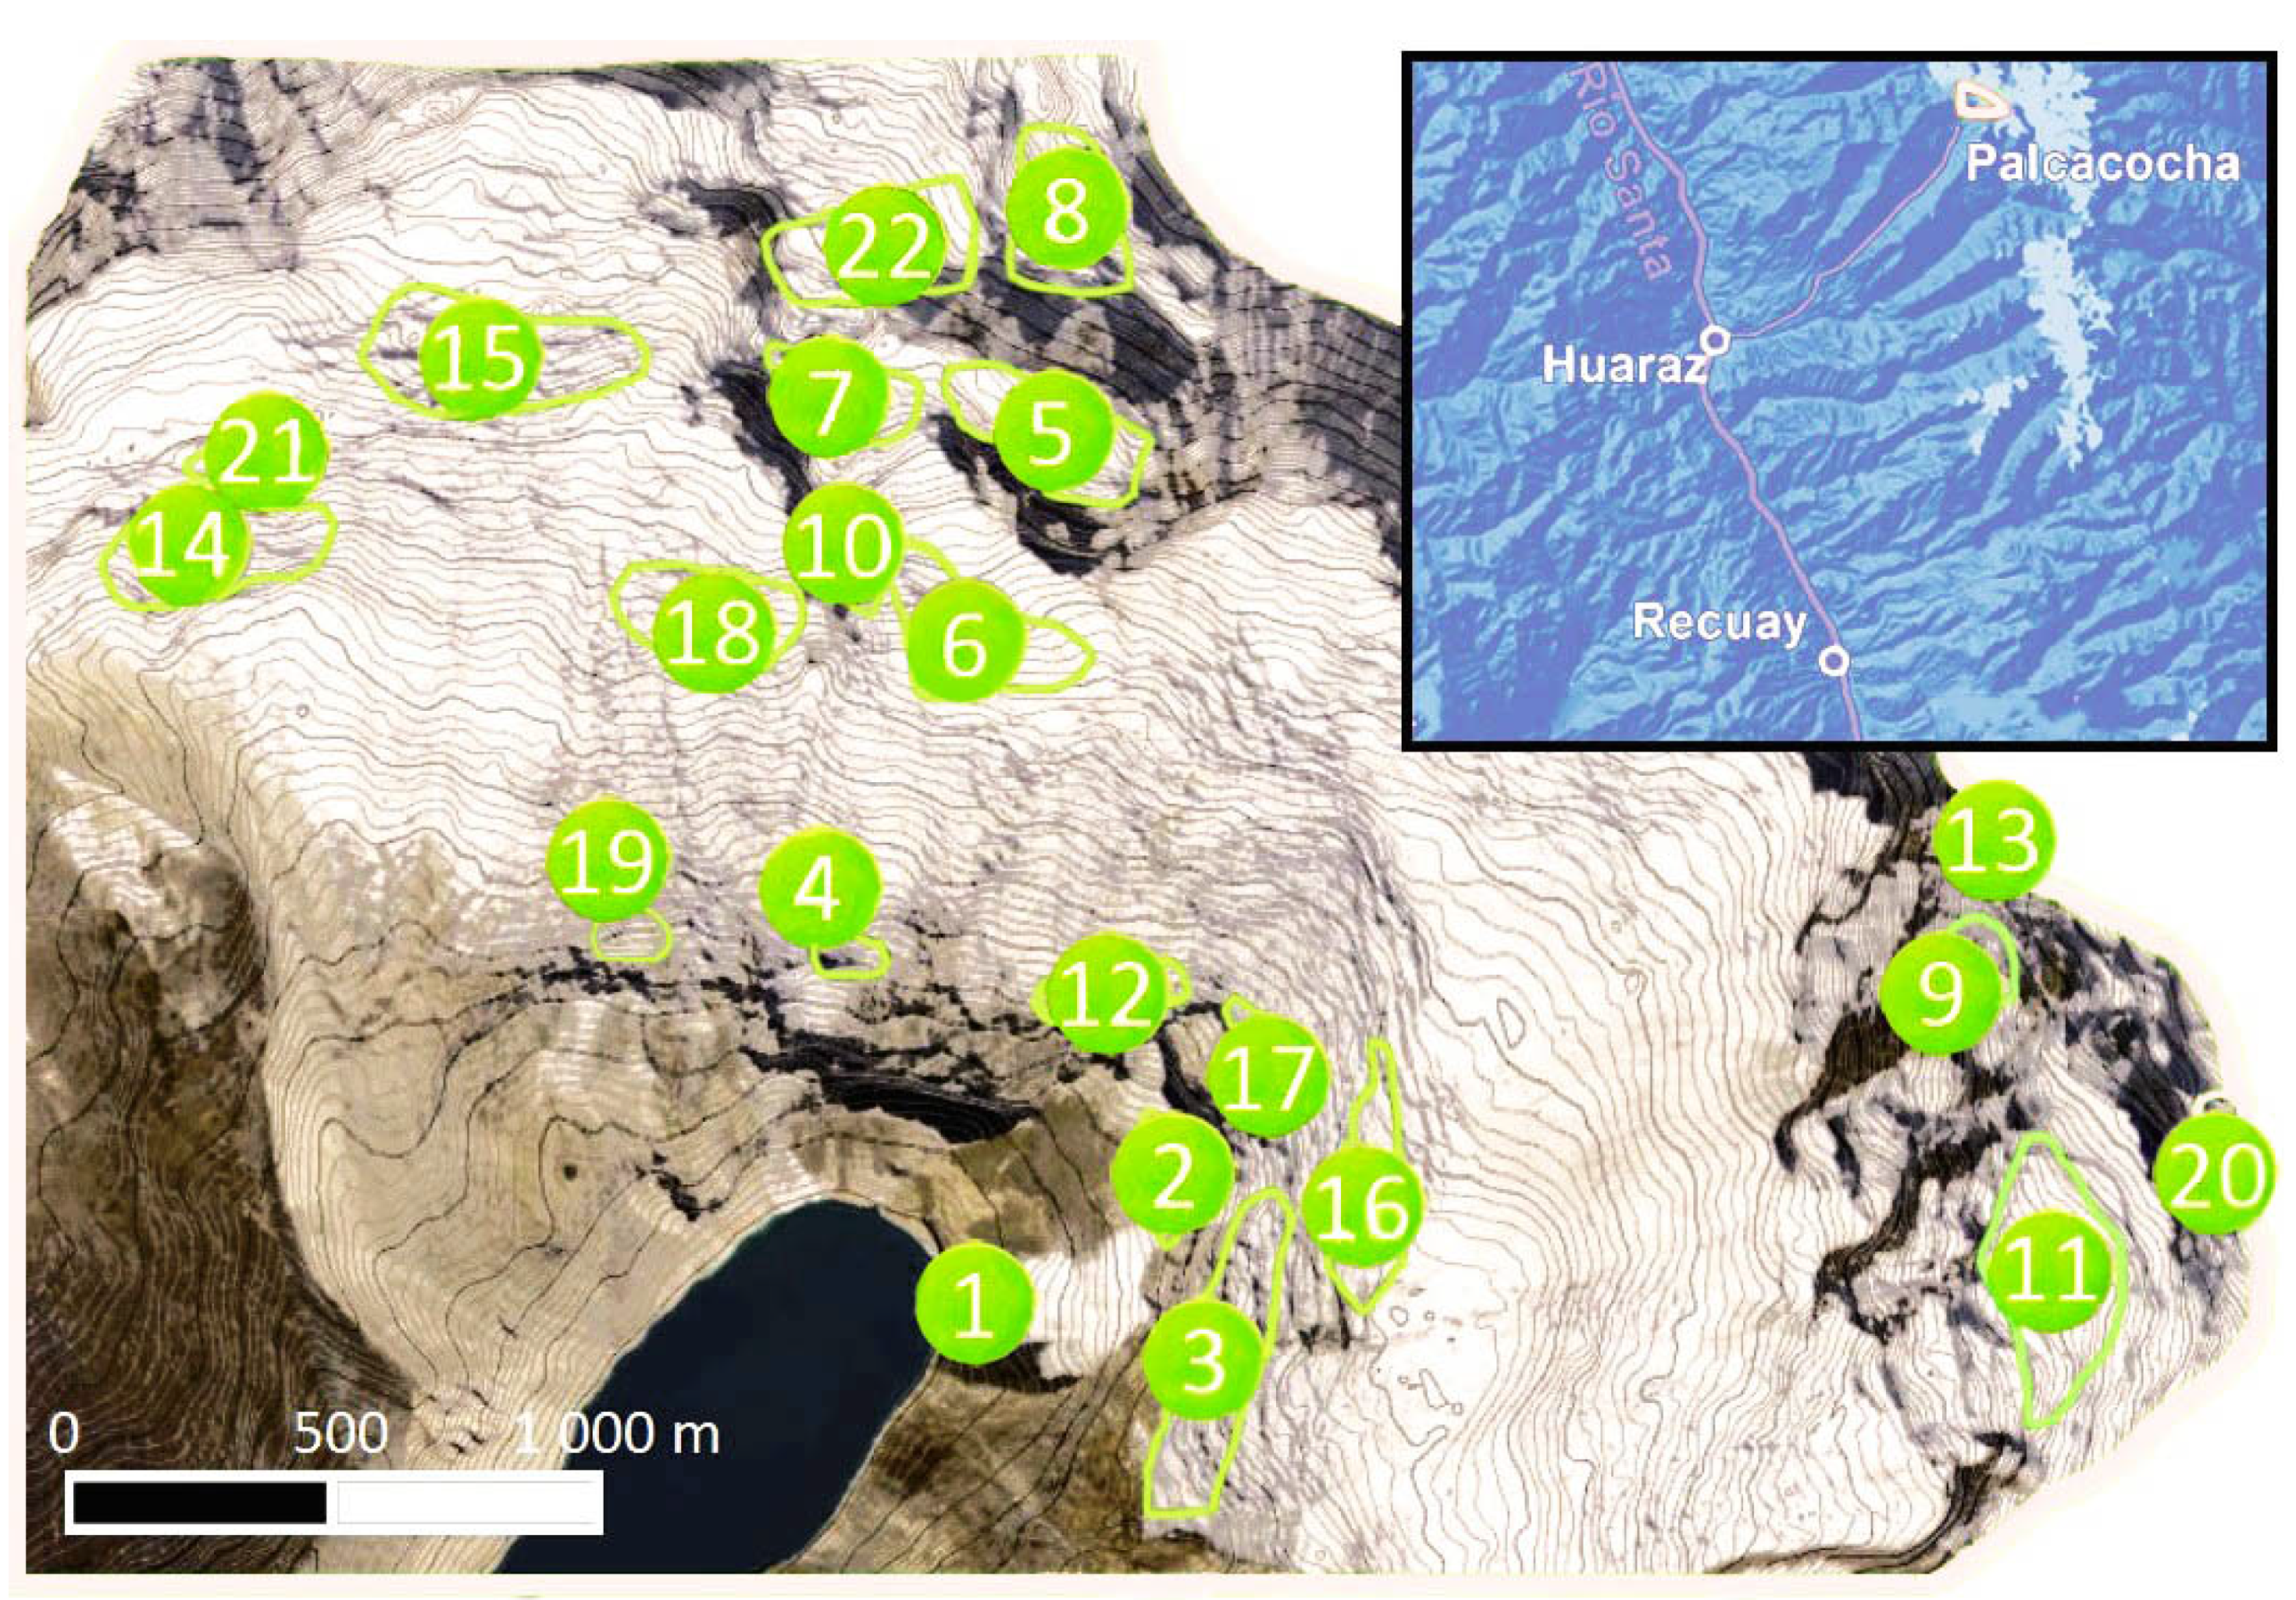
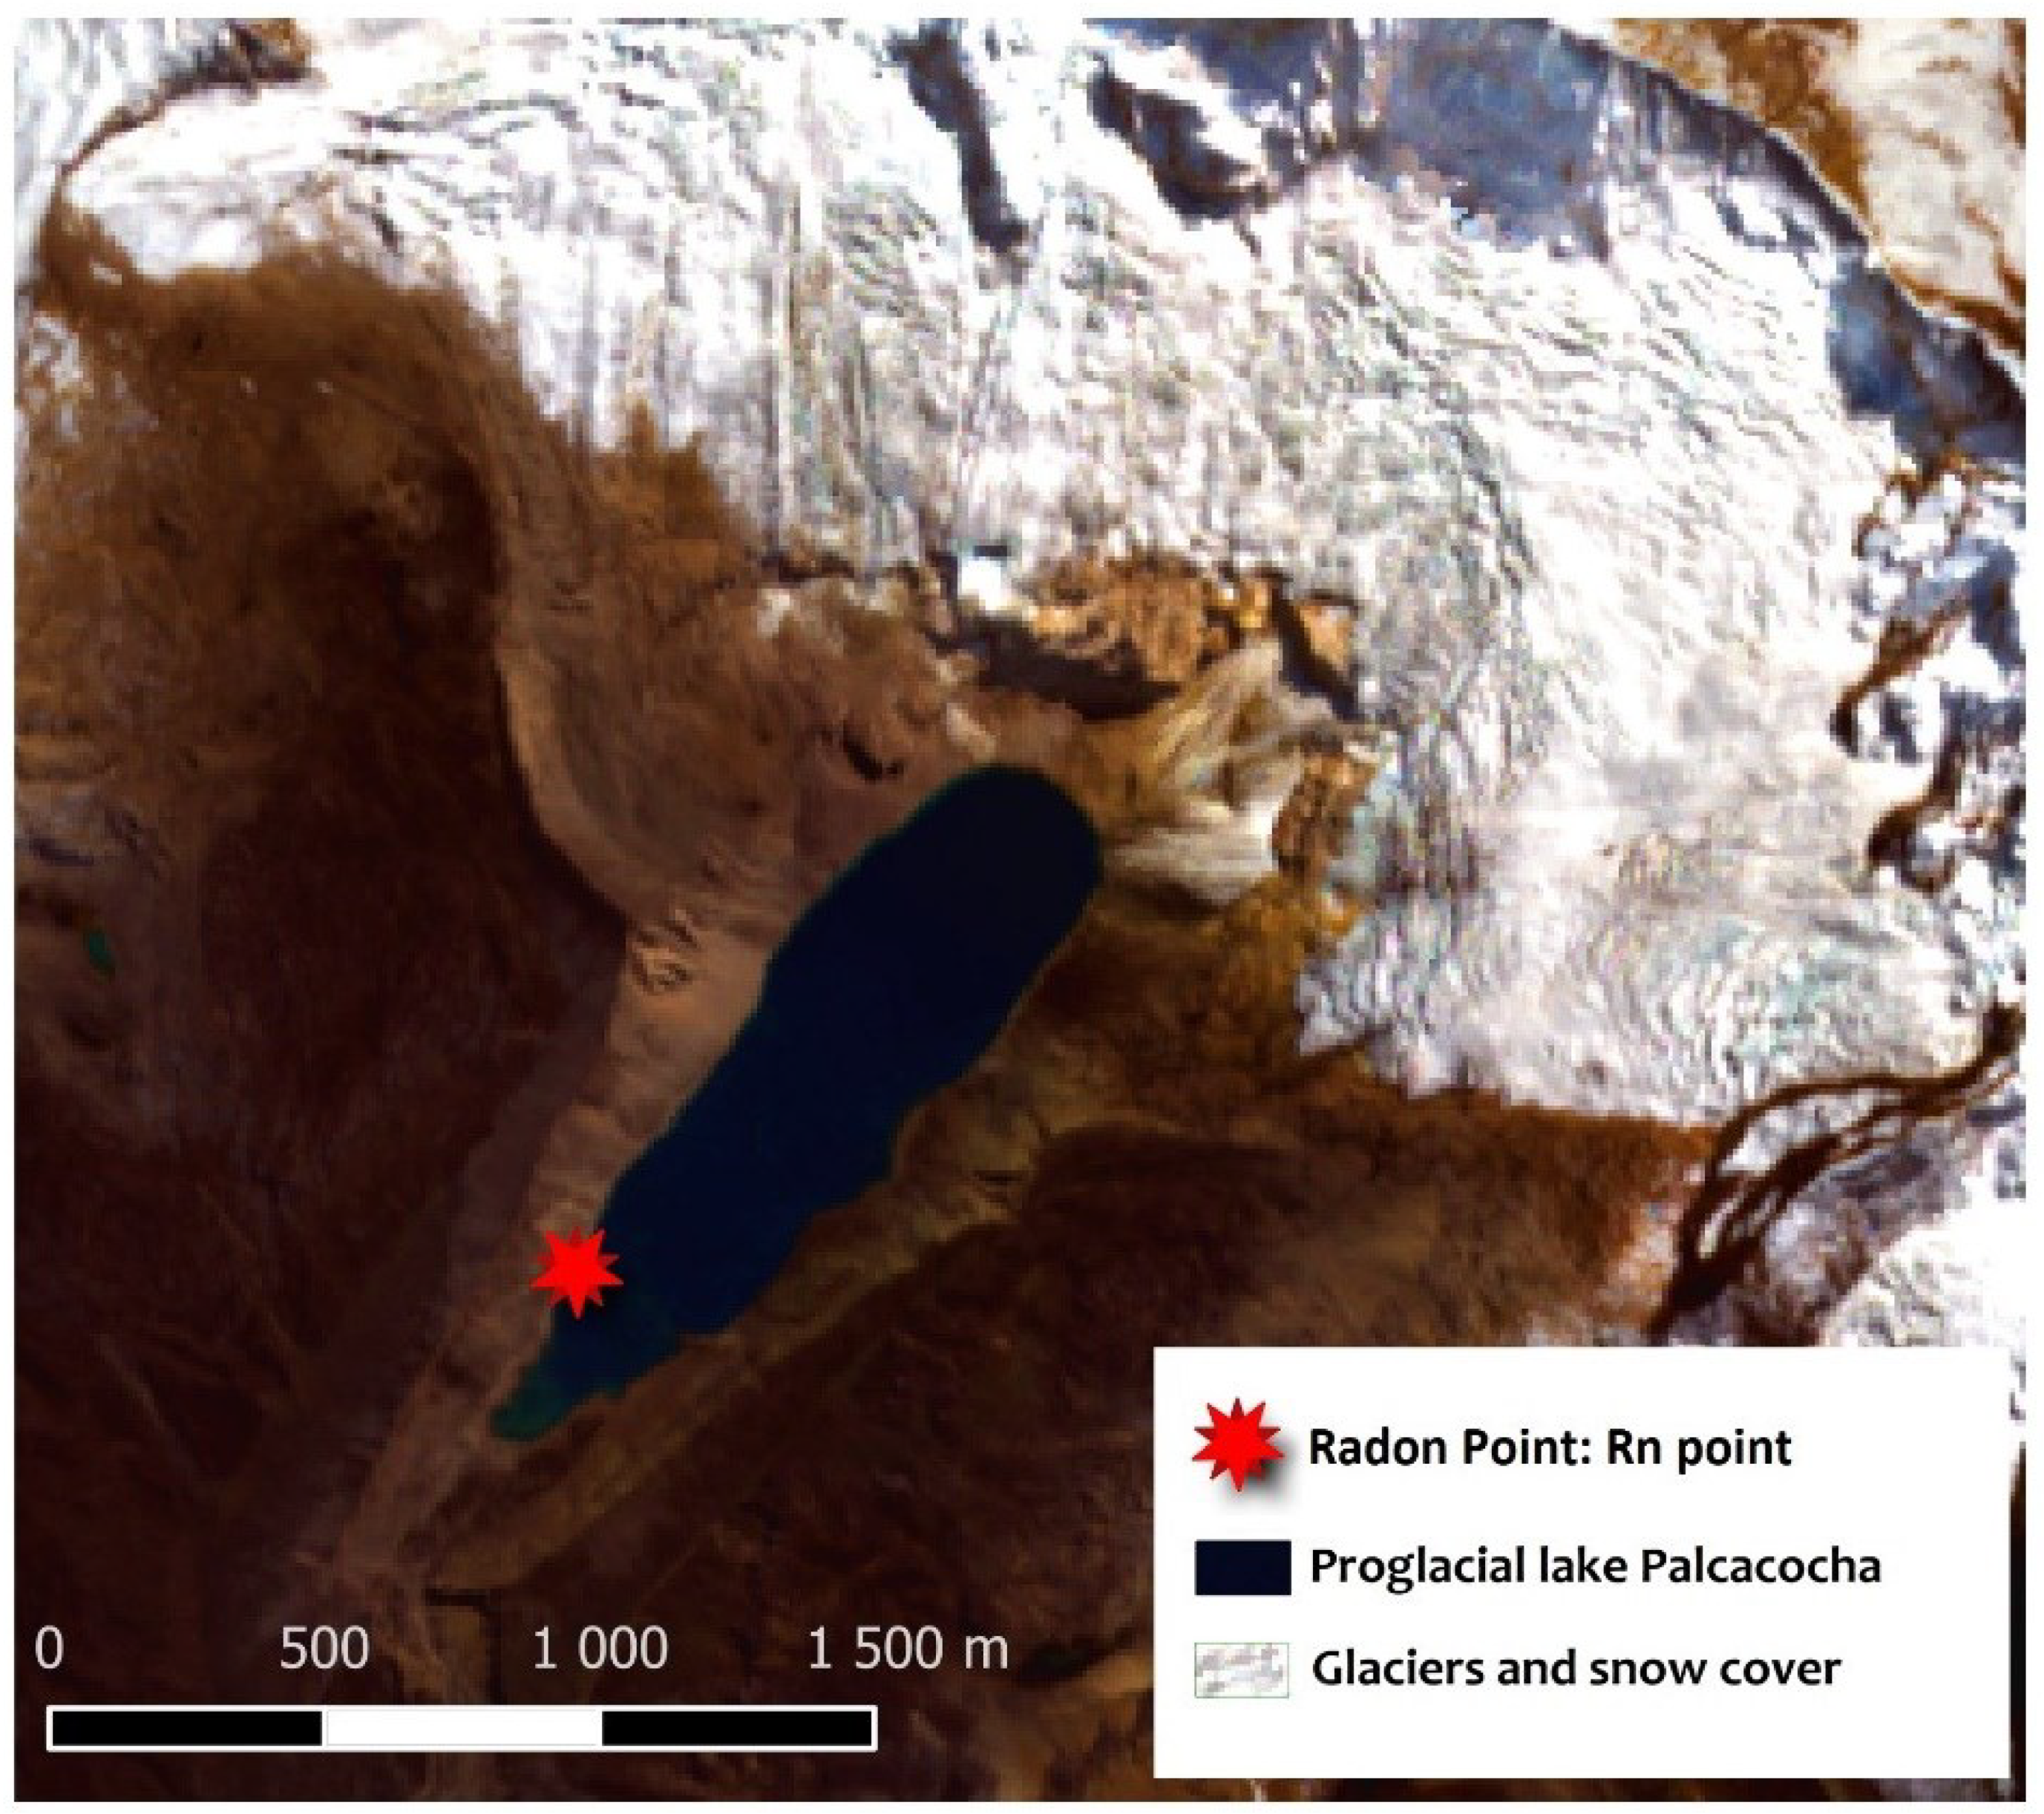
2.4. Palcacocha
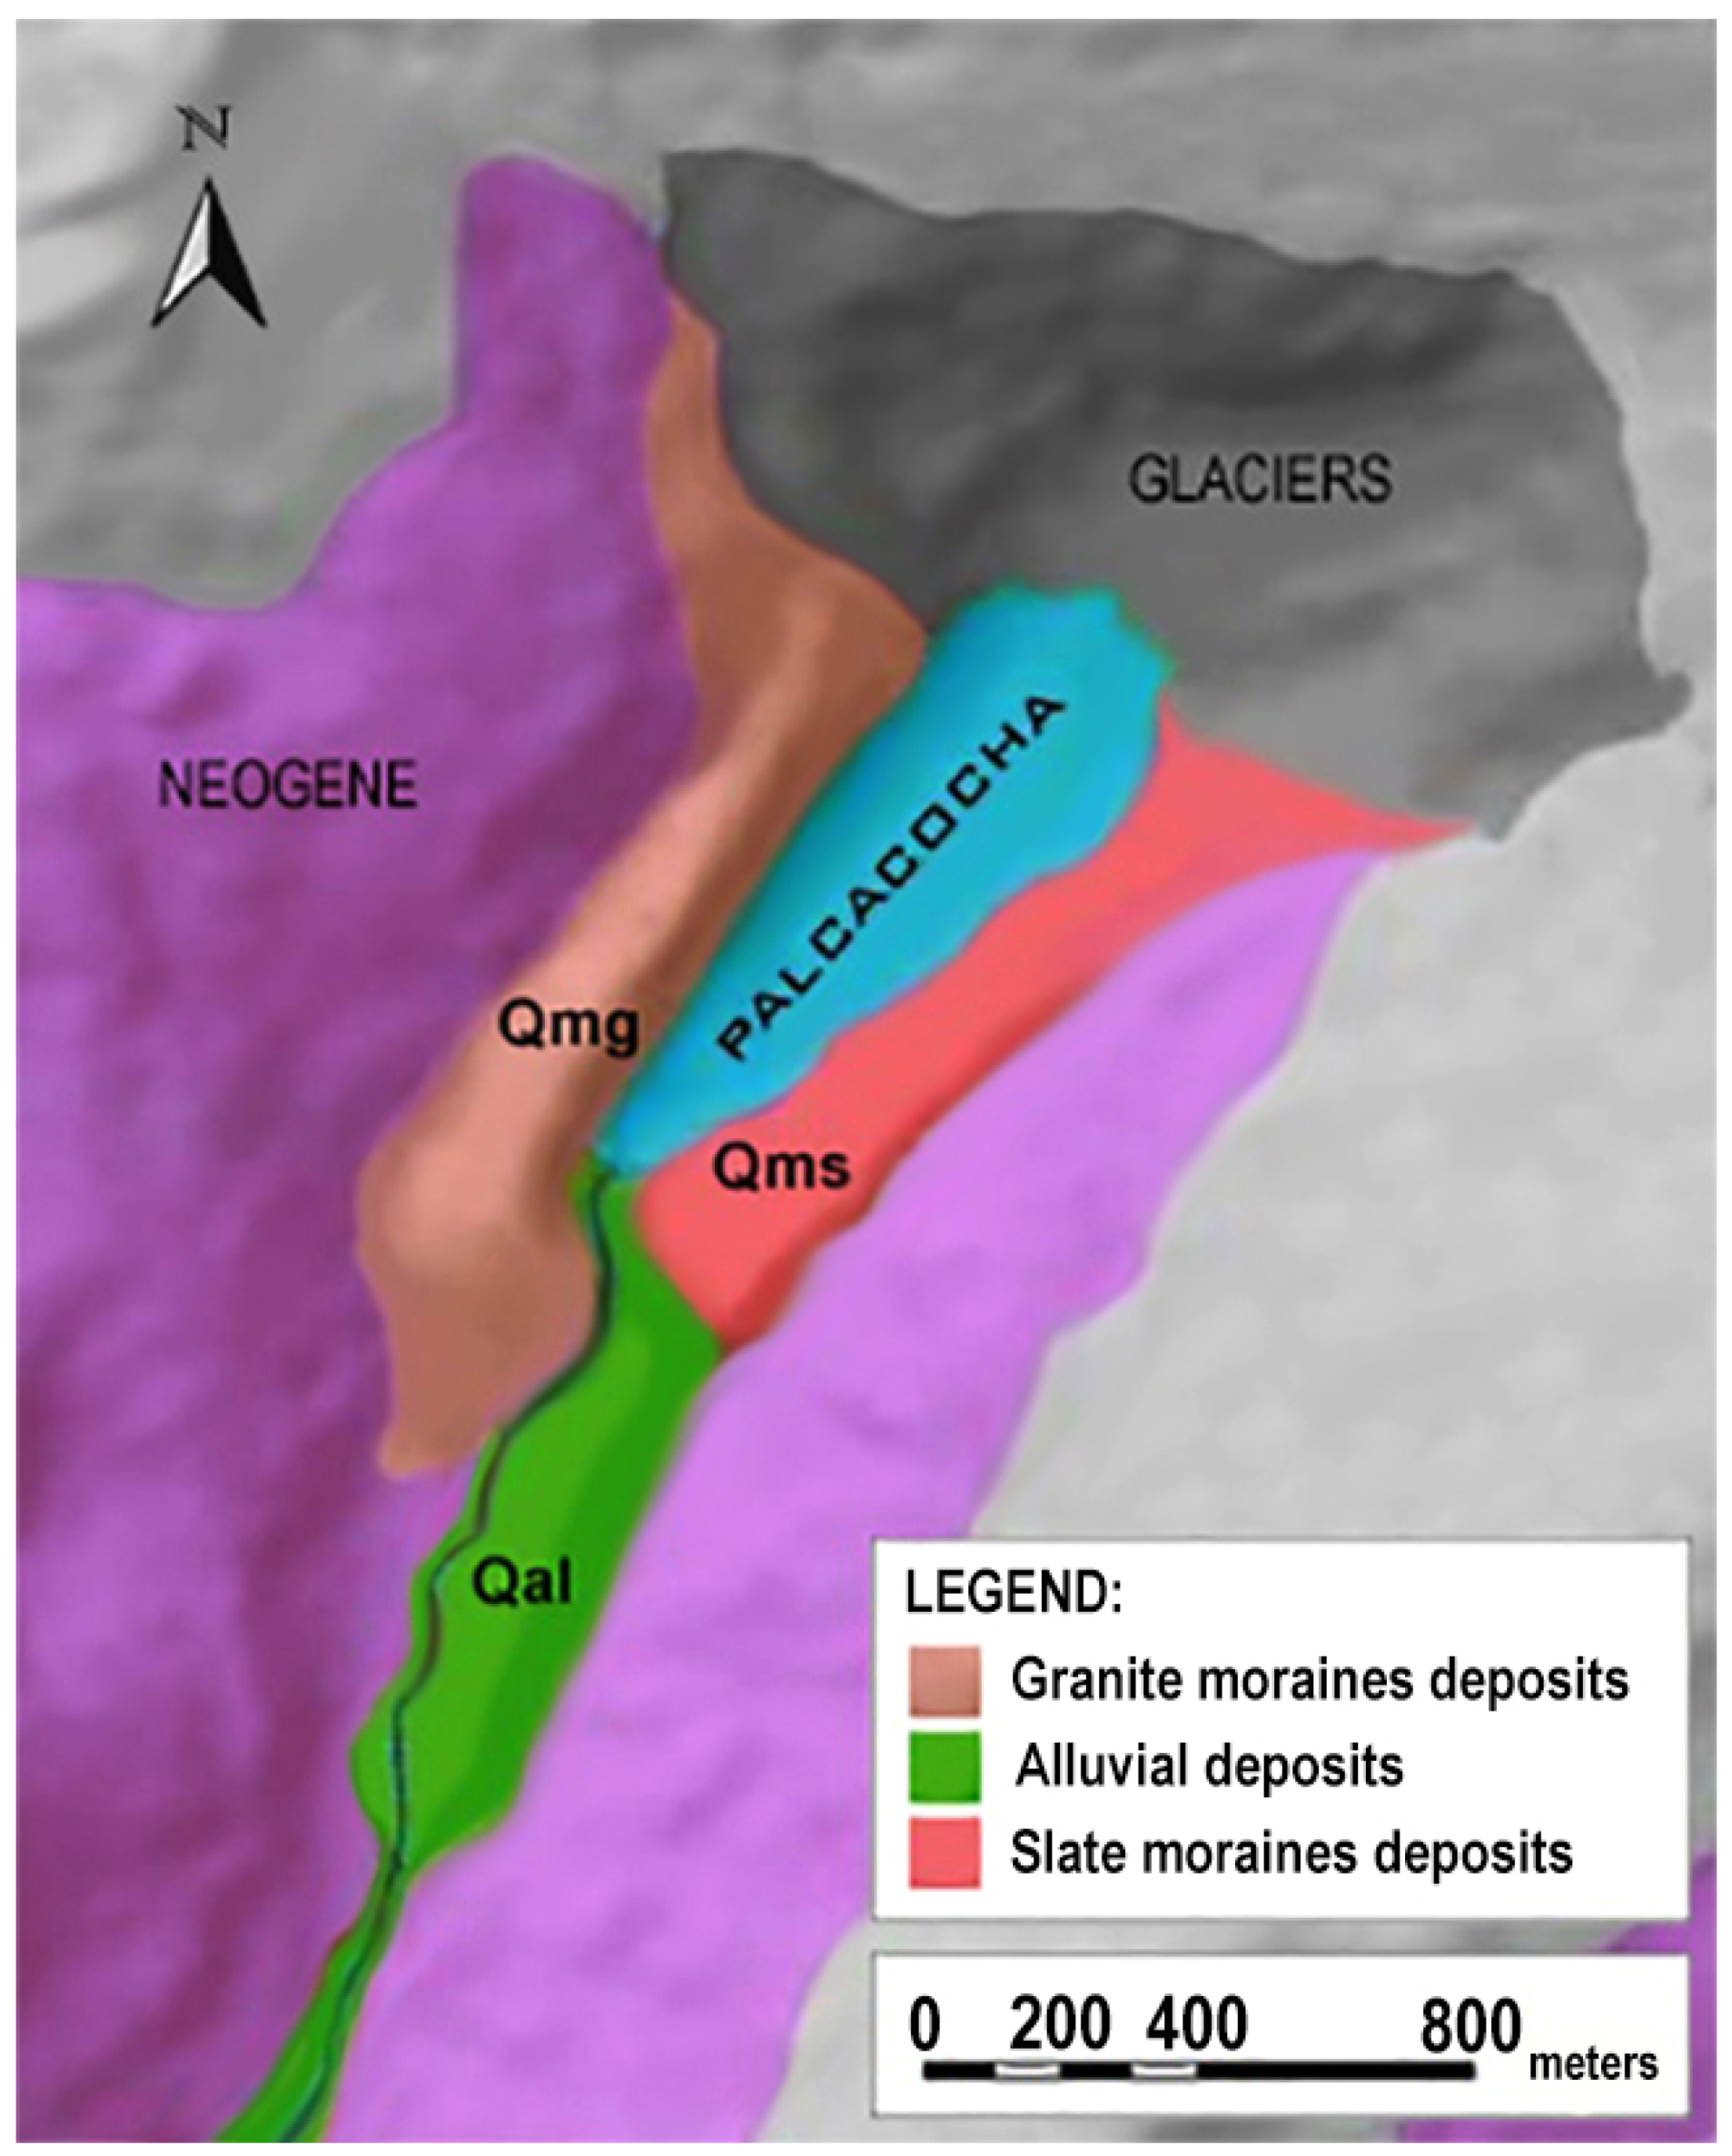
2.5. Geology
3. Methodology
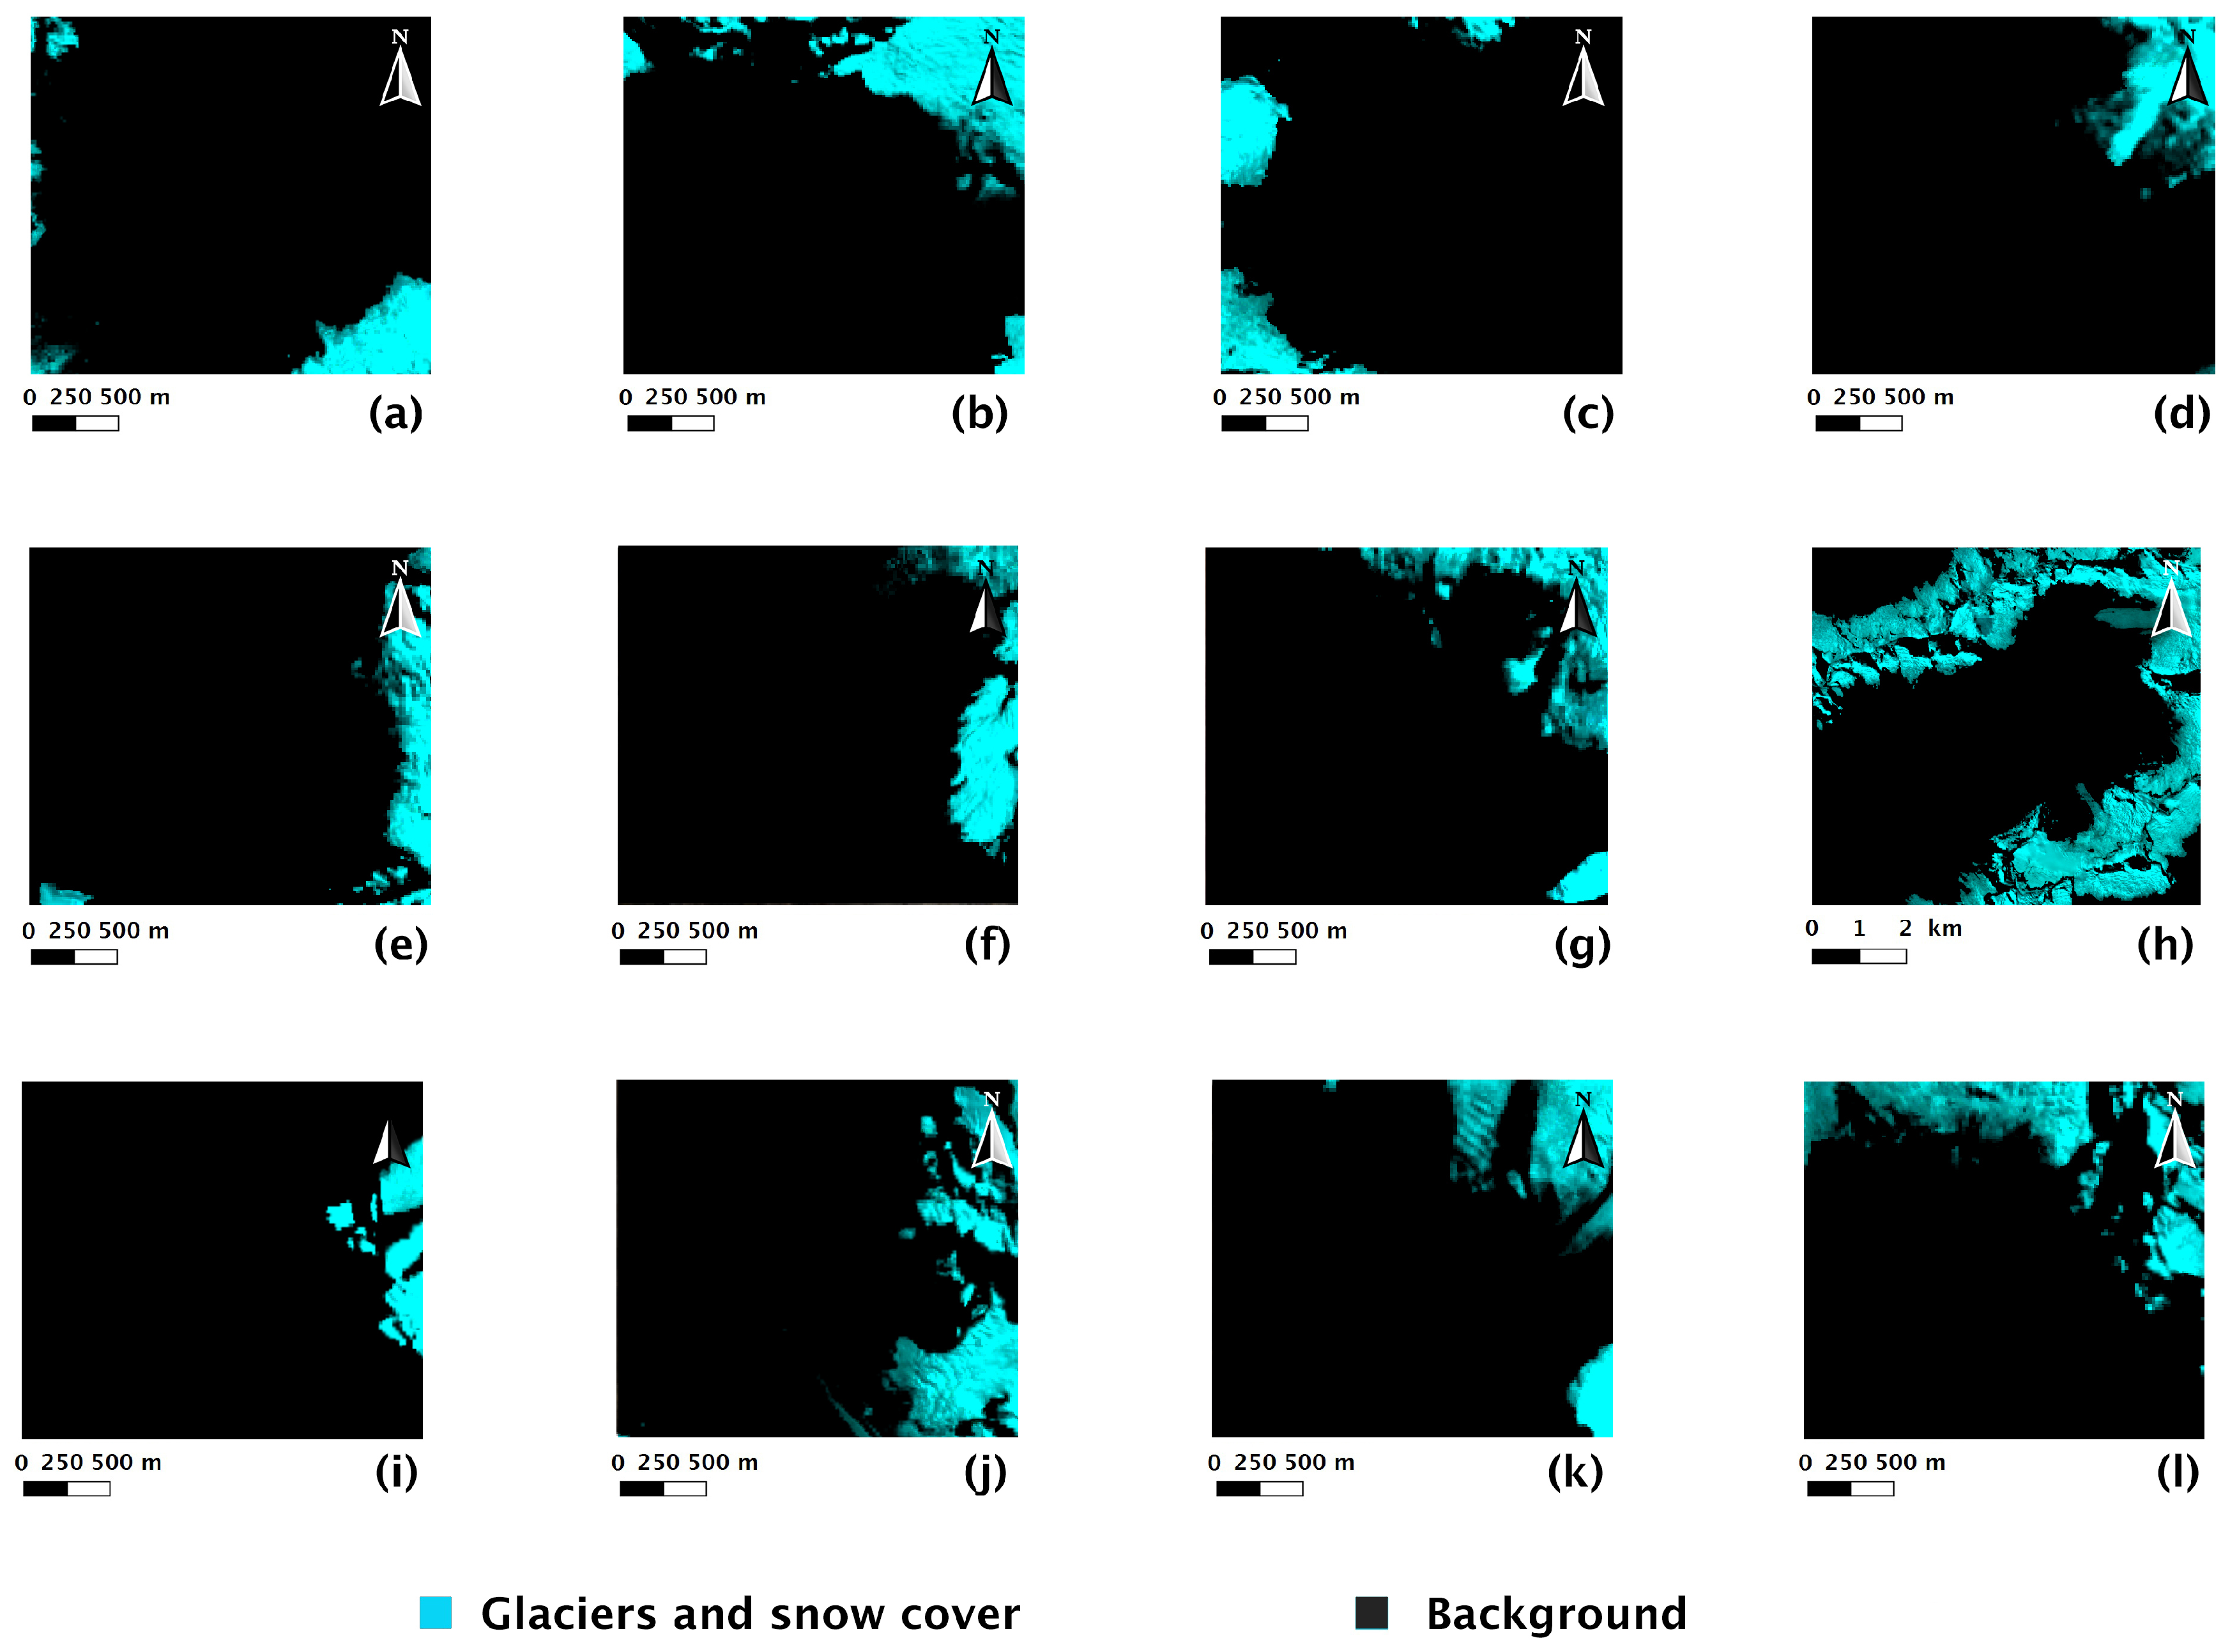
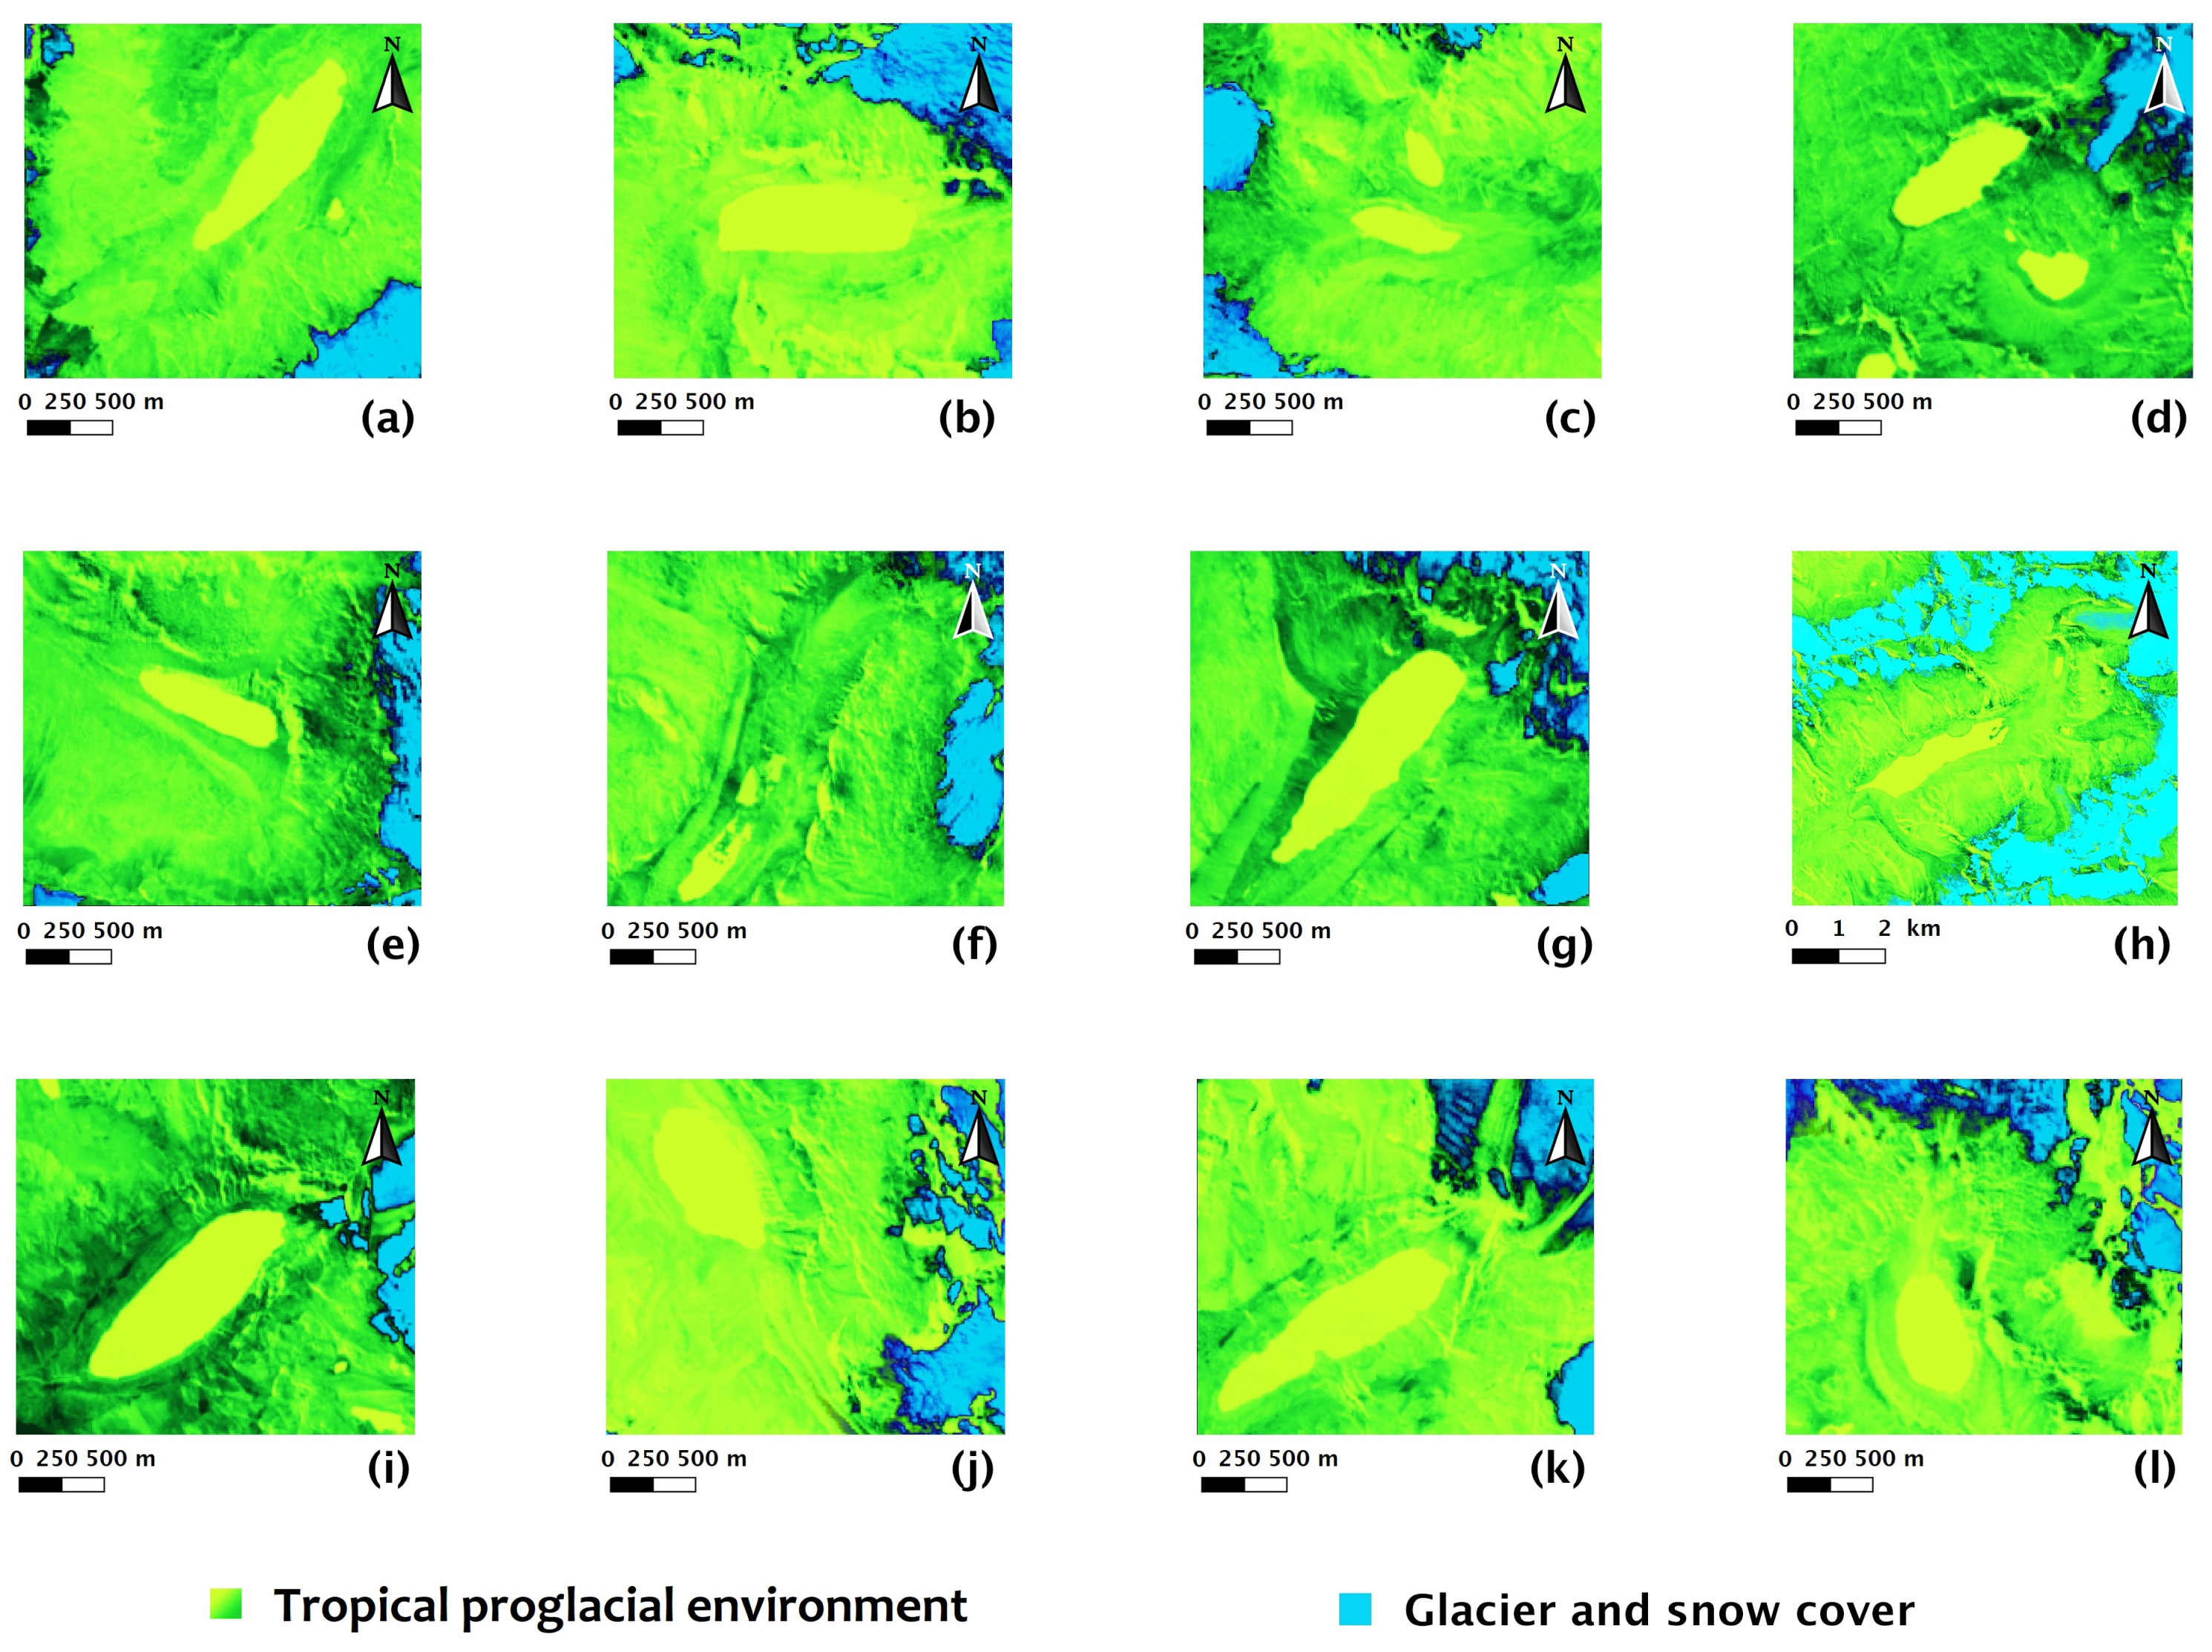
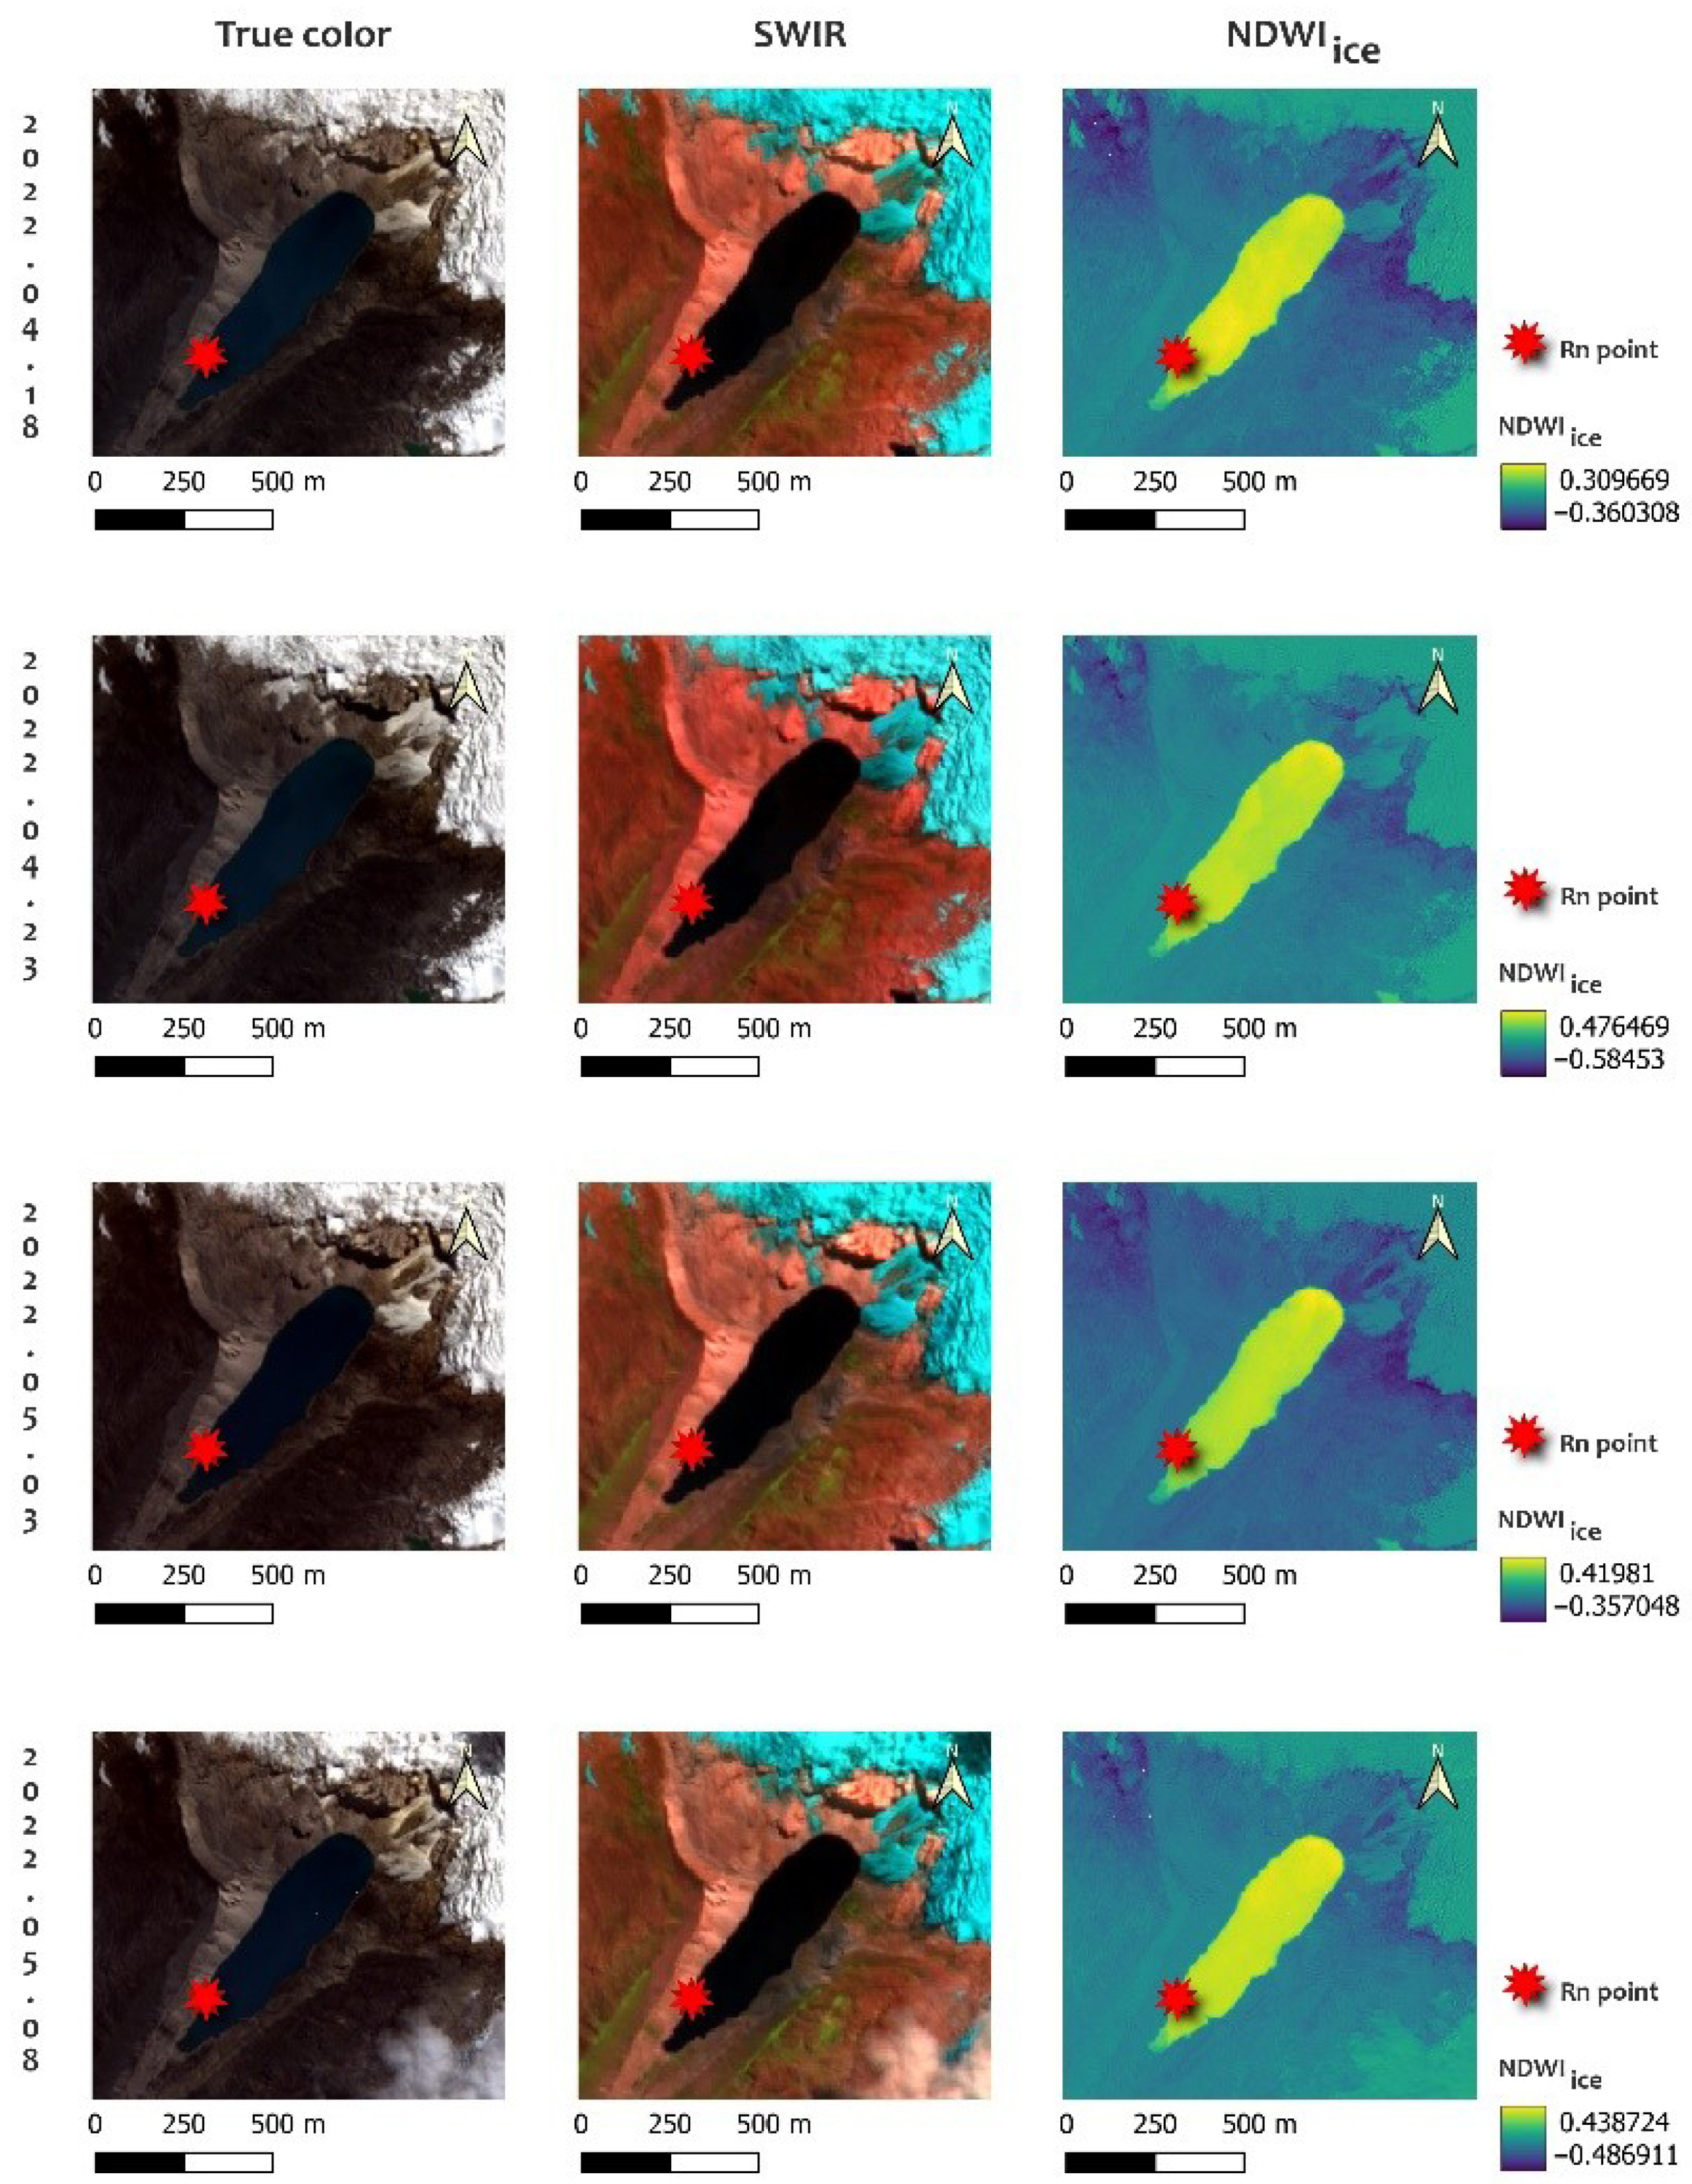
3.1. Image Processing
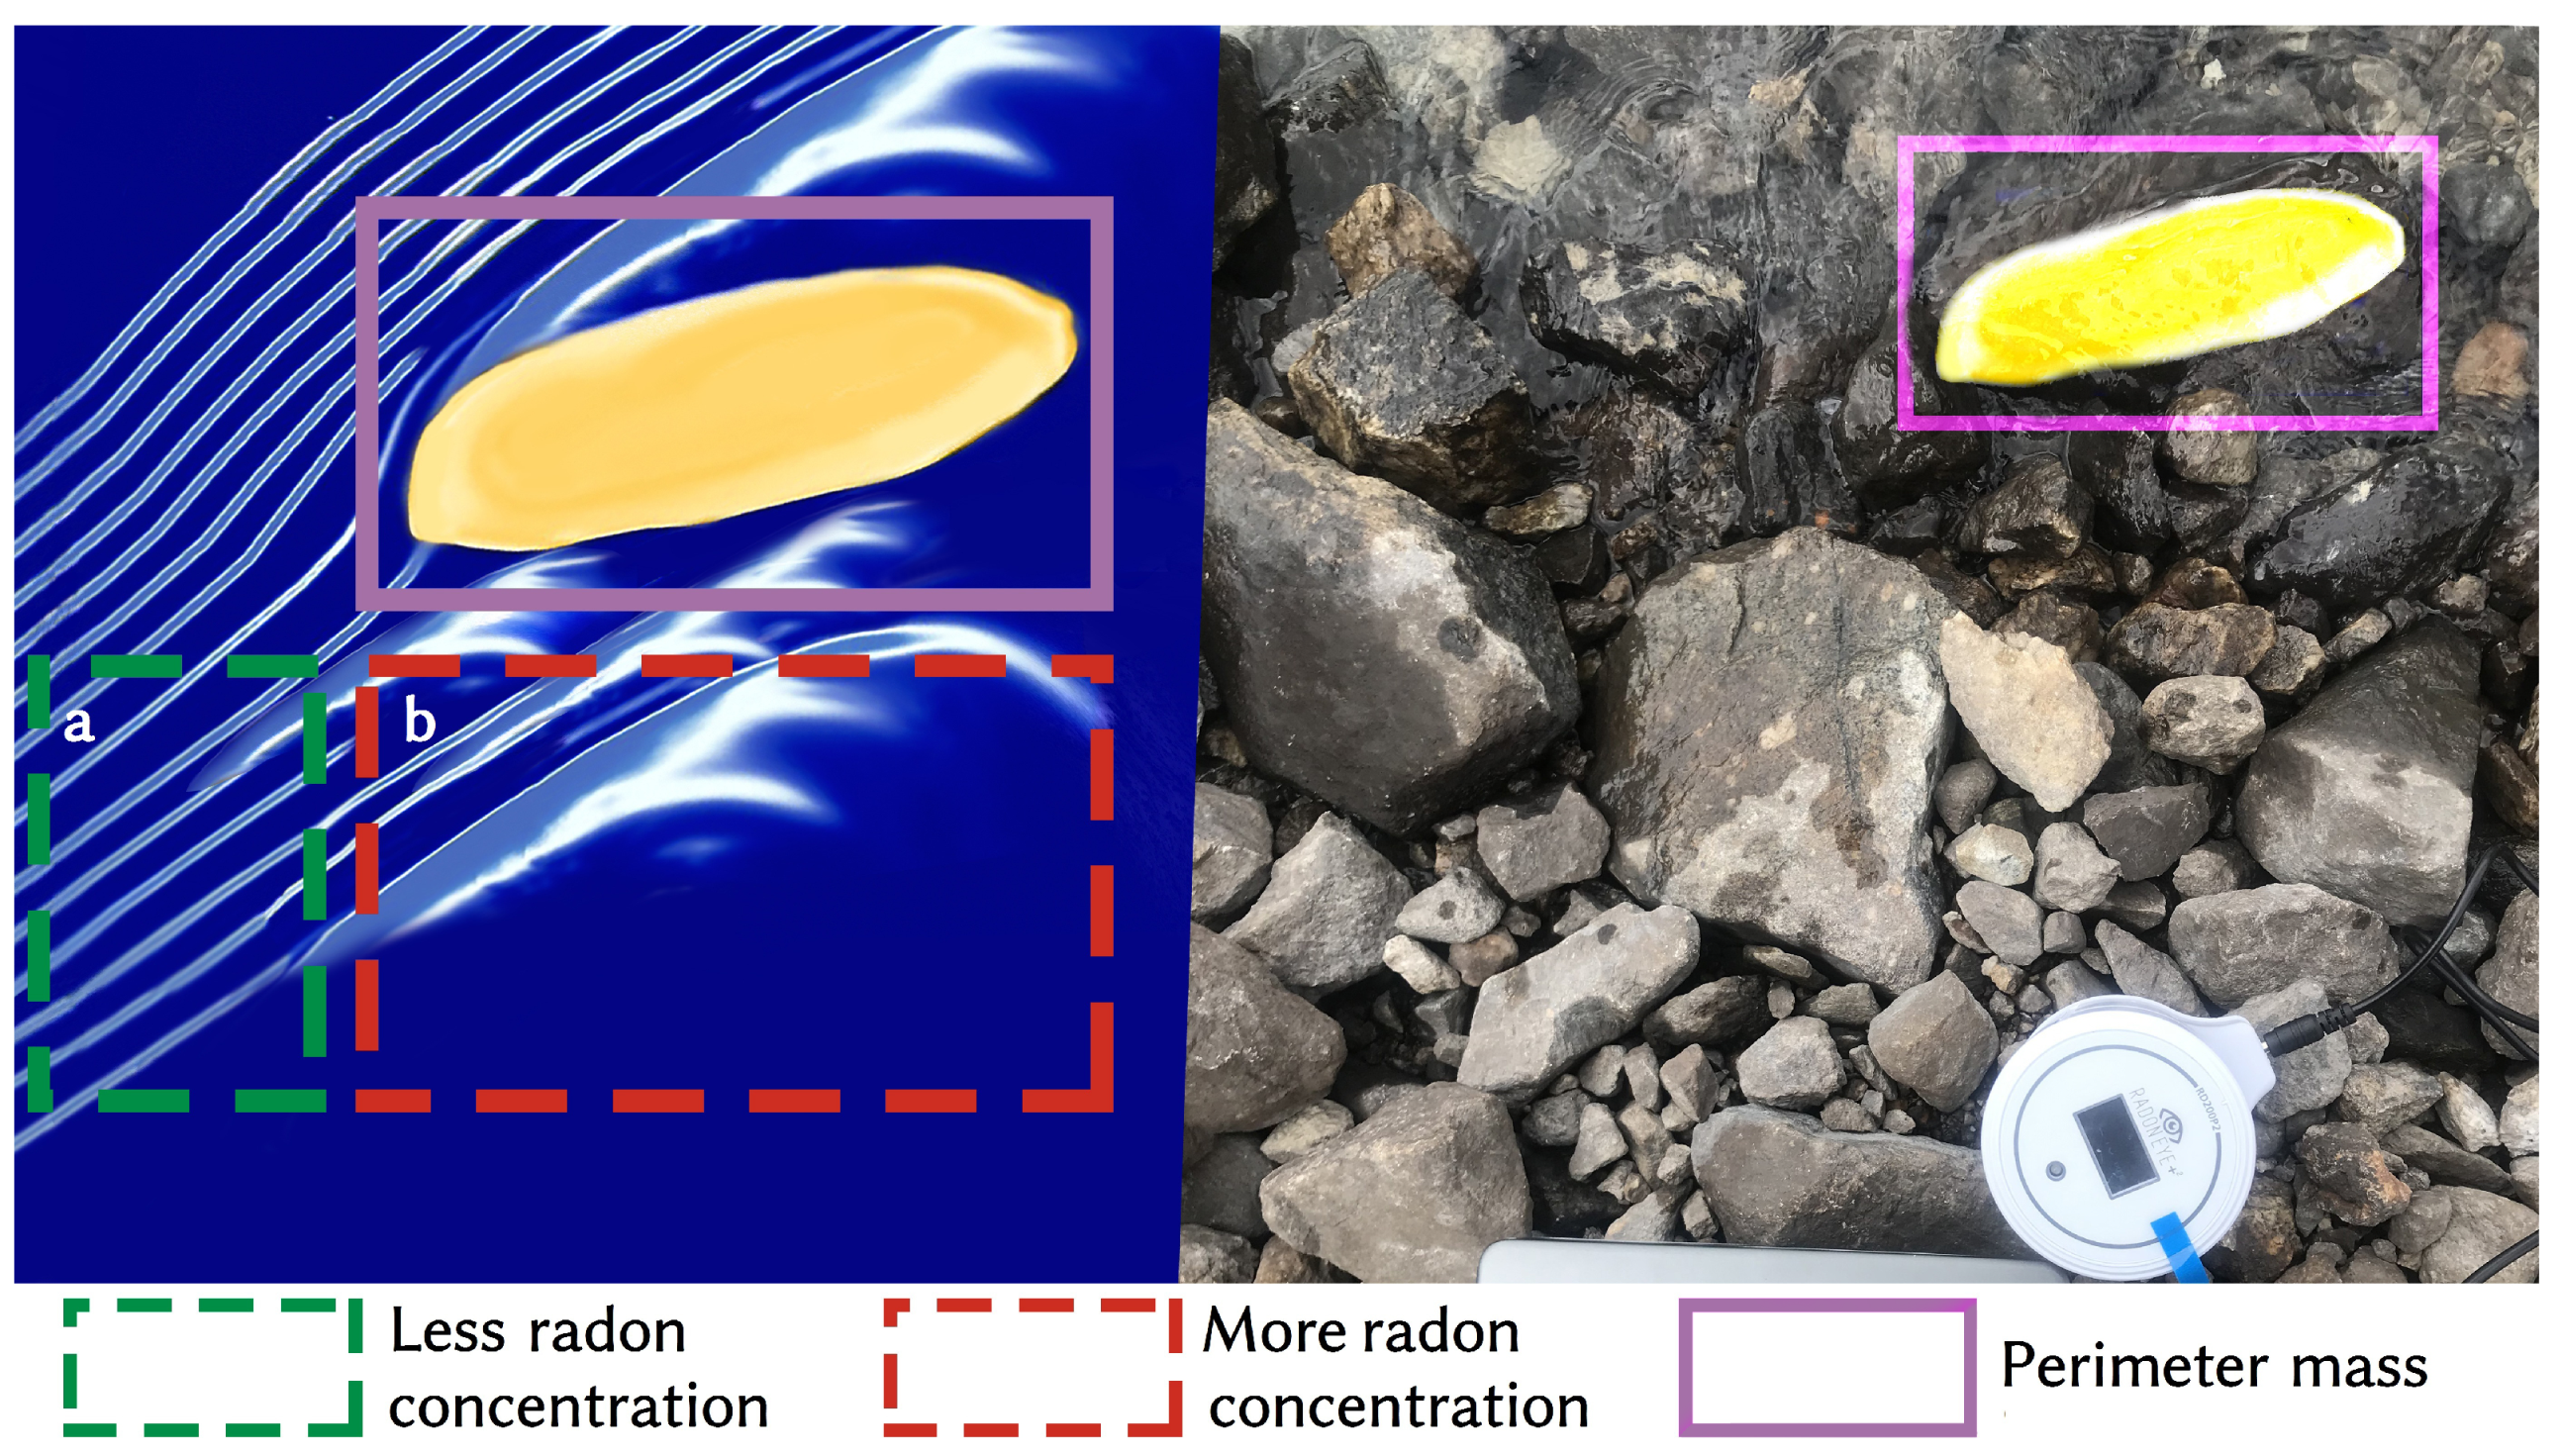
3.2. Determination of Hot Spot for Radon Concentration in the Proglacial Environment
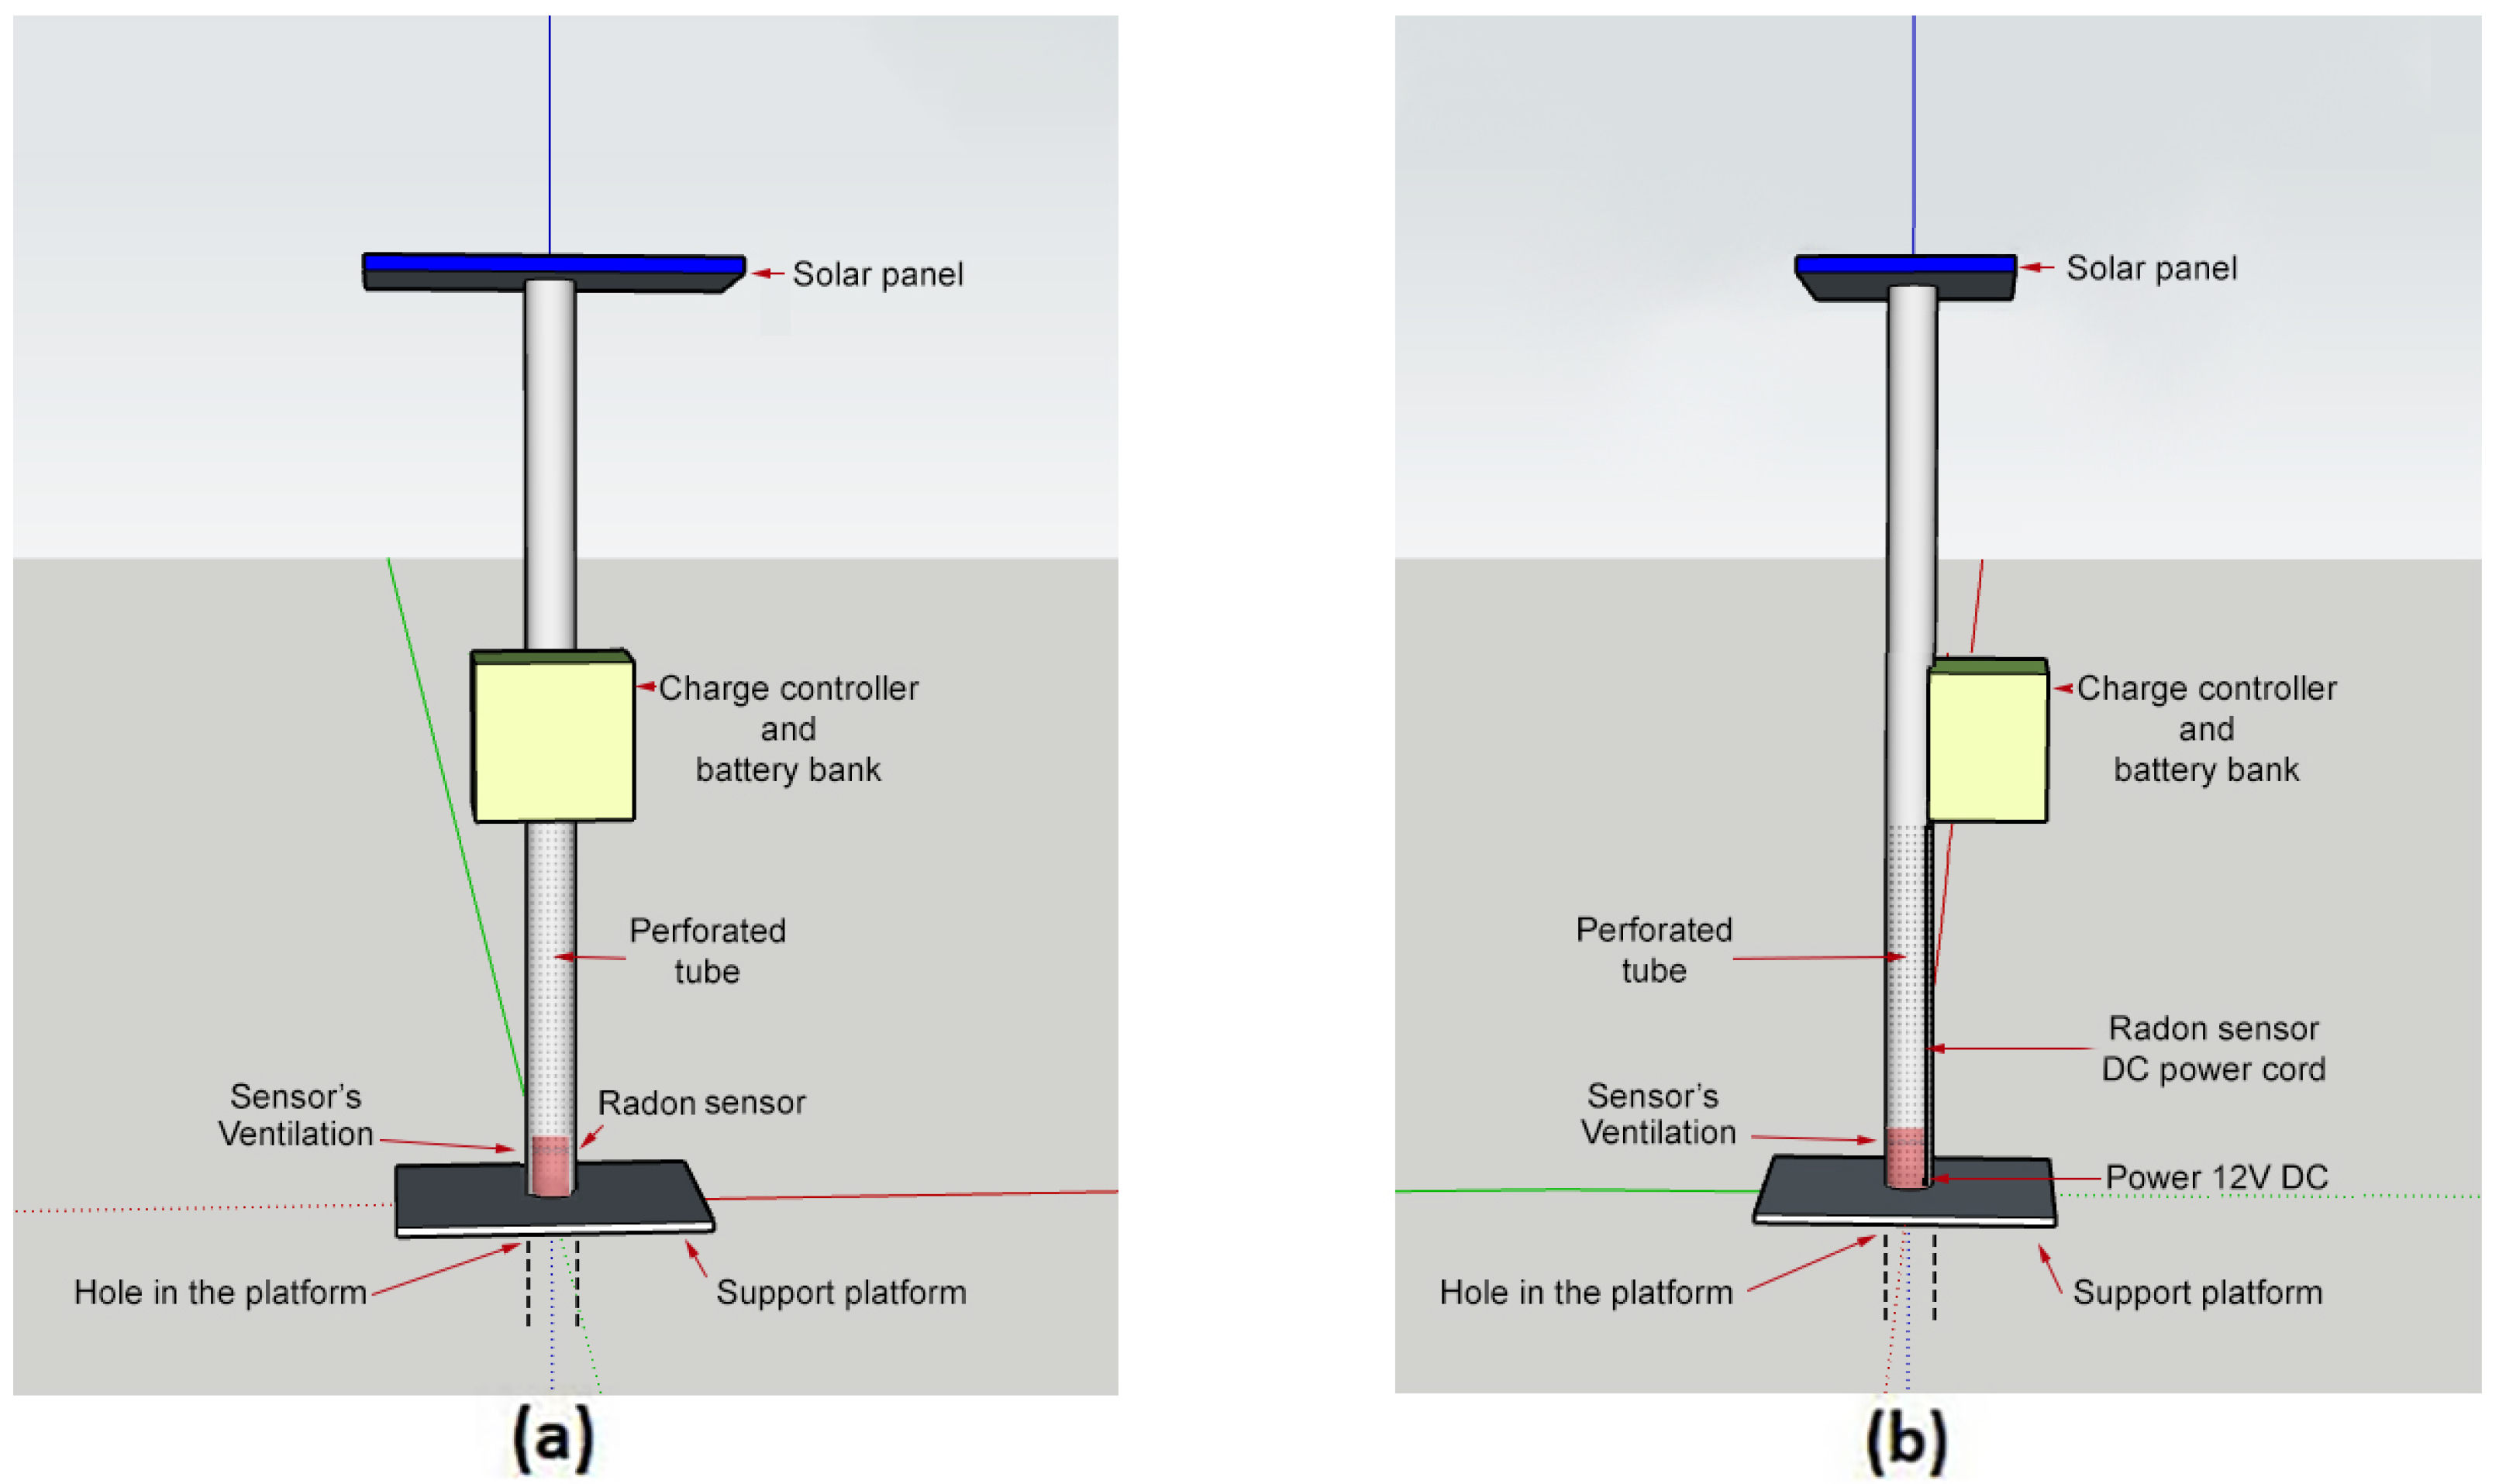
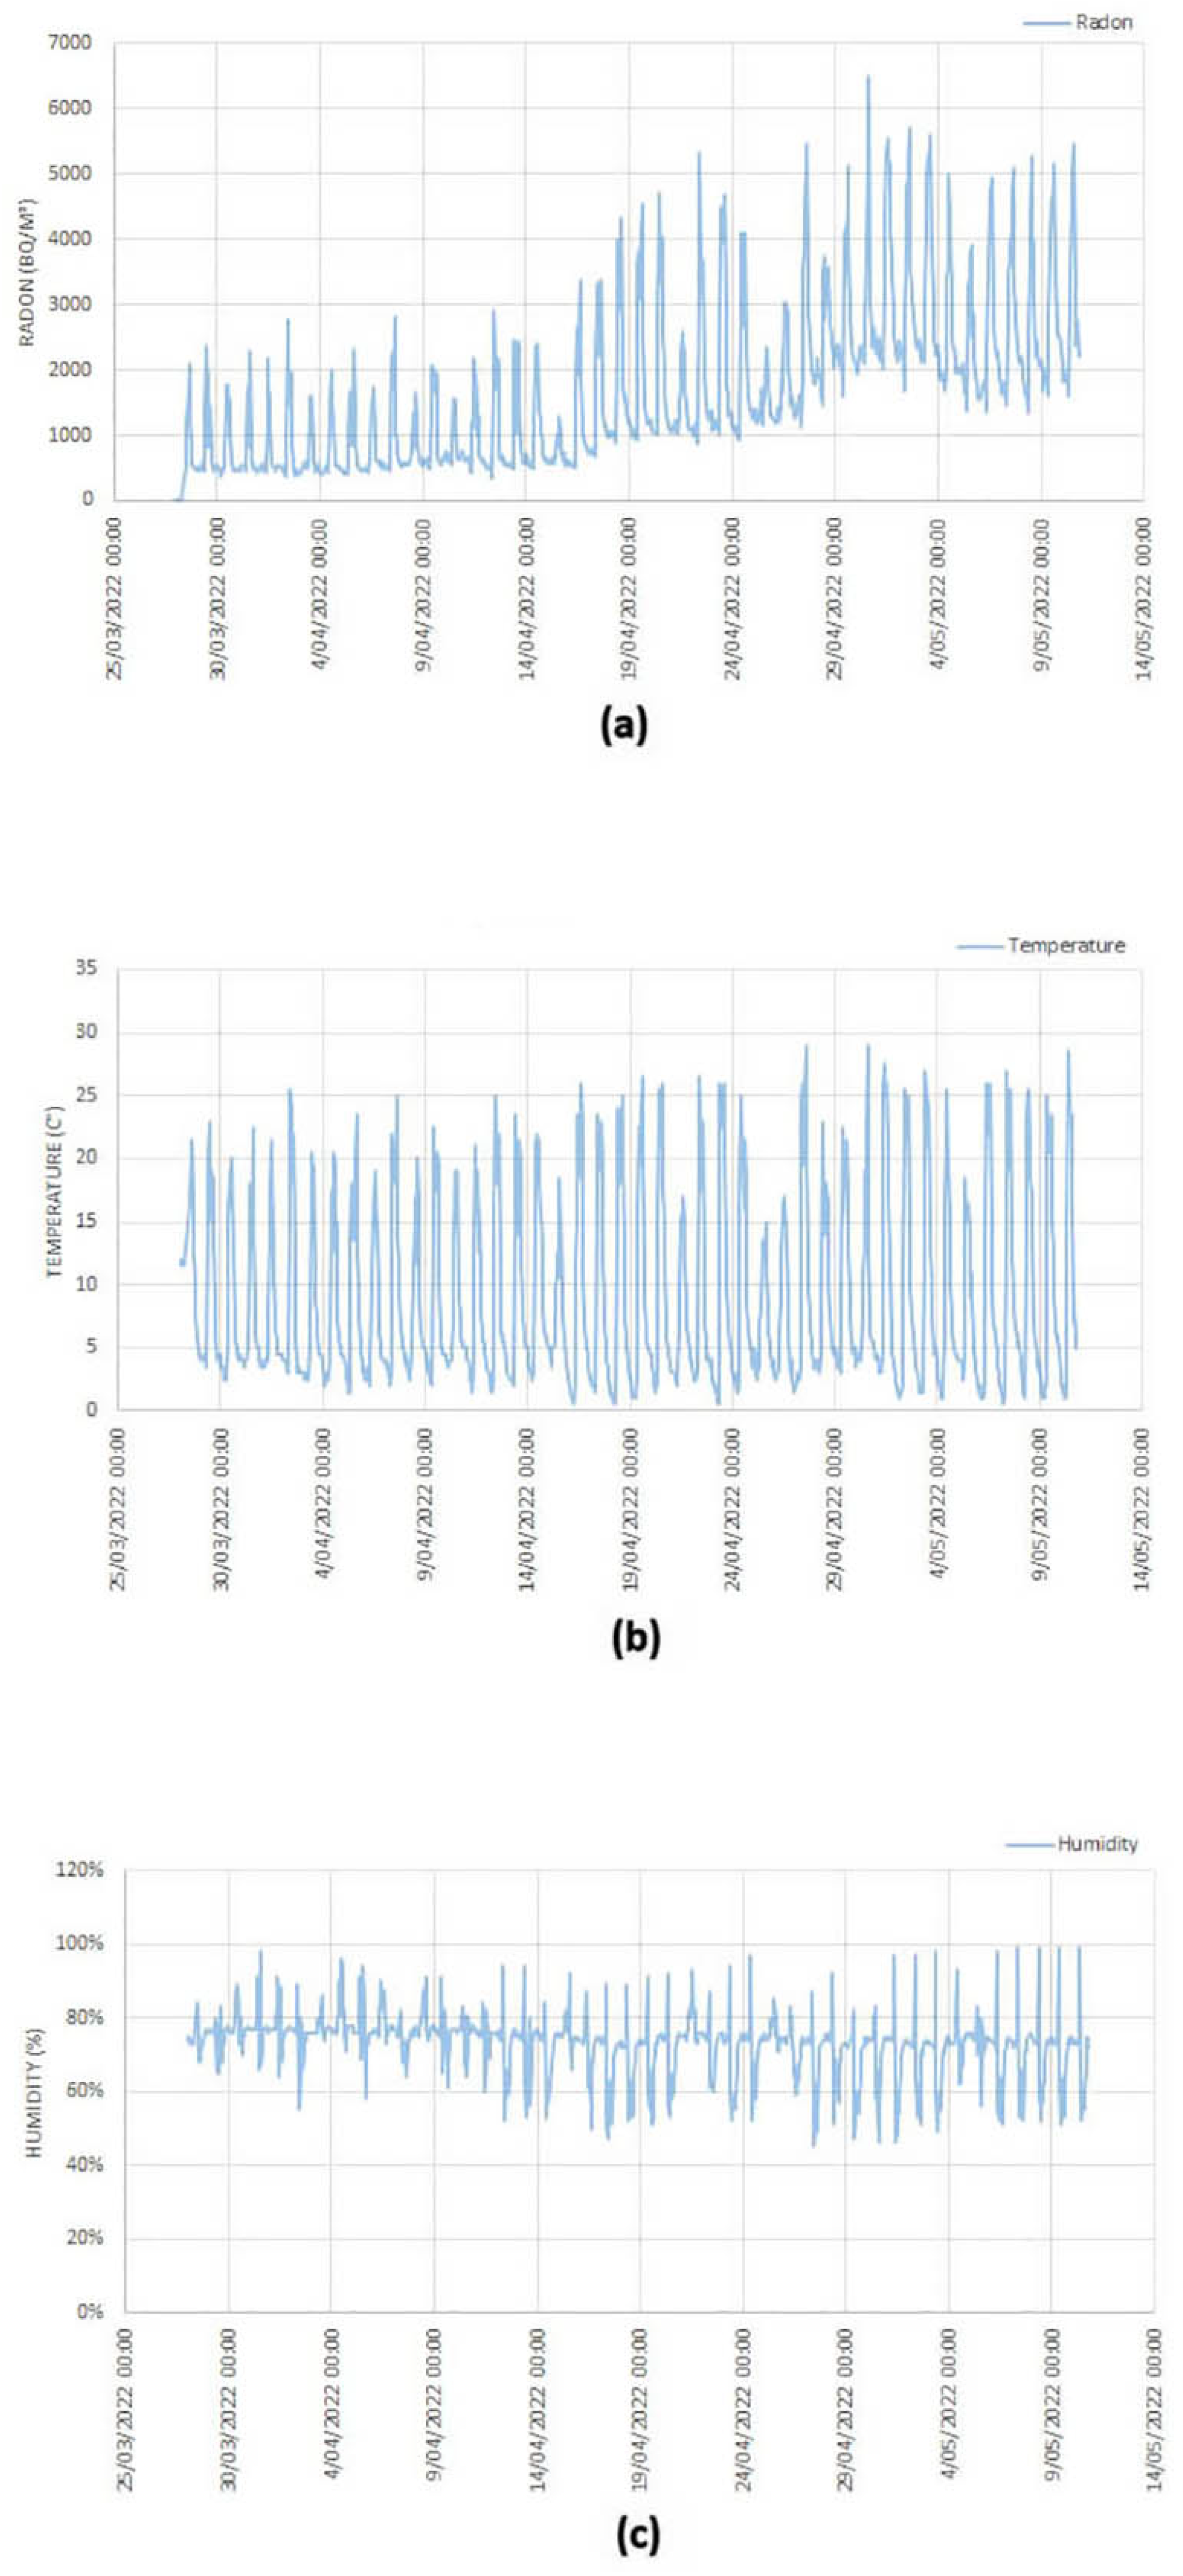
3.3. Radon Concentration in the Tropical Proglacial Environment
3.4. Susceptibility of the Tropical Proglacial Environment
4. Results
5. Discussion

| Multiple R | R Square | Adjusted R Square | Standar Error | Observations |
|---|---|---|---|---|
| 0.6037 | 0.3645 | 0.3639 | 5.7919 | 1048 |
| df | SS | MS | F | Significance F | |
|---|---|---|---|---|---|
| Regression | 1 | 20,125.337 | 20,125.337 | 599.923 | 0.44 × |
| Residual | 1046 | 35,089.701 | 33.547 | ||
| Total | 1047 | 55,212.038 | |||
| Coefficients | Standard Error | t Stat | p-Value | ||
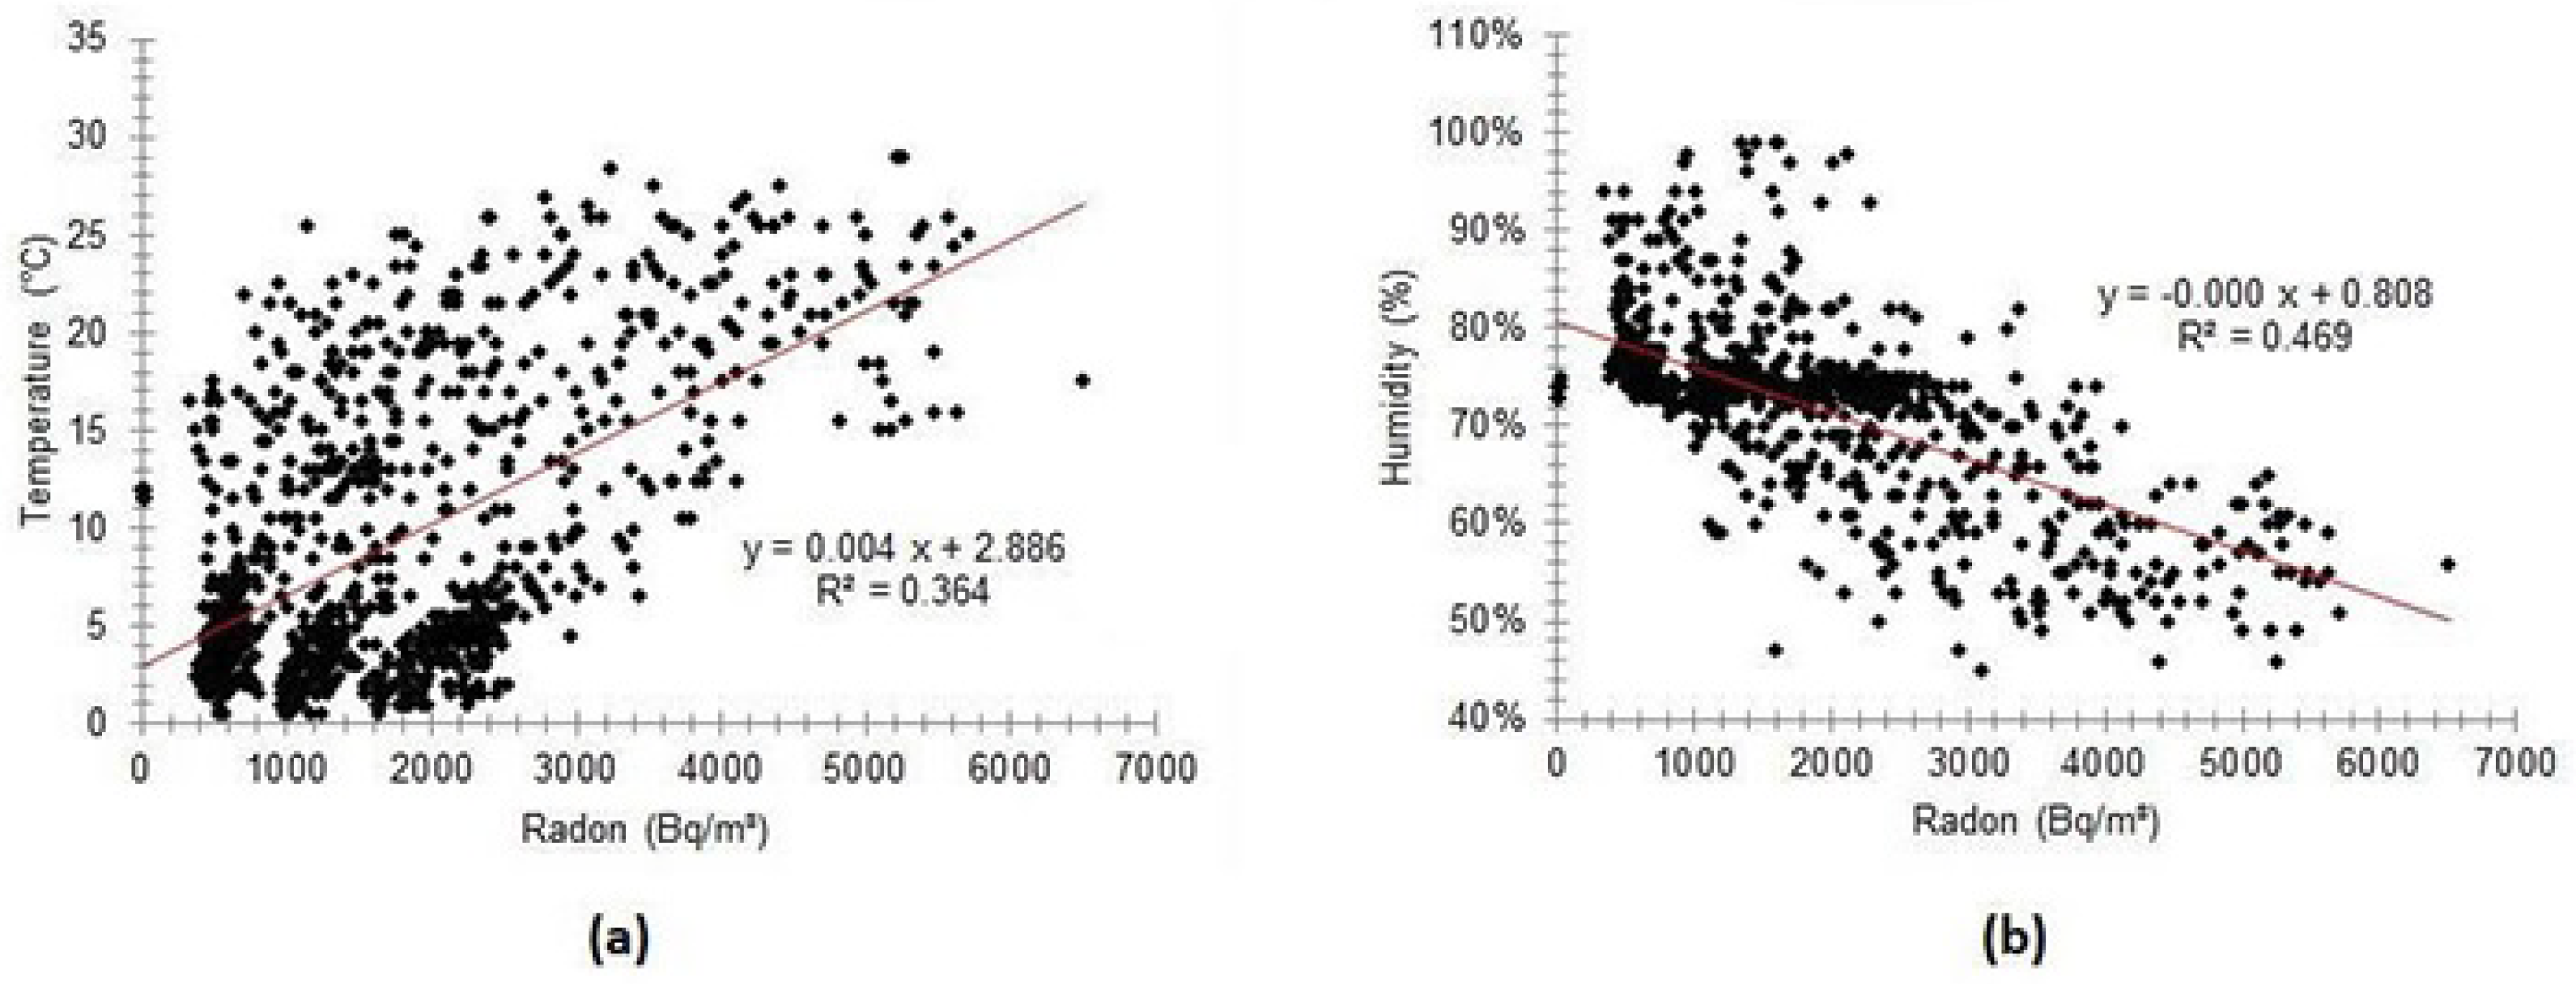
| Intercept | 2.886 | 0.306 | 9.420 | 0.279 × | |
| Radon (Bq/m3) | 0.004 | 0.149 × | 24.493 | 0.44 × | |
| Multiple R | R Square | Adjusted R Square | Standar Error | Observations |
|---|---|---|---|---|
| 0.6851 | 0.4693 | 0.4688 | 0.0605 | 1048 |
| df | SS | MS | F | Significance F | |
|---|---|---|---|---|---|
| Regression | 1 | 3.382 | 3.382 | 925.089 | 0.436 × |
| Residual | 1046 | 3.824 | 0.004 | ||
| Total | 1047 | 7.207 | |||
| Coefficients | Standard Error | t Stat | p-Value | ||
| Intercept | 0.808 | 0.003 | 252.627 | 0 | |
| Radon (Bq/m3) | −0.472 × | 0.155 × | −30.415 | 0.461 × | |
6. Conclusions
Author Contributions
Funding
Data Availability Statement
Acknowledgments
Conflicts of Interest
References
- Carrivick, J.L.; Tweed, F.S. A Global Assessment of the Societal Impacts of Glacier Outburst Floods. Glob. Planet. Chang. 2016, 144, 1–16. [Google Scholar] [CrossRef]
- Ruano-Raviña, A.; Quindós-Poncela, L.; Sainz Fernández, C.; Barros-Dios, J.M. Radón interior y salud pública en España. Tiempo para la acción. Gac. Sanit. 2014, 28, 439–441. [Google Scholar] [CrossRef] [PubMed] [Green Version]
- Kies, A.; Hengesch, O.; Tosheva, Z.; Nawrot, A.P.; Jania, J. Overview on Radon Measurements in Arctic Glacier Waters. Cryosph. Discuss. 2015, 9, 2013–2052. [Google Scholar] [CrossRef]
- Stanley, F.K.T.; Irvine, J.L.; Jacques, W.R.; Salgia, S.R.; Innes, D.G.; Winquist, B.D.; Torr, D.; Brenner, D.R.; Goodarzi, A.A. Radon Exposure Is Rising Steadily within the Modern North American Residential Environment, and Is Increasingly Uniform across Seasons. Sci. Rep. 2019, 9, 18472. [Google Scholar] [CrossRef] [Green Version]
- Linhoff, B.S.; Charette, M.A.; Nienow, P.W.; Wadham, J.L.; Tedstone, A.J.; Cowton, T. Utility of 222Rn as a Passive Tracer of Subglacial Distributed System Drainage. Earth Planet. Sci. Lett. 2017, 462, 180–188. [Google Scholar] [CrossRef] [Green Version]
- Akbari, K.; Mahmoudi, J.; Ghanbari, M. Influence of Indoor Air Conditions on Radon Concentration in a Detached House. J. Environ. Radioact. 2013, 116, 166–173. [Google Scholar] [CrossRef]
- Rabi, R.; Oufni, L. Study of Radon Dispersion in Typical Dwelling Using CFD Modeling Combined with Passive-Active Measurements. Radiat. Phys. Chem. Oxf. Engl. 2017, 139, 40–48. [Google Scholar] [CrossRef]
- Martin, I.M. Radon Gas Intensity Variation from April to July 2018 in São José Dos Campos, Brazil Region. Glob. J. Eng. Sci. Res. 2018, 5, 90–96. [Google Scholar] [CrossRef]
- Aydar, E.; Diker, C. Carcinogen Soil Radon Enrichment in a Geothermal Area: Case of Güzelçamlı-Davutlar District of Aydın City, Western Turkey. Ecotoxicol. Environ. Saf. 2021, 208, 111466. [Google Scholar] [CrossRef]
- Shrestha, B.B.; Nakagawa, H.; Kawaike, K.; Zhang, H. Glacial and Sediment Hazards in the Rolwaling Valley, Nepal. Int. J. Eros. Contr. Eng. 2012, 5, 123–133. [Google Scholar] [CrossRef] [Green Version]
- Zhu, Z.; Wang, S.; Woodcock, C.E. Improvement and Expansion of the Fmask Algorithm: Cloud, Cloud Shadow, and Snow Detection for Landsats 4–7, 8, and Sentinel 2 Images. Remote Sens. Environ. 2015, 159, 269–277. [Google Scholar] [CrossRef]
- Wang, Y.; Su, J.; Zhai, X.; Meng, F.; Liu, C. Snow Coverage Mapping by Learning from Sentinel-2 Satellite Multi-Spectral Images via Machine Learning Algorithms. Remote Sens. 2022, 14, 782. [Google Scholar] [CrossRef]
- Paul, F.; Rastner, P.; Azzoni, R.S.; Diolaiuti, G.; Fugazza, D.; Le Bris, R.; Nemec, J.; Rabatel, A.; Ramusovic, M.; Schwaizer, G.; et al. Glacier Shrinkage in the Alps Continues Unabated as Revealed by a New Glacier Inventory from Sentinel-2. Earth Syst. Sci. Data 2020, 12, 1805–1821. [Google Scholar] [CrossRef]
- Verma, P.; Kumar Ghosh, S. Classification of Glacial Lakes Using Integrated Approach of DFPS Technique and Gradient Analysis Using Sentinel 2A Data. Geocarto Int. 2019, 34, 1075–1088. [Google Scholar] [CrossRef]
- Hollstein, A.; Segl, K.; Guanter, L.; Brell, M.; Enesco, M. Ready-to-Use Methods for the Detection of Clouds, Cirrus, Snow, Shadow, Water and Clear Sky Pixels in Sentinel-2 MSI Images. Remote Sens. 2016, 8, 666. [Google Scholar] [CrossRef] [Green Version]
- Zharko, V.O.; Bartalev, S.A.; Sidorenkov, V.M. Forest Growing Stock Volume Estimation Using Optical Remote Sensing over Snow-Covered Ground: A Case Study for Sentinel-2 Data and the Russian Southern Taiga Region. Remote Sens. Lett. 2020, 11, 677–686. [Google Scholar] [CrossRef]
- Gilfedder, B.S.; Frei, S.; Hofmann, H.; Cartwright, I. Groundwater Discharge to Wetlands Driven by Storm and Flood Events: Quantification Using Continuous Radon-222 and Electrical Conductivity Measurements and Dynamic Mass-Balance Modelling. Geochim. Cosmochim. Acta 2015, 165, 161–177. [Google Scholar] [CrossRef]
- Peano, G.; Vigna, B.; Villavecchia, E.; Agnesod, G. Radon Exchange Dynamics in a Karst System Investigated by Radon Continuous Measurements in Water: First Results. Radiat. Prot. Dosim. 2011, 145, 173–177. [Google Scholar] [CrossRef]
- Burnett, W.C.; Wattayakorn, G.; Supcharoen, R.; Sioudom, K.; Kum, V.; Chanyotha, S.; Kritsananuwat, R. Groundwater Discharge and Phosphorus Dynamics in a Flood-Pulse System: Tonle Sap Lake, Cambodia. J. Hydrol. 2017, 549, 79–91. [Google Scholar] [CrossRef]
- Lázaro, L.V.; López Herrera, M.E.; Pereyra, P.; Fernández, D.P.; Pérez, B.; Rojas, J.; Sajo-Bohus, L. Measurement of Radon in Soils of Lima City—Peru during the Period 2016–2017. Earth Sci. Res. J. 2019, 23, 171–183. [Google Scholar] [CrossRef]
- Vuille, M.; Francou, B.; Wagnon, P.; Juen, I.; Kaser, G.; Mark, B.G.; Bradley, R.S. Climate Change and Tropical Andean Glaciers: Past, Present and Future. Earth Sci. Rev. 2008, 89, 79–96. [Google Scholar] [CrossRef] [Green Version]
- Mark, B.G.; Seltzer, G.O. Tropical Glacier Meltwater Contribution to Stream Discharge: A Case Study in the Cordillera Blanca, Peru. J. Glaciol. 2003, 49, 271–281. [Google Scholar] [CrossRef] [Green Version]
- Kaser, G.; Juen, I.; Georges, C.; Gómez, J.; Tamayo, W. The Impact of Glaciers on the Runoff and the Reconstruction of Mass Balance History from Hydrological Data in the Tropical Cordillera Blanca, Perú. J. Hydrol. 2003, 282, 130–144. [Google Scholar] [CrossRef]
- Somos-Valenzuela, M.A.; Chisolm, R.E.; Rivas, D.S.; Portocarrero, C.; McKinney, D.C. Modeling a Glacial Lake Outburst Flood Process Chain: The Case of Lake Palcacocha and Huaraz, Peru. Hydrol. Earth Syst. Sci. 2016, 20, 2519–2543. [Google Scholar] [CrossRef]
- Veettil, K. Global Disappearance of Tropical Mountain Glaciers: Observations, Causes, and Challenges. Geoscience 2019, 9, 196. [Google Scholar] [CrossRef] [Green Version]
- Vuille, M.; Carey, M.; Huggel, C.; Buytaert, W.; Rabatel, A.; Jacobsen, D.; Soruco, A.; Villacis, M.; Yarleque, C.; Elison Timm, O.; et al. Rapid Decline of Snow and Ice in the Tropical Andes—Impacts, Uncertainties and Challenges Ahead. Earth Sci. Rev. 2018, 176, 195–213. [Google Scholar] [CrossRef] [Green Version]
- Pouyaud, B.; Zapata, M.; Yerren, J.; Gomez, J.; Rosas, G.; Suarez, W.; Ribstein, P. Avenir Des Ressources En Eau Glaciaire de La Cordillère Blanche/On the Future of the Water Resources from Glacier Melting in the Cordillera Blanca, Peru. Hydrol. Sci. J. 2005, 50, 999. [Google Scholar] [CrossRef]
- Kaser, G. A Review of the Modern Fluctuations of Tropical Glaciers. Glob. Planet. Chang. 1999, 22, 93–103. [Google Scholar] [CrossRef]
- Emmer, A.; Vilímek, V.; Klimeš, J.; Cochachin, A. Glacier Retreat, Lakes Development and Associated Natural Hazards in Cordilera Blanca, Peru. In Landslides in Cold Regions in the Context of Climate Change; Springer International Publishing: Cham, Switzerland, 2014; pp. 231–252. [Google Scholar] [CrossRef]
- Baraer, M.; Mark, B.G.; McKenzie, J.M.; Condom, T.; Bury, J.; Huh, K.-I.; Portocarrero, C.; Gómez, J.; Rathay, S. Glacier Recession and Water Resources in Peru’s Cordillera Blanca. J. Glaciol. 2012, 58, 134–150. [Google Scholar] [CrossRef] [Green Version]
- Drenkhan, F.; Huggel, C.; Guardamino, L.; Haeberli, W. Managing Risks and Future Options from New Lakes in the Deglaciating Andes of Peru: The Example of the Vilcanota-Urubamba Basin. Sci. Total Environ. 2019, 665, 465–483. [Google Scholar] [CrossRef]
- Hanshaw, M.N.; Bookhagen, B. Glacial Areas, Lake Areas, and Snow Lines from 1975 to 2012: Status of the Cordillera Vilcanota, Including the Quelccaya Ice Cap, Northern Central Andes, Peru. Cryosphere 2014, 8, 359–376. [Google Scholar] [CrossRef] [Green Version]
- Shugar, D.H.; Burr, A.; Haritashya, U.K.; Kargel, J.S.; Watson, C.S.; Kennedy, M.C.; Bevington, A.R.; Betts, R.A.; Harrison, S.; Strattman, K. Rapid Worldwide Growth of Glacial Lakes since 1990. Nat. Clim. Chang. 2020, 10, 939–945. [Google Scholar] [CrossRef]
- Reznichenko, N.V.; Davies, T.R.H.; Alexander, D.J. Effects of Rock Avalanches on Glacier Behaviour and Moraine Formation. Geomorphology 2011, 132, 327–338. [Google Scholar] [CrossRef]
- Read, L.K.; McKinney, D.C. Addressing Water Availability and Climate Change Issues in the Cordillera Blanca, Peru through Technical Analysis and Community Building Strategies; Center for Research in Water Resources, University of Texas at Austin: Austin, TX, USA, 2010; Available online: http://hdl.handle.net/2152/10899 (accessed on 8 February 2023).
- Slaymaker, O. Criteria to Distinguish Between Periglacial, Proglacial and Paraglacial Environments. Quaest. Geogr. 2011, 30, 85–94. [Google Scholar] [CrossRef] [Green Version]
- Rabatel, A.; Francou, B.; Soruco, A.; Gomez, J.; Cáceres, B.; Ceballos, J.L.; Basantes, R.; Vuille, M.; Sicart, J.-E.; Huggel, C.; et al. Current State of Glaciers in the Tropical Andes: A Multi-Century Perspective on Glacier Evolution and Climate Change. Cryosphere 2013, 7, 81–102. [Google Scholar] [CrossRef] [Green Version]
- Eawag, A.F.L.; Eicher, U.; Siegenthaler, U.; Birks, H.J.B. Late-Glacial Climatic Oscillations as Recorded in Swiss Lake Sediments. J. Quat. Sci. 1992, 7, 187–204. [Google Scholar] [CrossRef] [Green Version]
- Leemann, A.; Niessen, F. Holocene Glacial Activity and Climatic Variations in the Swiss Alps: Reconstructing a Continuous Record from proglacial Lake Sediments. Holocene 1994, 4, 259–268. [Google Scholar] [CrossRef]
- Huggel, C.; Carey, M.; Emmer, A.; Frey, H.; Walker-Crawford, N.; Wallimann-Helmer, I. Anthropogenic Climate Change and Glacier Lake Outburst Flood Risk: Local and Global Drivers and Responsibilities for the Case of Lake Palcacocha, Peru. Nat. Hazards Earth Syst. Sci. 2020, 20, 2175–2193. [Google Scholar] [CrossRef]
- Hastenrath, S.; Ames, A. Recession of Yanamarey Glacier in Cordillera Blanca, Peru, during the 20th Century. J. Glaciol. 1995, 41, 191–196. [Google Scholar] [CrossRef]
- Vilímek, V.; Zapata, M.L.; Klimeš, J.; Patzelt, Z.; Santillán, N. Influence of Glacial Retreat on Natural Hazards of the Palcacocha Lake Area, Peru. Landslides 2005, 2, 107–115. [Google Scholar] [CrossRef] [Green Version]
- Xu, C.; Xu, X.; Yao, X.; Dai, F. Three (Nearly) Complete Inventories of Landslides Triggered by the May 12, 2008 Wenchuan Mw 7.9 Earthquake of China and Their Spatial Distribution Statistical Analysis. Landslides 2014, 11, 441–461. [Google Scholar] [CrossRef] [Green Version]
- Klimeš, J.; Novotný, J.; Novotná, I.; de Urries, B.J.; Vilímek, V.; Emmer, A.; Strozzi, T.; Kusák, M.; Rapre, A.C.; Hartvich, F.; et al. Landslides in Moraines as Triggers of Glacial Lake Outburst Floods: Example from Palcacocha Lake (Cordillera Blanca, Peru). Landslides 2016, 13, 1461–1477. [Google Scholar] [CrossRef]
- Tom, M.; Prabha, R.; Wu, T.; Baltsavias, E.; Leal-Taixé, L.; Schindler, K. Ice Monitoring in Swiss Lakes from Optical Satellites and Webcams Using Machine Learning. Remote Sens. 2020, 12, 3555. [Google Scholar] [CrossRef]
- Main-Knorn, M.; Pflug, B.; Louis, J.; Debaecker, V.; Müller-Wilm, U.; Gascon, F. Sen2Cor for Sentinel-2. In Image and Signal Processing for Remote Sensing XXIII; Bruzzone, L., Bovolo, F., Benediktsson, J.A., Eds.; SPIE Remote Sensing: Warsaw, Poland, 2017. [Google Scholar] [CrossRef] [Green Version]
- Zhu, K.; Ghobrial, T.; Loewen, M. Exploration of Google earth engine for monitoring river ice. In Proceedings of the 21st Workshop on the Hydraulics of Ice Covered Rivers, Saskatoon, SK, Canada, 29 August–1 September 2021. [Google Scholar]
- Kos, A.; Amann, F.; Strozzi, T.; Osten, J.; Wellmann, F.; Jalali, M.; Dufresne, A. The Surface Velocity Response of a Tropical Glacier to Intra and Inter Annual Forcing, Cordillera Blanca, Peru. Remote Sens. 2021, 13, 2694. [Google Scholar] [CrossRef]
- Chymyrov, A.; Betz, F.; Baibagyshov, E.; Kurban, A.; Cyffka, B.; Halik, U. Floodplain Forest Mapping with Sentinel-2 Imagery: Case Study of Naryn River, Kyrgyzstan. In Vegetation of Central Asia and Environs; Springer International Publishing: Cham, Switzerland, 2018; pp. 335–347. [Google Scholar] [CrossRef]
- Chastain, R.; Housman, I.; Goldstein, J.; Finco, M.; Tenneson, K. Empirical Cross Sensor Comparison of Sentinel-2A and 2B MSI, Landsat-8 OLI, and Landsat-7 ETM+ Top of Atmosphere Spectral Characteristics over the Conterminous United States. Remote Sens. Environ. 2019, 221, 274–285. [Google Scholar] [CrossRef]
- Wang, Q.; Shi, W.; Li, Z.; Atkinson, P.M. Fusion of Sentinel-2 Images. Remote Sens. Environ. 2016, 187, 241–252. [Google Scholar] [CrossRef] [Green Version]
- Carrasco, L.; O’Neil, A.; Morton, R.; Rowland, C. Evaluating Combinations of Temporally Aggregated Sentinel-1, Sentinel-2 and Landsat 8 for Land Cover Mapping with Google Earth Engine. Remote Sens. 2019, 11, 288. [Google Scholar] [CrossRef] [Green Version]
- Zhang, M.; Huang, H.; Li, Z.; Hackman, K.O.; Liu, C.; Andriamiarisoa, R.L.; Ny Aina Nomenjanahary Raherivelo, T.; Li, Y.; Gong, P. Automatic High-Resolution Land Cover Production in Madagascar Using Sentinel-2 Time Series, Tile-Based Image Classification and Google Earth Engine. Remote Sens. 2020, 12, 3663. [Google Scholar] [CrossRef]
- Corbane, C.; Politis, P.; Kempeneers, P.; Simonetti, D.; Soille, P.; Burger, A.; Pesaresi, M.; Sabo, F.; Syrris, V.; Kemper, T. A Global Cloud Free Pixel- Based Image Composite from Sentinel-2 Data. Data Brief 2020, 31, 105737. [Google Scholar] [CrossRef]
- Yang, K.; Smith, L.C. Supraglacial Streams on the Greenland Ice Sheet Delineated from Combined Spectral—Shape Information in High-Resolution Satellite Imagery. IEEE Geosci. Remote Sens. Lett. 2013, 10, 801–805. [Google Scholar] [CrossRef]
- Feng, T.; Lu, X. Natural Radioactivity, Radon Exhalation Rate and Radiation Dose of Fly Ash Used as Building Materials in Xiangyang, China. Indoor Built Environ. 2016, 25, 626–634. [Google Scholar] [CrossRef]
- Elísio, S.; Peralta, L. Development of a Low-Cost Monitor for Radon Detection in Air. Nucl. Instrum. Methods Phys. Res. A 2020, 969, 164033. [Google Scholar] [CrossRef]
- Dimitrova, I.; Georgiev, S.; Mitev, K.; Todorov, V.; Dutsov, C.; Sabot, B. Study of the Performance and Time Response of the RadonEye Plus2 Continuous Radon Monitor. Measurement (London) 2023, 207, 112409. [Google Scholar] [CrossRef]
- Martín-Martín, A.; Gutiérrez-Villanueva, J.L.; Muñoz, J.M.; García-Talavera, M.; Adamiec, G.; Iñiguez, M.P. Radon Measurements with a PIN Photodiode. Appl. Radiat. Isot 2006, 64, 1287–1290. [Google Scholar] [CrossRef] [PubMed]
- Sá, J.P.; Branco, P.T.B.S.; Alvim-Ferraz, M.C.M.; Martins, F.G.; Sousa, S.I.V. Radon in Indoor Air: Towards Continuous Monitoring. Sustainability 2022, 14, 1529. [Google Scholar] [CrossRef]
- Leith, C.E. Theoretical Skill of Monte Carlo Forecasts. Mon. Weather Rev. 1974, 102, 409–418. Available online: https://journals.ametsoc.org/view/journals/mwre/102/6/1520-0493_1974_102_0409_tsomcf_2_0_co_2.xml (accessed on 15 December 2022). [CrossRef]
- Deng, Z.; He, C.; Liu, Y. Deep Neural Network-Based Strategy for Optimal Sensor Placement in Data Assimilation of Turbulent Flow. Phys. Fluids 2021, 33, 025119. [Google Scholar] [CrossRef]
- Wilkening, M.H. Radon 222 Concentrations in the Convective Patterns of a Mountain Environment. J. Geophys. Res. 1970, 75, 1733–1740. [Google Scholar] [CrossRef]
- Arnoux, M.; Gibert-Brunet, E.; Barbecot, F.; Guillon, S.; Gibson, J.; Noret, A. Interactions between Groundwater and Seasonally Ice-covered Lakes: Using Water Stable Isotopes and Radon-222 Multilayer Mass Balance Models. Hydrol. Process. 2017, 31, 2566–2581. [Google Scholar] [CrossRef]
- Gauthier, P.-J.; Condomines, M.; Hammouda, T. An Experimental Investigation of Radon Diffusion in an Anhydrous Andesitic Melt at Atmospheric Pressure: Implications for Radon Degassing from Erupting Magmas. Geochim. Cosmochim. Acta 1999, 63, 645–656. [Google Scholar] [CrossRef]
- Kies, A.; Nawrot, A.; Tosheva, Z.; Jania, J. Natural Radioactive Isotopes in Glacier Meltwater Studies. Geochem. J. 2011, 45, 423–429. [Google Scholar] [CrossRef] [Green Version]
- Bhatia, M.P.; Das, S.B.; Kujawinski, E.B.; Henderson, P.; Burke, A.; Charette, M.A. Seasonal Evolution of Water Contributions to Discharge from a Greenland Outlet Glacier: Insight from a New Isotope-Mixing Model. J. Glaciol. 2011, 57, 929–941. [Google Scholar] [CrossRef] [Green Version]
- Kobayashi, Y.; Yasuoka, Y.; Omori, Y.; Nagahama, H.; Sanada, T.; Muto, J.; Suzuki, T.; Homma, Y.; Ihara, H.; Kubota, K.; et al. Annual Variation in the Atmospheric Radon Concentration in Japan. J. Environ. Radioact. 2015, 146, 110–118. [Google Scholar] [CrossRef] [PubMed]
- Smetanová, I.; Holý, K.; Müllerová, M.; Polášková, A. The Effect of Meteorological Parameters on Radon Concentration in Borehole Air and Water. J. Radioanal. Nucl. Chem. 2010, 283, 101–109. [Google Scholar] [CrossRef]
- Hu, J.; Huang, H.; Chi, Z.; Cheng, X.; Wei, Z.; Chen, P.; Xu, X.; Qi, S.; Xu, Y.; Zheng, Y. Distribution and Evolution of Supraglacial Lakes in Greenland during the 2016–2018 Melt Seasons. Remote Sens. 2021, 14, 55. [Google Scholar] [CrossRef]
- Chevallier, P.; Pouyaud, B.; Suarez, W.; Condom, T. Climate Change Threats to Environment in the Tropical Andes: Glaciers and Water Resources. Reg. Environ. Chang. 2011, 11, 179–187. [Google Scholar] [CrossRef]
- Khadka, N.; Chen, X.; Nie, Y.; Thakuri, S.; Zheng, G.; Zhang, G. Evaluation of Glacial Lake Outburst Flood Susceptibility Using Multi-Criteria Assessment Framework in Mahalangur Himalaya. Front. Earth Sci. 2021, 8, 601288. [Google Scholar] [CrossRef]
- Dearing, J.A.; Elner, J.K.; Happey-Wood, C.M. Recent Sediment Flux and Erosional Processes in a Welsh Upland Lake-Catchment Based on Magnetic Susceptibility Measurements. Quat. Res. 1981, 16, 356–372. [Google Scholar] [CrossRef]
- Iribarren Anacona, P.; Norton, K.P.; Mackintosh, A. Moraine-Dammed Lake Failures in Patagonia and Assessment of Outburst Susceptibility in the Baker Basin. Nat. Hazards Earth Syst. Sci. 2014, 14, 3243–3259. [Google Scholar] [CrossRef] [Green Version]
- Paul, F.; Huggel, C.; Kääb, A. Combining Satellite Multispectral Image Data and a Digital Elevation Model for Mapping Debris-Covered Glaciers. Remote Sens. Environ. 2004, 89, 510–518. [Google Scholar] [CrossRef]
- Kääb, A.; Jacquemart, M.; Gilbert, A.; Leinss, S.; Girod, L.; Huggel, C.; Falaschi, D.; Ugalde, F.; Petrakov, D.; Chernomorets, S.; et al. Sudden Large-Volume Detachments of Low-Angle Mountain Glaciers—More Frequent than Thought? Cryosphere 2021, 15, 1751–1785. [Google Scholar] [CrossRef]
- Chen, Y.; Hong, C.; Li, X.; Liu, Y.; Chen, Y.; Dai, X.; Wang, H.; Lin, D. Effect of Simulated Earthquake Loading on Radon Exhalation from Uranium Tailings Dam. Environ. Sci. Pollut. Res. Int. 2022, 29, 79434–79442. [Google Scholar] [CrossRef] [PubMed]
- Dugan, H.A.; Gleeson, T.; Lamoureux, S.F.; Novakowski, K. Tracing Groundwater Discharge in a High Arctic Lake Using Radon-222. Environ. Earth Sci. 2012, 66, 1385–1392. [Google Scholar] [CrossRef]
- Kuroiwa, J. Peru Sustainable (Resilient) Cities Programme 1998–2012. Its Application 2014–2021. Procedia Econ. Financ. 2014, 18, 408–415. [Google Scholar] [CrossRef] [Green Version]
- Moulton, H.; Carey, M.; Huggel, C.; Motschmann, A. Narratives of Ice Loss: New Approaches to Shrinking Glaciers and Climate Change Adaptation. Geoforum 2021, 125, 47–56. [Google Scholar] [CrossRef]


| Code | Label | Percentage of Glaciated Area | Name |
|---|---|---|---|
| 1 | ∎ | 40.63% | Cordillera Blanca |
| 2 | ∎ | 0.54% | Codillera Huallanca |
| 3 | ∎ | 4.26% | Cordillera Huayhuash |
| 4 | ∎ | 2.18% | Cordillera Raura |
| 5 | ∎ | 0.75% | Cordillera Huagaruncho |
| 6 | ∎ | 0.46% | Cordillera La Viuda |
| 7 | ∎ | 4.00% | Cordillera Central |
| 8 | ∎ | 2.03% | Cordillera Huaytapallana |
| 9 | ∎ | 0.11% | Cordillera de Chonta |
| 10 | ∎ | 4.69% | Cordillera Ampato |
| 11 | ∎ | 2.03% | Cordillera Urubamba |
| 12 | ∎ | 9.95% | Cordillera de Huanzo |
| 13 | ∎ | 0.35% | Cordillera de Vilcabamba |
| 14 | ∎ | 0.07% | Cordillera Chila |
| 15 | ∎ | 0.24% | Cordillera La Raya |
| 16 | ∎ | 21.52% | Cordillera de Vilcanota |
| 17 | ∎ | 2.66% | Cordillera de Carabaya |
| 18 | ∎ | 3.48% | Cordillera Apolobamba |
| Block | Volume (m3) | 1.111 − 0.118·Log10V | Mean Slope |
|---|---|---|---|
| 1 | 185,565.68 | 0.49 | 26.07° |
| 2 | 354,002.21 | 0.47 | 24.52° |
| 3 | 339,487.87 | 0.46 | 24.62° |
| 4 | 239,807.95 | 0.48 | 25.46° |
| 5 | 411,099.35 | 0.45 | 24.16° |
| 6 | 665,229.59 | 0.42 | 22.97° |
| 7 | 125,613.68 | 0.51 | 26.99° |
| 8 | 34,258.28 | 0.58 | 29.94° |
| 9 | 194,130.25 | 0.49 | 25.97° |
| 10 | 125,613.68 | 0.51 | 26.99° |
| 11 | 765,101.52 | 0.42 | 22.62° |
| 12 | 205,549.67 | 0.48 | 25.83° |
| 13 | 45,677.70 | 0.56 | 29.30° |
| 14 | 548,132.41 | 0.43 | 23.45° |
| 15 | 765,101.56 | 0.42 | 22.62° |
| 16 | 708,004.43 | 0.42 | 22.82° |
| 17 | 22,518.76 | 0.60 | 30.85° |
| 18 | 479,615.90 | 0.44 | 23.78° |
| 19 | 159,871.97 | 0.50 | 26.43° |
| 20 | 68,515.97 | 0.54 | 28.39° |
| 21 | 171,291.40 | 0.49 | 26.26° |
| 22 | 37,033.23 | 0.57 | 29.77° |
| Parameter | N | AM | SD | Min | Max | Median | GM |
|---|---|---|---|---|---|---|---|
| Radon (Bq/m3) | 1048 | 1674.63 | 1205.06 | 2 | 6502 | 1351.5 | 1272.14 |
| Temperature (°C) | 1048 | 8.98 | 7.26 | 0.5 | 29 | 5.5 | 6.34 |
| Humidity (%) | 1048 | 73 | 8 | 45 | 99 | 74 | 72 |
Disclaimer/Publisher’s Note: The statements, opinions and data contained in all publications are solely those of the individual author(s) and contributor(s) and not of MDPI and/or the editor(s). MDPI and/or the editor(s) disclaim responsibility for any injury to people or property resulting from any ideas, methods, instructions or products referred to in the content. |
© 2023 by the authors. Licensee MDPI, Basel, Switzerland. This article is an open access article distributed under the terms and conditions of the Creative Commons Attribution (CC BY) license (https://creativecommons.org/licenses/by/4.0/).
Share and Cite
García-Tadeo, D.A.; Montoya-Zavaleta, M.; Tan, Y. Understanding the Susceptibility of the Tropical Proglacial Environment in Peru Using Optical Imagery and Radon Measurements. Atmosphere 2023, 14, 568. https://doi.org/10.3390/atmos14030568
García-Tadeo DA, Montoya-Zavaleta M, Tan Y. Understanding the Susceptibility of the Tropical Proglacial Environment in Peru Using Optical Imagery and Radon Measurements. Atmosphere. 2023; 14(3):568. https://doi.org/10.3390/atmos14030568
Chicago/Turabian StyleGarcía-Tadeo, Diego Antonio, Modesto Montoya-Zavaleta, and Yumin Tan. 2023. "Understanding the Susceptibility of the Tropical Proglacial Environment in Peru Using Optical Imagery and Radon Measurements" Atmosphere 14, no. 3: 568. https://doi.org/10.3390/atmos14030568