Article

Evaluating the Measurement Uncertainty of On-Road NOx Using a Portable Emission Measurement System (PEMS) Based on Real Testing Data in China

1
College of Marine Equipment and Mechanical Engineering, Jimei University, Xiamen 361021, China
2
Xiamen Environment Protection Vehicle Emission Control Technology Center, Xiamen 361023, China
3
National Laboratory of Automotive Performance & Emission Test, School of Mechanical Engineering, Beijing Institute of Technology, Beijing 100081, China
4
Department of Science, Tianjin University of Technology and Education, Tianjin 300222, China
*
Authors to whom correspondence should be addressed.
Atmosphere 2023, 14(4), 702; https://doi.org/10.3390/atmos14040702
Submission received: 27 February 2023 / Revised: 28 March 2023 / Accepted: 7 April 2023 / Published: 11 April 2023
(This article belongs to the Special Issue Traffic Related Emission)

Abstract

:
An evaluation of the measurement uncertainty of on-road NOx emissions using portable emission measurement system (PEMS) based on real local testing data collected in China was carried out as per the type B method defined in the EN 17507 standard. The aim of this work was to quantify the “absolute” measurement uncertainty of PEMSs, which excluded “PEMS relative to laboratory constant volume sampler (CVS)” uncertainty from the calculation of on-road NOx measurement uncertainty using PEMSs. PEMS instruments from three mainstream manufacturers were employed. The zero drift of the NOx analyzers was evaluated periodically during the real driving emissions (RDE) test, and it was noticed that there was neither a linear nor step model of zero drift, with no correlation with the boundary conditions or measurement principle. Additionally, from the 256 valid RDE tests, the zero drift always ranged from 3.8 ppm to −3.8 ppm, and more than 95% of the span drifts were within a range of 1.5%. Based on the laboratory testing of ten vehicles using the worldwide harmonized light-duty vehicle test cycle (WLTC), the type B uncertainty of PEMS NOx measurements corresponding to China-6a and China-6b limits was assessed. An uncertainty of 26.5% for China-6a was found (NOx limit = 60 mg/km over the WLTC), which is very close to the 22.5% from the EU evaluation results (NOx limit = 80 mg/km over the WLTC); the uncertainty with respect to China-6b was found to be 42.8% because the type-I limit was tuned down to 35 mg/km. This result indicates that, with the ever-tightening regulatory limits of vehicle NOx emissions, big challenges will be posed in terms of the reliability of PEMS measurements, which requires PEMS manufacturers to improve the performance of the instruments and policymakers to refine the test procedures and/or result calculation method to minimize the impacts.

1. Introduction

Recently, reducing toxic emissions and carbon footprints and building a more sustainable public mobility system has become unprecedentedly important. Driven by the global development and implementation of ever-tightening vehicular emissions regulations, the measurement and control of on-road emissions from in-service vehicles have become a leading mission for the field, given the expanding discrepancies between lab certification and real driving testing [1,2,3,4,5,6]. This is particularly true after the unveiling of “Diesel gate” in the US in 2015. Driven by this incident, the EU announced the first Commission Regulation, EU 2016/427, in regard to real driving emissions (RDE) control in the first half of 2016, which is more commonly known as “RDE Package 1” [7,8]. Later, at the end of 2016, light-duty China-6 RDE, which largely followed the EU RDE Packages 1, 2, and (the draft of) 3 [9,10], was promulgated.
The introduction of RDE measurement as an in-service compliance program has been shown to be an effective way to purify on-road vehicle emissions, particularly for diesel vehicles. However, the measurement uncertainty for gaseous exhaust pollutants using a state-of-the-art portable emission measurement system (PEMS) has not been fully understood, which has become an obstacle for the surveillance of current legislation and future legislation drafting.
As a pioneer employing PEMSs as a checking tool to prohibit the use of cheating calibration strategies and defeat devices, the accuracy of PEMSs was determined when the not-to-exceed (NTE) requirement was first introduced in the federal regulation of the US [11,12,13,14]. Previous assessment programs were more aimed at the evaluation of the measurement uncertainty of PM rather than NOx. The discrepancies among PEMS instruments using different detection principles were compared by Durbin et al. to a standard constant volume sampler (CVS) [15]. Given that the PEMS was still an emerging technology when these five PEMS instruments were evaluated, inconsistency with the CVS results was yielded from all the units in both steady- and transient-state tests.
Another assessment of PM PEMSs using similar principles was accomplished by the same team a few years later. Refined PEMS instruments performed well in the measurement of engine-out emissions but largely failed in the test program of modern engines with an after-treatment system (ATS) because of the high variation in PM compositions, particularly in the cases of diesel particulate filter (DPF)-equipped engines [16,17]. Similar conclusions were drawn by Mamakos et al., who also noticed the disproportional responses of particle sensors to the nucleation-mode particles discharged within DPF regeneration events, but the performance of the tested sensors during the non-regeneration period was better, and a discrepancy of no higher than 30% was reported in comparison to filter weighing conducted on a heavy-duty chassis dynamometer [18].
A number of PM uncertainty evaluations were also conducted by the European Commission because of increasing concerns over ultrafine particles [19,20,21,22]. However, as an equally important exhaust pollutant and a precursor of secondary particles, the evaluation of the measurement uncertainty of NOx seems scarce compared to PM. Giechaskiel and Valverde et al. systematically reviewed the milestones of the EU RDE regulation and sketched a framework for the assessment of NOx measurement uncertainty using PEMSs [23,24,25,26]. However, those programs were more diesel-oriented, given that the major contributions of NOx and particulate emissions were related to diesel. More recently, the European Committee for Electrotechnical Standardization (CENELEC) included PEMS uncertainty evaluation in their calibration standards and guidelines [27]. Although it includes the type B evaluation of uncertainty, the calculation process is complicated, and the data are not easy to obtain through testing.
As the largest vehicle market in the world, no comprehensive evaluation of PEMS measurement uncertainty has been conducted in China thus far. Although China has largely followed the EU RDE Package 1 to 3, it is not feasible to quote the evaluation results of the EU because of regulation details and limited values. For example, China-6 regulations set “fuel-neutral” emissions limits for petrol and diesel vehicles, as well as more stringent NOx limit values than Euro-6d, i.e., NOx for the M1 category at room temperature, 35 mg/km vs. 60/80 mg/km. China-6 regulations permit the use of market-available petrol for a proper RDE test, which means, in most cases, petrol without ethanol substitution (E0) will be used, which is different from the prevalent E10 in EU member states. In addition, the requirements of ambient conditions, testing altitude, and driving dynamics are also different.
All these differences lead to the necessity to conduct an evaluation of the on-road measurement uncertainty of PEMSs based on the China-6 RDE regulations, especially before the RDE regulations are formally enforce on 1 July 2023.
In this work, the first evaluation of NOx measurement uncertainty using a PEMS was conducted based on local testing data collected in China; meanwhile, the evaluation method for the analyzer zero drift and span drift was refined on the basis of the European framework. Additionally, it should be mentioned that the uncertainty determined in this paper is the “absolute” measurement uncertainty of the PEMS, a concept different from the “relative to CVS” uncertainty quantified by Giechaskiel and Valverde et al. [25,26]. This paper aimed to identify the source of uncertainty related to each RDE test procedure and help PEMS manufacturers and RDE policymakers understand the future challenges of implementing more stringent on-road emissions testing regulations.

2. Materials and Methods

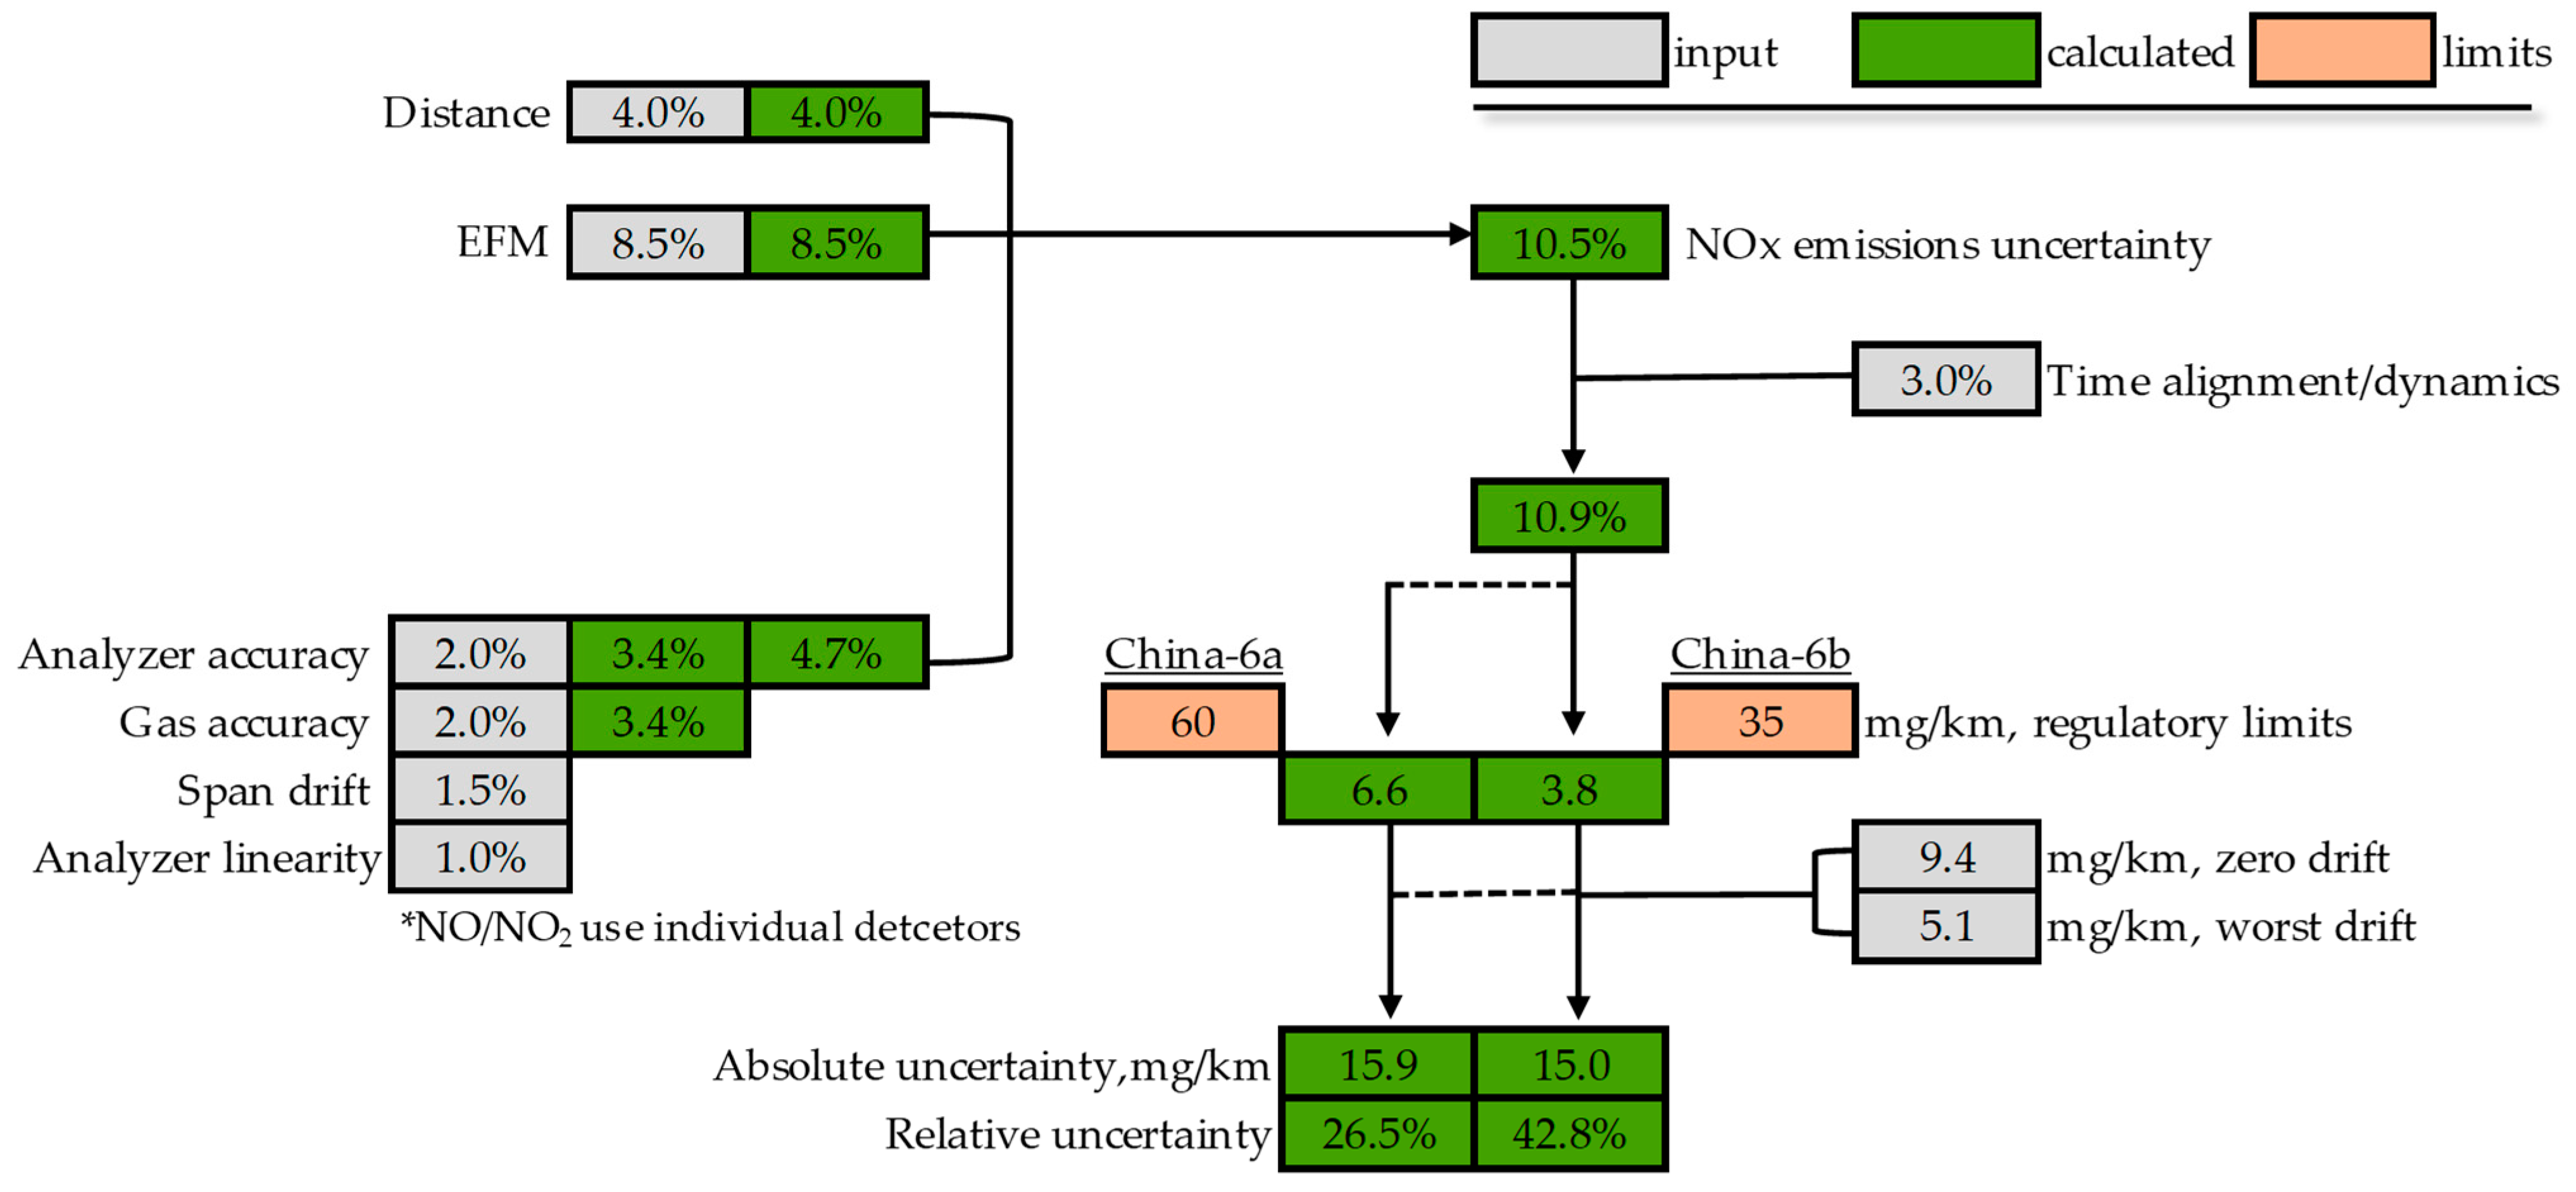
2.1. Uncertainty Framework

The framework is based on the EU framework, with the exception of excluding the relative uncertainty of the standard CVS system, which can be seen in Figure 1.
The EU framework was developed to evaluate the “relative uncertainty”, the additional measurement uncertainty of the PEMS relative to the laboratory constant volume sampler (CVS), also defined as conformity factors (CF) in the European regulations. This paper aimed at the estimation of the “absolute” measurement uncertainty of state-of-the-art PEMS instruments. Thus, CVS bag uncertainty was not considered in the scheme shown in Figure 1 since, as previously mentioned, all factors were taken into account with the error propagation rule.

2.2. Scopes of Uncertainty Evaluation

In this framework, distance uncertainty, analyzer accuracy, gas accuracy, and analyzer linearity are determined by the requirements of regulations. Additionally, some factors have been evaluated reasonably by the JRC (Joint Research Centre), such as EFM uncertainty and time alignment/dynamics, which are indicated in gray in Figure 1; therefore, we used the evaluation results of the JRC. The above parameters are beyond the scope of this paper. The NOx emission limit was updated to the China-6b limit. The main aim of this paper was to re-evaluate the analyzer span drift and zero drift. Moreover, the impact of the moving average window (MAW) method was beyond the scope of this paper since the MAW method is not representative [28].

2.3. Data Source for Evaluation

The test data employed for the uncertainty evaluation in this paper came from the voluntary RDE testing program organized by the Vehicle Emission Control Center of the Ministry of Ecology and Environment of China from 2016 to 2018. More than 100 manufacturers, engineers, experts, and tier 1 PEMS suppliers participated in this annual event. A total of 54 China-6 certified/prototype vehicles were tested in the lab or on the road. Further, 223 valid RDE test results were collected from 10 cities with varying ambient temperature and humidity, altitude, road slopes, and extents of congestion. From 2019 to the time of this study, our research team conducted 33 valid RDE tests on 11 China-6 vehicles to ensure the timeliness of the experimental data.
Otherwise, some tests were specifically designed for the understanding of PEMS uncertainty. In total, 14 zero/span drift validation results and 10 WLTC results were summarized as the input of this study.

2.4. PEMS Instruments

In this paper, the three most commonly used models of RDE-compliant PEMS instruments were adopted for evaluation in case of any bias induced by a specific detection principle. For each model, more than one kit was employed in the test campaign, which minimized the artifact error brought by the malfunction of any single unit. A total of 11 instruments were used for testing to minimize possible malfunction-induced errors. In general, the testing principles for NOx emissions from light-duty vehicles are Chemiluminescence (CLS) and Non-Dispersive Ultraviolet (NDUV). Because the NDUV method is an optical method based on the spectrum of vehicle exhausts, NO and NO2 emissions are identified and quantified simultaneously. No additional calculation is required, which helps reduce the extra uncertainty produced in the process of data calculation. However, in light of the fact that water produces significant interference in the spectrum of NOx species, caution should be exercised regarding the inaccuracy of PEMS instruments using the NDUV principle.

2.5. Test Vehicles

In order to make the evaluation result more representative of the market, the test vehicles covered a wide range of engine displacements, from 1.0 to 3.0 L, identical to those in Kousoulidou et al. [3], Giechaskiel et al. [23,25] and Valverde et al. [26]. The testing results from a sum of 65 China-6 certified/prototype vehicles were obtained for this evaluation. The test vehicles were acquired from domestic and overseas manufacturers. In addition to popular cars and SUVs, light-duty vans were also considered in this work. There were both conventional internal combustion engine (ICE) and hybrid models in the test fleet. For petrol engines, models using multi-point port fuel injection (PFI), direct injection (GDI), and combined injection strategies were considered. Generally, these vehicles provide broader coverage of the models available in the market and better representativeness. The main specifications of the test vehicles are summarized in Table 1.

2.6. Testing Conditions

In order to quantify the uncertainty of NOx measurement using a standard PEMS in China, the tests were performed in ten cities with various altitudes and ambient temperatures and humidities. The details of the testing boundary conditions in each city are listed in Table 2.

3. Results and Discussion
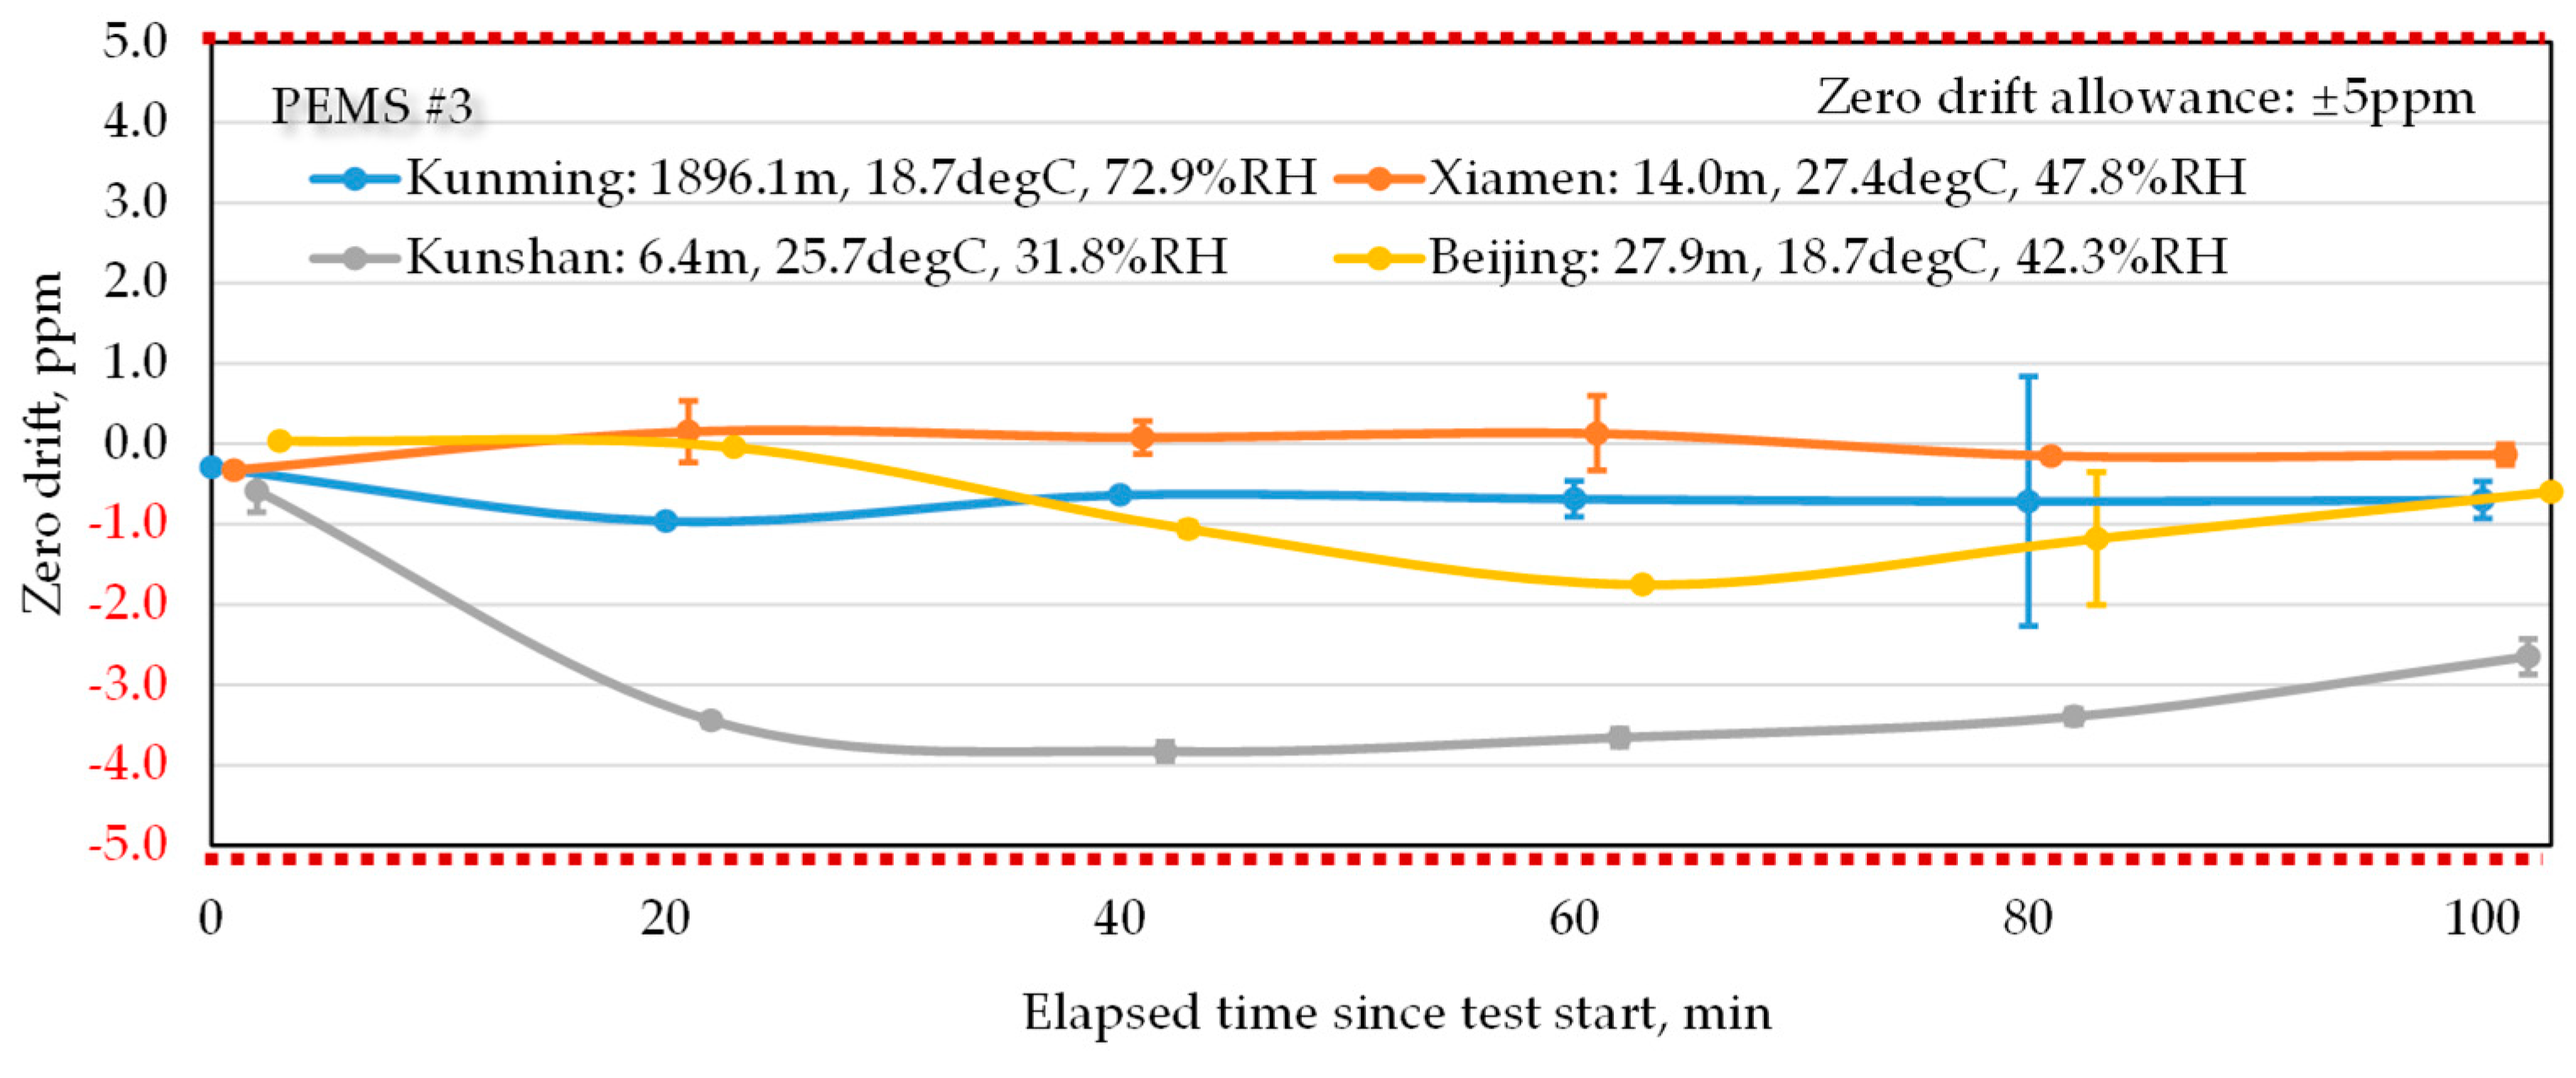
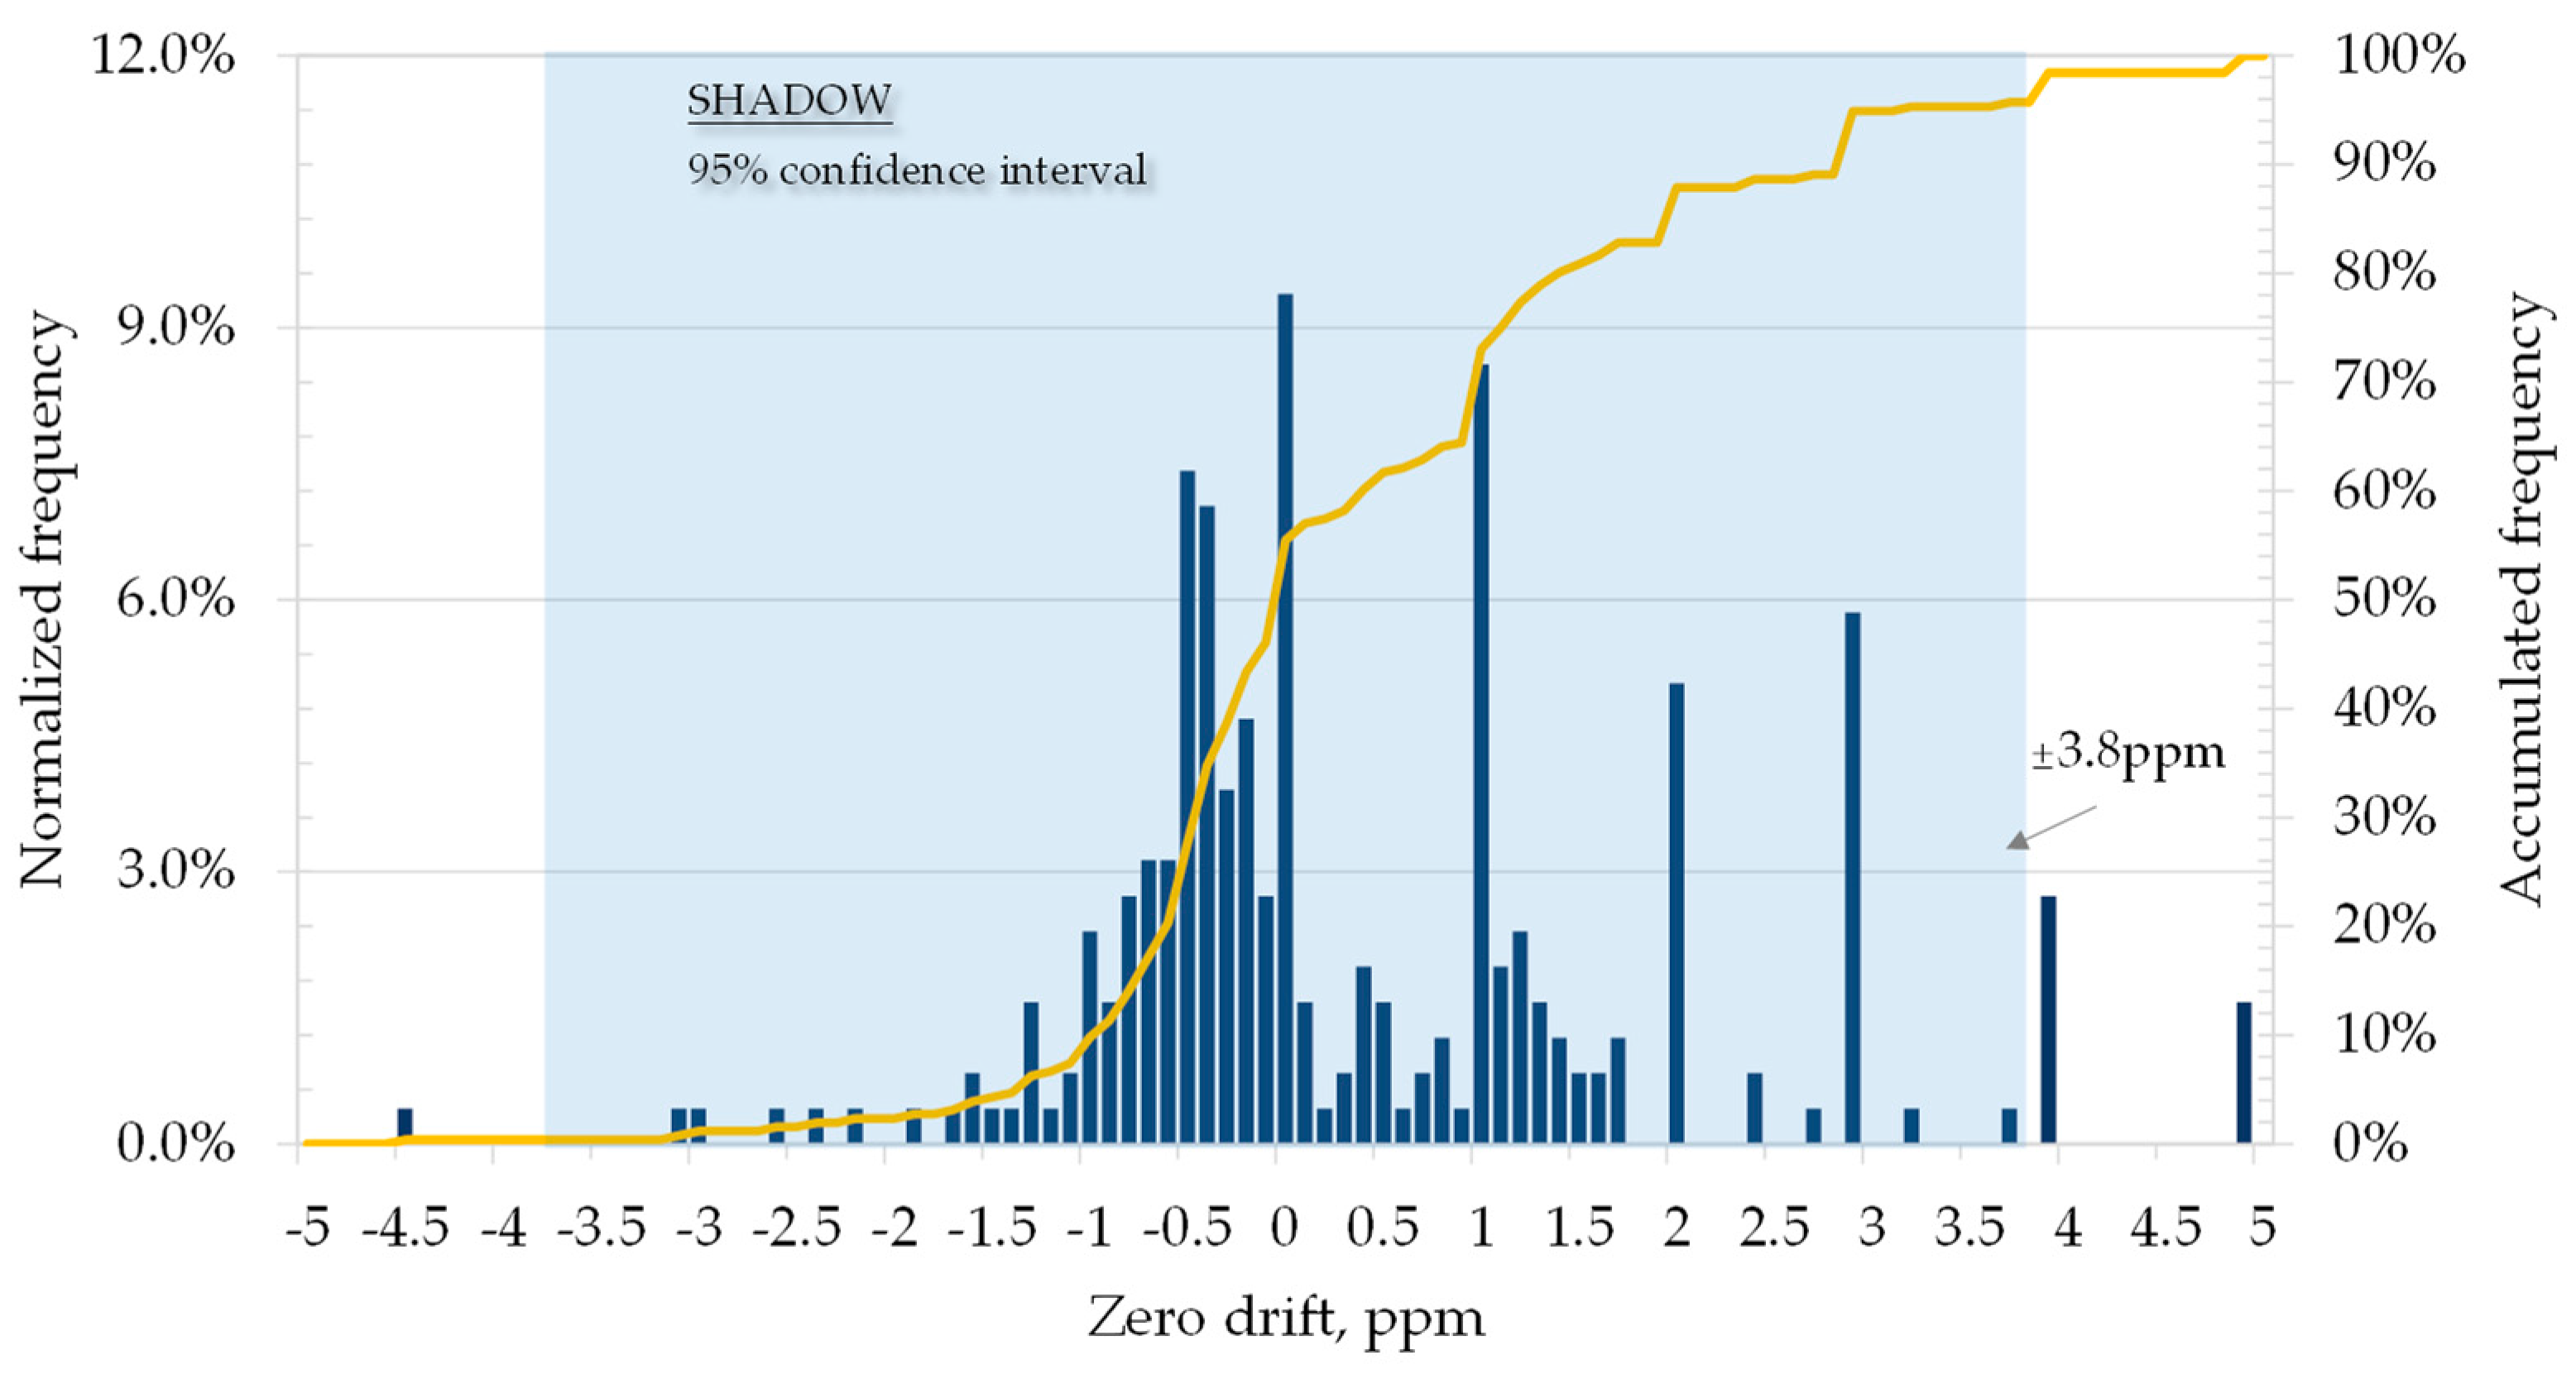
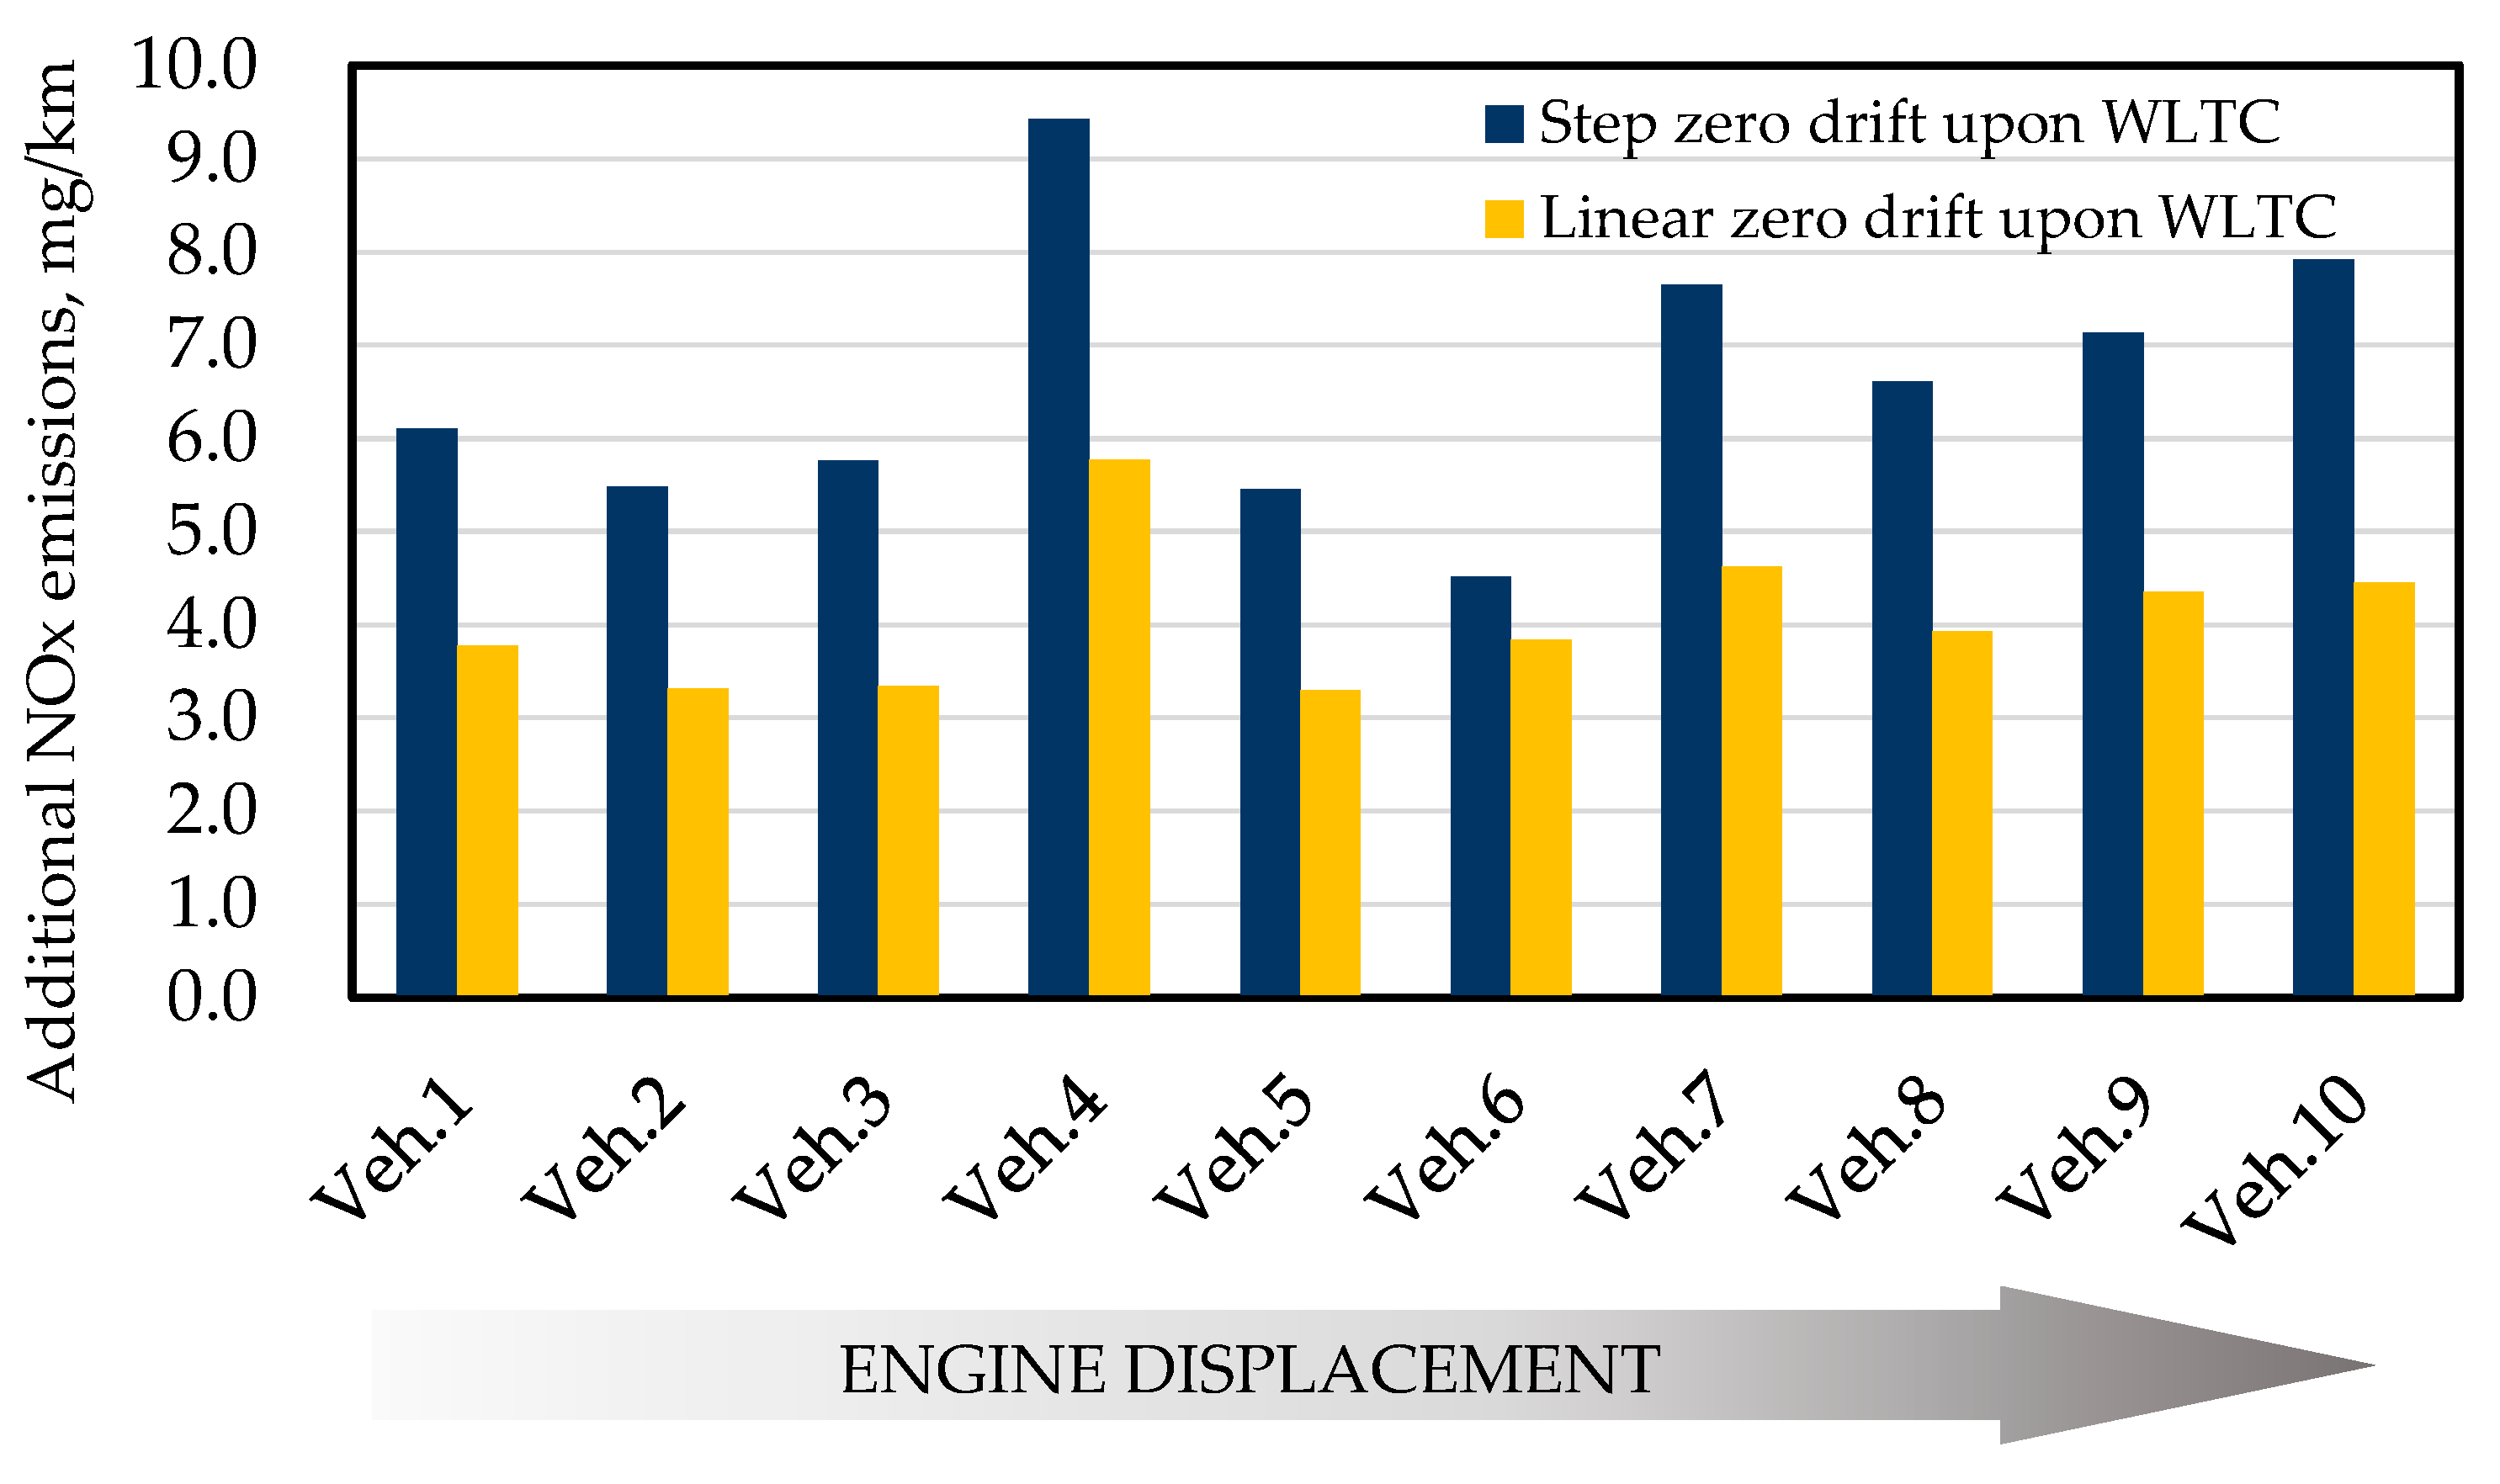
3.1. Zero Drift

In the 2017 evaluation conducted by the JRC team, two assumptions, namely, linear drift and step drift, were adopted for the estimation of PEMS zero drift, and the permissible limit of 5 ppm for zero drift was used [25]. Undoubtedly, this method is scientifically sound and logically reasonable, but the research team also pointed out that in future work, the actual performance of PEMS instruments should be evaluated on a proper RDE route, which would substantially improve the practicability of the results. In the JRC 2018–2019 report [26], a special case of significant drift was selected for the zero-drift evaluation. The China RDE regulation-making group realized this issue in 2016 and accumulated test data under extreme temperature, humidity, and altitude conditions from 2016 to 2021, which were used in the evaluation reported in this paper.
In this study, the zero drift of the three examined PEMS models was determined on various valid RDE test routes in different cities under different boundary conditions. The PEMS units were first calibrated using zero and span gas prior to the start of testing. During the test, the zero points of the NO/NOx analyzers were checked for 5 min manually every 15 min of operation. This zero-checking procedure was repeated 4–6 times for each RDE trip, and the readings of the NO/NOx analyzers were recorded to express the zero drift during real RDE testing. The average of each 5 min checking window of each PEMS model is plotted in Figure 2 as a function of time.
Figure 2 plots the zero-drift performance of the PEMS instruments from three main manufacturers on valid RDE routes. It can be observed in Figure 2 that the performance of PEMS #1 was steady and reliable, even in Kunming, a city with a very high testing altitude and ambient humidity. The actual zero drift of PEMS #1 was always less than 1 ppm. There are no signs showing that the zero drift of PEMS #1 was influenced by the boundary conditions. PEMS #2 showed a different tendency than PEMS #1. In the first half of the tests, the zero drift of PEMS #2 seemed to be even larger than in the second half, which strongly disobeys the concept of linear drift. Nevertheless, the poorest zero drift of PEMS #2 was about 3 ppm, about 40% smaller than the permissible limit of 5 ppm in the current regulations. The rest of the zero reading points were all within 2 ppm. It is interesting to note that in three of the four testing cities, PEMS #3 performed well, and the majority of the zero-drift checks were maintained at a level of <1 ppm. However, during the test in Kunshan, where the testing altitude, temperature, and humidity were the closest to laboratory conditions, the zero drift of PEMS #3 jumped to −3.4 ppm unexpectedly 20 min after the start of testing, and in the next check, the zero drift was preserved around −4 ppm. Nonetheless, the zero drift of PEMS #3 could still fulfill the legislative requirement for values no larger than 5 ppm. Because there was no malfunction alarm during this test, it is unknown what type of flaw induced this phenomenon.
Overall, the PEMSs showed virtually no correlation with the boundary conditions or measurement principle. The zero drifts detected in real testing practices seem more like spontaneous incidents. Using either a linear or step model to estimate the uncertainty attributed to zero drift could result in a considerable error. Compared to the linear assumption, step drift is more conservative because it assumes the maximum drift happens right after the start of testing, which always overestimates the uncertainty along with the zero drift. Additionally, the method presented in the JRC 2018–2019 report, i.e., picking a specific case, does not seem to be representative of the selection of significant drift cases to assess zero drift. Therefore, we still think that step drift is a more reasonable choice for now.
Figure 3 summarizes the frequencies of the 256 recorded zero-drift check events in the valid RDE tests, along with the 95% confidence window. It can be seen that, in most cases, the zero drift of the PEMS NOx detector ranged from −3.8 ppm to 3.8 ppm, while in the conclusion of the JRC 2020 report, 3 ppm is the reported value. Based on this fact, in the calculation of the additional NOx emissions corresponding to zero drift, this paper used 3.8 ppm zero drift to replace the permissible limit of 5 ppm used in the JRC 2017–2019 report and China-6 regulations.
Based on the WLTC, Figure 4 plots the results of the additional NOx emissions calculation using 3.8 ppm drift as input. In this figure, the additional NOx emissions were still calculated using linear and step drift assumptions separately since, according to Figure 2, the zero drift in the RDE measurement behaved like a combination of these two regimes. It can be seen in Figure 4 that over both the WLTC and its low-speed stage, the additional NOx emissions derived from the step drift assumption were always more than 50% higher than those from the linear assumption. Over the WLTC, the maximum additional NOx emissions calculated using the step drift assumption were 9.4 mg/km. The value for the low-speed stage of the WLTC was 14.5 mg/km.
It can also be observed in Figure 4 that neither the additional NOx emissions over the WLTC nor its low-speed stage showed a clear inclination with the physical displacement of the engines. This is due to the employment of turbocharging and hybrid propulsion technologies. In Figure 5 there is an evident correlation between the exhaust flow rate and additional NOx emissions. Figure 5 also helps to identify the worst case of zero drift among the ten test vehicles, which was about 5.1 mg/km.

3.2. Span Drift

Similar to Figure 3, Figure 6 summarizes the 256 span drift check events from the valid RDE tests. It was found that more than 95% of the span drifts were within a range from −1.5% to 1.5%. Hence, in this paper, a span drift level of 1.5% was used to replace the 2.0% level that the JRC team used in their 2017–2020 report [23,26,29].
In agreement with the JRC’s assumption of span drift, the span drift was assumed to be linear, with 0% at 0 ppm and 1.5% at the span concentration. We took 1.5% of the span drift into the calculation of additional NOx emissions over the WLTC and its low-speed stage. The results are illustrated in Figure 7. It can be noticed that the influence of span drift at such a level on the final NOx calculation was almost negligible. Even over the low-speed stage of the WLTC, which is the most sensitive stage to span drift, the derived additional NOx emissions were only 0.027 mg/km or 0.027% in percentage, far smaller than the impact of zero drift.
Using the uncertainty framework, Figure 8 presents the combined uncertainty of PEMS NOx measurements using local data collected in China and China-6 limits as input. Corresponding to the 60 mg/km and 35 mg/km limits set for China-6a (effective nationwide from January 2021, delayed due to COVID-19) and China-6b (effective nationwide from July 2023), the calculated PEMS NOx measurement absolute uncertainties are 26.5% and 42.8%, respectively.
When taking into account the deduction in the CVS uncertainty, the PEMS NOx measurement relative uncertainties of 6a and 6b are still 26.5% and 42.8%, respectively. Compared to the EU 2017 uncertainties of 24.7% (linear zero drift) and 43.5% (step zero drift) [23], the EU 2018–2019 uncertainty of 32.0% [26] and the 2021 published re-evaluation result of 22.5% [29], the uncertainties derived from the Chinese regulation are generally larger, which is predominantly due to the more stringent limit values. In the three rounds of uncertainty evaluation, the JRC team targeted diesel vehicles and thus used the 80 mg/km NOx cap. However, China-6 is a fuel- and technology-neutral regulation, which means that the uniform limit values are applicable to vehicles in a certain category using any fuel or technology.

4. Conclusions and Future Prospects

To better support the promulgation of RDE regulations in the current and future vehicle emission regulations in both China and the EU, a systematic evaluation of the NOx measurement uncertainty using PEMSs was carried out based on real testing data collected in China. In addition to the “relative to CVS” uncertainty of PEMSs evaluated by the JRC, this paper also considered the uncertainty of a CVS. The main findings of this paper are presented below.
(1) Zero-drift levels were checked in real-world RDE testing practices under a series of extreme boundary conditions to replace the permissible limit of 5 ppm used in the previous evaluation. The new method checked the zero points by pumping pure nitrogen every 15 min under standard operating conditions. In a broader range of ambient temperatures, humidities, and altitudes, 95% of the detected zero drifts were observed to be within 3.8 ppm. The largest additional NOx emissions for 1.5 to 3.0 L engines due to a step zero drift of 3.8 ppm were 9.4 mg/km, with the worst case being 5.1 mg/km.
(2) In total, 95% of the span drift events were found to be within 1.5%, and the evaluation using this value showed that span drift only posed a negligible impact on the final calculation of NOx emissions.
(3) The uncertainties of PEMS NOx measurement corresponding to China-6a and China-6b limits were 26.5% and 42.8%, respectively, which are larger than the EU’s 2017 and 2020 results, mainly because of the more stringent NOx limits of the China-6 regulations.
The results of this paper also indicate that, along with the implementation of stricter NOx emission limits, serious challenges will be posed in terms of the reliability of PEMS measurements, which requires PEMS manufacturers to improve the performance of instruments and policymakers to refine the test procedures and/or result calculation methods to minimize the impacts.
A deficiency of this paper is that the current assessment of NOx PEMS measurement uncertainty is predominantly based on gasoline-fueled light-duty passenger cars. To make the assessment results more representative, more diesel-fueled light-duty vehicles will be included in future assessments.
In addition to NOx, the on-road measurement uncertainty of CO, solid particles, and CO2, considering the global need for carbon neutrality, needs to be sufficiently understood to create a solid basis for future regulation promulgation.

Author Contributions

Conceptualization, S.S. and P.H.; methodology, S.S., X.W. and Y.G.; software, P.H.; validation, T.L.; formal analysis, P.H. and Y.L.; investigation, W.L., T.L. and P.H.; resources, T.L.; data curation, X.W. and T.L.; writing—original draft preparation, X.W. and T.L.; writing—review and editing, P.H., Y.W. and L.L.; visualization, X.W., T.L. and P.H.; supervision, S.S.; project administration, P.H. and Y.L. All authors have read and agreed to the published version of the manuscript.

Funding

This research received no external funding.

Institutional Review Board Statement

Not applicable.

Informed Consent Statement

Not applicable.

Data Availability Statement

No new data were created or analyzed in this study. Data sharing is not applicable to this article.

Conflicts of Interest

The authors declare no conflict of interest.

Abbreviations

CLSChemiluminescence
CPCCondensed Particle Counter
CVSConstant Volume Sampler
DCDiffusion Charger
DPFDiesel Particulate Filter
EFMExhaust Flow Meter
GDIDirect Injection
ICEInternal Combustion Engine
MAWMoving Average Window
NDUVNon-Dispersive Ultraviolet
PEMSPortable Emission Measurement System
PFIPort Fuel Injection
PMParticulate Matter
PNParticulate Number
RDEReal Driving Emissions
SEEStandard Error of Estimate
WLTCWorldwide Harmonized Light-Duty Vehicle Test Cycle

References

  1. Blanco-Rodriguez, D.; Vagnoni, G.; Holderbaum, B. EU6 C-Segment Diesel vehicles, a challenging segment to meet RDE and WLTP requirements. IFAC-PapersOnLine 2016, 49, 649–656. [Google Scholar] [CrossRef]
  2. Donateo, T.; Giovinazzi, M. Building a cycle for Real Driving Emissions. In Ati 2017—72nd Conference of the Italian Thermal Machines Engineering Association; Fortunato, B., Ficarella, A., Torresi, M., Eds.; Elsevier: Amsterdam, The Netherlands, 2017; Volume 126, pp. 891–898. [Google Scholar]
  3. Kousoulidou, M.; Fontaras, G.; Ntziachristos, L.; Bonnel, P.; Samaras, Z.; Dilara, P. Use of portable emissions measurement system (PEMS) for the development and validation of passenger car emission factors. Atmos. Environ. 2013, 64, 329–338. [Google Scholar] [CrossRef]
  4. Lv, L.; Ge, Y.; Ji, Z.; Tan, J.; Wang, X.; Hao, L.; Liu, H. Regulated emission characteristics of in-use LNG and diesel semi-trailer towing vehicles under real driving conditions using PEMS. J. Environ. Sci. 2020, 88, 155–164. [Google Scholar] [CrossRef] [PubMed]
  5. Simonen, P.; Kalliokoski, J.; Karjalainen, P.; Ronkko, T.; Timonen, H.; Saarikoski, S.; Ntziachristos, L. Characterization of laboratory and real driving emissions of individual Euro 6 light-duty vehicles—Fresh particles and secondary aerosol formation. Environ. Pollut. 2019, 255, 113175. [Google Scholar] [CrossRef] [PubMed]
  6. Vlachos, T.G.; Bonnel, P.; Perujo, A.; Weiss, M.; Villafuerte, P.M.; Riccobono, F. In-Use Emissions Testing with Portable Emissions Measurement Systems (PEMS) in the Current and Future European Vehicle Emissions Legislation: Overview, Underlying Principles and Expected Benefits. SAE Int. J. Commer. Veh. 2014, 7, 199–215. [Google Scholar] [CrossRef]
  7. RDE1. Commission Regulation (EU) 2016/427. Amending egulation (EC) No 692/2008 as regards emissions from light passenger and commercial vehicles (Euro 6). Annex IIIA of the commission Regulation (EC) No. 692/2008 (2016). Verifying RealDriving Emissions. Off. J. Eur. Union 2016, L82, 1–97. [Google Scholar]
  8. Wang, Y.; Ge, Y.; Wang, J.; Wang, X.; Yin, H.; Hao, L.; Tan, J. Impact of altitude on the real driving emission (RDE) results calculated in accordance to moving averaging window (MAW) method. Fuel 2020, 277, 117929. [Google Scholar] [CrossRef]
  9. RDE2. Commission Regulation (EU) 2016/646. Amending egulation (EC) No 692/2008 as regards emissions from light passenger and commercial vehicles (Euro 6). Annex IIIA of the commission Regulation (EC) No. 692/2008 (2016). Verifying RealDriving Emissions. Off. J. Eur. Union 2016, L109, 1–22. [Google Scholar]
  10. RDE3. Commission Regulation (EU) 2017/1154 of 7 June 2017 amending Regulation (EU) 2017/1151 supplementing Regulation (EC) No 715/2007 of the European Parliament and of the Council on type-approval of motor vehicles with respect to emissions from light passenger and commercial vehicles (Euro 5 and Euro 6) and on access to vehicle repair and maintenance information, amending Directive 2007/46/EC of the European Parliament and of the Council, Commission Regulation (EC) No 692/2008 and Commission Regulation (EU) No 1230/2012 and repealing Regulation (EC) No 692/2008 and Directive 2007/46/EC of the European Parliament and of the Council as regards real-driving emissions from light passenger and commercial vehicles (Euro 6). Off. J. Eur. Union 2017, L175, 708–732. [Google Scholar]
  11. Feist, M.D.; Sharp, C.A.; Spears, M.W. Determination of PEMS Measurement Allowances for Gaseous Emissions Regulated Under the Heavy-Duty Diesel Engine In-Use Testing Program: Part 1—Project Overview and PEMS Evaluation Procedures. SAE Int. J. Fuels Lubr. 2009, 2, 435–454. [Google Scholar] [CrossRef]
  12. Buckingham, J.P.; Mason, R.L.; Spears, M.W. Determination of PEMS Measurement Allowances for Gaseous Emissions Regulated Under the Heavy-Duty Diesel Engine In-Use Testing Program: Part 2—Statistical Modeling and Simulation Approach. SAE Int. J. Fuels Lubr. 2009, 2, 422–434. [Google Scholar] [CrossRef]
  13. Sharp, C.A.; Feist, M.D.; Laroo, C.A.; Spears, M.W. Determination of PEMS Measurement Allowances for Gaseous Emissions Regulated Under the Heavy-Duty Diesel Engine In-Use Testing Program: Part 3—Results and Validation. SAE Int. J. Fuels Lubr. 2009, 2, 407–421. [Google Scholar] [CrossRef]
  14. Bougher, T.L.; Khalek, I.A.; Laroo, C.A.; Bishnu, D.K. Determination of the PEMS measurement allowance for PM emissions regulated under the heavy-duty diesel engine in-use testing program. SAE Int. J. Engines 2012, 5, 1371–1386. [Google Scholar] [CrossRef]
  15. Durbin, T.D.; Johnson, K.; Cocker, D.R.; Miller, J.W. Evaluation and comparison of portable emission measurement systems and federal reference methods for emissions from a back-up generator and a diesel truck operated on a chassis dynamometer. Environ. Sci. Technol. 2007, 41, 6199–6204. [Google Scholar] [CrossRef]
  16. Johnson, K.C.; Durbin, T.D.; Jung, H.; Cocker, D.R., III; Bishnu, D.; Giannelli, R. Quantifying in-use PM measurements for heavy duty diesel vehicles. Environ. Sci. Technol. 2011, 45, 6073–6079. [Google Scholar] [CrossRef] [PubMed]
  17. Khan, M.Y.; Johnson, K.C.; Durbin, T.D.; Jung, H.; Cocker, D.R., III; Bishnu, D.; Giannelli, R. Characterization of PM-PEMS for in-use measurements conducted during validation testing for the PM-PEMS measurement allowance program. Atmos. Environ. 2012, 55, 311–318. [Google Scholar] [CrossRef]
  18. Mamakos, A.; Bonnel, P.; Perujo, A.; Carriero, M. Assessment of portable emission measurement systems (PEMS) for heavy-duty diesel engines with respect to particulate matter. J. Aerosol Sci. 2013, 57, 54–70. [Google Scholar] [CrossRef]
  19. Gallus, J.; Kirchner, U.; Vogt, R.; Börensen, C.; Benter, T. On-road particle number measurements using a portable emission measurement system (PEMS). Atmos. Environ. 2016, 124, 37–45. [Google Scholar] [CrossRef]
  20. Giechaskiel, B.; Carriero, M.; Bonnel, P.; Schindler, W.; Scheder, D.; Bassoli, C.; Niemela, V. Feasibility of Particulate Mass and Number Measurement with Portable Emission Measurement Systems (PEMS) for In-Use Testing. SAE Tech. Pap. 2011, 24, 0199. [Google Scholar]
  21. Schwelberger, M.; Giechaskiel, B. Evaluation of Portable Number Emission Systems for Heavy-Duty Applications under Steady State and Transient Vehicle Operation Conditions on a Chassis Dynamometer. SAE Tech. Pap. 2018, 01, 0348. [Google Scholar]
  22. Weiss, M.; Bonnel, P.; Hummel, R.; Provenza, A.; Manfredi, U. On-road emissions of light-duty vehicles in Europe. Environ. Sci. Technol. 2011, 45, 8575–8581. [Google Scholar] [CrossRef] [PubMed]
  23. Giechaskiel, B.; Clairotte, M.; Valverde, V.; Bonnel, P. Real driving emissions: 2017 assessment of Portable Emissions Measurement Systems (PEMS) measurement uncertainty. Jt. Res. Cent. 2018. [Google Scholar] [CrossRef]
  24. Giechaskiel, B.; Schwelberger, M.; Delacroix, C.; Marchetti, M.; Feijen, M.; Prieger, K.; Karlsson, H.L. Experimental assessment of solid particle number Portable Emissions Measurement Systems (PEMS) for heavy-duty vehicles applications. J. Aerosol Sci. 2018, 123, 161–170. [Google Scholar] [CrossRef]
  25. Giechaskiel, B.; Clairotte, M.; Valverde-Morales, V.; Bonnel, P.; Kregar, Z.; Franco, V.; Dilara, P. Framework for the assessment of PEMS (Portable Emissions Measurement Systems) uncertainty. Environ. Res. 2018, 166, 251–260. [Google Scholar] [CrossRef] [PubMed]
  26. Valverde, V.; Giechaskiel, B.; Carriero, M. Real Driving Emissions: 2018–2019 assessment of Portable Emissions Measurement Systems (PEMS) measurement uncertainty. Jt. Res. Cent. 2020. [Google Scholar] [CrossRef]
  27. CEN/TC 301; Road Vehicles—Portable Emission Measuring Systems (PEMS)—Performance Assessment. European Committee for Standardization: Brussels, Belgium, 2021.
  28. Su, S.; Ge, Y.; Hou, P.; Wang, X.; Wang, Y.; Lyu, T.; Luo, W.; Lai, Y.; Ge, Y.; Lyu, L. China VI heavy-duty moving average window (MAW) method: Quantitative analysis of the problem, causes, and impacts based on the real driving data. Energy 2021, 225, 120295. [Google Scholar] [CrossRef]
  29. Giechaskiel, B.; Valverde, V.; Carriero, M. Real Driving Emissions: 2020 assessment of Portable Emissions Measurement Systems (PEMS) measurement uncertainty. Jt. Res. Cent. 2021. [Google Scholar] [CrossRef]
Figure 1. EU uncertainty calculation scheme with CVS uncertainty excluded.
Atmosphere 14 00702 g001
Figure 2. Zero drifts of three PEMSs from different manufacturers obtained with on-road periodic zeroing; 5 min zeroing after a 15 min drive (legend: city name, altitude, temperature, humidity).
Atmosphere 14 00702 g002aAtmosphere 14 00702 g002b
Figure 3. Statistical distribution of zero-drift events up to a certain concentration level.
Atmosphere 14 00702 g003
Figure 4. Step and linear zero drift over the WLTC and its urban section.
Atmosphere 14 00702 g004aAtmosphere 14 00702 g004b
Figure 5. Determination of the worst case of NOx zero drift.
Atmosphere 14 00702 g005
Figure 6. Statistical distribution of span drift events up to a certain concentration level.
Atmosphere 14 00702 g006
Figure 7. Span drift over the WLTC and its urban section.
Atmosphere 14 00702 g007
Figure 8. PEMS absolute uncertainty results estimated for China-6a and China-6b limits.
Atmosphere 14 00702 g008
Table 1. Vehicle information.
CategoryVehicle Information
Vehicle manufacturerDomestic, overseas
Propulsion systemICE, hybrid
Injection systemPFI, GDI
FuelGasoline, diesel
Emission stageChina-6
Vehicle typePassenger car, SUV, light-duty truck
Displacement1.0–3.0 L
Intake systemNaturally aspirated, turbocharged
TransmissionMT, AT, DCT, CVT
Drive modeFront-wheel drive, rear-wheel drive, four-wheel drive
Table 2. Boundary conditions.
CityTest DateAltitude (m)Ambient Temperature (°C)Ambient Humidity (%)Ambient Pressure (kPa)Cumulative Positive Elevation Gain (m/100 km)
KunshanAug. 20176.425.731.8102.0161.2
Oct. 20187.222.659.1101.8173.8
XiamenOct. 201814.027.447.8102.3375.6
Jun. 202123.631.857.5100.9400.1
Mar. 201916.129.559.3101.0345.3
Aug. 202122.927.248.199.9418.1
Sept. 202119.623.052.0100.8417.5
Oct. 202122.625.742.0101.6390.9
BeijingAug. 201727.934.052.2100.5260.4
Nov. 201827.618.930.7102.6253.0
May 202032.528.534.8100.2226.6
QionghaiOct. 201832.533.154.5101.1347.6
XiangyangSept. 201888.936.227.8100.2370.1
ChongqingOct. 2017285.816.999.498.7436.3
Sept. 2018409.822.969.997.2944.6
May 2020387.022.272.197.3856.3
YinchuanSept. 20171112.820.650.889.2215.8
LanzhouSept. 20171592.217.774.284.6476.3
KunmingOct. 20171896.118.772.981.8406.0
Sept. 20181956.721.961.180.4680.6
Jun. 20202039.623.656.179.3788.1
XiningSept. 20172257.918.446.977.9358.0
Disclaimer/Publisher’s Note: The statements, opinions and data contained in all publications are solely those of the individual author(s) and contributor(s) and not of MDPI and/or the editor(s). MDPI and/or the editor(s) disclaim responsibility for any injury to people or property resulting from any ideas, methods, instructions or products referred to in the content.

