Article

Analysis of Size Distribution, Chemical Composition, and Optical Properties of Mineral Dust Particles from Dry Deposition Measurement in Tenerife: Determined by Single-Particle Characterization

1
Institute for Applied Geosciences, Technische Universität Darmstadt, D-64287 Darmstadt, Germany
2
Department of Life, Earth and Environmental Sciences, West Texas A&M University, Canyon, TX 79016-0001, USA
3
German Meteorological Service, D-63067 Offenbach, Germany
4
Laboratoire Inter-Universitaire des Systems Atmospheric (LISA), Université Paris-Est Créteil and Université Paris Cité, Centre National de la Recherche Scientifique (CNRS), 94010 Créteil, France
*
Authors to whom correspondence should be addressed.
Atmosphere 2023, 14(4), 700; https://doi.org/10.3390/atmos14040700
Submission received: 15 February 2023 / Revised: 14 March 2023 / Accepted: 7 April 2023 / Published: 10 April 2023
(This article belongs to the Special Issue Chemical Composition and Sources of Particles in the Atmosphere)

Abstract

:
In this paper, individual particle analysis by automated scanning electron microscopy (SEM) coupled with energy-dispersive X-ray (EDX) was used to assess the size-resolved information of composition, size distribution, complex refractive index, and mixing state of mineral dust aerosol particles collected using different passive and active samplers. In the study, over 120,000 particles from 53 samples were analyzed. Results show that dust particles are the dominating mineral particle type during this campaign, comprising different classes of silicates, Si-rich (quartz-like), Ca-rich (calcite-like), CaMg-rich (dolomite-like), and CaS-rich (gypsum-like). The results also show that there is no significant difference in composition between suspended and deposited dust particles. By using the particle composition, the size-resolved complex refractive index of dust particles was calculated. The real part of the refractive index varied between 1.71 and 1.53 for wavelengths in the range of 370 to 950 nm. The imaginary part of the refractive index, determined mostly by iron oxide, varied between 3.28 × 10 4 and 7.11 × 10 5 for wavelengths ranging from 250 nm to 1640 nm. In addition, the refractive index values showed a slight decrease with increasing particle size. We also analyzed the potential for buffering of the acid mobilization of iron by other dust compounds. For particles which contain both iron (Fe) and (unprocessed) calcium (Ca), acids that are able to dissolve insoluble Fe particles can react with the Ca particles before reacting with Fe, but eventually, with longer processing time, the Fe particles could be processed. By analyzing the ratio of sulfate mass to the total aerosol mass of individual particles, the mixing state of sulfate particles to the total dust particles was investigated. The analysis showed that the finer dust particles were associated with higher content of sulfate, while the coarse dust particles correspond to lower sulfate contents, revealing that only fine mode sulfate is more internally mixed with mineral dust aerosol particles.

1. Introduction

Mineral dust aerosols, which are produced by wind erosion in arid and semi-arid regions, have received significant attention from the scientific community mainly due to their direct effect on the radiative budget and indirect effect on cloud microphysical properties [1,2]. It has been shown that the global mean direct radiative forcing due to mineral dust aerosols varies in the range of +0.09 to −0.46 Wm−2 [3], and this variation is due to uncertainties related to the size distribution, chemical composition, and source strength of dust particles [4]. Mineral dust aerosols represent the single largest component of the long-range transported global atmospheric aerosol budget, contributing approximately one third of the total natural aerosol mass annually [5].
Dust particles play an important role in biogeochemical cycles by supplying important and limiting nutrients, such as iron and phosphorous, to ocean surfaces [6]. High-nitrate low-chlorophyll (HNLC) [7] areas of the world’s oceans are of particular interest for dust deposition into oceans. As a result, recently, scientific interest regarding the atmospheric deposition of Fe particles to the surface ocean has grown [8]. In addition, the presence of Fe particles in mineral dust has attracted wide scientific interest in climate studies mainly because of its radiative and optical impacts [9].
The atmospheric processing of airborne dust aerosol particles by acid gases (e.g., HNO3, HCl, H2SO4, H2CO3) plays an important role in transforming insoluble iron particles into soluble forms [10,11]. However, dust aerosol particles could also play a pivotal role in neutralizing the acidic species in the atmosphere because of the alkaline buffer potential of carbonate aerosol (e.g., CaCO3) which is commonly found in mineral dust particles [10]. There are some studies [12,13,14] that assume Ca2+ originating from carbonate aerosol buffers acid gases in the atmosphere and thereby restricts iron dissolution. In addition, there are also reports that, on a single-particle basis, carbonate that is internally mixed with iron could buffer acids before the iron would be solubilized [15]. Furthermore, identifying the state of mixing of an aerosol particle is important because the mixing state can have an impact on the radiative properties of aerosol particles [16]. For example, it has been demonstrated by single-particle analysis that mineral dust aerosol particles are frequently mixed with sulfate [17,18,19].
In most cases, the chemical composition of mineral dust particles was studied on the basis of bulk samples [20,21]. However, dust aerosol includes widespread individual particles with different physical and chemical properties. For example, Dall’Osto, Harrison, Highwood, O’Dowd, Ceburnis, Querol and Achterberg [18] suggested that performing bulk chemical analysis is not sufficient to fully understand different aerosol properties. Therefore, quantification of global impacts of aerosol particles also requires information on single-particle properties in the atmosphere. In this perspective, the characterization of mineral dust by single-particle analysis combining scanning electron microscopy (SEM) provides simultaneous information on several particle properties, such as particle size distribution, composition, and estimated density, particle shape, and internal mixing state on a single-particle level [19,22,23]. Therefore, the approach becomes an important tool to get size-resolved information. Moreover, by using automation procedures, it is possible to study a large number of single particles with high statistical significance [23], although with a loss of information content [24].
The main objectives of this study are: (1) to assess the size-resolved chemical composition and aerosol mass concentration of individual dust particles from dry deposition samples using the single-particle SEM-EDX analysis approach; (2) to assess the optical properties (complex refractive index) of dust aerosol particles; (3) to assess deposition rates of dust particles in the North Atlantic Ocean; and (4) to characterize the inter-particle mixing state of Ca and Fe as a first insight into the aerosol buffering potential. Due to its importance for the objectives, in this study, the iron content in particular will be of interest.

2. Materials and Methods

2.1. Sampling Location and Time

Sahara and the Sahel provide large quantities of soil dust, resulting in a westward flow of mineral dust particles over the North Atlantic Ocean accounting for up to 50% of the global dust budget [20,25]. Because of its proximity to the African continent, the Canary Islands are influenced by dust particles transported from Sahara and Sahel regions. Hence, Tenerife is one of the best locations to study dust flux and consequently the mineralogical composition and potential source regions of dust aerosol particles [26].
A continuous two-month (from July to August 2017) aerosol collection and dry deposition sampling was conducted at Izaña Global Atmospheric Watch Observatory [27,28] located in Tenerife Island (28.309° N, 16.500° W). A map of the location can be found elsewhere [29]. The trade wind inversion, which is a typical meteorological feature of the station shields the observatory generally from local island emissions [30]. Furthermore, the station is situated distant from significant industrial activities. Therefore, Izaña Global Atmospheric Watch observatory is a highly suitable choice for in-situ measurements under “free troposphere” conditions [27,30].
Sampling was performed on top of a measurement installation approximately 2 m above the ground (including the inlet heights of the samplers). The installation was made on a 160 m2 flat horizon-free platform.

2.2. Wind Measurements

An ultra-sonic anemometer (model 81000, R. M. Young Company, Traverse City, MI, USA) was installed at approximately 2 m height above the ground to obtain the 3-D wind velocity and direction. It was operated with a time resolution of 10 Hz to acquire basic information on turbulence structure.

2.3. Particle Sampling and Description of the Samplers

Suspended and deposited dust particles were collected using the two most commonly used passive samplers, namely modified Wilson and Cook (MWAC) [31] as a horizontal (transport) flux sampler and flat-plate (UNC-derived) [32] as a vertical (deposition) flux sampler. In addition, a free-wing impactor (FWI) [33] was also used to collect coarse particles. The MWAC and FWI were mounted on a wind vane to align to ambient wind direction. Detailed information on the sampling techniques is given in [34], illustration can be found in the Supplementary Materials.

2.3.1. Flat-Plate Sampler

The flat-plate sampler used in the current work was derived from the original geometry used in Ott, et al. [35]. Briefly, the geometry contains two round brass plates (with top plate diameter 203 mm, bottom plate 127 mm, and thickness 1 mm each) mounted at a distance of 16 mm. Unlike the original design, the geometry of the current version has a cylindrical dip in the lower plate that recedes the sampling substrate—a SEM stub with a thickness of 3.2 mm—from the airflow, thereby reducing the flow disturbance. This setup helps to prevent large droplets (>1 mm) from reaching the SEM collection surface at the local wind speed [35]. As discussed in [36,37], the relevant mechanisms for particle deposition onto the substrate for this particular sampler are settling due to gravity and turbulent diffusion.

2.3.2. The Modified Wilson and Cook (MWAC) Sampler

The MWAC sampler is based on an original design developed by Wilson and Cook [31]. The sampler consists of a closed polyethylene plastic bottle, serving as a settling chamber, to which an inlet tube and an outlet tube have been added. The sampling bottles are 95 mm long, and have a diameter of 48 mm. The two inlet and outlet plastic tubes with inner and outer diameters 8 and 10 mm respectively, pass air through the cap into the bottle and then out again. The large volume of the bottle relative to the inlet diameter supports the deposition of the dust particles entering the bottle. The clean air then discharges from the bottle via the outlet tube. The sampler used here had the collection surface placed directly below the inlet tube.

2.3.3. Free-Wing Impactor (FWI)

A free rotating wing impactor (FWI) [33,38,39] was used to collect larger particles (>5 µm). The FWI has a sticky impaction surface attached to a rotating arm that moves through the air. Particles deposit on the moving plate. The rotating arm is moved at constant speed by a stepper motor, which is fixed on a wind vane, aligning the FWI to wind direction. The particle size cut-off is defined by the impaction parameter, i.e., by rotation speed, wind speed, and sample substrate geometry. Details of the working principle of FWI can be obtained from the work of Kandler, Schneiders, Ebert, Hartmann, Weinbruch, Prass and Pöhlker [33].

2.4. SEM-Analysis

Individual particle analysis by automated scanning electron microscopy (SEM) was used to characterize samples collected using two different samplers relating to size-resolved particle information. The samples were collected on pure carbon adhesive substrate (Spectro Tabs, Plano GmbH, Wetzlar, Germany) mounted on standard SEM aluminum stubs (12 and 25 mm) inside the different passive samplers. Samples were analyzed using automated scanning electron microscopy (SEM; FEI ESEM Quanta 400 FEG, FEI, Eindhoven, The Netherlands). In total, over 120,000 particles were analyzed: 23 samples from MWAC (48,650 particles), 18 samples from Flat-plate (24,340 particles), and 12 samples from FWI (50,000 particles). All individual particles with projected area diameters greater than 1 µm in the selected areas were used for analysis.
A magnification of 1600× was used (160 nm per pixel) with a ‘Spot size’ of 5 and an acceleration voltage of 12.5 kV (for details refer to [33]. The system software Oxford Aztec 3.3 includes a feature-based automation mode. For particle identification, the backscattered electron (BSE) image was used with a defined threshold. Particles commonly contain heavier elements than carbon and therefore appear as detectable bright spots in the BSE-image. For the detected particles, the chemical information was derived by energy-dispersive X-ray analysis (EDX; Oxford X-Max 120, Oxford Instruments, Abingdon, Oxfordshire, UK).

2.5. Particle Size Measurement

The image analysis integrated into the SEM-EDX software determines the size of particles as a projected area diameter, a diameter of a circle having the same area as the projected area of the particle in consideration.
d g = 4 B π
where B is the area covered by the particle on the sample substrate and dg the projected area diameter.
Following Ott, et al. [40], the volumetric shape factor, Sv, is determined as:
S v = P 2 4 π B  
where P is the perimeter.
The volume-equivalent diameter (dv) (i.e., sphere with the same volume as the irregular shaped particle) is calculated from the projected area diameter via the volumetric shape factor SV:
d v = d g S v = 1 P 2 64 π B 3
The aerodynamic diameter (da) is calculated from the projected area diameter through the use of a volumetric shape factor and aerodynamic shape factor [36].
d a = d v ρ p ρ 0   S d
where S d is the aerodynamic shape factor, and ρ p and ρ 0 the particle density and unit density, respectively. A dynamic shape factor is used here to account for the effect of the shape of a particle in motion [41]. For this work, an experimentally measured average value of S d = 1.41 was considered [41]. As our current work deals with particle sizes >1 µm, the Cunningham slip correction is neglected.

2.6. Mass Flux Calculation

The fluxes are determined by counting and sizing particles that have been deposited on the surface of the substrate. As suggested by Kandler, Schütz, Deutscher, Ebert, Hofmann, Jäckel, Jaenicke, Knippertz, Lieke and Massling [39], an analysis window correction C w was considered. This correction accounts for particles touching the border of the analysis frame and thus being omitted from the analysis area [39], i.e., decreasing the effective analysis area as function of particle size.
C w = w x w y w x d g w y d g
where w x and w y are the dimensions of the analysis rectangle.
The mass flux (M) of the samples is then determined as:
M = π 6 1 A t k ρ p , k d a , k 3 C w , k
where A is the total analyzed area, t is the sample collection time, and k is the index of the particle.
While in general the particle sizes of dust aerosol vary between 0.1 and 100 µm diameter subjected to meteorological conditions and soil characteristics (e.g., [42]), in this work, the SEM analysis is confined to particles between 1 and 64 µm for reasons of counting statistics. The size distribution was then divided into six size logarithmically equidistant sections: 1–2 µm, 2–4 µm, 4–8 µm, 8–16 µm, 16–32 µm, and 32–64 µm. Unless otherwise stated, the particle size range is classified as ‘large’ being 5–20 µm and giant being >20 µm. Mass fluxes were calculated for each class of mineral particles using Equation (5).

2.7. Determining the Size Distributions for Mass Concentration from the Free-Wing Impactor Measurements

A complete description of the working principle and atmospheric concentration calculation has been presented [33,34,39]. Briefly, considering the windows correction and the collection efficiency dependence on the impaction speed and geometry, the overall collection efficiency is calculated. After calculating the collection efficiency, the concentration is calculated from number of particles, sampled volume, sampling time, and impaction efficiency.

2.8. Determining the Atmospheric Concentration from Deposition Fluxes

The atmospheric concentration (C) is calculated from the mass flux by the generic relationship
C = M v d
where v d is the deposition velocity, depending on sampler geometry. For more details, refer to [34].

2.9. Chemical Composition and Composition Classification

As we collected a large number of particles, true mineralogical phase determination of individual particles was not possible. Instead, we present the analysis of the chemical composition of individual particles, which is then grouped into mineralogical classes according to the particle composition.
Hence, 18 elements were chosen as major compounds (F, Na, Mg, Al, Si, P, S, Cl, K, Ca, Ti, V, Cr, Mn, Fe, Co, Ni, and Cu) for the classification. An element index R X [23,43] is calculated as follows:
R X = X F + N a + M g + A l + S i + P + S + C l + K + C a + T i + V + C r + M n + F e + C o + N i + C u
According to R X and calculations thereof, the mineral particles from the dust aerosol were classified into 31 different groups (for details, see Table S1 in the Supplementary Materials).

2.10. Calculation of the Refractive Index

The complex refractive index is considered to be the most basic and important number for describing the optical properties of aerosol particles [44]. In the present study, we estimate the size-resolved complex refractive index from the chemical composition. It is generally represented by using the following equation (e.g., [45]):
m λ = n λ + i k λ
where n λ and k λ are a real part, also known as the simple index of refraction, and the imaginary part, respectively.
To each particle, a real part of refractive index available from literature, which matches the estimated mineral composition best, is assigned. The refractive index values used for the different particle groups are given in Table 1.
Contrary to the real part (which expresses the extent of scattering by the particle), the imaginary part indicates an absorption loss [45]. In this work, the imaginary part is estimated from the iron inside each single particle by using the following empirical equation (e.g., [46]):
k λ = a M F e + b
where MFe is the mass concentration of iron oxide, and a and b are slope and intercept, respectively. The required iron oxide content is calculated from the total mass of iron in the particle based on the formula suggested by Di Biagio, Formenti, Balkanski, Caponi, Cazaunau, Pangui, Journet, Nowak, Andreae, Kandler, Saeed, Piketh, Seibert, Williams and Doussin [46].
We determine the imaginary parts of the refractive index at discrete wavelengths between 370 and 950 nm.
The average complex refractive index of the total aerosol is finally calculated as the volume average of the single particles by using the following equation (e.g., [47,48]):
m λ = i m λ , i v i v i
where m λ , i and v i are the refractive index and the volume of particle i , respectively.
We are aware that this volume mixture rule is a great simplification of the physical processes (e.g., [49,50]). However, the detailed information required for the in-depth modeling approaches is not available for large numbers of particles. Therefore, we use volume mixing as a first-order estimate, which is, in general, a fair approach in the range of the uncertainties (e.g., [47,51,52]).

2.11. Comparison of Mineral Dust Concentrations—Tenerife vs. Barbados

There is a report that the long-range transport of desert dust that PM10 does not change much between Tenerife and Barbados [53]. However, there is no such report on measurements for large particles. Therefore, in this work, a comparison of mass concentration size distributions from FWI measurements is shown in between these two regions. To the best of our knowledge, this is the first study to show the mass concentration size distribution comparison of large particles in these two regions.

2.12. Aerosol Buffering Potential

In order to investigate the buffering potential of dust aerosol, we assessed the inter-particle mixing state of Ca and Fe compounds by sorting particles into a matrix spanned by the Ca and Fe index. Details of the method of sorting particles into a matrix were presented by Kandler, et al. [54]. Briefly, the particles were classified into different groups using the intervals in R F e and R C a . In these intervals, the mass concentration of Fe and Ca was determined. Furthermore, the processing state of the major carbonates was described by a relative ion balance:
P c a r b = 2 R C a + 2 R M g 2 R S 2 R C a + 2 R M g + 2 R S

2.13. Mixing of Sulfate Particle with Dust

Identifying the state of mixing of aerosol particles is important because the mixing state can have an impact on radiative properties [16] or on deposition speed [33]. It has been demonstrated by single-particle analysis that mineral dust aerosol particles are frequently mixed with sulfate [17,18,19].
The mixing state of dust particles with sulfur is assessed by a single particle calculation of the mass of sulfate and the dust mass, which are then summarized into size classes.

3. Results and Discussion

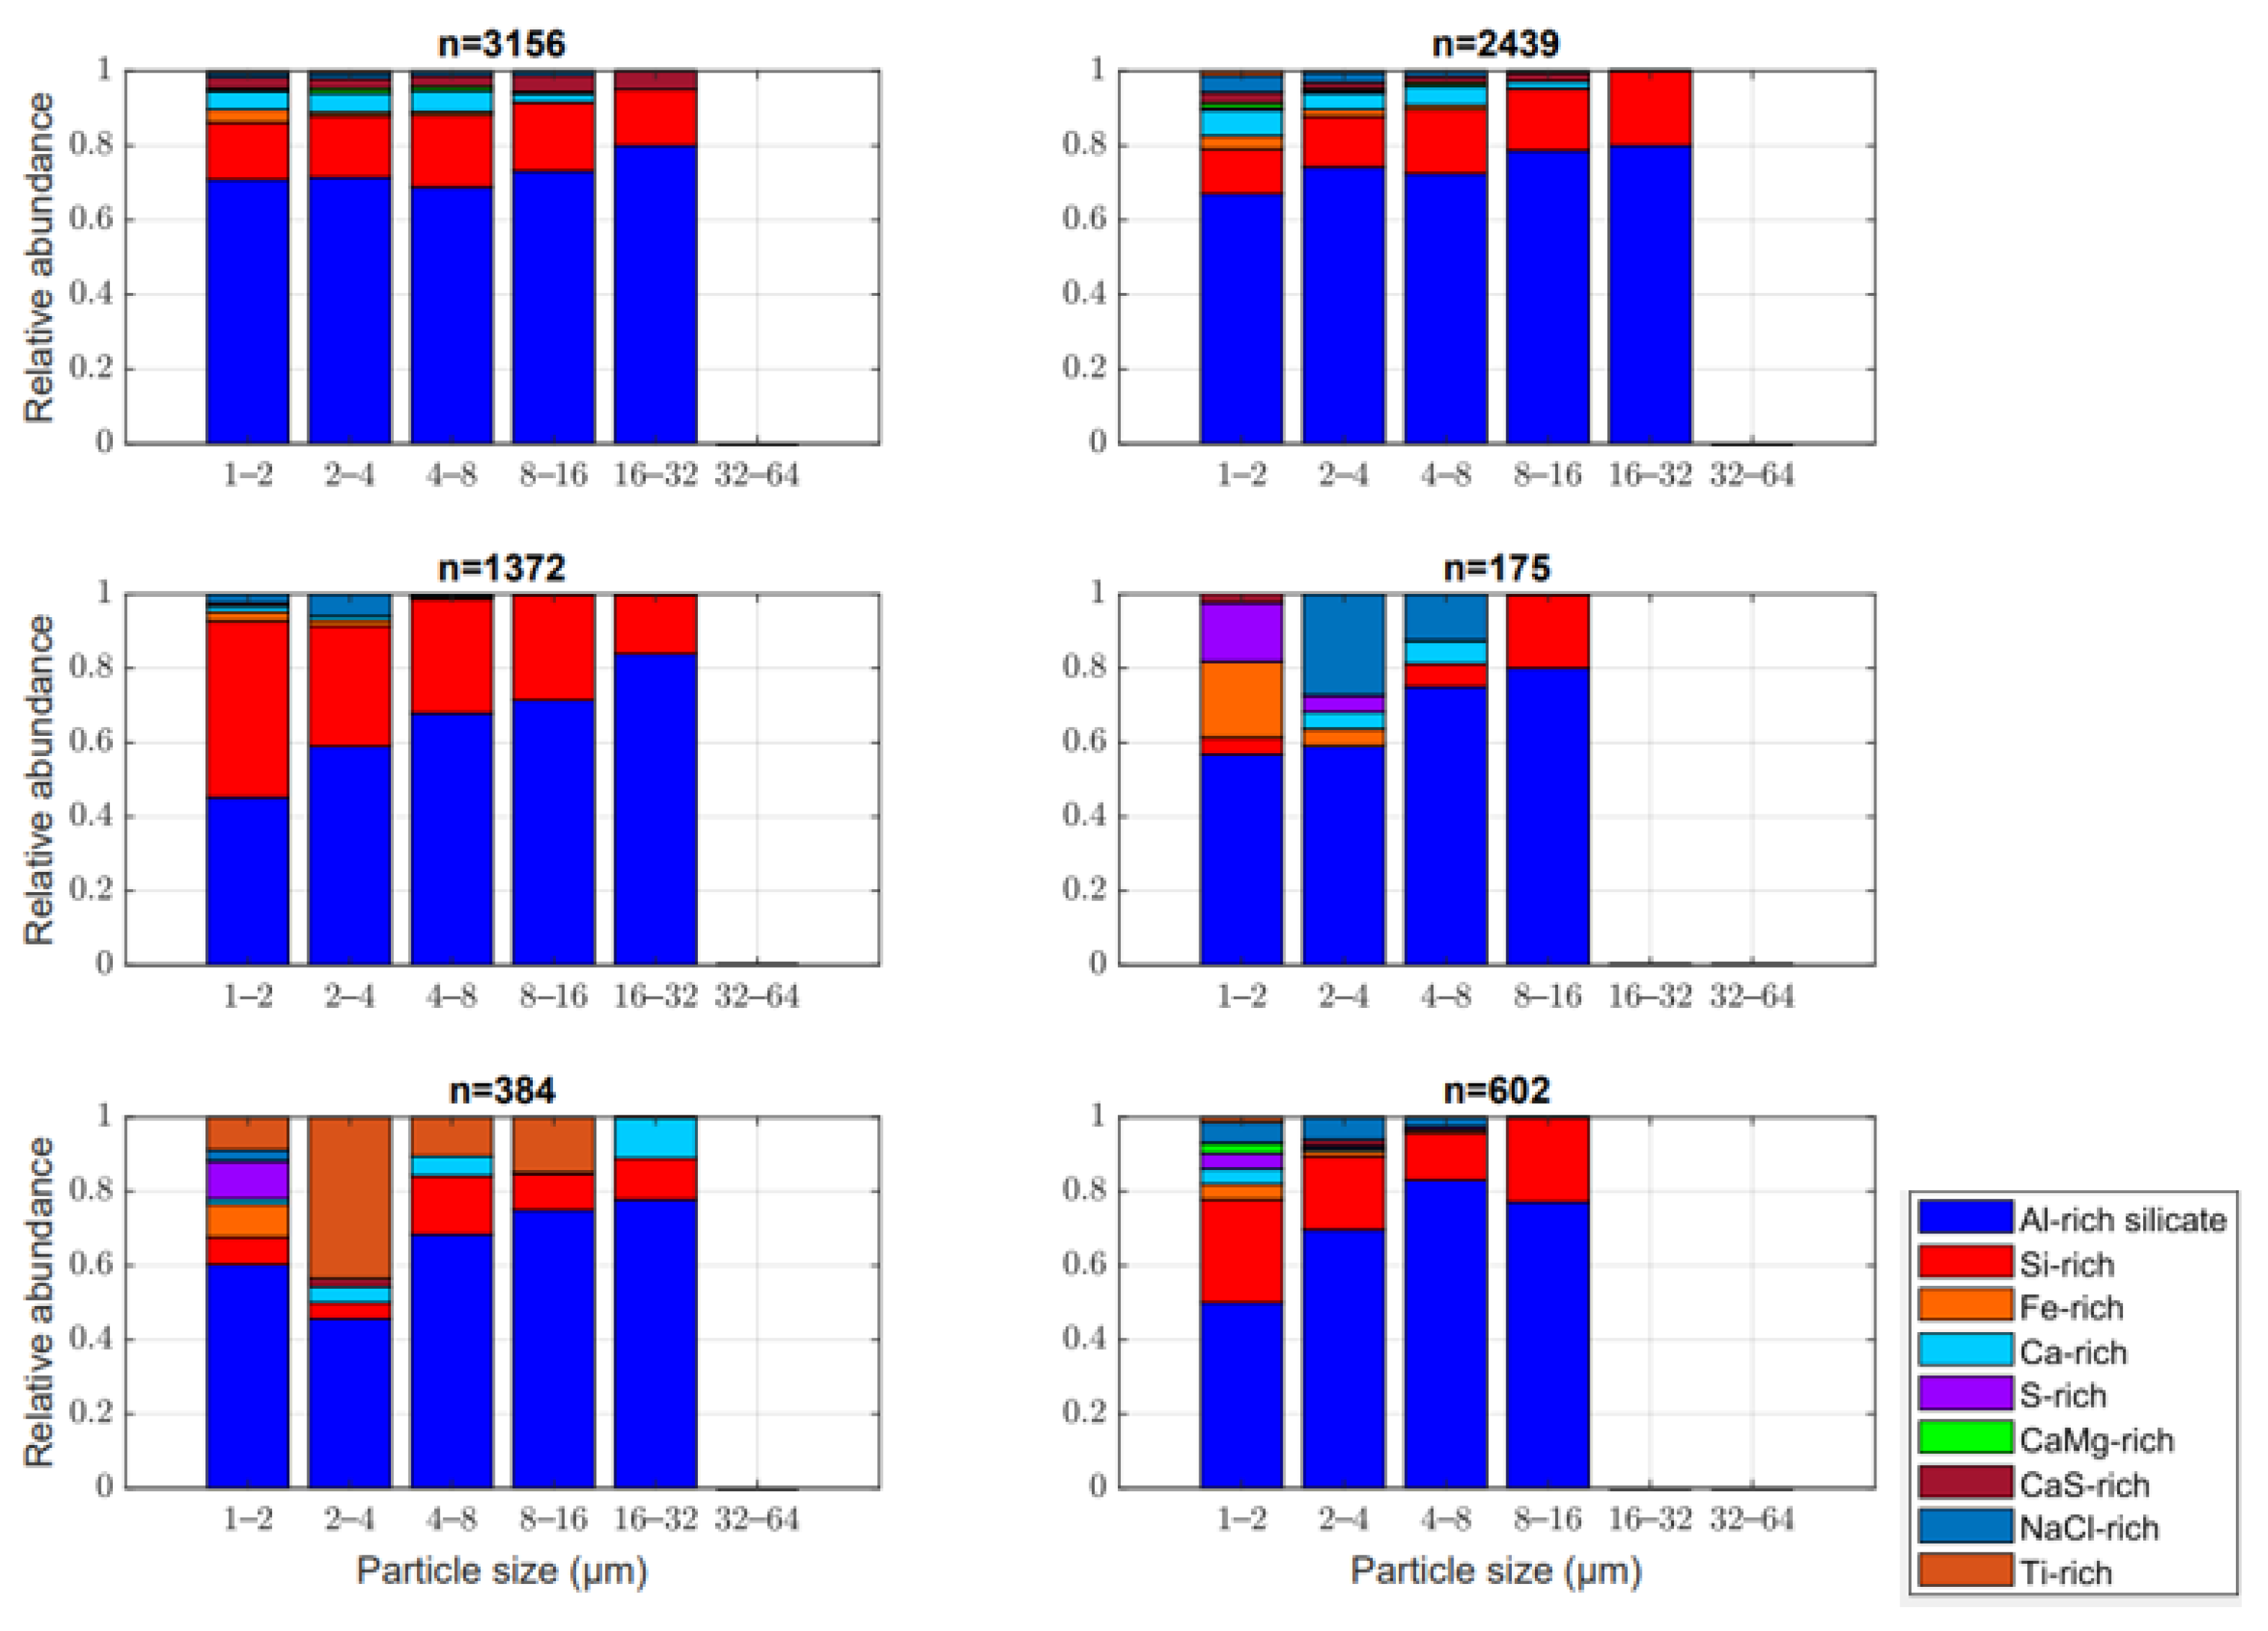
3.1. Chemical Composition

Unless otherwise specified, the results presented in this section and elsewhere in Section 3 belong to the samples collected using the flat plate sampler, as for this type the most data covering the longest time periods are available.
Figure 1 (see also Figure S1A,B in the Supplementary Materials) show an overview of the relative proportions of major particle groups versus particle size. Overall, the chemical composition of the collected dust particles does not show a significant variability during the campaign. As expected, the overall mass composition is dominated by mineral dust aerosol particles during this particular campaign, mainly consisting of different classes of silicates, Si-rich (quartz-like), Ca-rich (calcite-like), CaMg-rich (dolomite-like), and CaS-rich (gypsum-like) particles. These findings are well comparable to previous reports for this location [23,52,55,56].

3.2. Composition and Flux Analysis (Horizontal vs. Vertical Dust Flux)

A comparison of the composition between deposited and suspended dust particles is illustrated in Figure 2. Horizontal (the suspended) and vertical (deposited) dust fluxes show similar composition. In both cases, the composition is dominated by dust aerosol particles, and silicates (Al-rich silicates) represent the dominant component. In addition to the silicates, the Si-rich (quartz) particles contribute to the composition in significant amounts. The plots with large dust flux in both suspended and deposited cases are related to dust storm outbreaks.
The dust flux is high for both suspended and deposited particles during dust event days (e.g., 9 August 2017). It becomes evident that in both cases, the total mass deposition flux is dominated by coarse particles (16–32 µm). Furthermore, high temporal variability in total mass deposition flux is observed in both suspended and deposited dust particles, differently to the composition, which is rather constant.
The contribution of iron from dust is of particular interest for HNLC regions. Therefore, we found it important to report the flux of Fe-rich particles to the study region. The size-resolved deposition rates of Fe-rich particles from horizontal and vertical (deposition) flux is also presented in Figure 2. As displayed in the figure, a small amount of Fe-rich particles is also distinguished, particularly for particles less than 10 µm in size, which agrees well with previous findings (e.g., [23]). In general, the analysis (from both suspended and deposited dust particles) shows that there is a strong dependence of the chemical composition on the particle size. Furthermore, it is observable from the graph that the results with respect to total mass fluxes depend on the type of sampler. As a result, only results from one sampler type should be considered for comparison.

3.3. Size Distributions from the Free-Wing Impactor Measurements

Figure 3 below (see also Figure S2 in the Supplementary Materials) shows a comparison of the median and 90% central quantile mass concentration size distribution in between Tenerife and Barbados derived from FWI measurements. From the graph, it is clear that in both regions, the size distribution peaks approximately at the same size interval (8–16 µm). However, the two regions have different maximum values. For example, Tenerife has on average a dM/dlogd of 250–400 µg/m3 while Barbados has dM/dlogd of 11–24 µg/m3. This finding is in principle in agreement with the previous report [53], where it was shown that dust concentration in PM10 size range (which has due to the high particle density approximately a 50% cut-off at d g = 6 7   µ m ) does not change strongly during trans-Atlantic transport. However, a massive change in concentration for larger particles is visible here for particles which could not be detected in this previous study.
There are also previous reports showing the existence of coarse and giant size dust particles both over desert regions and far from source regions. For example, Weinzierl, et al. [57] detected the presence of particles larger than 40 µm in 20% of cases over Morocco during the Saharan Mineral Dust Experiment (SAMUM1). Similarly, Ryder, et al. [58] reported the presence of dust particles sized over 100 µm over Mali and Mauritania. Correspondingly, another study conducted over the Atlantic Ocean reported the presence of dust particles sized over 10 µm [59]. However, Weinzierl, Sauer, Esselborn, Petzold, Veira, Rose, Mund, Wirth, Ansmann and Tesche [59] did not show the presence of particles sized over 30 µm. A closer look at Figure 4, which is a compilation of the average size distribution in Morocco and Cape Verde reported by Kandler, et al. [60], indicates that concentration at regions closer to the source (particularly coarse modes) is greater than those found far from their source, as could be expected due to gravitational settling. Similar findings are also reported elsewhere, e.g., [61]. The physical process keeping particles of this size aloft for this long-range transport is, however, still to be described in detail [62].

3.4. Complex Index of Refraction

Studies show that the complex refractive index of mineral dust aerosols is mainly controlled by the mineralogical composition of a particle (e.g., [63,64]). The real and imaginary parts of the averaged refractive index (RI) for all analyzed particles as a function of particle size and wavelength is shown in Figure 5 (see also Figures S3–S13 in the Supplementary Materials). The real (m(λ)) and imaginary (k(λ)) parts show similar spectral behavior, in that both m(λ) and k(λ) at shorter wavelengths have higher values. The real part of the refractive index (m(λ)) at shorter wavelengths is close to 1.61 while the imaginary part of the refractive index (m(λ)) at shorter wavelengths is 3.2 × 10 4 . The real part is slightly decreasing with increasing particle size, reflecting the decreasing abundance of quartz and calcite particles. Similarly, the imaginary part of the complex refractive index shows a slight decrease with increasing particle size, showing a decreasing abundance of iron oxide with the particle size in the sample [23].

3.5. Aerosol Potential Buffering

A conceptual model showing a possible acid processing for an internal and external mixture of Fe and Ca particles is shown in the work Kandler, Schneiders, Heuser, Waza, Aryasree, Althausen, Hofer, Abdullaev and Makhmudov [54]. The model indicates that if acid concentration is low, the external Ca might be sufficient to buffer it. When acid concentration is higher, it will overcome the carbonate buffer potential, and as a result, Calcium carbonate particles dissolve. However, the non-Ca Fe particles might become processed, while in the Ca-Fe-particles, the Ca could protect the Fe for a while. Eventually, when the processing time gets longer, the Fe particles might be processed at the end. Supporting the principal approach of this study, a previous work indicated the presence of unaltered calcite internally mixed with iron-rich nanoparticles [65].
In Figure 6, Fe index class is plotted versus Ca index class, colored according to the aerosol Ca2+ Mg2+ SO42− relative balance. The area of the black circle shows the total Fe mass in the particular index range, the area of the colored circle is the total Ca mass, and the color scale is the Ca2+ Mg2+ SO42− relative balance index. From the figure, we can see that most of the iron particles (the bottom region) carry a little calcium, while some iron particles do not carry calcium at all. Similarly, most of the calcium (mostly in the top region) carries little Fe while some are totally not in contact with much iron. The main message can be therefore summarized as follows: A part of the iron is in particles which do not contain calcium, so acids getting onto these particles can directly react with the iron. On average, 14% of the total deposited Fe mass is accompanied by 10% calcite or more, but more than 70% are in particles with less than 5% calcite, i.e., most of the iron could be, when acids reach the individual particle, directly processed (see also Tables S2 and S3 in the Supplementary Materials). This is different for the present location in comparison to dust in other regions [54].
Some particles contain Fe and processed Ca (as gypsum or similar), so even while here Ca is available, it would not react anymore with acids. Therefore, also in these cases, the acids can react directly with the Fe.
In Figure 6, some of the data during certain period contributions (e.g., 20 July 2017, 29 July 2017, and 3 August 2017) show a different pattern compared to others. It can be observed that these days have a high Ca-index with negligible Fe-index, revealing that a fraction of calcium and iron does not co-exist in the same particle on these particular days. The reason for the difference is not very clear but may be linked to the source region.

3.6. Mixing of Dust with Sulfate (SO42−)

Here, we present the mixing state of dust particles with sulfate particles from deposition measurement of single-particle data and show a comparison to the previous measurements. Mass estimates of sulfate within different aerosol mineral components (silicates, Ca-rich particles, and sea-salt/soluble particles) were used to determine the extent of internal mixing sulfate (SO42−) particles with dust aerosol particles.
A relative mass contribution of SO42− particles (within silicates, sea-salt/soluble particles, and Ca-rich particles) to the total aerosol mass as a function of particle size is shown in Figure 7 (see also Figure S14a–c in the Supplementary Materials). The particle size distribution of the internally mixed sulfate shows two features. First, the mass of sulfate within sea-salt/soluble particles and Ca-rich particles decreases with particle size. This may imply that mainly fine mode sulfates are internally mixed with sea-salt/soluble particles and Ca-rich particles. Second, for the sulfates internally mixed with silicates, there is a slight increase in sulfate mass with particle size, suggesting that coarse mode silicates are associated with higher sulfate content. However, this trend is very weak.
Summarizing these data, it becomes evident that dust particles collected in Tenerife contain a significant amount of sulfates internally mixed with dust particles. Dall’Osto, Harrison, Highwood, O’Dowd, Ceburnis, Querol and Achterberg [18] also suggested that sulfate particles may also be present as a minor proportion of mineral dust aerosol particles, particularly those originating from Africa and Asia, so no conclusion can be drawn on whether a sulfate deposition on the particles occurs during transport (only).

4. Summary and Conclusions

The size distribution, chemical compositions, optical properties, and mixing state of more than 120,000 individual particles sampled at Izaña Global Atmospheric Watch Observatory from 14 July to 24 August 2017 were investigated by applying the SEM-EDX technique.
During this campaign, it was found that mineral dust particles were of the dominating particle type mainly composed of various classes of silicates, Si-rich (quartz-like), Ca-rich (calcite-like), CaMg-rich (dolomite-like), and CaS-rich (gypsum-like), in agreement with the previous studies in the region. The results also reveal that the chemical composition of deposited and suspended mineral dust particles is similar.
Size-resolved refractive indices are modeled from the chemical composition of dust particles. Although there is a significant variation in the real part, the imaginary parts exhibit very low variation as a function of particle size. Both parts decrease with increasing wavelength. The values for the imaginary (k) part range from 3.28 × 10 4 to 2.82 × 10 4 at 370 nm, 2.37 × 10 4 to 2.00 × 10 4 at 470 nm, 1.81 × 10 4 to 1.54 × 10 4 at 520 nm, 1.23 × 10 4 to 1.06 × 10 4 at 590 nm, 1.12 × 10 4 to 9.50 × 10 4 at 660 nm, 8.52 × 10 5 to 7.19 × 10 5 at 880 nm, and 8.38 × 10 5 to 7.11 × 10 5 at 950 nm. Similarly, the values for the real part (m) range from 1.71 to 1.59 at 250 nm, 1.77 to 1.56 at 630 nm, 1.72 to 1.54 nm at 870 nm, and 1.68 to 1.53 at 1640 nm. To conclude, in both cases, the values are wavelength-dependent, showing a decrease with increasing wavelength. Moreover, there is a slight decrease in the refractive index values with increasing particle size. We believe that a slight decrease in the k value of iron oxide particles with particle size is mostly related to differences in the dust’s iron content, i.e., iron content shows a decrease with an increase in particle size. Additionally, results show that the refractive index values do not exhibit a large variation from sample to sample. In summary, the average refractive index values calculated from our single-particle measurement are in good agreement with the previous measurements.
In the study, we also showed a potential influence of the mixing on buffering of carbonate dust aerosol particles on the acid mobilization of iron particles. The analysis revealed that the buffering potential depends on atmospheric conditions. For particles which contain both iron and (unprocessed) calcium, acids that can dissolve insoluble iron particles can react with the Ca particles before reacting with Fe, but eventually, when the processing time gets longer, the Fe might be processed at the end. Compared to other locations, we find a relatively low internal mixing between iron and calcium compounds in the present study. By analyzing the ratio of sulfate mass to the total mass of dust of individual particles as a function of particle size, the mixing state of sulfate particles to the total dust particles was investigated. The analysis revealed that the finer dust particles were associated with a higher content of sulfate particles while the coarse dust particles corresponded to lower sulfate contents, revealing that only fine mode sulfate is internally mixed with mineral dust aerosol particles. This is particularly true for sulfates of internally mixed sea-salt/soluble and Ca-rich particles.

Supplementary Materials

The following supporting information can be downloaded at: https://www.mdpi.com/article/10.3390/atmos14040700/s1, Figure S1A: Chemical composition (relative number abundance of different particle groups) of major dust particles per unit of measurement. The total number of particles (n) analyzed on each measurement day is also shown; Figure S1B: Chemical composition (relative number abundance of different particle groups) of dust samples per unit of measurement. The total number of particles (n) analyzed on each measurement day is also shown; Figure S2: Atmospheric mass size distribution densities derived FWI measurements (Barbados 2013). Error bars represent 95% confidence intervals. Different curves represent different measurement; Figure S3: Average complex refractive index (real part) for different sampling days deduced from individual particle analysis (at wave length = 350 nm); Figure S4: Average complex refractive index (real part) for different sampling days deduced from individual particle analysis (at wave length = 630 nm); Figure S5: Average complex refractive index (real part) for different sampling days deduced from; Figure S6: Average complex refractive index (real part) for different sampling days deduced from individual particle analysis (at wave length = 1640 nm); Figure S7: Average complex refractive index (imaginary part) of iron oxide particles for different sampling days deduced from individual particle analysis (at wave length = 370 nm); Figure S8: Average complex refractive index (imaginary part) of iron oxide particles for different sampling days deduced from individual particle analysis (at wave length = 470 nm); Figure S9: Average complex refractive index (imaginary part) of iron oxide particles for different sampling days deduced from individual particle analysis (at wave length = 520 nm); Figure S10: Average complex refractive index (imaginary part) of iron oxide particles for different sampling days deduced from individual particle analysis (at wave length = 590 nm); Figure S11: Average complex refractive index (imaginary part) of iron oxide particles for different sampling days deduced from individual particle analysis (at wave length = 660 nm); Figure S12: Average complex refractive index (imaginary part) of iron oxide particles for different sampling days deduced from individual particle analysis (at wave length = 880 nm); Figure S13: Average complex refractive index (imaginary part) of iron oxide particles for different sampling days deduced from individual particle analysis (at wave length = 950 nm); Figure S14: Relative mass contribution of sulfate particles to the major components (a: Sulfate in Ca-rich; b: Sulfate in sea-salt/ soluble particles; c: Sulfate in Silicates) of dust aerosol particles in different sampling days deduced from individual particle analysis; Figure S15: Photos of different kinds of passive (surrogate) samplers used in the field campaign (Note: The data for the last sampler (Sigma-2) has not been included in this work); Figure S16: Photo of the free wing Impactor (FWI) used in the field campaign; Table S1: Defintion of particle class; Table S2: Total Fe mass deposition rate in mg/(m²xd). Ca > xx: relative fraction of Fe mass in with an R (Ca) > xx. An R (Ca) of 0.05 can be considered as roughly 10 % mass CaCO3 in a particle (note that the scale is non-linear for higher R (Ca));Table S3: grid representation of columns of the csv files.

Author Contributions

A.W. conducted the field measurements and performed the data evaluation. K.S. helped with the field measurements, carried out the SEM analyses, and performed data processing. J.H. helped with data processing. K.K. designed the experiment, designed and prepared the sampling equipment, and performed data processing and interpretation. All authors contributed to the data discussion and manuscript preparation. All authors have read and agreed to the published version of the manuscript.

Funding

This project was funded by the Deutsche Forschungsgemeinschaft (DFG, German Research Foundation)—264907654; 264912134; 416816480 (KA 2280). The APC was funded by the Open Access Publishing Fund of the Technical University of Darmstadt.

Institutional Review Board Statement

This study did not require ethical approval.

Informed Consent Statement

Not applicable.

Data Availability Statement

The data sets used for this publication are available from the Pangaea repository free of charge (https://doi.org/10.1594/PANGAEA.901413; accessed on 10 February 2023).

Acknowledgments

We thank our colleagues Thomas Dirsch and Conrad Ballschmiede. We are grateful to all staff members of Izaña Global Atmospheric Watch Observatory for helping us with maintenance of the sampling equipment.

Conflicts of Interest

The authors declare that there is no conflict of interest regarding the publication of this paper.

References

  1. Arimoto, R. Eolian Dust and Climate: Relationships to Sources, Tropospheric Chemistry, Transport and Deposition. Earth Sci. Rev. 2001, 54, 29–42. [Google Scholar] [CrossRef]
  2. Jickells, T.D.; An, Z.S.; Andersen, K.K.; Baker, A.R.; Bergametti, G.; Brooks, N.; Cao, J.J.; Boyd, P.W.; Duce, R.A.; Hunter, K.A. Global Iron Connections between Desert Dust, Ocean Biogeochemistry, and Climate. Science 2005, 308, 67–71. [Google Scholar] [CrossRef] [PubMed] [Green Version]
  3. Haywood, J.; Boucher, O. Estimates of the direct and indirect radiative forcing due to tropospheric aerosols: A review. Rev. Geophys. 2000, 38, 513–543. [Google Scholar] [CrossRef]
  4. Sokolik, I.; Winker, D.; Bergametti, G.; Gillette, D.; Carmichael, G.; Kaufman, Y.; Gomes, L.; Schuetz, L.; Penner, J. Introduction to special section: Outstanding problems in quantifying the radiative impacts of mineral dust. J. Geophys. Res. Atmos. 2001, 106, 18015–18027. [Google Scholar] [CrossRef]
  5. Penner, J.E.; Andreae, M.; Annegarn, H.; Barrie, L.; Feichter, J.; Hegg, D.; Jayaraman, A.; Leaitch, R.; Murphy, D.; Nganga, J. Aerosols, their direct and indirect effects. In Climate Change 2001: The Scientific Basis. Contribution of Working Group I to the Third Assessment Report of the Intergovernmental Panel on Climate Change; Cambridge University Press: Cambridge, UK, 2001; pp. 289–348. [Google Scholar]
  6. Stockdale, A.; Krom, M.D.; Mortimer, R.J.; Benning, L.G.; Carslaw, K.S.; Herbert, R.J.; Shi, Z.; Myriokefalitakis, S.; Kanakidou, M.; Nenes, A. Understanding the nature of atmospheric acid processing of mineral dusts in supplying bioavailable phosphorus to the oceans. Proc. Natl. Acad. Sci. USA 2016, 113, 14639–14644. [Google Scholar] [CrossRef] [Green Version]
  7. Boyd, P.; Jickells, T.; Law, C.; Blain, S.; Boyle, E.; Buesseler, K.; Coale, K.; Cullen, J.; De Baar, H.J.; Follows, M. A synthesis of mesoscale iron-enrichment experiments 1993–2005: Key findings and implications for ocean biogeochemistry. Science 2007, 315, 612–617. [Google Scholar] [CrossRef] [Green Version]
  8. Jeong, G.; Achterberg, E.P. Chemistry and mineralogy of clay minerals in Asian and Saharan dusts and the implications for iron supply to the oceans. Atmos. Chem. Phys. 2014, 14, 12415–12428. [Google Scholar] [CrossRef] [Green Version]
  9. Mahowald, N.M.; Baker, A.R.; Bergametti, G.; Brooks, N.; Duce, R.A.; Jickells, T.D.; Kubilay, N.; Prospero, J.M.; Tegen, I. Atmospheric global dust cycle and iron inputs to the ocean. Glob. Biogeochem. Cycles 2005, 19. [Google Scholar] [CrossRef]
  10. Ito, A.; Feng, Y. Role of dust alkalinity in acid mobilization of iron. Atmos. Chem. Phys. 2010, 10, 9237–9250. [Google Scholar] [CrossRef] [Green Version]
  11. Nenes, A.; Krom, M.D.; Mihalopoulos, N.; Cappellen, P.V.; Shi, Z.; Bougiatioti, A.; Zarmpas, P.; Herut, B. Atmospheric acidification of mineral aerosols: A source of bioavailable phosphorus for the oceans. Atmos. Chem. Phys. 2011, 11, 6265–6272. [Google Scholar] [CrossRef] [Green Version]
  12. Pósfai, M.; Axisa, D.; Tompa, É.; Freney, E.; Bruintjes, R.; Buseck, P.R. Interactions of mineral dust with pollution and clouds: An individual-particle TEM study of atmospheric aerosol from Saudi Arabia. Atmos. Res. 2013, 122, 347–361. [Google Scholar] [CrossRef]
  13. Ingall, E.; Feng, Y.; Longo, A.; Lai, B.; Shelley, R.; Landing, W.; Morton, P.; Nenes, A.; Mihalopoulos, N.; Violaki, K. Enhanced Iron Solubility at Low pH in Global Aerosols. Atmosphere 2018, 9, 201. [Google Scholar] [CrossRef] [Green Version]
  14. Meskhidze, N.; Chameides, W.L.; Nenes, A.; Chen, G. Iron Mobilization in Mineral Dust: Can Anthropogenic SO2 Emissions Affect Ocean Productivity? Geophys. Res. Lett. 2003, 30. [Google Scholar] [CrossRef] [Green Version]
  15. Gao, Y.; Anderson, J.R. Characteristics of Chinese aerosols determined by individual-particle analysis. J. Geophys. Res. Atmos. 2001, 106, 18037–18045. [Google Scholar] [CrossRef]
  16. Bauer, S.E.; Mishchenko, M.I.; Lacis, A.A.; Zhang, S.; Perlwitz, J.; Metzger, S.M. Do Sulfate and Nitrate Coatings on Mineral Dust Have Important Effects on Radiative Properties and Climate Modeling? J. Geophys. Res. Atmos. 2007, 112. [Google Scholar] [CrossRef] [Green Version]
  17. Falkovich, A.H.; Ganor, E.; Levin, Z.; Formenti, P.; Rudich, Y. Chemical and mineralogical analysis of individual mineral dust particles. Geophys. Res. Atmos. 2001, 106, 18029–18036. [Google Scholar] [CrossRef] [Green Version]
  18. Dall’Osto, M.; Harrison, R.M.; Highwood, E.J.; O’Dowd, C.; Ceburnis, D.; Querol, X.; Achterberg, E.P. Variation of the mixing state of Saharan dust particles with atmospheric transport. Atmos. Environ. 2010, 44, 3135–3146. [Google Scholar] [CrossRef]
  19. Kandler, K.; Lieke, K.; Benker, N.; Emmel, C.; Küpper, M.; Müller-Ebert, D.; Ebert, M.; Scheuvens, D.; Schladitz, A.; Schütz, L. Electron microscopy of particles collected at Praia, Cape Verde, during the Saharan Mineral Dust Experiment: Particle chemistry, shape, mixing state and complex refractive index. Tellus B Chem. Phys. Meteorol. 2011, 63, 475–496. [Google Scholar] [CrossRef]
  20. Schütz, L.; Sebert, M. Mineral aerosols and source identification. J. Aerosol Sci. 1987, 18, 1–10. [Google Scholar] [CrossRef]
  21. Stuut, J.B.; Zabel, M.; Ratmeyer, V.; Helmke, P.; Schefuß, E.; Lavik, G.; Schneider, R. Provenance of present-day eolian dust collected off NW Africa. J. Geophys. Res. Atmos. 2005, 110. [Google Scholar] [CrossRef] [Green Version]
  22. Chou, C.; Formenti, P.; Maille, M.; Ausset, P.; Helas, G.; Harrison, M.; Osborne, S. Size distribution, shape, and composition of mineral dust aerosols collected during the African Monsoon Multidisciplinary Analysis Special Observation Period 0: Dust and Biomass-Burning Experiment field campaign in Niger, January 2006. J. Geophys. Res. Atmos. 2008, 113. [Google Scholar] [CrossRef]
  23. Kandler, K.; Benker, N.; Bundke, U.; Cuevas, E.; Ebert, M.; Knippertz, P.; Rodríguez, S.; Schütz, L.; Weinbruch, S. Chemical composition and complex refractive index of Saharan Mineral Dust at Izana, Tenerife (Spain) derived by electron microscopy. Atmos. Environ. 2007, 41, 8058–8074. [Google Scholar] [CrossRef]
  24. Eriksen Hammer, S.; Ebert, M.; Weinbruch, S. Comparison of operator-and computer-controlled scanning electron microscopy of particles from different atmospheric aerosol types. Anal. Bioanal. Chem. 2019, 411, 1633–1645. [Google Scholar] [CrossRef] [PubMed]
  25. Goudie, A.; Middleton, N. Saharan dust storms: Nature and consequences. Earth Sci. Rev. 2001, 56, 179–204. [Google Scholar] [CrossRef]
  26. Cordoba-Jabonero, C.; Andrey-Andres, J.; Gomez, L.; Adame, J.A.; Sorribas, M.; Navarro-Comas, M.; Puentedura, O.; Cuevas, E.; Gil-Ojeda, M. Vertical mass impact and features of Saharan dust intrusions derived from ground-based remote sensing in synergy with airborne in-situ measurements. Atmos. Environ. 2016, 142, 420–429. [Google Scholar] [CrossRef]
  27. Bergamaschi, P.; Bräunlich, M.; Marik, T.; Brenninkmeijer, C.A. Measurements of the carbon and hydrogen isotopes of atmospheric methane at Izaña, Tenerife: Seasonal cycles and synoptic-scale variations. J. Geophys. Res. Atmos. 2000, 105, 14531–14546. [Google Scholar] [CrossRef]
  28. Rodríguez, S.; Cuevas, E.; Prospero, J.; Alastuey, A.; Querol, X.; López-Solano, J.; García, M.; Alonso-Pérez, S.J.A.C. Modulation of Saharan dust export by the North African dipole. Atmos. Chem. Phys. 2015, 15, 7471–7486. [Google Scholar] [CrossRef] [Green Version]
  29. Waza, A.; Schneiders, K.; Kandler, K. Daily dust deposition fluxes at Izana, Tenerife collected by different techniques: Particle size and composition from single particle electron microscopy, PANGAEA. Pangaea 2019, 12, 6647–6665. [Google Scholar] [CrossRef]
  30. García, R.; García, O.; Cuevas, E.; Cachorro, V.; Barreto, A.; Guirado-Fuentes, C.; Kouremeti, N.; Bustos, J.; Romero-Campos, P.; de Frutos, A. Aerosol optical depth retrievals at the Izaña Atmospheric Observatory from 1941 to 2013 by using artificial neural networks. Atmos. Meas. Tech. 2016, 9, 53–62. [Google Scholar] [CrossRef] [Green Version]
  31. Wilson, S.J.; Cook, R.U. Wind erosion. In Soil Erosion; Morgan, P.R.C., Kirkby, M.J., Eds.; John Wiley & Sons: Chichester, UK, 1980; pp. 217–251. [Google Scholar]
  32. Ott, D.K.; Peters, T.M. A shelter to protect a passive sampler for coarse particulate matter, PM10−2.5. Aerosol Sci. Technol. 2008, 42, 299–309. [Google Scholar] [CrossRef] [Green Version]
  33. Kandler, K.; Schneiders, K.; Ebert, M.; Hartmann, M.; Weinbruch, S.; Prass, M.; Pöhlker, C. Composition and mixing state of atmospheric aerosols determined by electron microscopy: Method development and application to aged Saharan dust deposition in the Caribbean boundary layer. Atmos. Chem. Phys. 2018, 18, 13429–13455. [Google Scholar] [CrossRef] [Green Version]
  34. Waza, A.; Schneiders, K.; May, J.; Rodríguez, S.; Epple, B.; Kandler, K. Field comparison of dry deposition samplers for collection of atmospheric mineral dust: Results from single-particle characterization. Atmos. Meas. Tech. Discuss. 2019, 2019, 6647–6665. [Google Scholar] [CrossRef] [Green Version]
  35. Ott, D.K.; Kumar, N.; Peters, T.M. Passive sampling to capture spatial variability in PM10–2.5. Atmos. Environ. 2008, 42, 746–756. [Google Scholar] [CrossRef]
  36. Wagner, J.; Leith, D. Passive aerosol sampler. Part I: Principle of operation. Aerosol Sci. Technol. 2001, 34, 186–192. [Google Scholar] [CrossRef]
  37. Wagner, J.; Leith, D. Passive aerosol sampler. Part II: Wind tunnel experiments. Aerosol Sci. Technol. 2001, 34, 193–201. [Google Scholar] [CrossRef]
  38. Jaenicke, R.; Junge, C. Studien zur oberen Grenzgröße des natürlichen Aerosols. Contrib. Atmos. Phys. 1967, 40, 129–143. [Google Scholar]
  39. Kandler, K.; Schütz, L.; Deutscher, C.; Ebert, M.; Hofmann, H.; Jäckel, S.; Jaenicke, R.; Knippertz, P.; Lieke, K.; Massling, A. Size distribution, mass concentration, chemical and mineralogical composition and derived optical parameters of the boundary layer aerosol at Tinfou, Morocco, during SAMUM 2006. Tellus B Chem. Phys. Meteorol. 2009, 61, 32–50. [Google Scholar] [CrossRef] [Green Version]
  40. Ott, D.K.; Cyrs, W.; Peters, T.M. Passive measurement of coarse particulate matter, PM10–2.5. J. Aerosol Sci. 2008, 39, 156–167. [Google Scholar] [CrossRef]
  41. Davies, C. Particle-fluid interaction. J. Aerosol Sci. 1979, 10, 477–513. [Google Scholar] [CrossRef]
  42. Schulz, M.; Prospero, J.M.; Baker, A.R.; Dentener, F.; Ickes, L.; Liss, P.S.; Mahowald, N.M.; Nickovic, S.; Garcia-Pando, C.P.; Rodríguez, S. Atmospheric transport and deposition of mineral dust to the ocean: Implications for research needs. Environ. Sci. Technol. 2012, 46, 10390–10404. [Google Scholar] [CrossRef]
  43. Li, J.; Shao, L.; Chang, L.; Xing, J.; Wang, W.; Li, W.; Zhang, D. Physicochemical Characteristics and Possible Sources of Individual Mineral Particles in a Dust Storm Episode in Beijing, China. Atmosphere 2018, 9, 269. [Google Scholar] [CrossRef] [Green Version]
  44. Zhang, X.; Wu, G.; Zhang, C.; Xu, T.; Zhou, Q. What is the real role of iron oxides in the optical properties of dust aerosols? Atmos. Chem. Phys. 2015, 15, 12159–12177. [Google Scholar] [CrossRef] [Green Version]
  45. Skiles, S.M.; Painter, T.; Okin, G.S. A method to retrieve the spectral complex refractive index and single scattering optical properties of dust deposited in mountain snow. J. Glaciol. 2017, 63, 133–147. [Google Scholar] [CrossRef] [Green Version]
  46. Di Biagio, C.; Formenti, P.; Balkanski, Y.; Caponi, L.; Cazaunau, M.; Pangui, E.; Journet, E.; Nowak, S.; Andreae, M.O.; Kandler, K.; et al. Complex refractive indices and single scattering albedo of global dust aerosols in the shortwave spectrum and relationship to iron content and size. Atmos. Chem. Phys. Discuss. 2019, 19, 15503–15531. [Google Scholar] [CrossRef] [Green Version]
  47. Ebert, M.; Weinbruch, S.; Rausch, A.; Gorzawski, G.; Helas, G.; Hoffmann, P.; Wex, H. Complex refractive index of aerosols during LACE 98# x2010; as derived from the analysis of individual particles. J. Geophys. Res. 2002, 107. [Google Scholar] [CrossRef]
  48. Chýlek, P.; Srivastava, V.; Pinnick, R.G.; Wang, R. Scattering of electromagnetic waves by composite spherical particles: Experiment and effective medium approximations. Appl. Opt. 1988, 27, 2396–2404. [Google Scholar] [CrossRef]
  49. Nousiainen, T. Optical modeling of mineral dust particles: A review. J. Quant. Spectrosc. Ra. 2009, 110, 1261–1279. [Google Scholar] [CrossRef]
  50. Lindqvist, H.; Jokinen, O.; Kandler, K.; Scheuvens, D.; Nousiainen, T. Single scattering by realistic, inhomogeneous mineral dust particles with stereogrammetric shapes. Atmos. Chem. Phys. 2014, 14, 143–157. [Google Scholar] [CrossRef] [Green Version]
  51. Müller, T.; Schladitz, A.; Massling, A.; Kaaden, N.; Kandler, K.; Wiedensohler, A. Spectral absorption coefficients and imaginary parts of refractive indices of Saharan dust during SAMUM-1. Tellus B Chem. Phys. Meteorol. 2009, 61, 79–95. [Google Scholar] [CrossRef]
  52. Petzold, A.; Rasp, K.; Weinzierl, B.; Esselborn, M.; Hamburger, T.; Dörnbrack, A.; Kandler, K.; Schuütz, L.; Knippertz, P.; Fiebig, M. Saharan dust absorption and refractive index from aircraft-based observations during SAMUM 2006. Tellus B Chem. Phys. Meteorol. 2009, 61, 118–130. [Google Scholar] [CrossRef] [Green Version]
  53. Maring, H.; Savoie, D.; Izaguirre, M.; Custals, L.; Reid, J. Mineral dust aerosol size distribution change during atmospheric transport. J. Geophys. Res. Atmos. 2003, 108. [Google Scholar] [CrossRef]
  54. Kandler, K.; Schneiders, K.; Heuser, J.; Waza, A.; Aryasree, S.; Althausen, D.; Hofer, J.; Abdullaev, S.F.; Makhmudov, A.N. Differences and similarities of central Asian, African, and arctic dust composition from a single particle perspective. Atmosphere 2020, 11, 269. [Google Scholar] [CrossRef] [Green Version]
  55. Sokolik, I.N.; Toon, O.B. Incorporation of mineralogical composition into models of the radiative properties of mineral aerosol from UV to IR wavelengths. J. Geophys. Res. Atmos. 1999, 104, 9423–9444. [Google Scholar] [CrossRef]
  56. Textor, C.; Schulz, M.; Guibert, S.; Kinne, S.; Balkanski, Y.; Bauer, S.; Berntsen, T.; Berglen, T.; Boucher, O.; Chin, M. Analysis and quantification of the diversities of aerosol life cycles within AeroCom. Atmos. Chem. Phys. 2006, 6, 1777–1813. [Google Scholar] [CrossRef] [Green Version]
  57. Weinzierl, B.; Petzold, A.; Esselborn, M.; Wirth, M.; Rasp, K.; Kandler, K.; Schuetz, L.; Koepke, P.; Fiebig, M. Airborne measurements of dust layer properties, particle size distribution and mixing state of Saharan dust during SAMUM 2006. Tellus B Chem. Phys. Meteorol. 2009, 61, 96–117. [Google Scholar] [CrossRef] [Green Version]
  58. Ryder, C.L.; Highwood, E.J.; Rosenberg, P.D.; Trembath, J.; Brooke, J.K.; Bart, M.; Dean, A.; Crosier, J.; Dorsey, J.; Brindley, H. Optical properties of Saharan dust aerosol and contribution from the coarse mode as measured during the Fennec 2011 aircraft campaign. Atmos. Chem. Phys. 2013, 13, 303–325. [Google Scholar] [CrossRef] [Green Version]
  59. Weinzierl, B.; Sauer, D.; Esselborn, M.; Petzold, A.; Veira, A.; Rose, M.; Mund, S.; Wirth, M.; Ansmann, A.; Tesche, M. Microphysical and optical properties of dust and tropical biomass burning aerosol layers in the Cape Verde region—An overview of the airborne in situ and lidar measurements during SAMUM-2. Tellus B Chem. Phys. Meteorol. 2011, 63, 589–618. [Google Scholar] [CrossRef] [Green Version]
  60. Kandler, K.; Schütz, L.; Jäckel, S.; Lieke, K.; Emmel, C.; Müller-Ebert, D.; Ebert, M.; Scheuvens, D.; Schladitz, A.; Šegvić, B. Ground-based off-line aerosol measurements at Praia, Cape Verde, during the Saharan Mineral Dust Experiment: Microphysical properties and mineralogy. Tellus B Chem. Phys. Meteorol. 2011, 63, 459–474. [Google Scholar] [CrossRef] [Green Version]
  61. Weinzierl, B.; Ansmann, A.; Prospero, J.M.; Althausen, D.; Benker, N.; Chouza, F.; Dollner, M.; Farrell, D.; Fomba, W.; Freudenthaler, V. The Saharan aerosol long-range transport and aerosol–cloud-interaction experiment: Overview and selected highlights. Bull. Am. Meteorol. Soc. 2017, 98, 1427–1451. [Google Scholar] [CrossRef] [Green Version]
  62. Gasteiger, J.; Groß, S.; Sauer, D.; Haarig, M.; Ansmann, A.; Weinzierl, B. Particle settling and vertical mixing in the Saharan Air Layer as seen from an integrated model, lidar, and in situ perspective. Atmos. Chem. Phys. 2017, 17, 297–311. [Google Scholar] [CrossRef] [Green Version]
  63. Sokolik, I.N. The spectral radiative signature of wind-blown mineral dust: Implications for remote sensing in the thermal IR region. Geophys. Res. Lett. 2002, 29, 7-1–7-4. [Google Scholar] [CrossRef] [Green Version]
  64. Li, L.; Mahowald, N.M.; Miller, R.L.; Pérez García-Pando, C.; Klose, M.; Hamilton, D.S.; Gonçalves Ageitos, M.; Ginoux, P.; Balkanski, Y.; Green, R.O. Quantifying the range of the dust direct radiative effect due to source mineralogy uncertainty. Atmos. Chem. Phys. 2021, 21, 3973–4005. [Google Scholar] [CrossRef]
  65. Rodriguez-Navarro, C.; di Lorenzo, F.; Elert, K. Mineralogy and physicochemical features of Saharan dust wet deposited in the Iberian Peninsula during an extreme<? xmltex\break?> red rain event. Atmos. Chem. Phys. 2018, 18, 10089–10122. [Google Scholar]
Figure 1. Size resolved chemical composition (relative number abundance of different particle groups) of dust samples (dust day n = 3156, n = 2439, n = 1372; Non-dust day (n = 175, n = 384, n = 602) at various sampling days.
Atmosphere 14 00700 g001
Figure 2. Size resolved mass flux density of total dust and other major mineral dust components. A comparison of the composition between deposited (Flat-plate) and suspended dust particles (MWAC).
Atmosphere 14 00700 g002
Figure 3. Comparison of atmospheric mass concentration as a function of particle size derived from FWI measurements (Tenerife vs. Barbados). On each blue box, the central mark is the median; the edges of the box are the 10th and 90th percentiles. The vertical lines show the standard deviation.
Atmosphere 14 00700 g003
Figure 4. A Comparison of size distribution of dust concentration among different regions (Tenerife (current study), Barbados, Morocco, Cape Verde). A compilation of the average size distribution in the Morocco and Cape Verde (for meteorological periods during SAMUM-2 at Cape Verde (CV-2008), during SAMUM-1 in Morocco (MO-2006), from former campaigns at Cape Verde (CV-1973) and onboard the research vessel Meteor in the Cape Verde region in 1969) taken from Kandler, Schütz, Jäckel, Lieke, Emmel, Müller-Ebert, Ebert, Scheuvens, Schladitz and Šegvić [60].
Atmosphere 14 00700 g004
Figure 5. Size-resolved average complex refractive index (real part (left panel)) and imaginary part (right panel) at different wavelengths as a function of particle size (Flat plate-campaign average). Derived from single particle analysis. Error bars show the central 95% confidence interval.
Atmosphere 14 00700 g005
Figure 6. Mixing state of iron (black circles) and calcium (colored circles) as functions of Ca and Fe indices (colored according to the aerosol Ca2+ Mg2+ SO42− relative balance). The circle area is proportional to the total iron or calcium mass found in each class, normalized to the highest mass for each sampling location. The blue-red transition shows the average relative ion balance of Ca2+ + Mg2+ versus SO42–, indicating atmospheric processing.
Atmosphere 14 00700 g006
Figure 7. Relative mass contribution of sulfate particles to dust aerosol particles (campaign average) (sulfate particles internally mixed with dust particles) as a function of particle size. Error bars show the standard deviation.
Atmosphere 14 00700 g007
Table 1. Refractive indices (real part) of the different particle group (from [39]).
Particle GroupWavelength
350 nm630 nm870 nm1640 nm
Silicates1.601.561.541.54
Si-rich (Quartz)1.571.551.531.53
Ca-rich
(Calcite)
1.691.661.651.63
S-rich (Sulfate)1.541.531.521.49
Fe-rich
(Hematite)
2.302.82.62.4
Disclaimer/Publisher’s Note: The statements, opinions and data contained in all publications are solely those of the individual author(s) and contributor(s) and not of MDPI and/or the editor(s). MDPI and/or the editor(s) disclaim responsibility for any injury to people or property resulting from any ideas, methods, instructions or products referred to in the content.

