
Variation Characteristics of Temperature and Rainfall and Their Relationship with Geographical Factors in the Qinling Mountains

Abstract
:1. Introduction
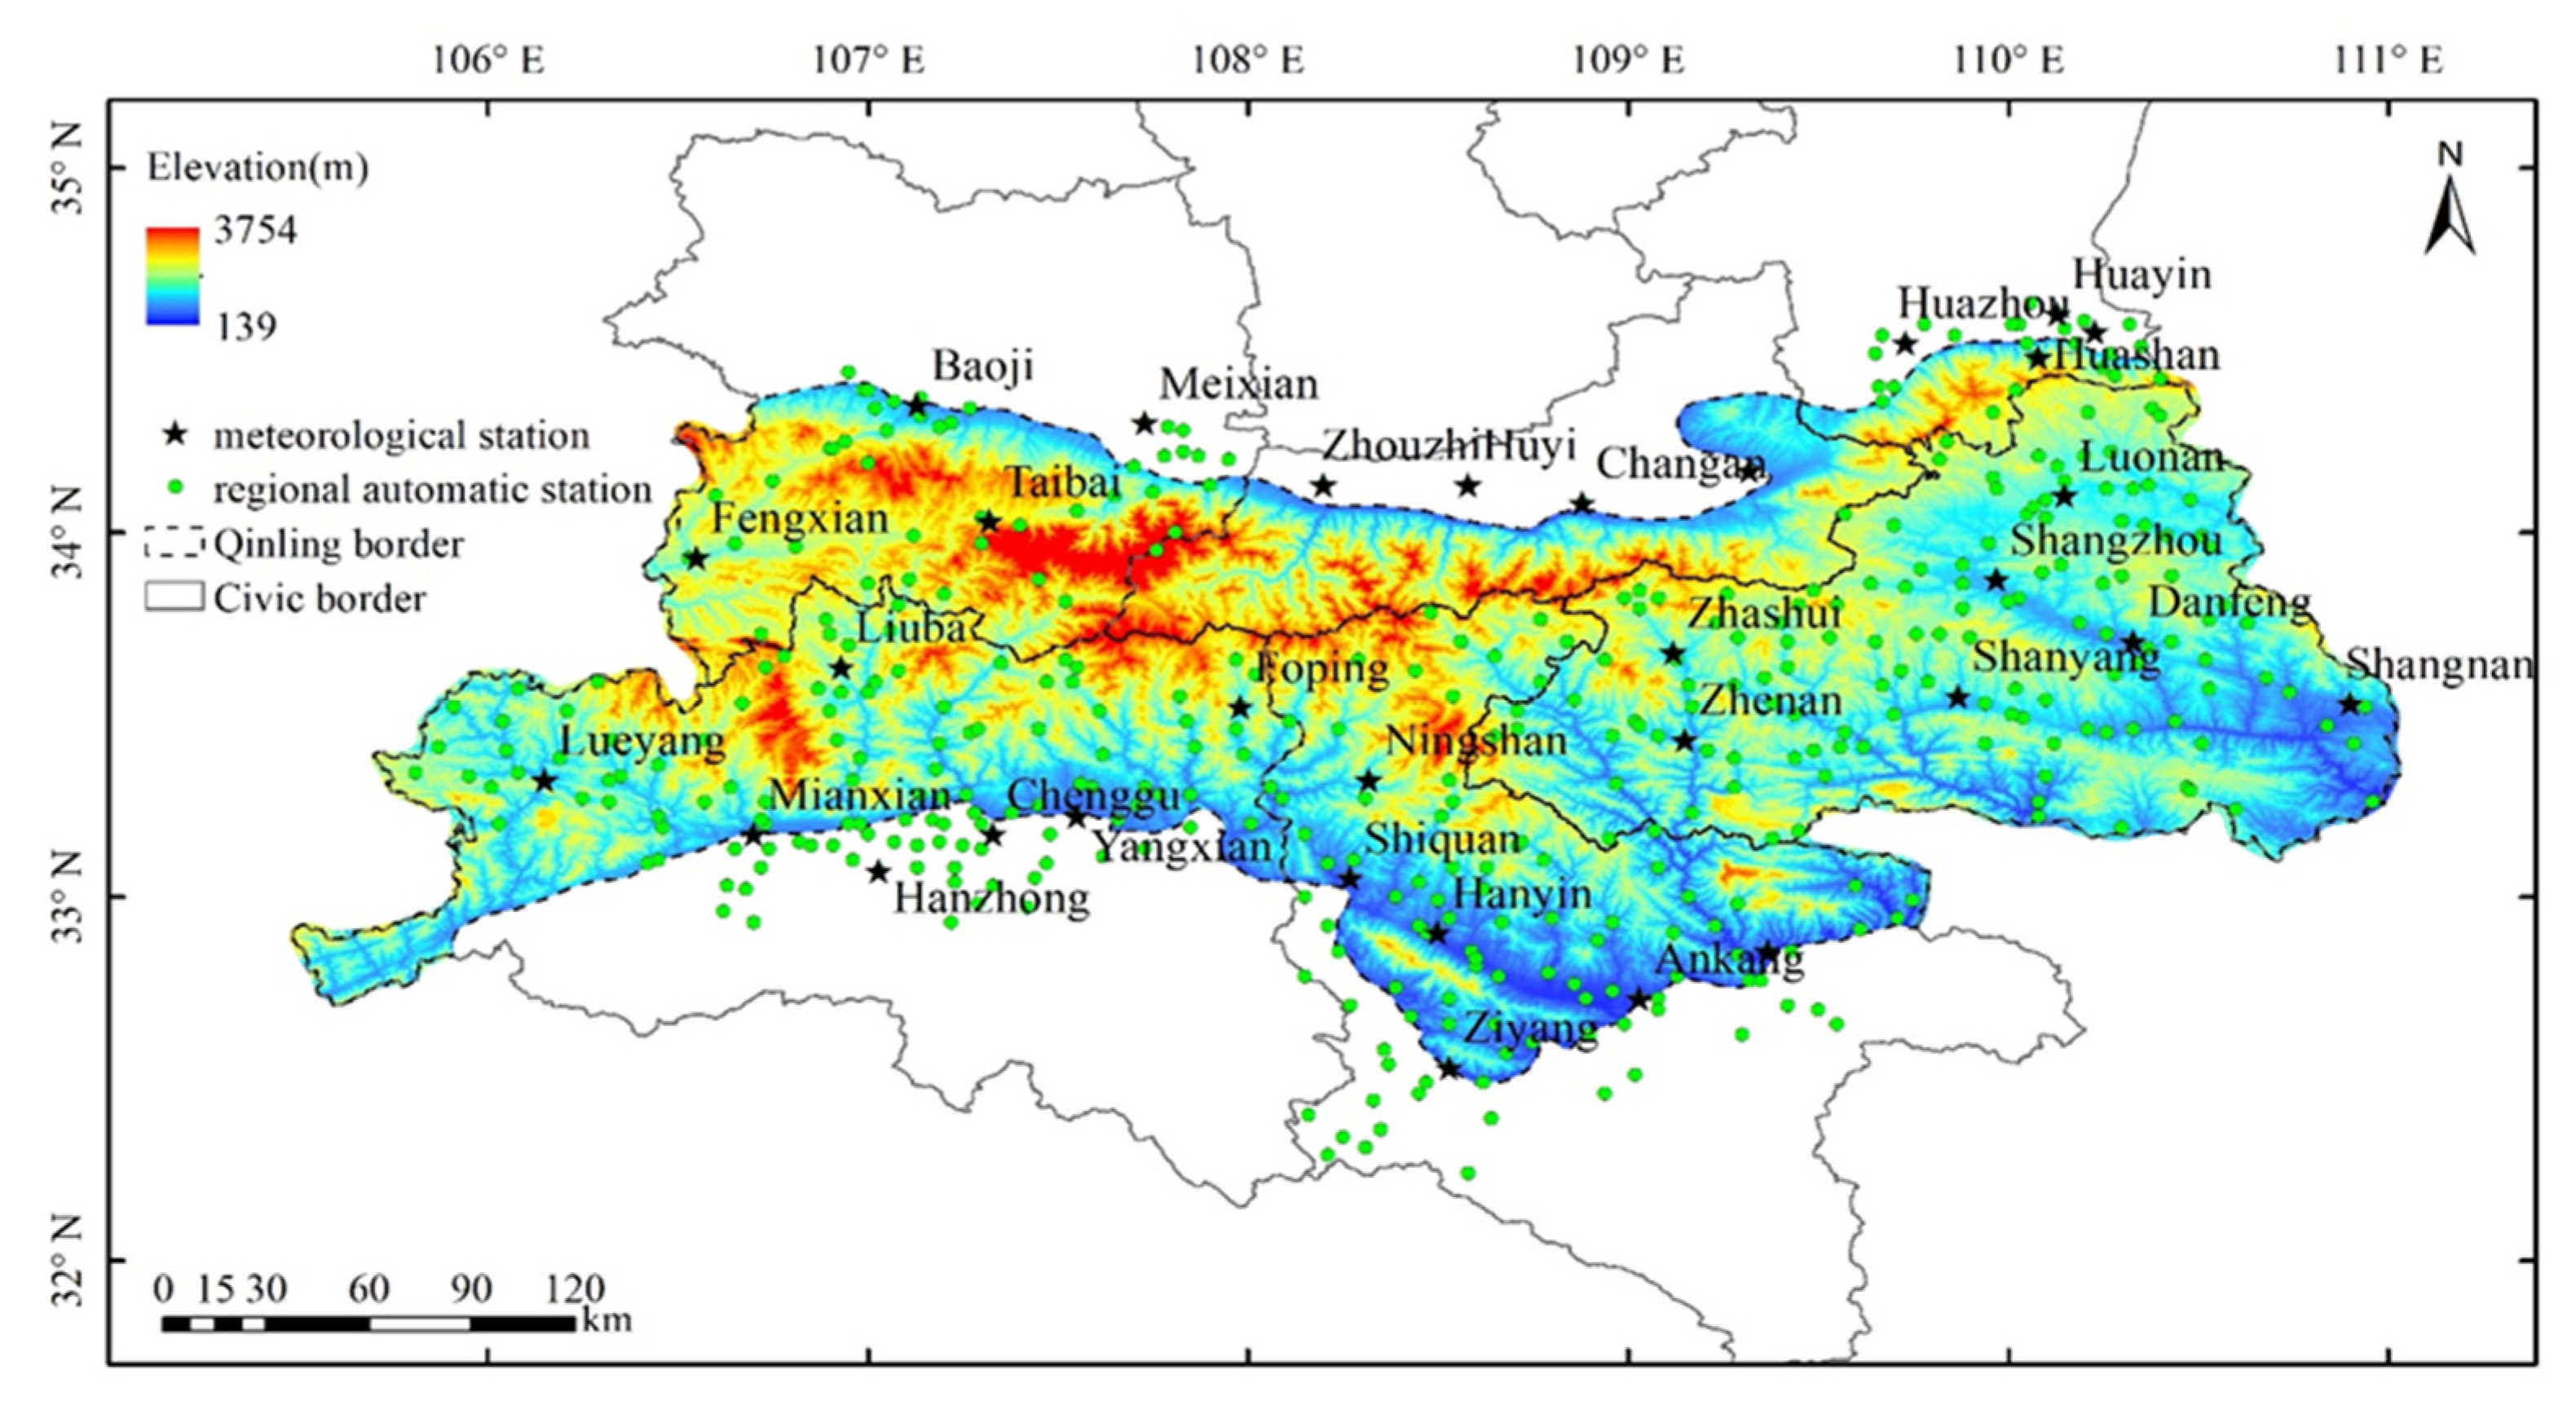
2. Data and Methods
2.1. Data
2.2. Methods
2.2.1. Climate Trend Analysis
2.2.2. Mann–Kendall (M-K) Test
2.2.3. Running t-Test
2.2.4. Kriging Interpolation
3. Results
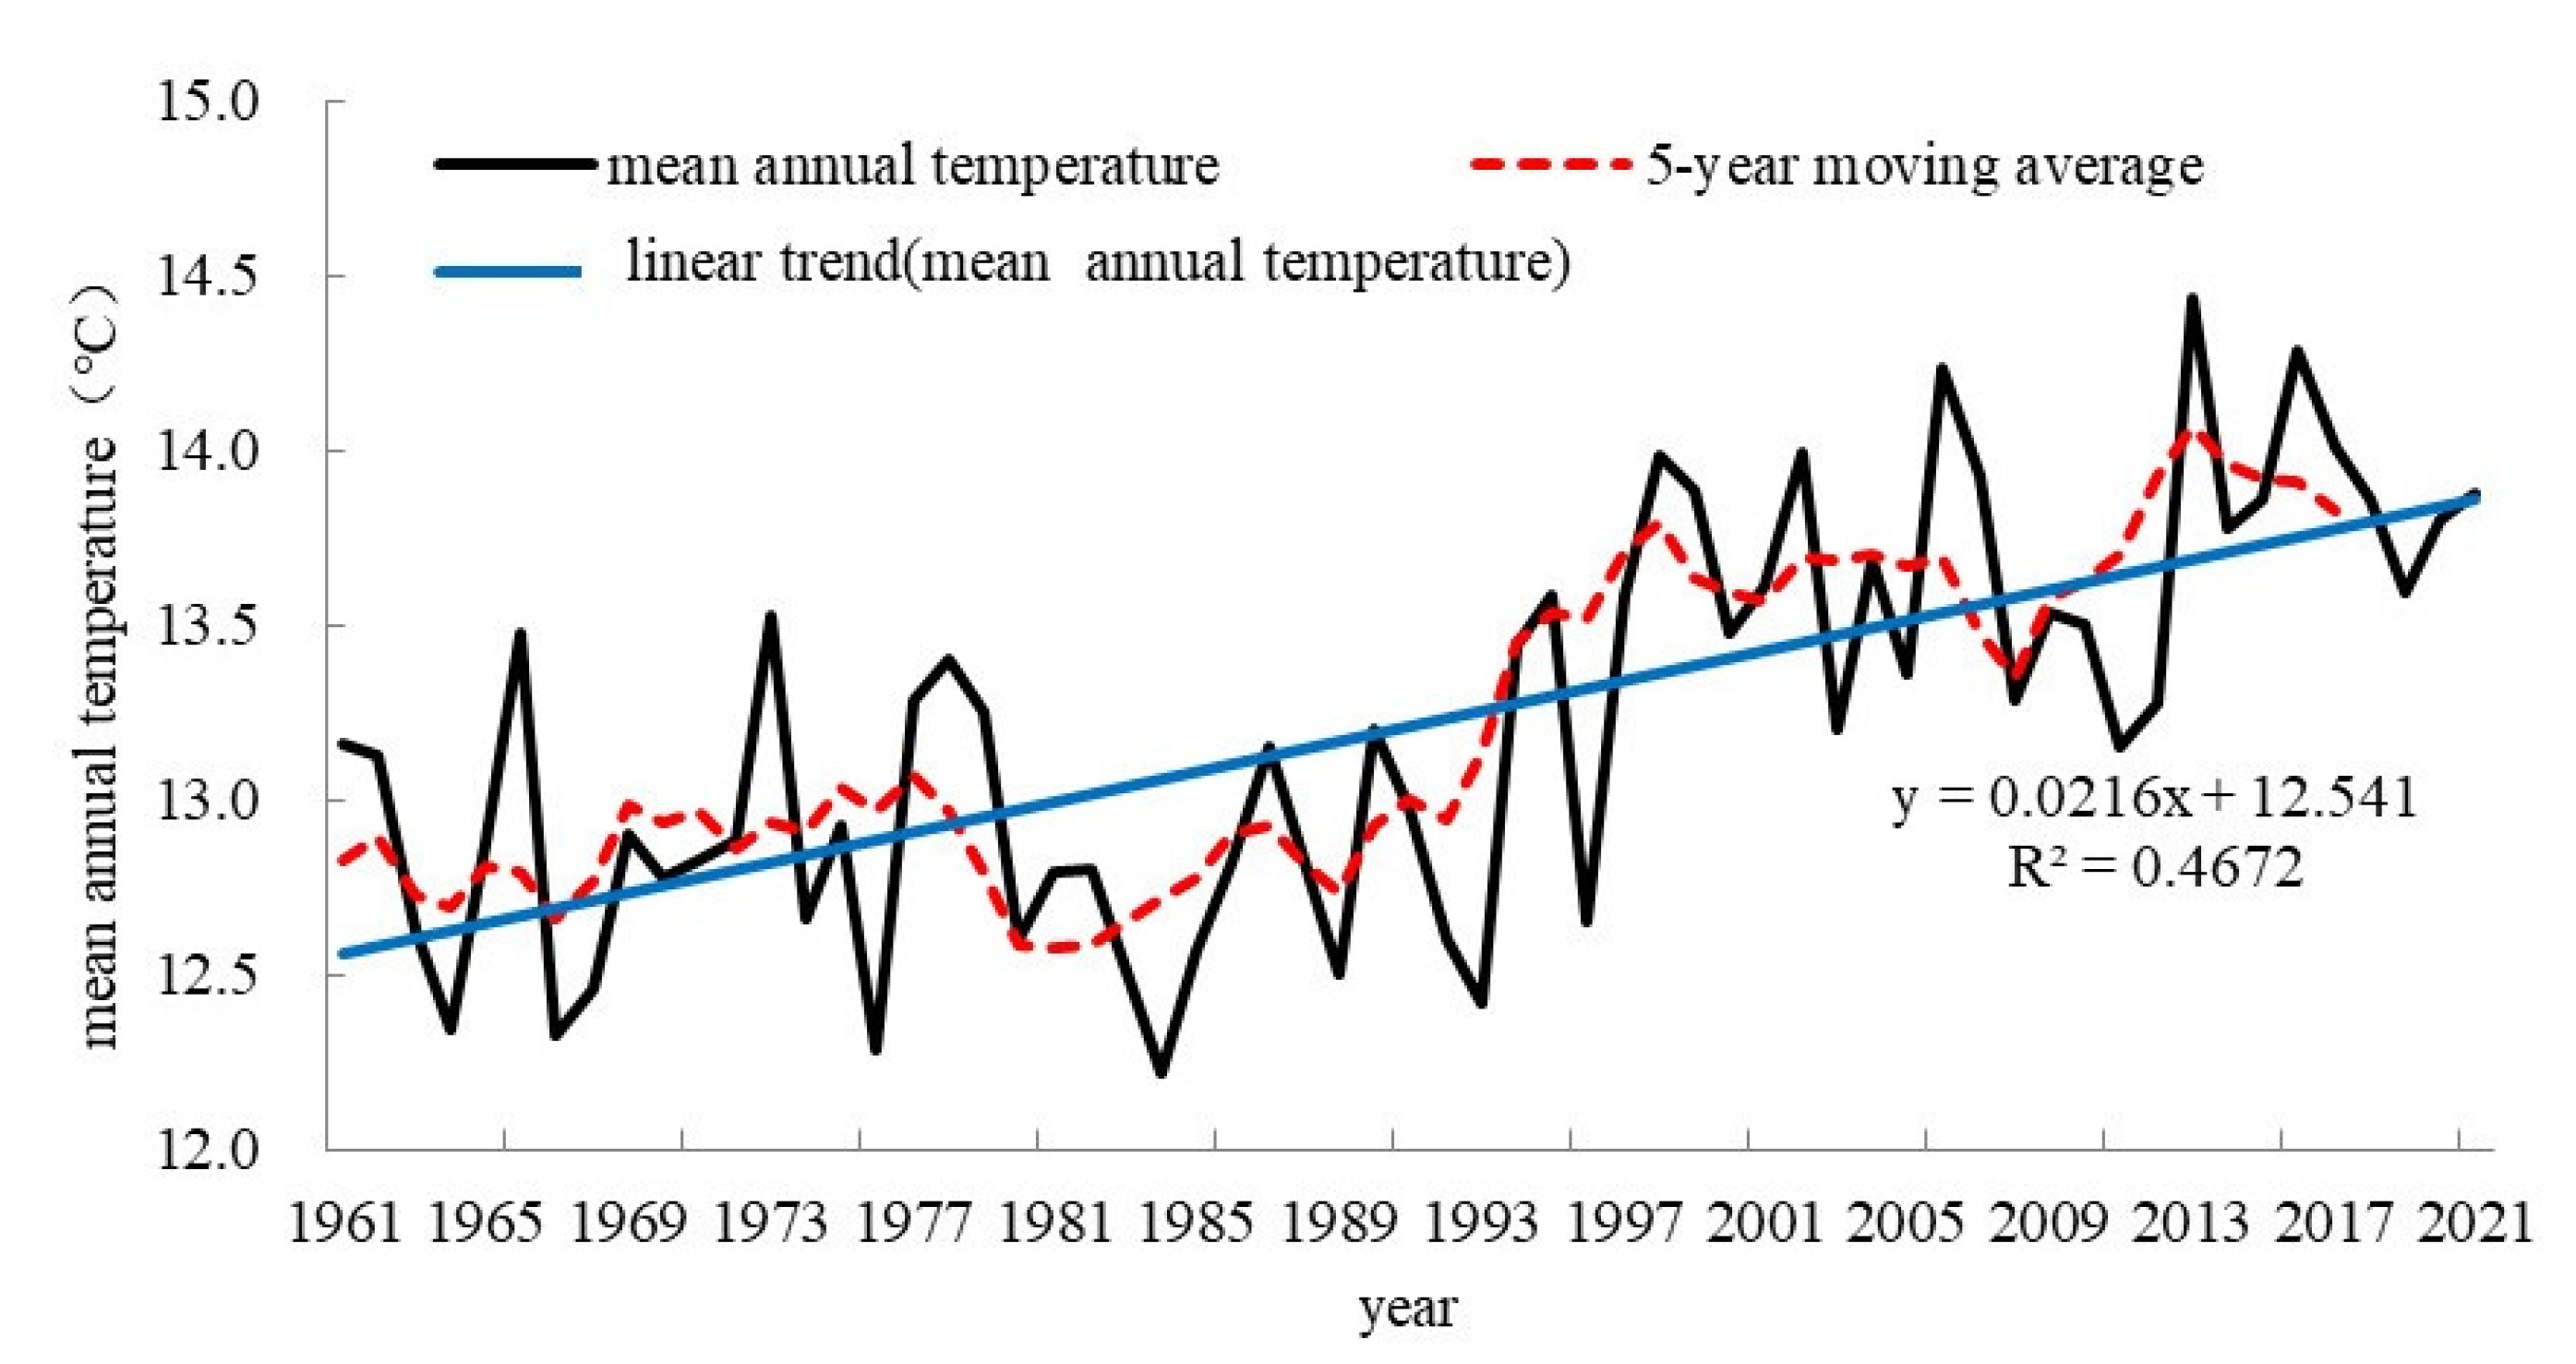
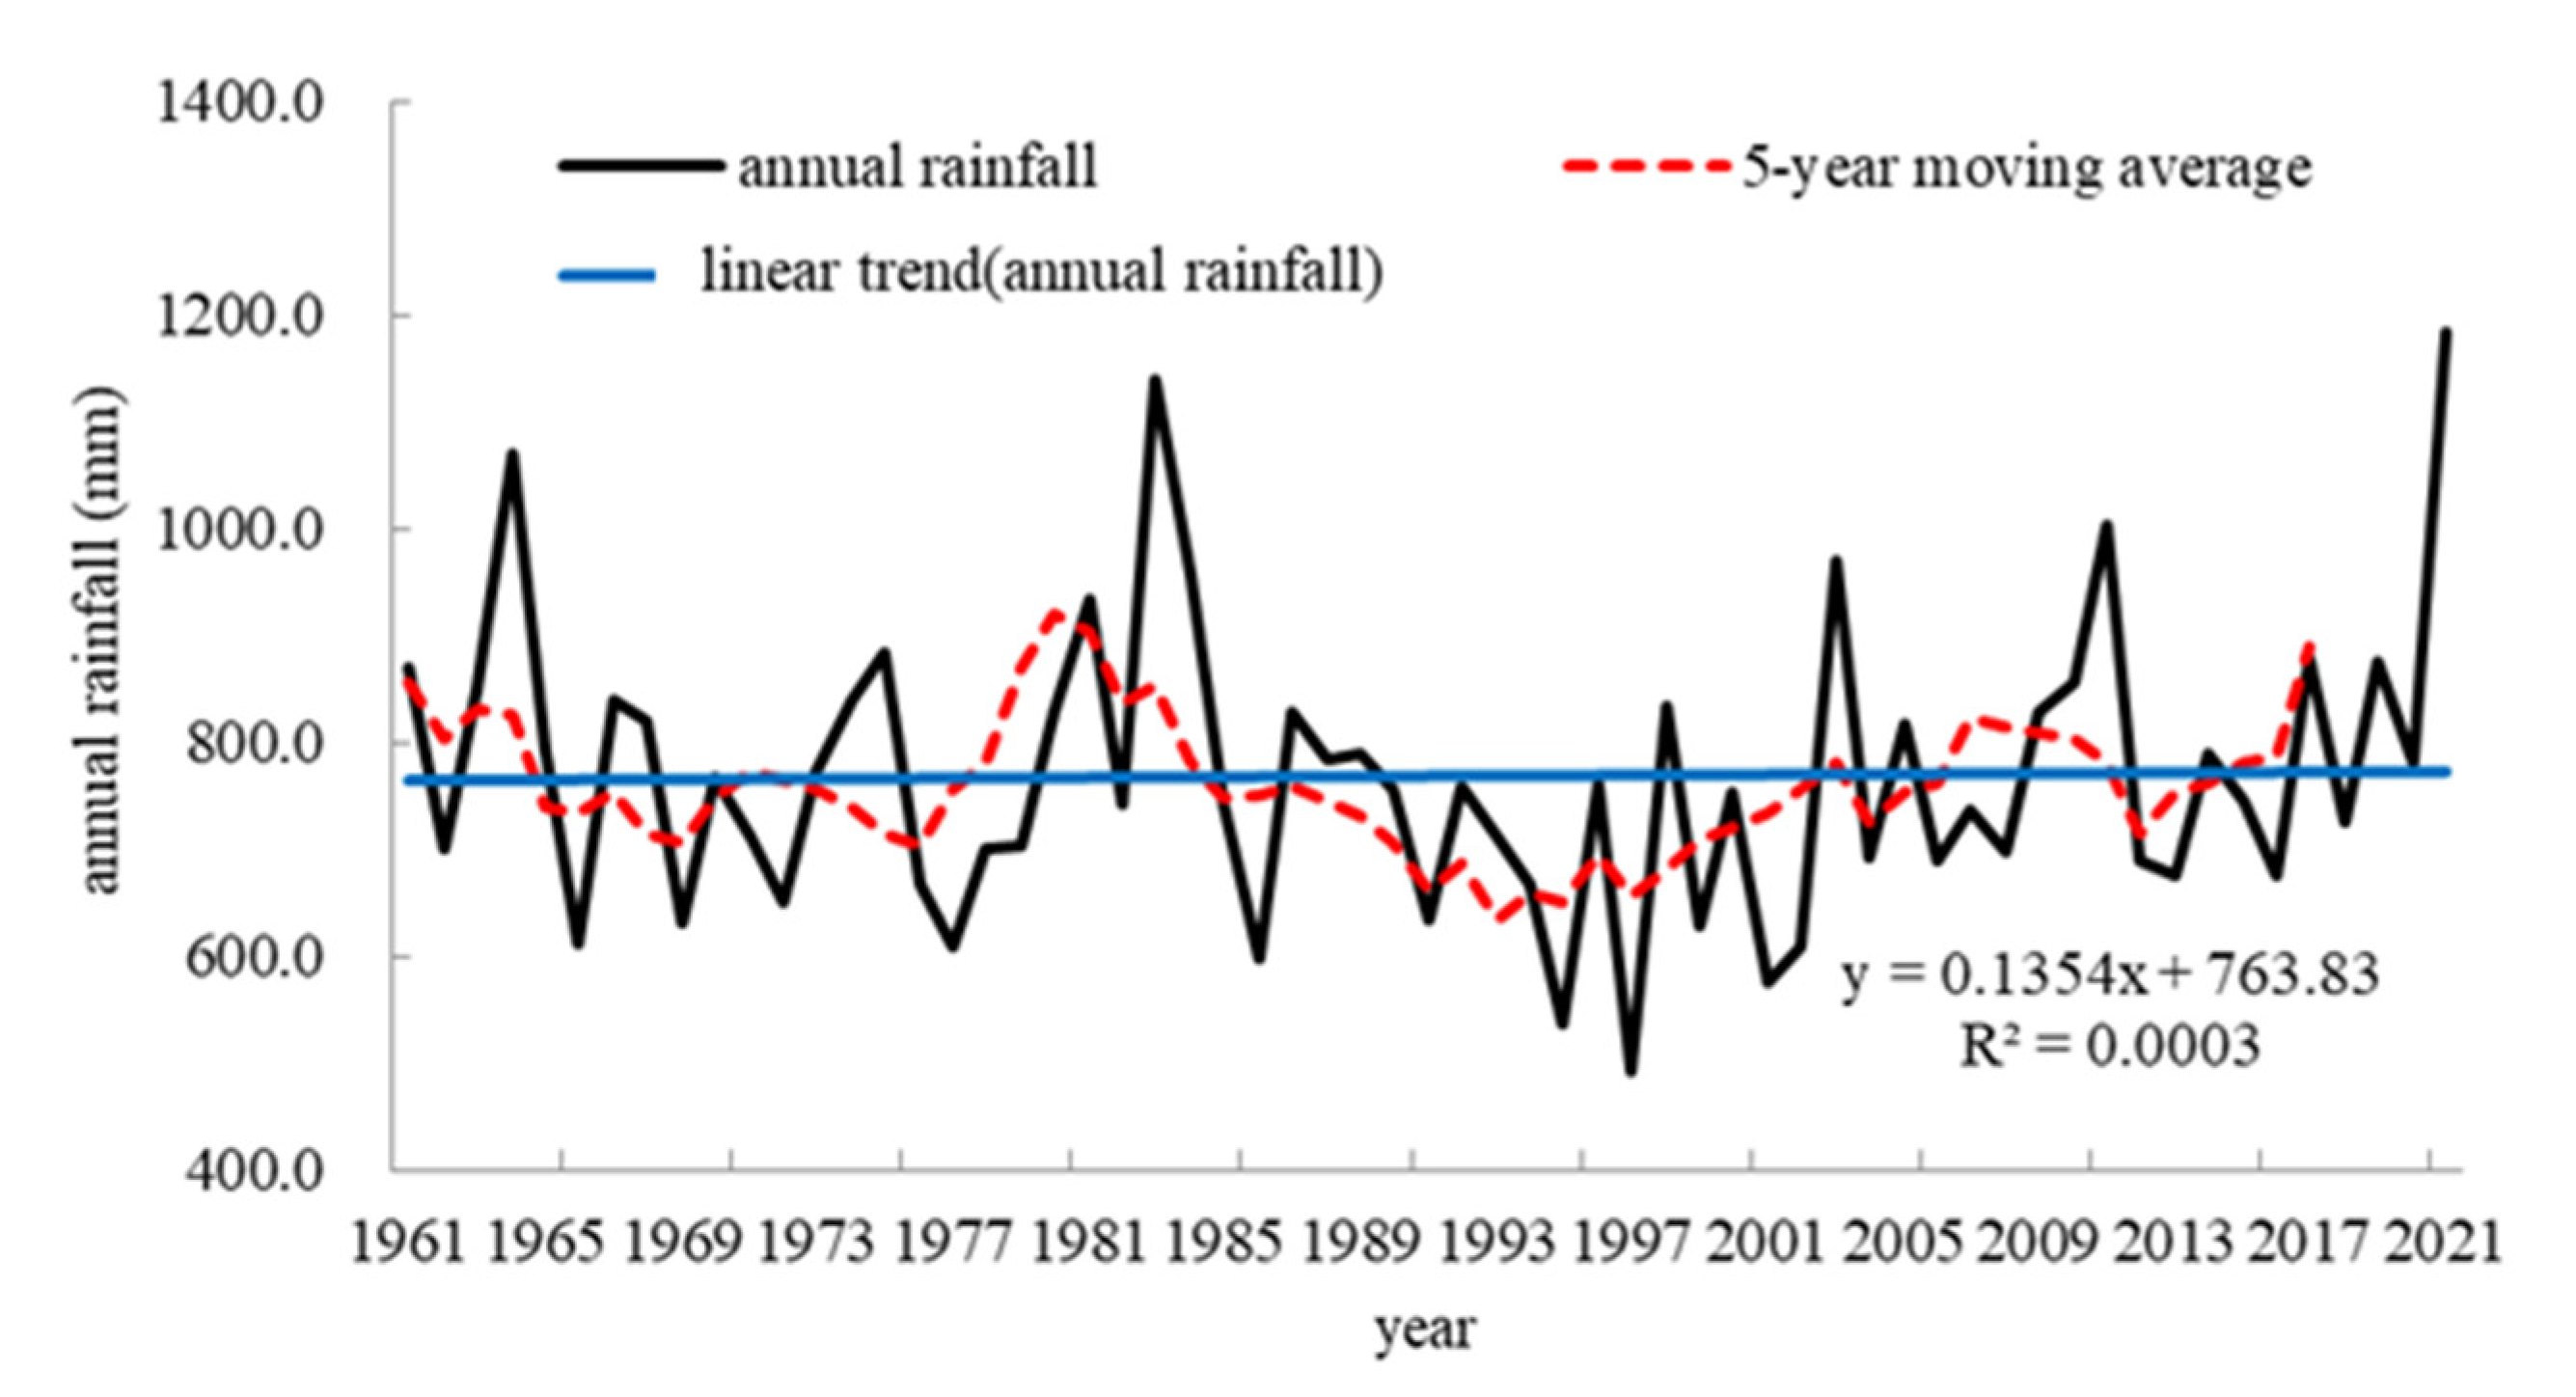
3.1. Temporal Characteristics of Temperature and Rainfall
3.1.1. Interannual and Interdecadal
3.1.2. Seasonal
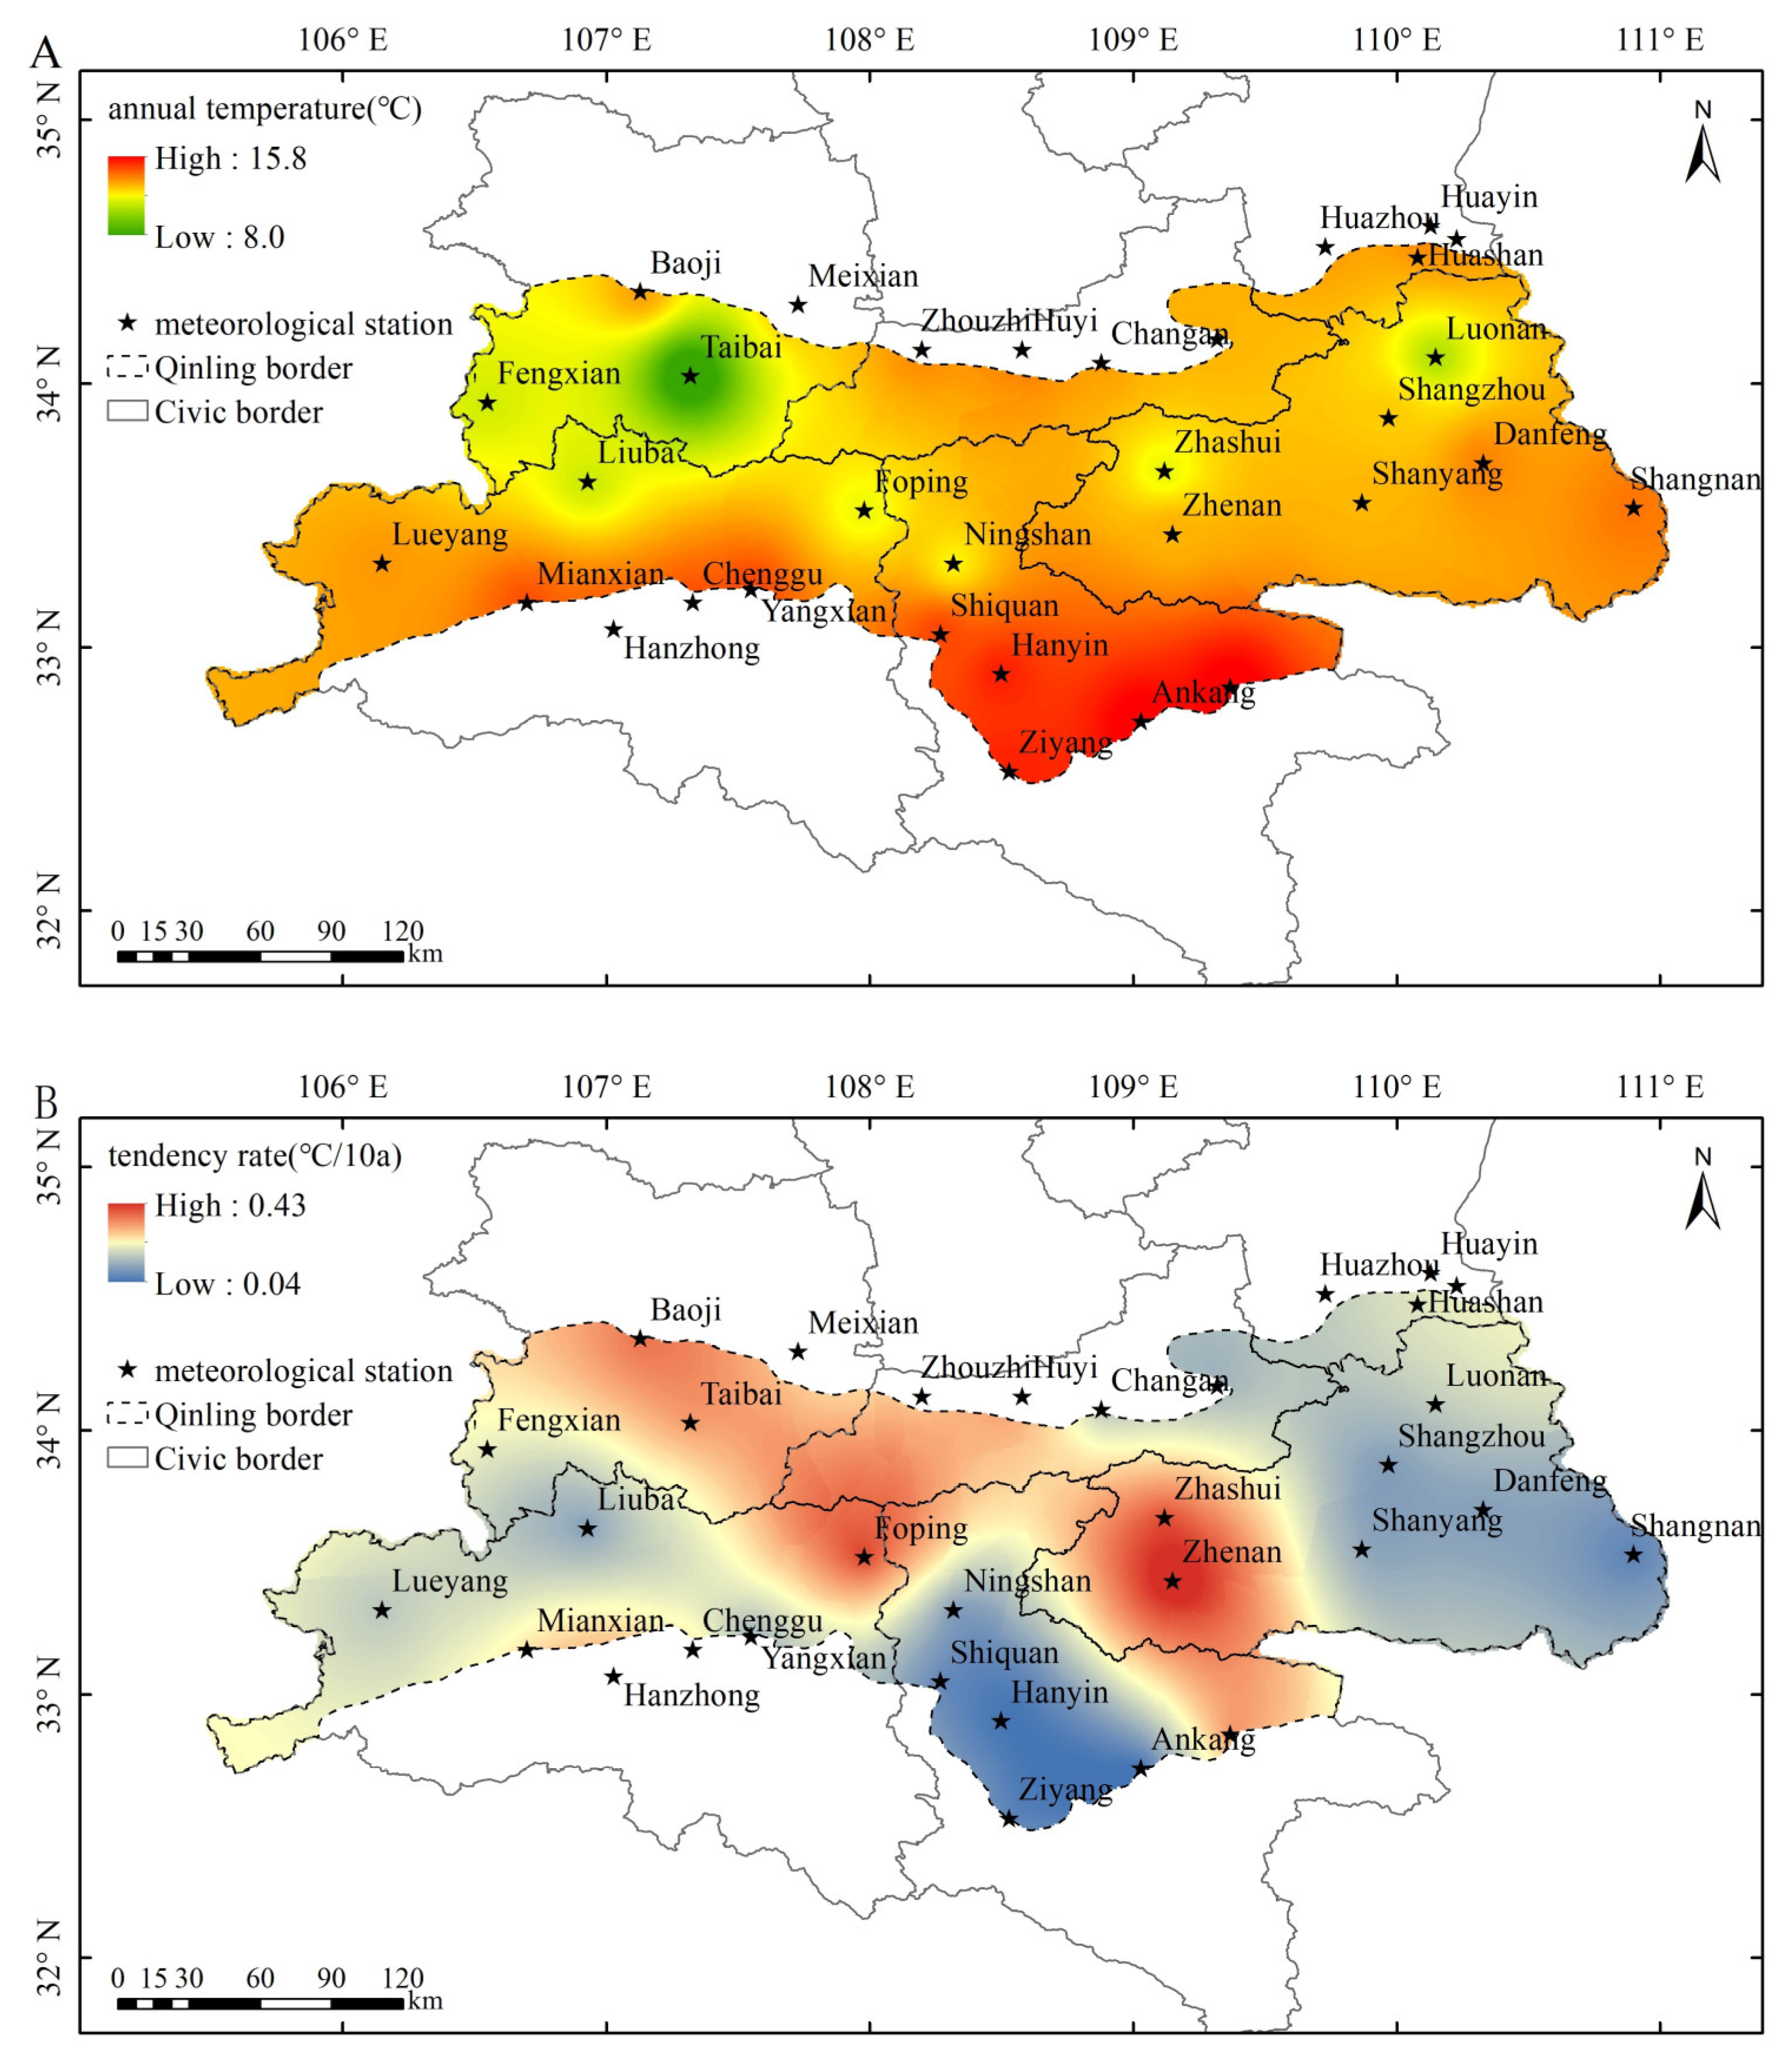
3.2. Spatial Characteristics of Temperature and Rainfall
3.2.1. Spatial Distribution of Temperature
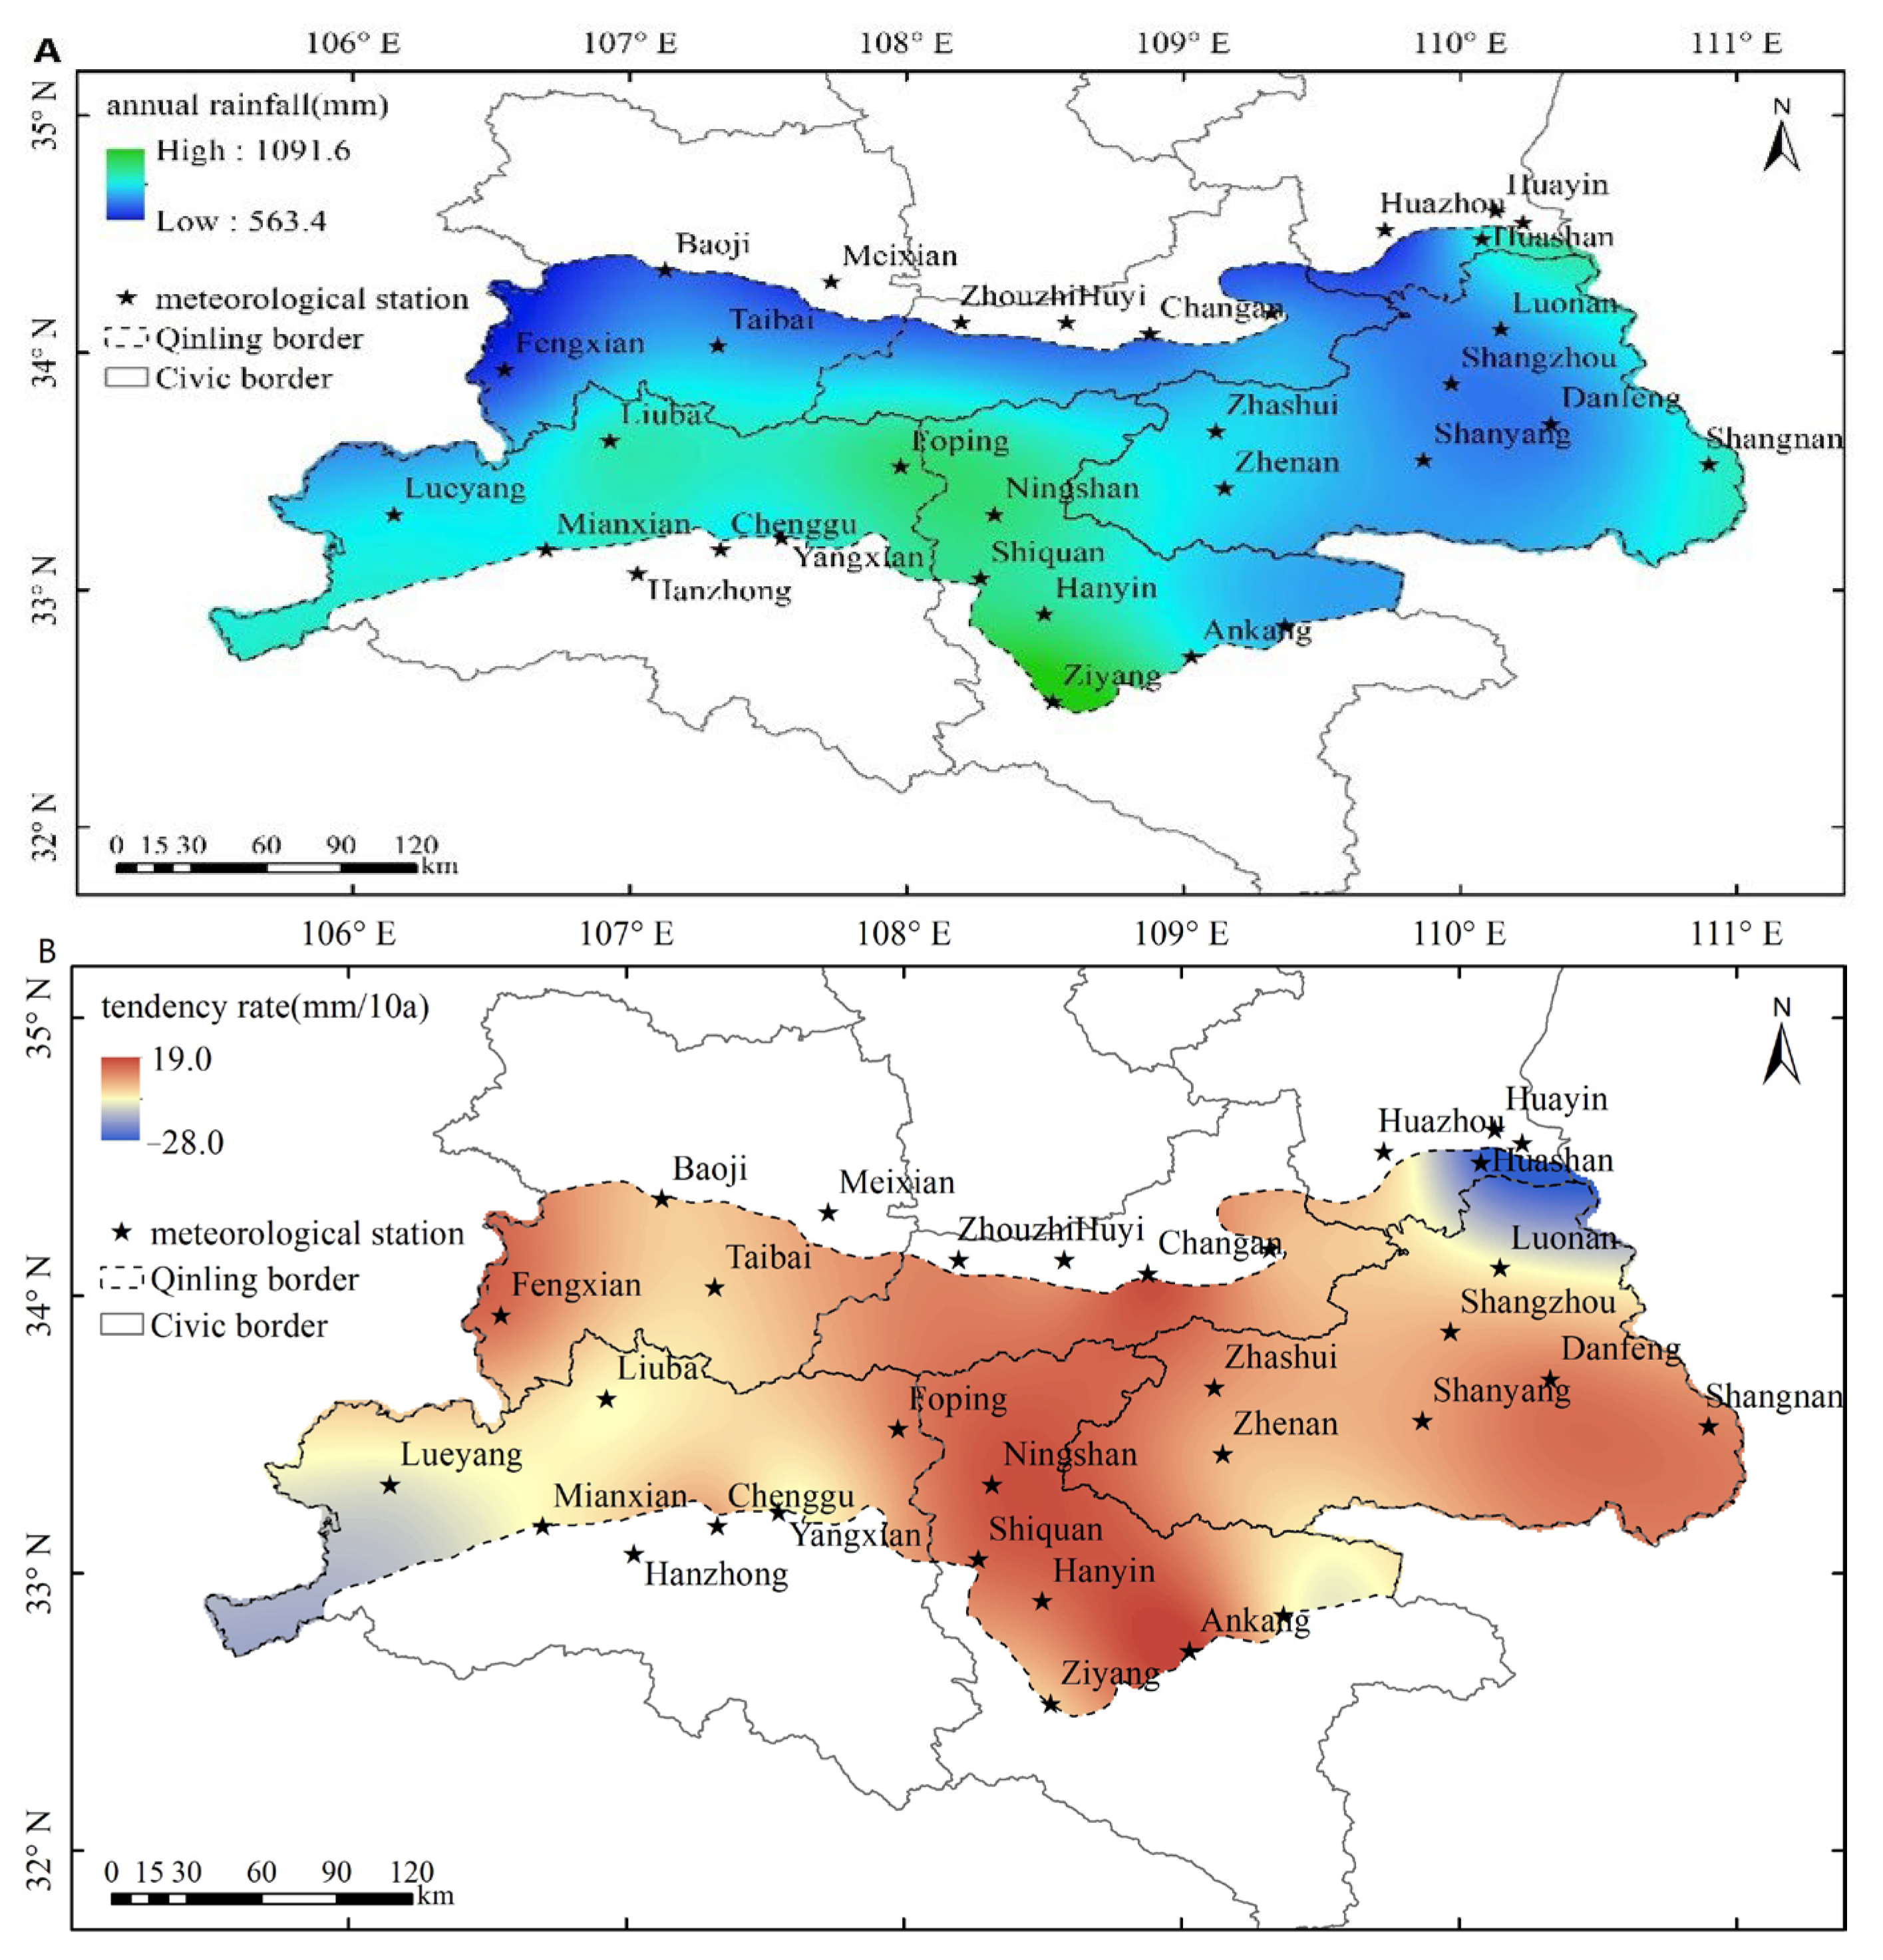
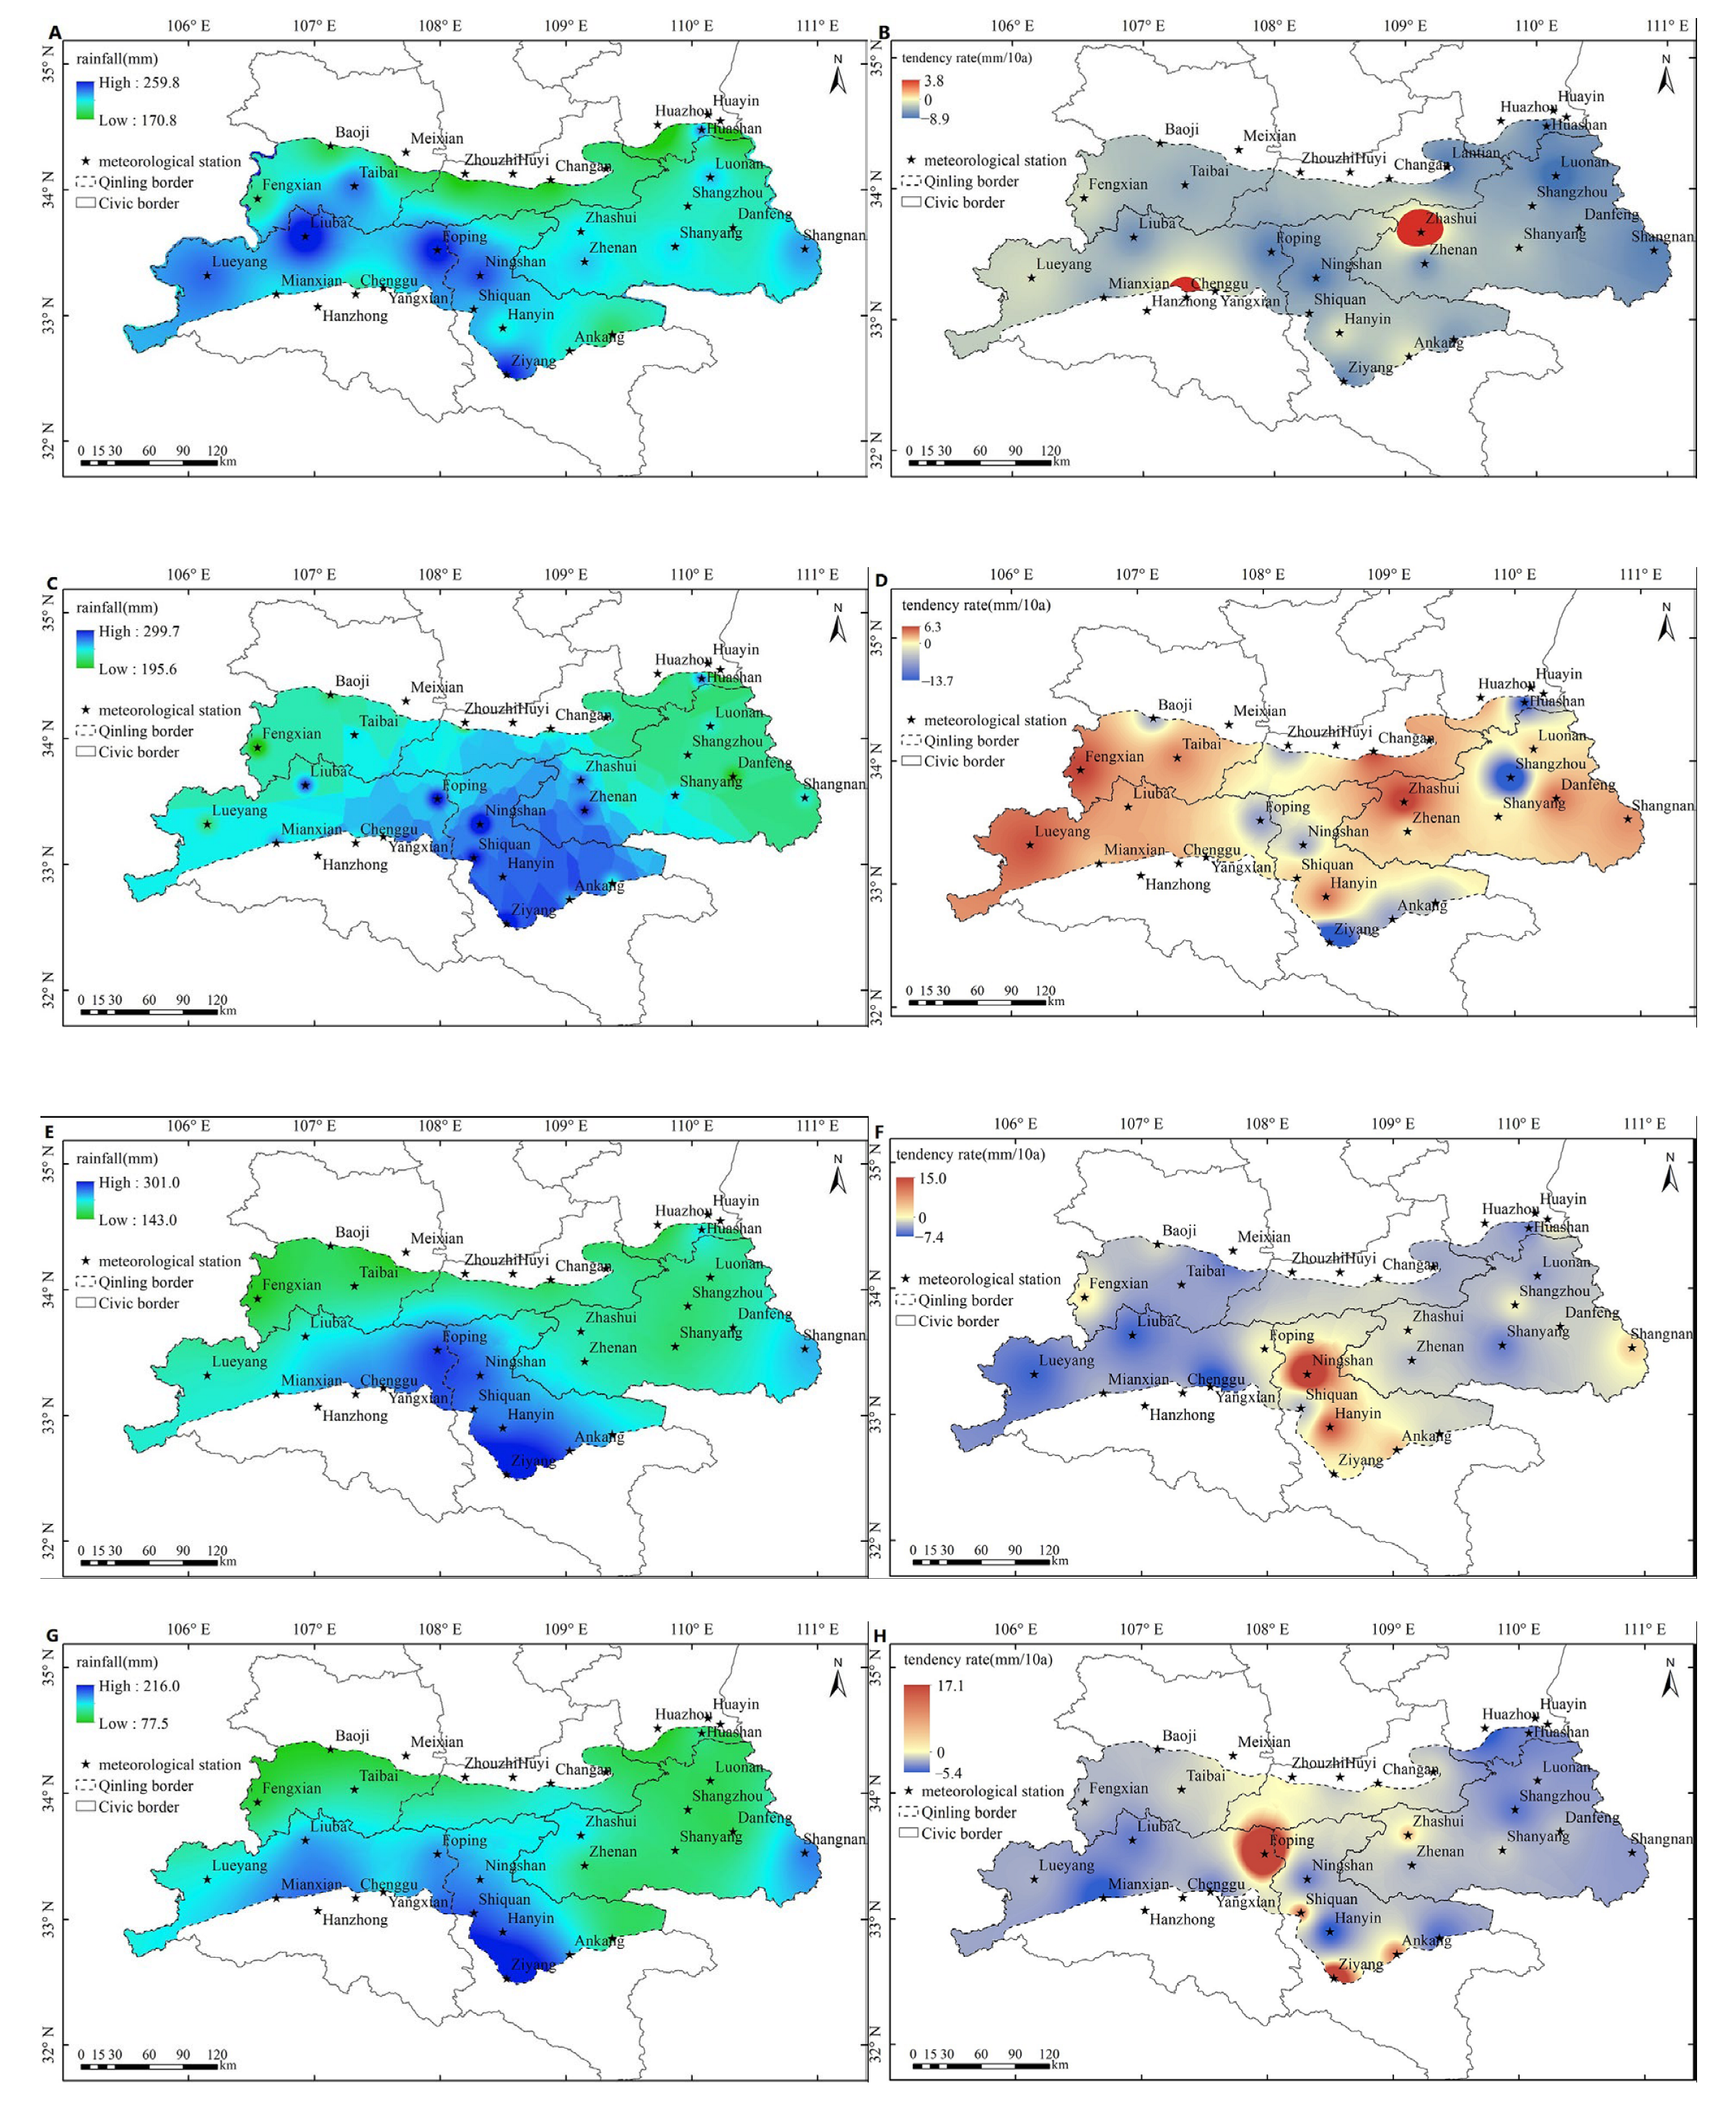
3.2.2. Spatial Distribution of Rainfall
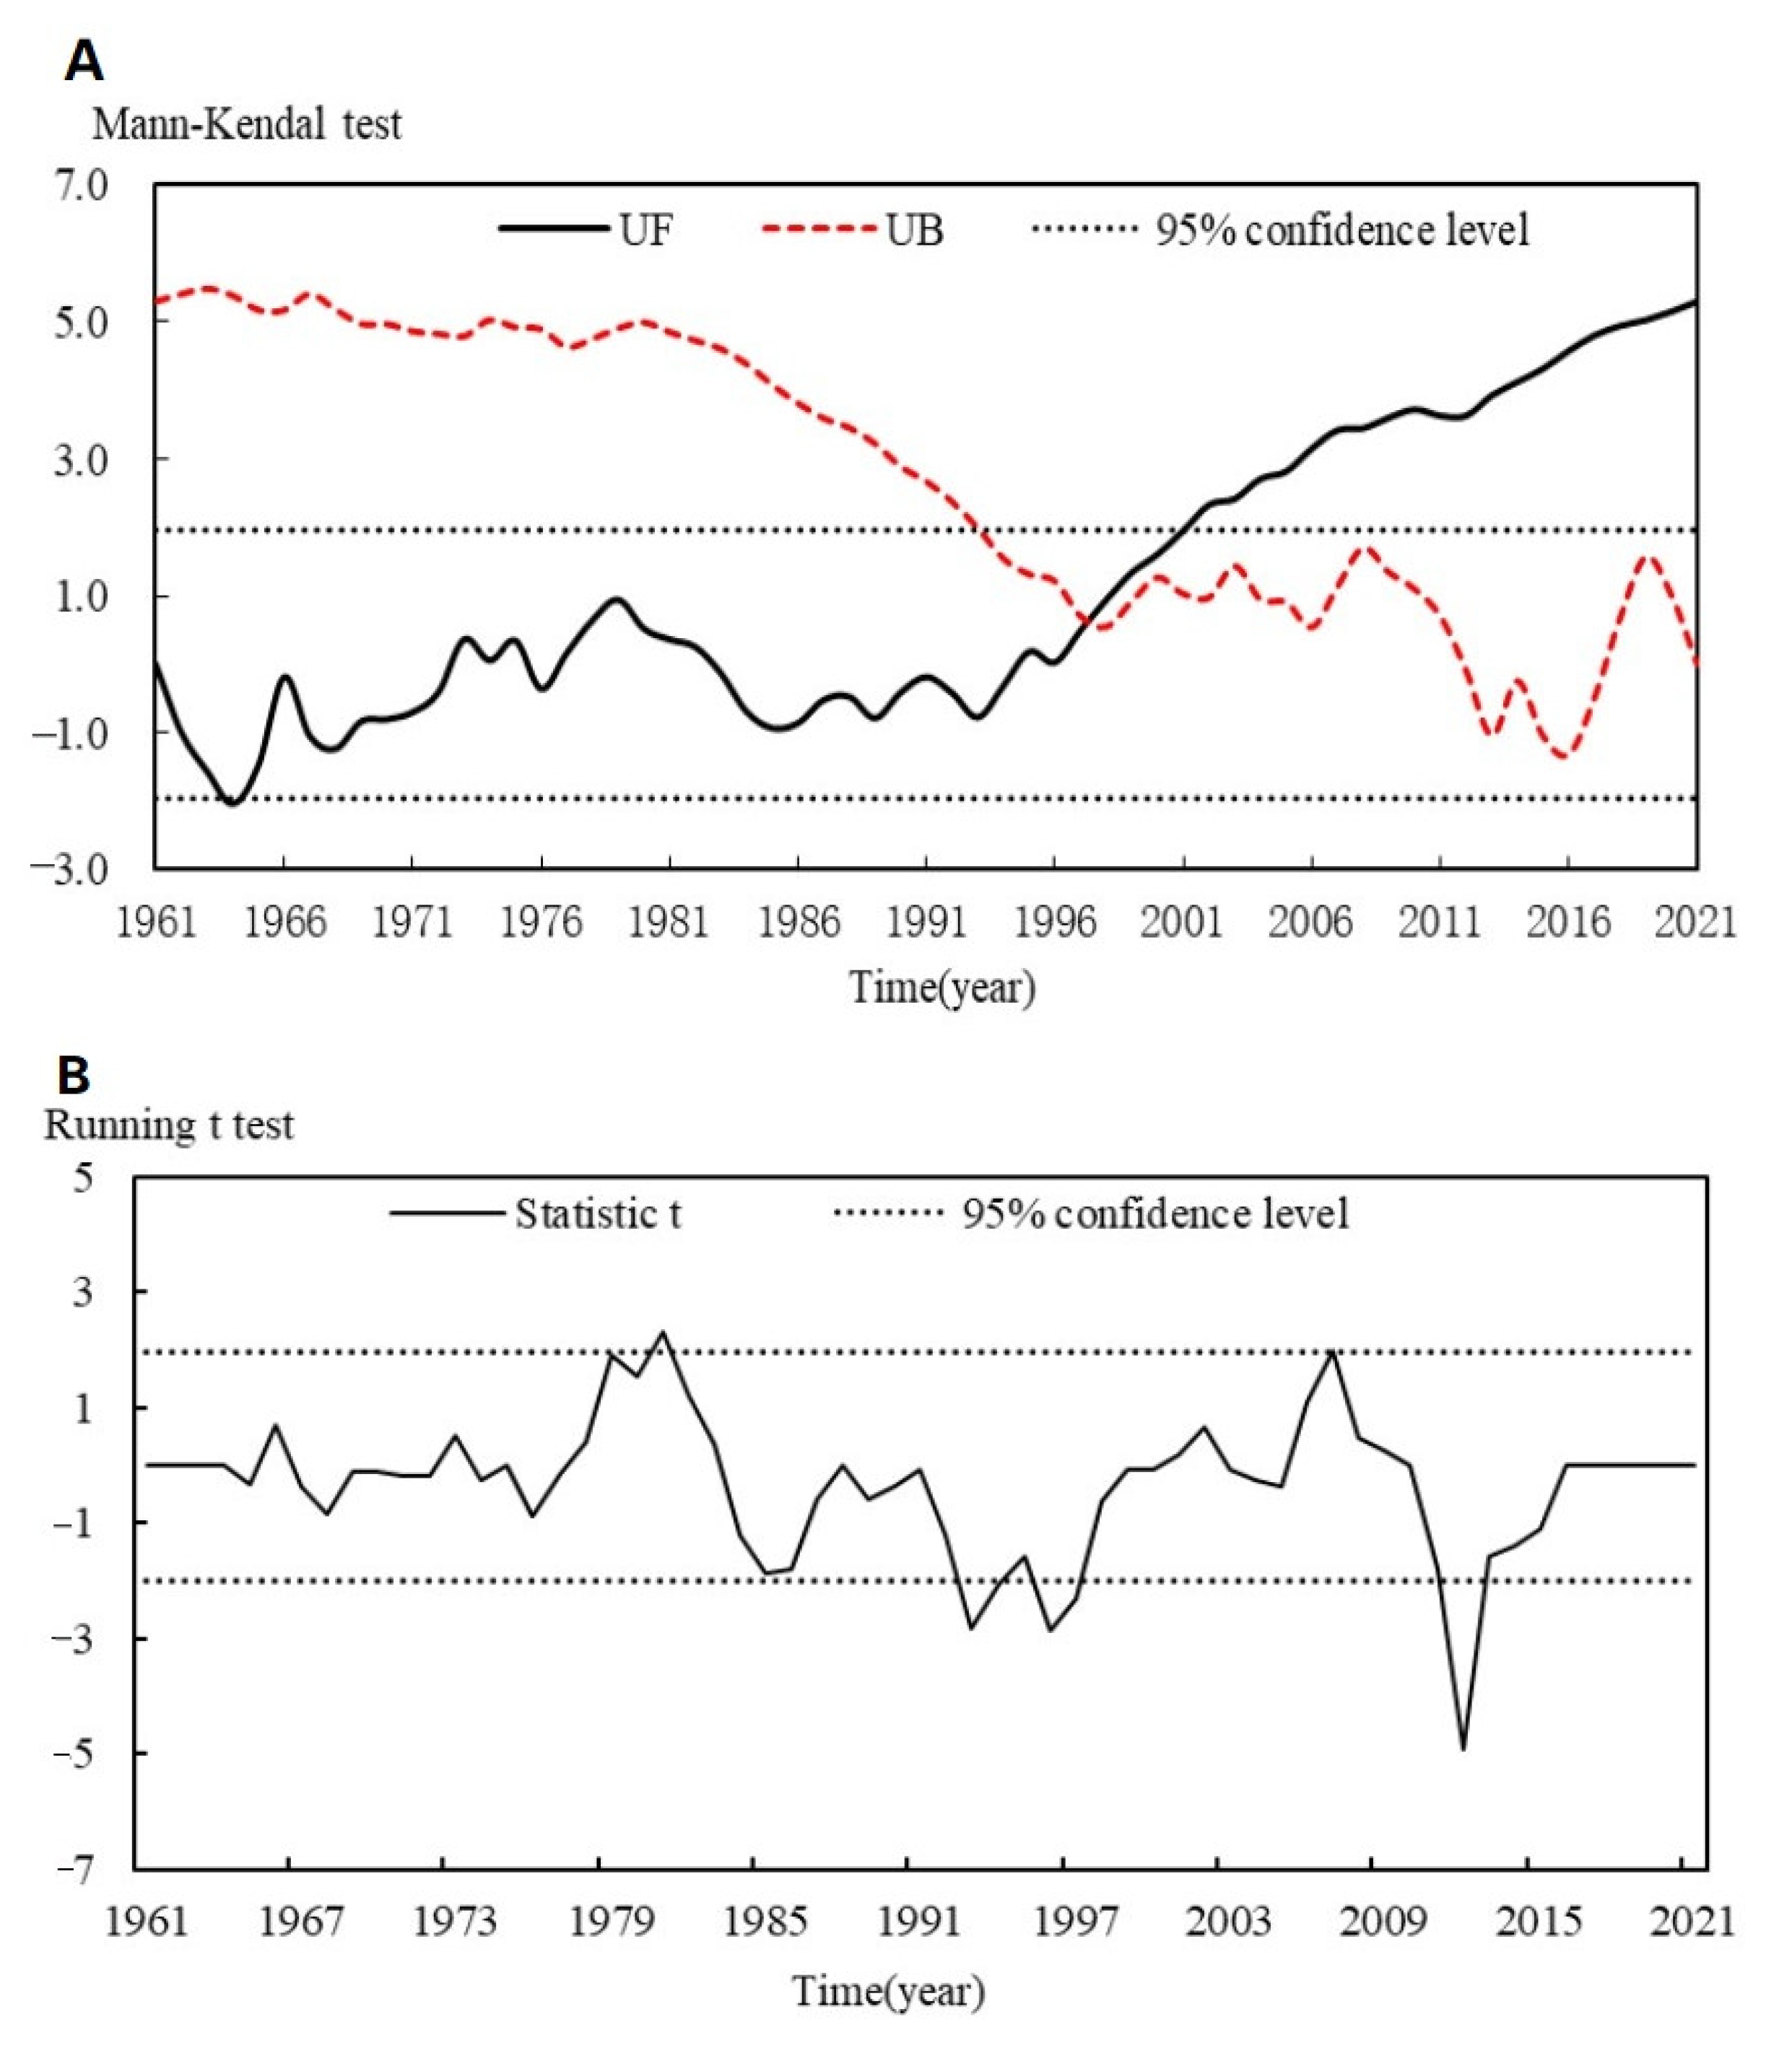
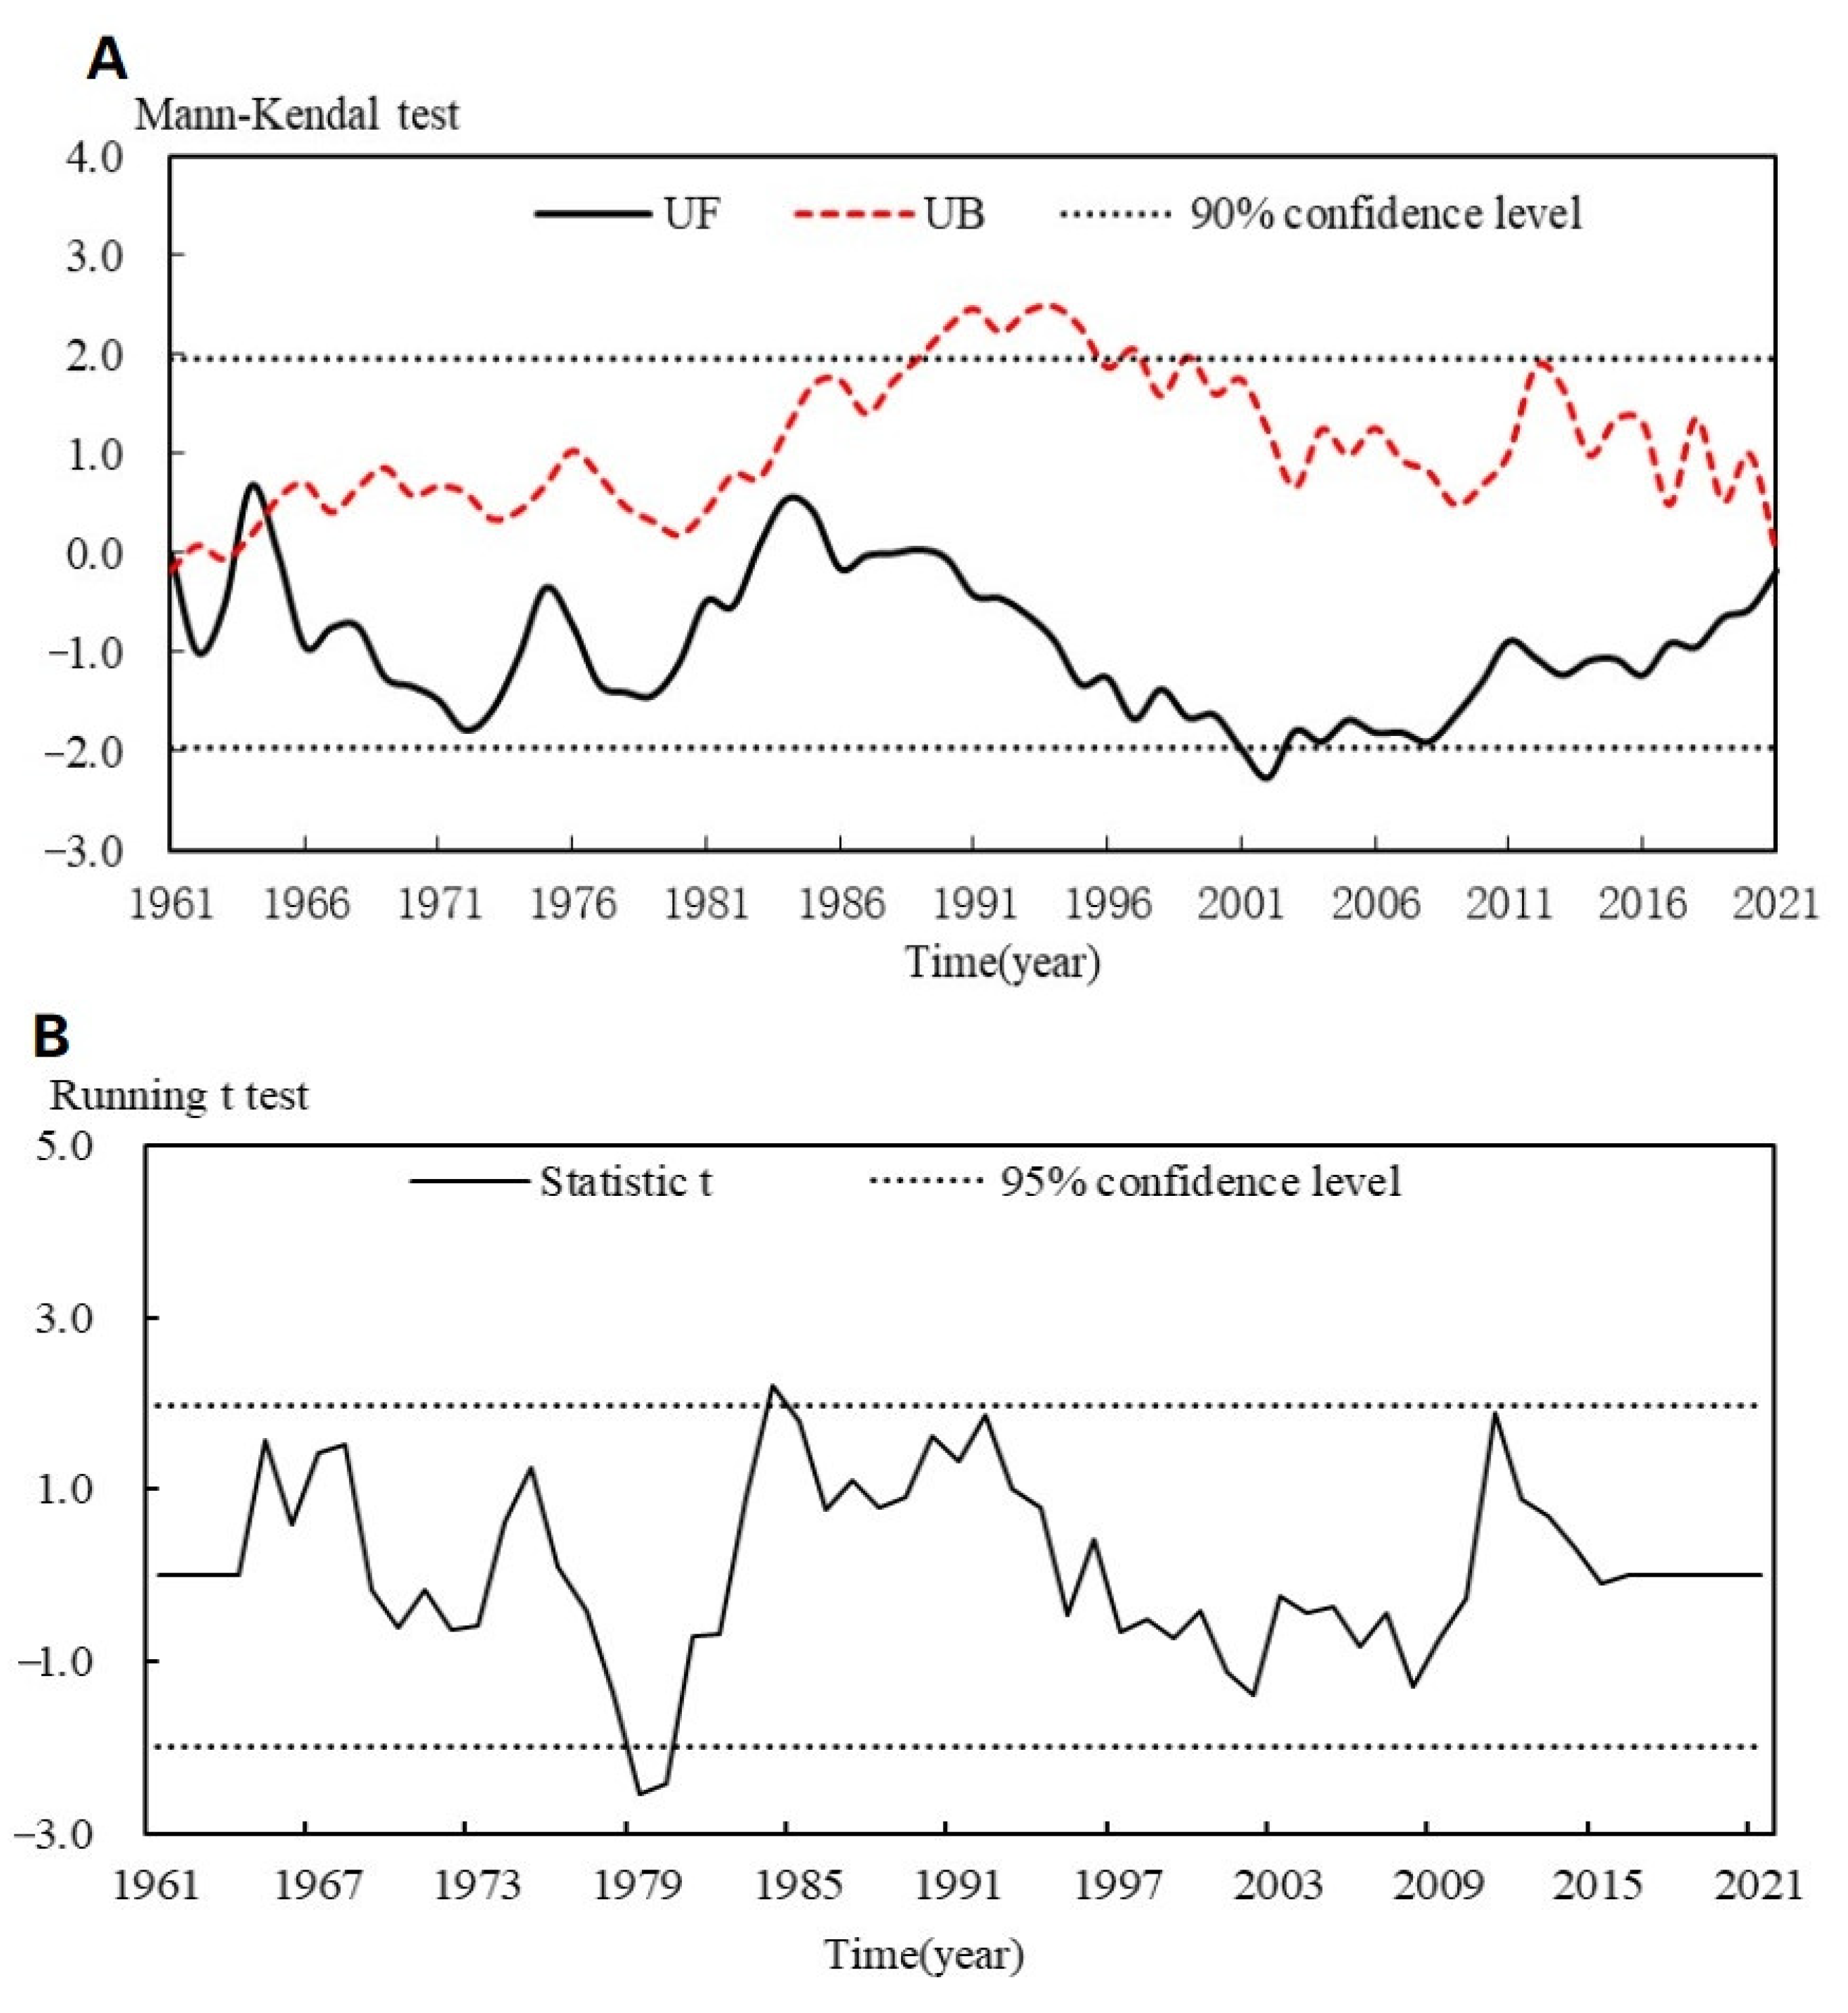
3.3. The Abrupt Changes in Temperature and Rainfall
3.4. Correlation Analysis between Temperature, Rainfall, and Geographical Factors
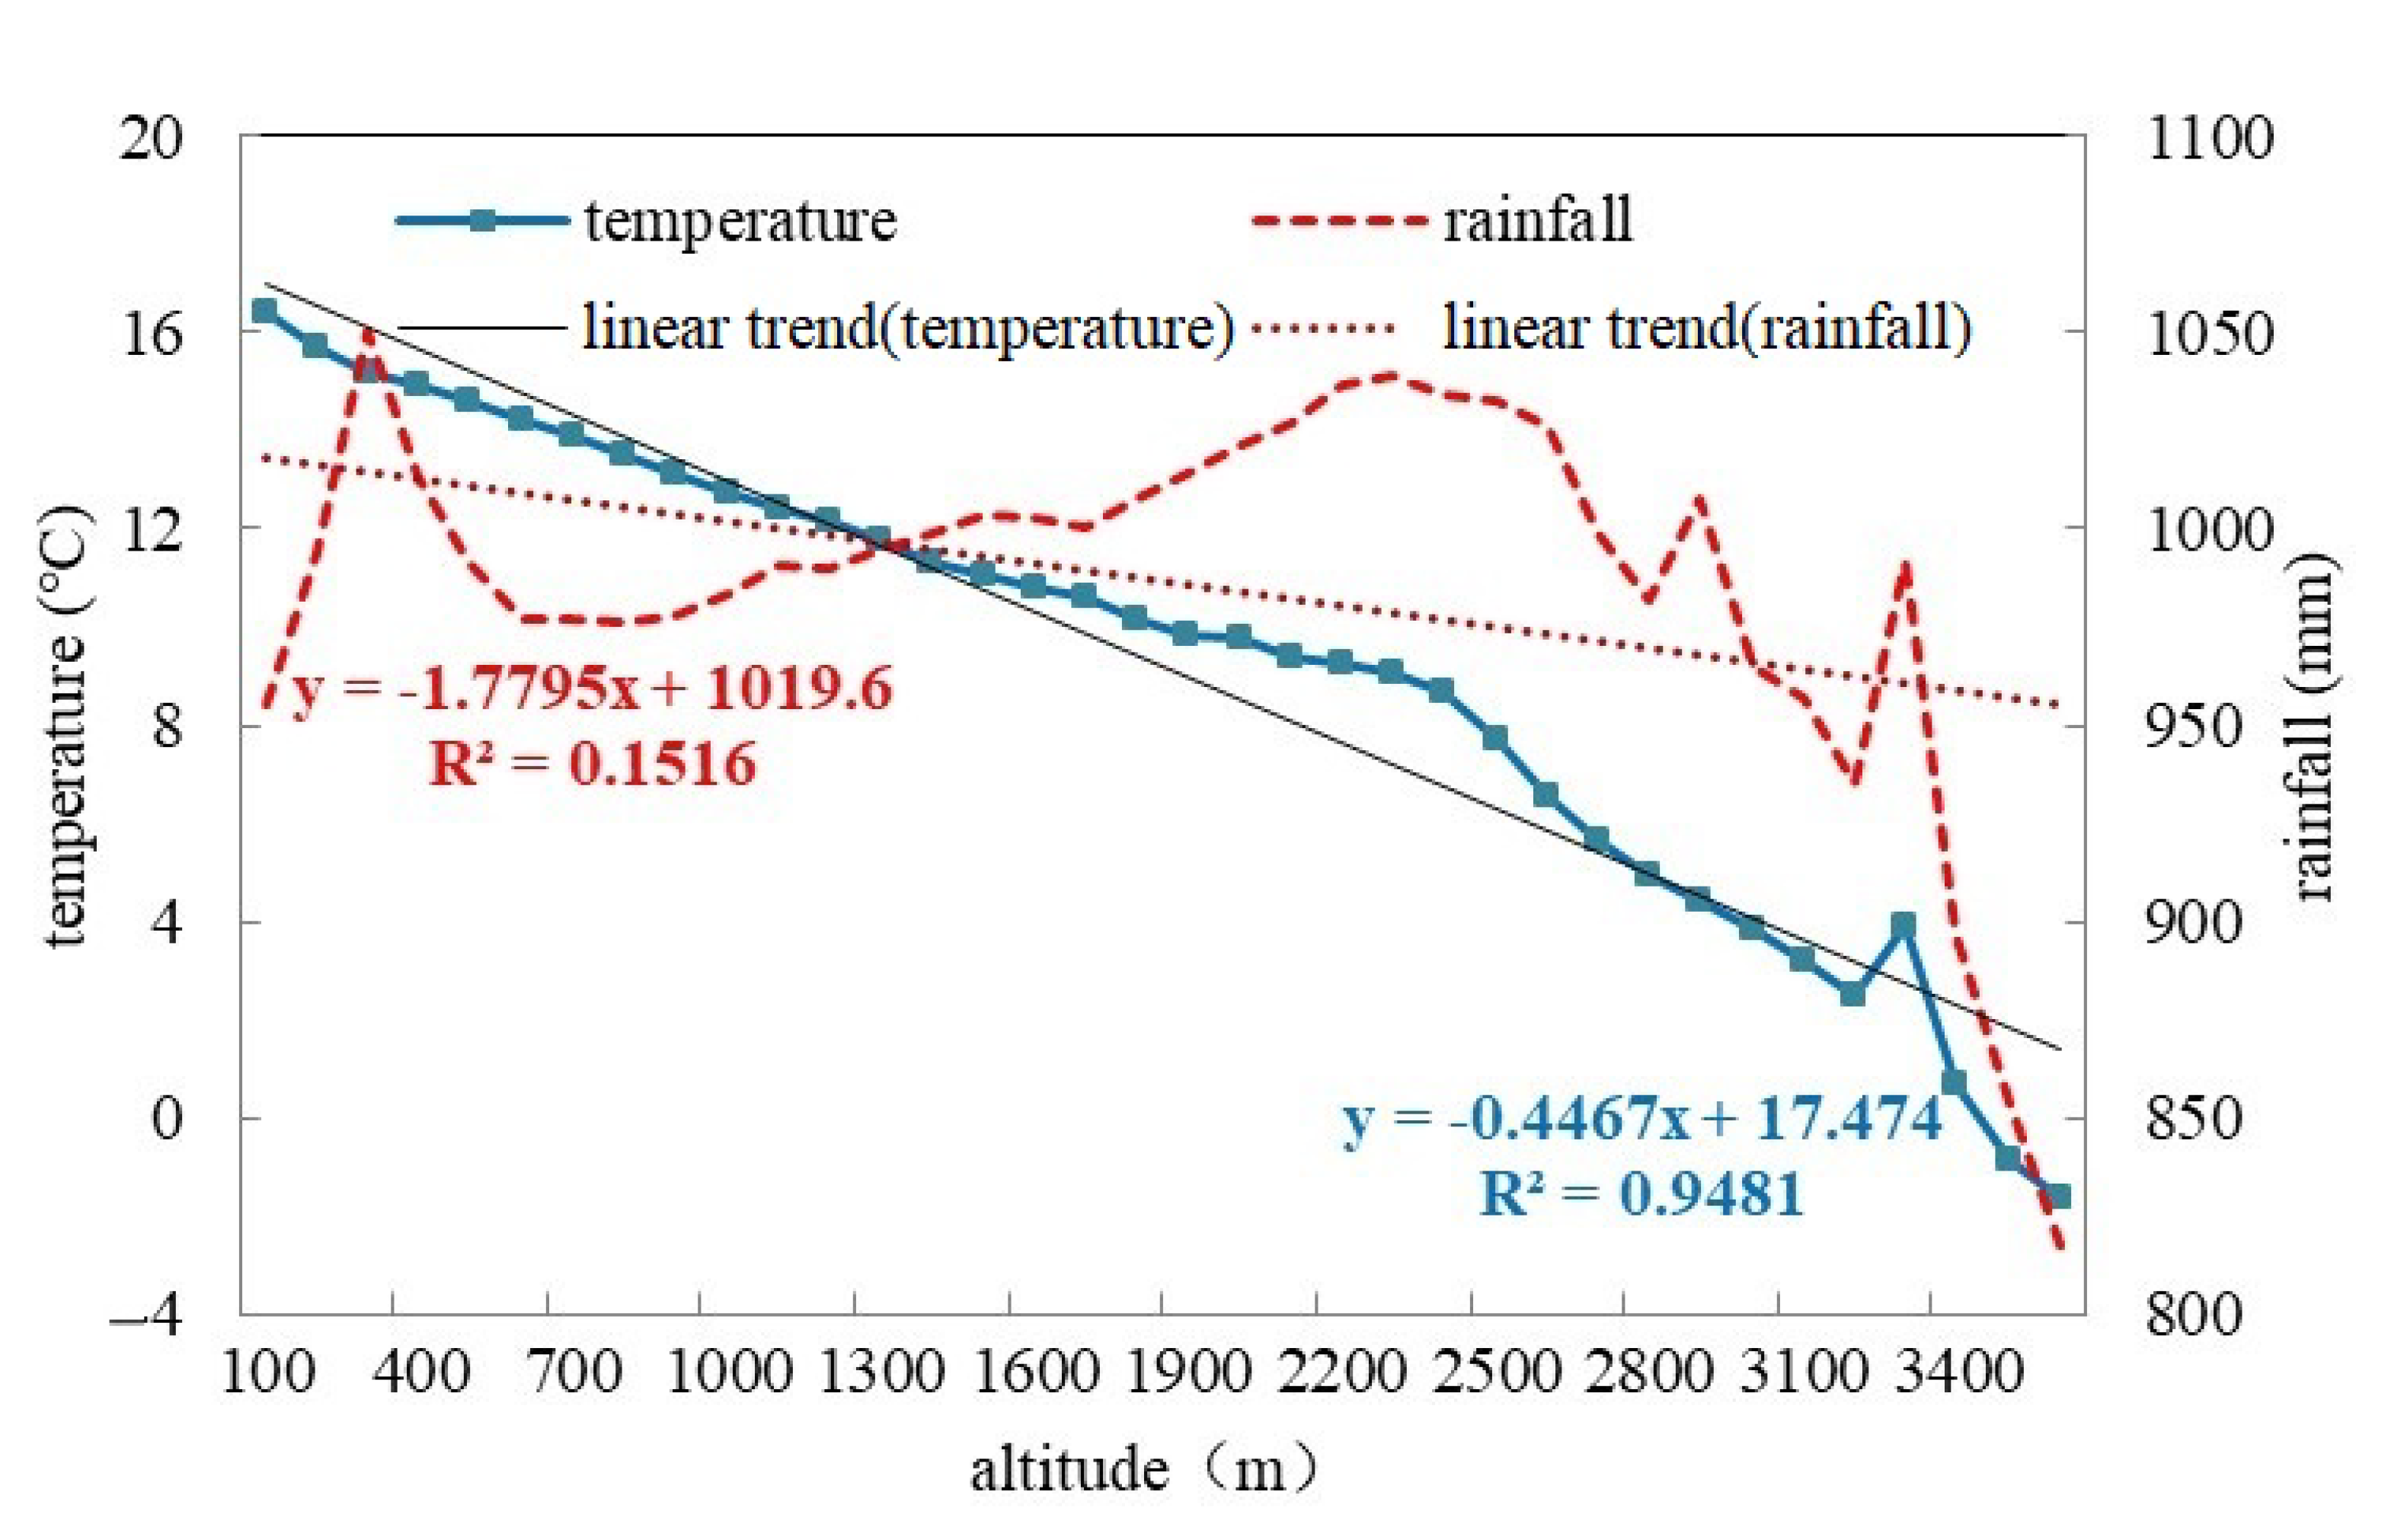
3.4.1. Correlation Analysis of Temperature, Rainfall, and Elevation
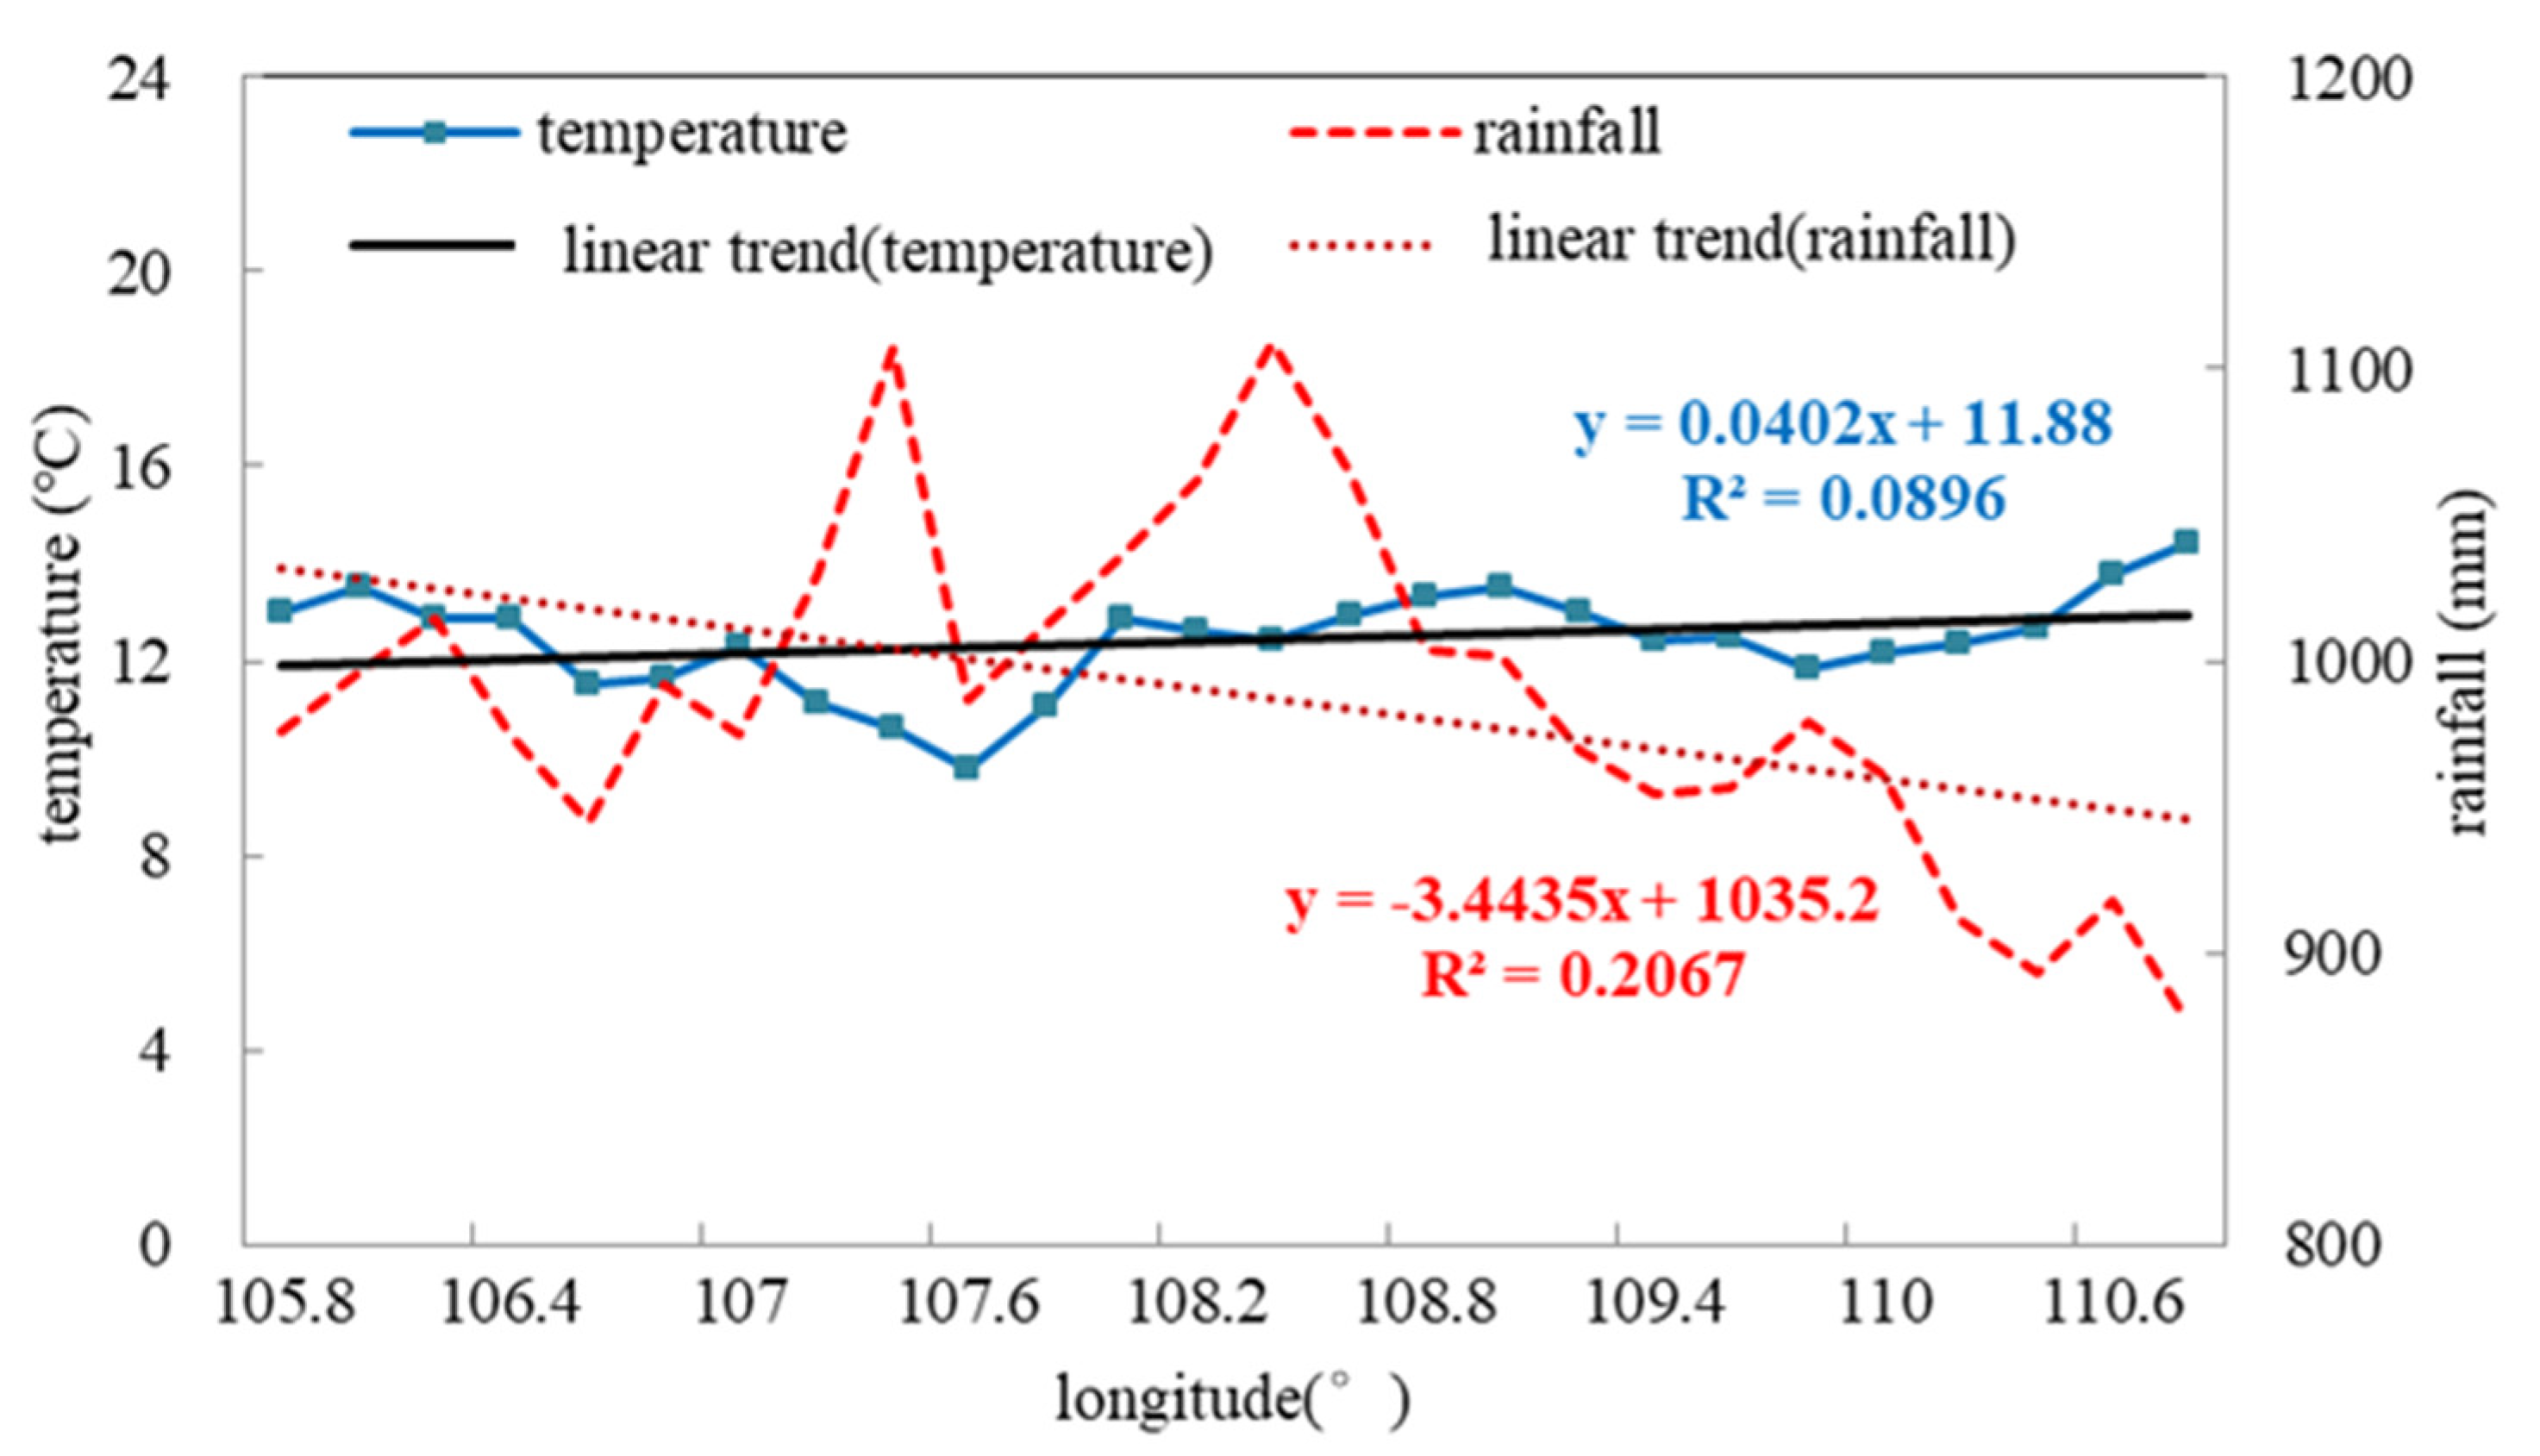
3.4.2. Correlation Analysis of Temperature, Rainfall, and Longitude
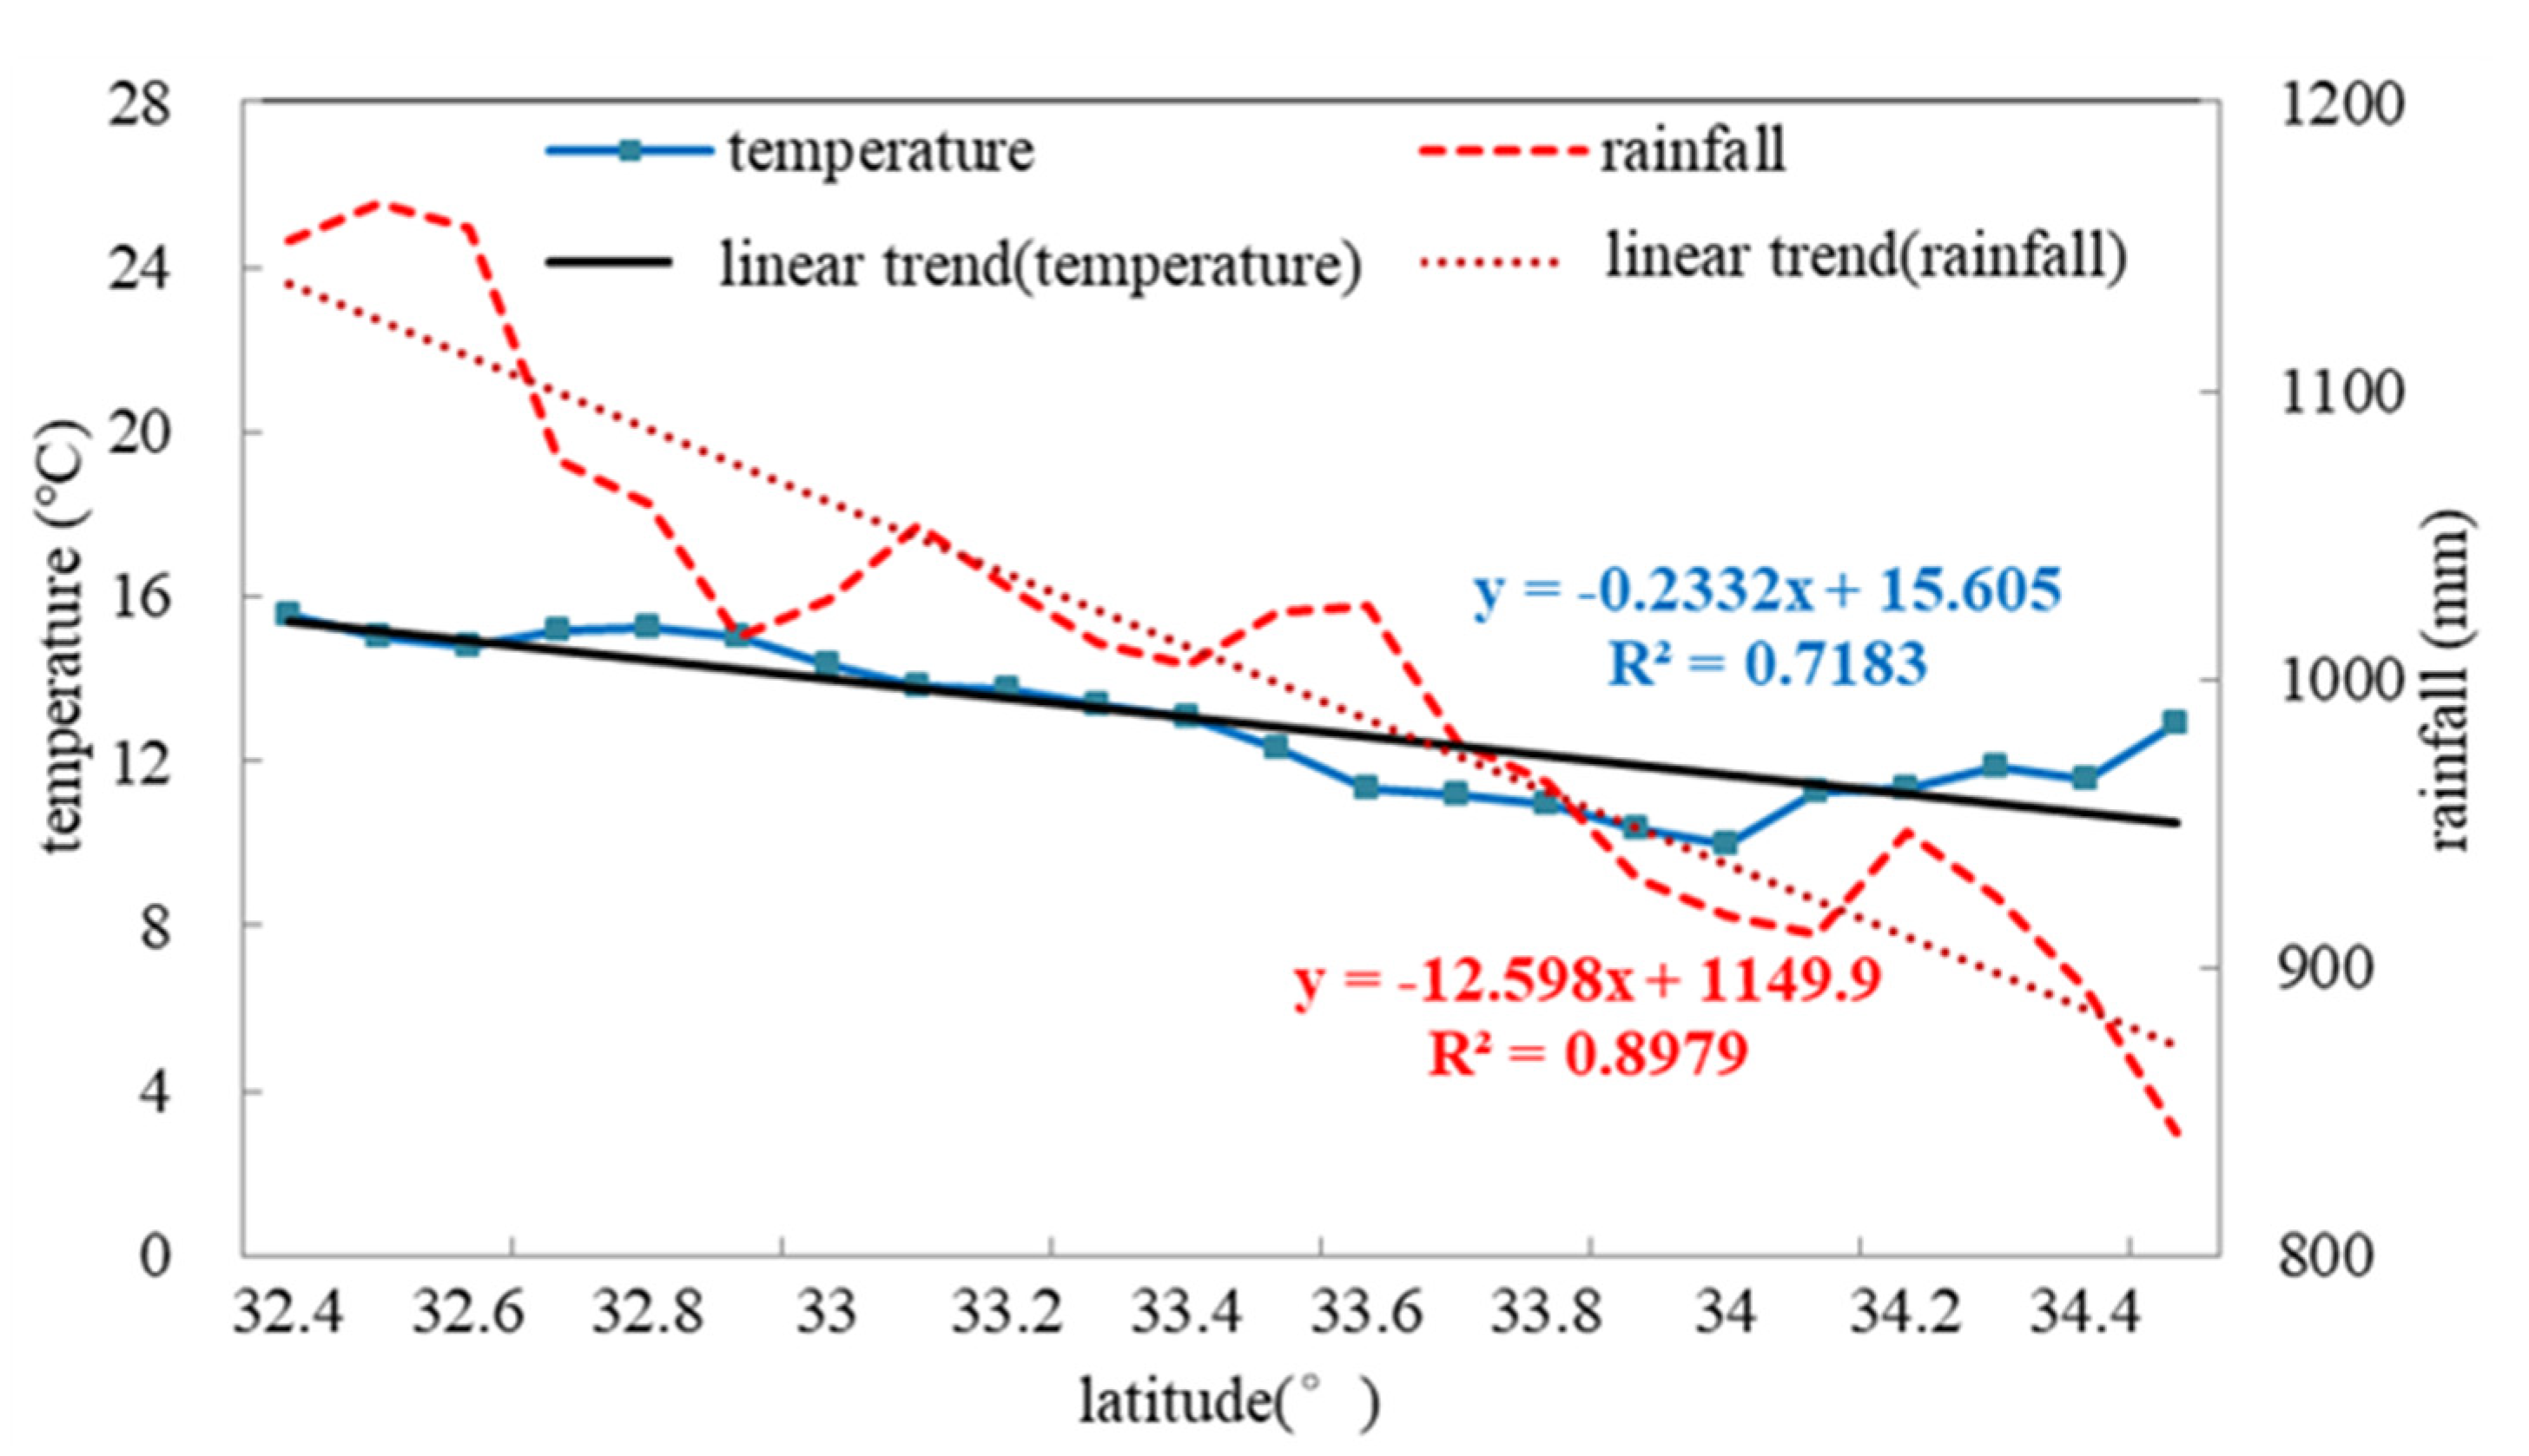
3.4.3. Correlation Analysis of Temperature, Rainfall, and Latitude
4. Discussion and Conclusions
Author Contributions
Funding
Institutional Review Board Statement
Informed Consent Statement
Data Availability Statement
Acknowledgments
Conflicts of Interest
References
- Nijssen, B.; O’Donnell, G.M.; Hamlet, A.F.; Lettenmaier, D.P. Hydrologic sensitivity of global rivers to climate change. Clim. Chang. 2001, 50, 143–175. [Google Scholar] [CrossRef]
- Trenberth, K.E. Atmospheric moisture residence times and cycling: Implications for precipitation rates and climate change. Clim. Chang. 1998, 39, 667–694. [Google Scholar] [CrossRef]
- Babaousmail, H.; Hou, R.; Ayugi, B.; Sian, K.T.C.L.K.; Ojara, M.; Mumo, R.; Chehbouni, A.; Ongoma, V. Future changes in mean and extreme precipitation over the Mediterranean and Sahararegions using bias-corrected CMIP6 models. Int. J. Climatol. 2022, 42, 7280–7297. [Google Scholar] [CrossRef]
- Zhang, Z.; Duan, K.; Liu, H.; Meng, Y.; Chen, R. Spatio-temporal variation of precipitation in the Qinling mountains from 1970 to 2100 based on CMIP6 data. Sustainability 2022, 14, 8654. [Google Scholar] [CrossRef]
- Fan, X.; Qin, Y.Y.; Gao, X. Interpretation of the main conclusions and suggestions of IPCC AR6 working group I report. Environ. Prot. 2021, 49, 44–48. (In Chinese) [Google Scholar] [CrossRef]
- Li, X.; Wang, N.; Wu, Z. Terrain effects on regional precipitation in a warm season over Qinling-Daba mountains in central China. Atmosphere 2021, 12, 1685. [Google Scholar] [CrossRef]
- Yang, F.M.; Wang, N.; Shi, F.; Ljungqvist, F.C.; Wang, S.; Fan, Z. Multi-proxy temperature reconstruction from the West Qinling Mountains, China, for the past 500 years. PLoS ONE 2013, 8, e57638. [Google Scholar] [CrossRef] [PubMed] [Green Version]
- Yang, F.M.; Wang, N.; Shi, F.; Fredrik, C.L.; Zhao, S.; Liu, T. The spatial distribution of precipitation over the West Qinling region, China, AD 1470–2000. Palaeogeogr. Palaeoclimatol. Palaeoecol. 2016, 443, 278–285. [Google Scholar] [CrossRef]
- Deng, C.H.; Bai, H.Y.; Ma, X.P.; Zhao, T.; Gao, S.; Huang, X.Y. Spatiotemporal differences in the climatic growing season in the Qinling Mountains of China under the influence of global warming from 1964 to 2015. Theor. Appl. Climatol. 2019, 138, 1899–1911. [Google Scholar] [CrossRef]
- Liu, K.; Ma, N.X.; Xu, Y.L.; Sun, G.N. Protection and construction of eco-environment in Qinling Mountainous area. Chin. J. Eco. 2004, 23, 157–160. [Google Scholar] [CrossRef]
- Sun, H.; Bai, H.Y.; Zhang, Q.Y.; Ge, X.P.; Zhang, S.H. Responses of vegetation coverage to regional environmental change in the northern and southern Qinling Mountains. Acta Sci. Circumstantiae 2009, 29, 2635–2641. [Google Scholar] [CrossRef]
- Zhou, Q.; Bian, J.J.; Zheng, J.Y. Variation of air temperature and thermal resources in the northern and southern regions of the Qinling Mountains from 1951 to 2009. Acta Geogr. Sin. 2011, 66, 1211–1218. [Google Scholar] [CrossRef]
- Han, X.; Xue, H.; Zhao, C.; Lu, D. The roles of convective and stratiform precipitation in the observed precipitation trends in Northwest China during 1961–2000. Atmos Res. 2016, 169, 139–146. [Google Scholar] [CrossRef]
- Wang, X.; Wang, B.; Xu, X. Effects of large-scale climate anomalieson trends in seasonal precipitation over the Loess Plateau of China from 1961 to 2016. Ecol Indic. 2019, 107, 105643. [Google Scholar] [CrossRef]
- Li, B.; Chen, Y.; Shi, X.; Chen, Z.; Li, W. Temperature and precipitation changes in different environments in the arid region of northwest China. Theor. Appl. Climatol. 2013, 112, 589–596. [Google Scholar] [CrossRef]
- Meng, Q.; Bai, H.Y.; Sarukkalige, R.J.; Fu, G.B.; Jia, W.H.; Zhang, C.H. Annual and seasonal precipitation trends and their attributions in the Qinling Mountains, a climate transitional zone in China. Theor. Appl. Climatol. 2021, 144, 401–413. [Google Scholar] [CrossRef]
- Li, S.; Yang, S.; Liu, X. Spatiotemporal variability of extreme precipitation in north and south of the Qinling-Huaihe region and influencing factors during 1960–2013. Prog. Geogr. 2015, 3, 354–363. [Google Scholar] [CrossRef]
- Shao, Y.; Mu, X.; He, Y.; Sun, W.; Zhao, G.; Gao, P. Spatiotemporal variations of extreme precipitation events at multi-time scales in the Qinling-Daba mountains region, China. Quat. Int. 2019, 525, 89–102. [Google Scholar] [CrossRef]
- Mo, S.G.; Zhang, B.P. Simulation of temperature fields based on DEM in Qinling Mts. Mountain Res. 2007, 25, 406–411. [Google Scholar] [CrossRef]
- Liu, Y.; Liu, N.; Song, H.M.; Cai, Q.F.; Bao, G.; Wang, W.P. Reconstructed mean air temperature from January to July at the divide sampling site in the mid-Qinling Mountains with tree-ring widths. Adv. Clim. Chang. Res. 2009, 5, 260–265. [Google Scholar] [CrossRef]
- Bai, H.Y.; Ma, X.P.; Gao, X.; Hou, Q.L. Variations in January temperature and 0 °C isothermal curve in Qinling Mountains based on DEM. Acta Geogr. Sin. 2012, 11, 1443–1450. [Google Scholar] [CrossRef]
- Bai, J.; Yan, J.P.; Su, K.H. Differential analysis of abrupt climate change between southern and northern Qinling Mountains in the past 50 years. J. Shaanxi Norm. Univ. 2010, 38, 98–105. [Google Scholar] [CrossRef]
- Li, F. Spatial-Temporal Changes and the Causes of Extreme Precipitation Events to the North and South of Qinling Mountain during 1962~2011; Northwest Normal University: Lanzhou, China, 2014. [Google Scholar] [CrossRef]
- Zhang, S.H. Spatial and temporal variation of precipitation in Qinling Mountains in the last 50 years. J. Shangluo Univ. 2014, 28, 62–66. [Google Scholar] [CrossRef]
- Zhang, L.W.; Yan, J.P.; Geng, H.J.; Cao, Y.J. The shifts of annual average temperature and precipitation belts in the south and north region of Qinling Mountains, Shaanxi province. J Shaanxi Norm. Univ. 2011, 39, 81–84. [Google Scholar] [CrossRef]
- Gao, X. Study on Climate Change Trend and Spatial Distribution Characteristics of Qinling-Daba Mountains in Recent 50 Years; Northwest University: Xi’an, China, 2011; Available online: https://kns.cnki.net/kcms2/article/abstract?v=3uoqIhG8C475KOm_zrgu4lQARvep2SAkhskYGsHyiXksOA0FurgRFfHae_iXgbL9XHTnulT3WpybW6AjUBv9dOj-Y2ZAJvPY&uniplatform=NZKPT (accessed on 1 September 2021).
- Song, T.X.; Yan, J.P.; Ma, L. Study on Climatic Differentiation in the South and North Qinling Mountains in Recent 50 Years. Arid. Zone Res. 2011, 28, 492–498. [Google Scholar] [CrossRef]
- Zhang, Y.; Bai, H.Y.; Huang, X.Y.; Su, K. Variation of extreme temperature and its impact on regional warming in Qinling Mountains during recent 55 a. Mt. Res. 2018, 36, 23–33. [Google Scholar] [CrossRef]
- Zhai, D.P.; Bai, H.Y.; Qin, J.; Deng, C.H.; Liu, R.J.; He, H. Temporal and spatial variability of air temperature lapse rates in Mt. Taibai, Central Qinling Mountains. Acta Geogr. Sin. 2016, 71, 1587–1595. [Google Scholar] [CrossRef]
- Wang, T.; Yang, M.H.; Yan, S.J.; Geng, G.P.; Li, Q.H.; Wang, F. Effects of temperature and precipitation on spatiotemporal variations of net primary productivity in the Qinling Mountains, China. Pol. J. Environ. Stud. 2021, 30, 409–422. [Google Scholar] [CrossRef]
- Wang, T. Analysis of the influence factors of topography on regional precipitation supported by GIS- A case study of Tianshui City, Gansu Province. Gansu Sci. Technol. 2012, 28, 58–61. [Google Scholar] [CrossRef]
- Mann, H.B. Nonparametric tests against trend. Econometrica 1945, 13, 245–259. [Google Scholar] [CrossRef]
- Kendall, M.G. Rank correlation methods. Br. J. Psychol. 1990, 25, 86–91. [Google Scholar] [CrossRef]
- Du, R.S.; Shang, F.H.; Ma, N. Automatic mutation feature identification from well logging curves based on sliding t test algorithm. Clust Comput. 2019, 22 (Suppl. 6), 14193–14200. [Google Scholar] [CrossRef]
- Dogan, M.; Ulke, A.; Cigizoglu, H.K. Trend direction changes of Turkish temperature series in the first half of 1990s. Theor. Appl. Climatol. 2015, 121, 23–39. [Google Scholar] [CrossRef]
- Zhang, Q.; Liu, C.L.; Xu, C.Y. Observed trends of annual maximum water level and streamflow during past 130 years in the Yangtze River basin, China. J. Hydrol. 2006, 324, 255–265. [Google Scholar] [CrossRef]
- Song, X.Y.; Song, S.B.; Sun, W.Y. Recent changes in extreme precipitation and drought over the Songhua River Basin, China, during 1960–2013. Atmos. Res. 2015, 157, 137–152. [Google Scholar] [CrossRef]
- Wei, F.F. Modern Climate Statistical Diagnosis and Prediction Techniques; China Meteorological Press: Beijing, China, 2007; ISBN 9787502942991. [Google Scholar]
- Matheron, G. Principles of geostatistics. Econ. Geol. 1963, 58, 1246–1266. [Google Scholar] [CrossRef]
- Zhang, J.; Yu, X.L. Analysis of land use change and its influence on runoff in the Puhe River Basin. Environ. Sci. Pollut. Res. 2021, 28, 40116–40125. [Google Scholar] [CrossRef]
- Tang, G.A.; Yang, X. Experimental Course of Spatial Analysis of Geographic Information System; Science Press: Beijing, China, 2006; ISBN 9787030338969. [Google Scholar]
- Olivwe, M.A.; Webster, R. Kriging: A method of interpolation for geographical information systems. Int. J. Geogr. Inf. Sci. 1990, 4, 313–332. [Google Scholar] [CrossRef]
- Shi, Z.; Jin, H.M.; Li, Y.; Li, H.Y. Development and Application of Soft Package for Geostatistics. J. Soil Water Conserv. 2005, 19, 170–173. [Google Scholar] [CrossRef]
- Li, X.J.; Li, C.K.; Yin, Z.H. ArcGIS based kriging interpolation and its application. Bull. Surv. Mapp. 2013, 9, 87–90. Available online: http://tb.chinasmp.com/CN/Y2013/V0/I9/87 (accessed on 1 September 2021).
- Kang, L.W. Spatial and Temporal Distribution of Rainstorm and Risk Assessment of Rainstorm Disasters in North and South Qinling Mountains of Shaanxi Province; Shaanxi Normal University: Xi’an, China, 2014; Available online: http://cdmd.cnki.com.cn/article/cdmd-10718-1014403027.htm (accessed on 1 September 2021).
- Pan, G.Y.; Cao, X.Y.; Zhang, X.; Tao, S.Y. Spatial and temporal characteristics of extreme precipitation in Ganjiang River Basin in the past 50 years. Torrential Rain Disasters 2020, 39, 102–108. [Google Scholar] [CrossRef]
- Tang, T.; Jin, R.H.; Peng, X.Y.; Niu, R.Y. The Analysis of Causes about Extremely High Temperature in the summer of 2013 Year in the Southern Region. J. Chengdu Univ. Inf. Technol. 2014, 29, 652–659. [Google Scholar] [CrossRef]
- Yan, J.P.; Huang, C.C. Statistical analysis on influence of ENSO event on the climate in Shaanxi. J. Catastrophology 1998, 4, 39–42. [Google Scholar]
- Liu, M.X. The Characteristics and Atmospheric Circulation Causes of Two Types of Extreme Cold Events in China; Lanzhou University: Lanzhou, China, 2021. [Google Scholar] [CrossRef]
- Li, D.; Gu, W. Analysis of characteristics and causes of precipitation anomalies over northern China in autumn 2021. Meteor Mon. 2022, 48, 494–503. (In Chinese) [Google Scholar] [CrossRef]
- Hou, M.Q.; Fang, J.G.; Bai, A.J. Analysis of the weather and circulation characteristics of high temperature and drought in summer of 1997. J. Shaanxi Meteorol. 1999, 1, 4–7. Available online: http://www.cnki.com.cn/Article/CJFDTotal-SXQI901.001.htm (accessed on 1 September 2021).
- Meng, Q.; Gao, X.; Bai, H.Y.; Zhang, Y.; Wang, H.Y. Temporal and spatial varirtions and trends of extreme precipitation in Qinling Mountains during the period 1960-2015. Res. Soc. Water Conserv. 2019, 26, 171–183. [Google Scholar] [CrossRef]
- Du, J.Y.; Tao, L.; Xu, C.Y. Interdecadal variation of land precipitation in China and relative contributions of global warming, IPO and AMO. Acta Meteorol. Sin. 2022, 80, 685–700. [Google Scholar] [CrossRef]
- Zhao, P.; Zhu, Y.N.; Zhang, R.H. An Asian-Pacific teleconnection in summer tropospheric temperature and associated Asian climate variability. Clim Dynam. 2007, 29, 293–303. [Google Scholar] [CrossRef]
- Qi, Y.D. Analysis of Temperature Change Trend and Its Urbanization and Sea-Atmosphere Impact Factors; Wuhan University: Wuhan, China, 2020. [Google Scholar] [CrossRef]
- Li, S.; Wang, Y.M.; Gao, Y.Q. A review of researches on the Atlantic Multidecadal Oscillation (AMO). Trans. Atmos. Sci. 2009, 32, 458–465. [Google Scholar] [CrossRef]
- Zuo, Z.Y.; Zhang, R.H.; Wu, B.Y. Interdecadal variation of spring precipitation over southern China and its association with snow cover over Eurasia from 1979 to 2004. Sci. Sin. 2011, 41, 134–142. [Google Scholar] [CrossRef]
- Zhao, H.Y.; Yang, Y.F.; Guo, J.Q.; Wang, X.; Zhao, Q.Y. Effect of Abnormal East Asia North Wind on Spring Precipitation in the Eastern Region of Northwest China. Arid. Zone Res. 2013, 30, 457–461. [Google Scholar] [CrossRef]
- Gu, W.; Li Wj Chen, L.J.; Jia, X.L. Interannual variations of autumn precipitation in China and their relations to the distribution of tropical Pacific sea surface temperature. Clim. Environ. Res. 2011, 17, 467–480. [Google Scholar] [CrossRef]
- Yang, J.H.; Zhang, Q.; Liu, X.Y.; Yue, P.; Shang, J.L.; Ling, H.; Li, W.J. Spatial-temporal characteristics and causes of summer precipitation anomalies in the transitional zone of typical summer monsoon, China. Chin. J. Geophys. 2019, 62, 4120–4128. [Google Scholar] [CrossRef]
- Mu, X.M.; Chen, G.L.; Xu, X.X. Analysis on the relationship between precipitation and geographical factors in Loess Plateau. Res. Soil Water Conserv. 1992, 16, 80–86. Available online: http://stbcyj.paperonce.org/oa/DArticle.aspx?type=view&id=19920210 (accessed on 1 June 2022).
- Li, C.; Zhang, H.; Singh, V.P.; Fan, J.; Wei, X.; Yang, J.T.; Wei, X.C. Investigating variations of precipitation concentration in the transitional zone between Qinling Mountains and Loess Plateau in China: Implications for regional impacts of AO and WPSH. PLoS ONE 2020, 15, e0238709. [Google Scholar] [CrossRef] [PubMed]
- Li, S.S.; Lu, J.Y.; Yan, J.P.; Liu, X.F.; Kong, F.; Wang, J. Spatiotemporal variability of temperature in northern and southern Qinling Mountains and its influence on climatic boundary. Acta Geogr. Sin. 2018, 73, 13–24. [Google Scholar] [CrossRef]
- Dong, D.H.; Huang, G. Relationship between Altitude and Variation Characteristics of the Maximum Temperature, Minimum Temperature, and Diurnal Temperature Range in China. Chin. J. Atmos. Sci. 2015, 39, 1011–1024. [Google Scholar] [CrossRef]
- Schulze, H.; Langenberg, H. Climate science: Urban heat. Nat. Geosci. 2014, 7, 553. [Google Scholar] [CrossRef]
- Dong, Q.Q.; Wang, H.X. Variation and reason analysis of temperature and precipitation of Weihe River in Guanzhong area in the last 60 years. South--North Water Transf. Water Sci. Technol. 2016, 14, 33–38. [Google Scholar] [CrossRef]
- Li, M.J. Analysis of Multi-Scale Spatial-Temporal Variability of Precipitation and Causes of Regional Drought and Flood in China; University of Chinese Academy of Sciences: Beijing, China, 2021; Available online: https://d.wanfangdata.com.cn/thesis/Y3864553 (accessed on 1 June 2022).
- Qiu, Y.H. A Dissertation Submitted in Partial Fulfillment of The Requirements for the Degree of Master of Science; Nanjing Normal University: Nanjing, China, 2019; Available online: https://mall.cnki.net/magazine/Article/CMFD/1019250006.htm (accessed on 1 June 2022).
- Huang, M.D.; Zhang, P. Influences of geographic and topographic factors on spatial distribution of precipitation in Urumchi. Meteorol. Sci. Technol. 2009, 37, 25–28. [Google Scholar] [CrossRef]
- Bi, X. Analysis on Climate Change Characteristics of Temperature and Precipitation and the Correlation Analysis with Geographical Factors in Hubei Province; Central China Normal University: Wuhan, China, 2013. [Google Scholar] [CrossRef]
- Wang, P.; Tang, G.; Cao, L.; Liu, Q.; Ren, Y. Surface air temperature variability and its relationship with altitude & latitude over the Tibetan Plateau in 1981ߣ2010. Adv. Clim. Change Res. 2012, 8, 313–319. [Google Scholar] [CrossRef]
- Huang, X.C.; Wang, X.F.; Kang, L.W.; Wang, S. Temporal and spatial distribution characters of torrential rain in Qinling Area of Shaanxi Province. Acta Agric. Jiangxi. 2016, 28, 103–108. [Google Scholar] [CrossRef]
- Su, J.Z.; Wen, M.; Ding, Y.H.; Gao, Y.Q.; Song, Y.F. Hiatus of global warming: A review. Chin. J. Atmos. Sci. 2016, 40, 1143–1153. [Google Scholar] [CrossRef]


| Variable | 1960s | 1970s | 1980s | 1990s | 2000s | 2010s |
|---|---|---|---|---|---|---|
| AMT (°C) | 12.8 | 13.0 | 12.7 | 13.3 | 13.6 | 13.8 |
| AMT anomaly (°C) | −0.4 | −0.2 | −0.5 | 0.1 | 0.4 | 0.6 |
| Period (Years) | LR (mm) | MR (mm) | HR (mm) | TR (mm) | DR (mm) |
|---|---|---|---|---|---|
| 1961–2021 | 218.9 | 254.3 | 196.2 | 116.9 | 125.4 |
| Variable | 1960s | 1970s | 1980s | 1990s | 2000s | 2010s |
|---|---|---|---|---|---|---|
| AMRA (mm) | 941.9 | 885.8 | 965.5 | 835.4 | 898.4 | 943.9 |
| AMRA anomaly (mm) | 30.1 | −26.0 | 53.7 | −76.4 | −13.5 | 32.1 |
| LR (mm) | 236.0 | 219.3 | 227.7 | 203.2 | 214.6 | 212.8 |
| LR anomaly (mm) | 17.1 | 0.4 | 8.8 | −15.7 | −4.4 | −6.2 |
| MR (mm) | 279.7 | 246.4 | 266.3 | 233.4 | 240.7 | 259.5 |
| MR anomaly (mm) | 25.5 | −7.9 | 12.1 | −20.8 | −14.2 | 5.3 |
| HR (mm) | 195.3 | 180.1 | 219.8 | 167.5 | 199.1 | 215.5 |
| HR anomaly (mm) | −0.9 | −16.1 | 23.6 | −28.7 | 2.9 | 19.2 |
| TR (mm) | 111.6 | 112.4 | 131.1 | 109.3 | 112.2 | 125.0 |
| TR anomaly (mm) | −5.3 | −4.5 | 14.1 | −7.7 | −4.7 | 8.1 |
| DR (mm) | 119.3 | 127.6 | 120.6 | 122.0 | 131.8 | 131.1 |
| DR anomaly (mm) | −6.1 | 2.2 | −4.8 | −3.4 | 6.4 | 5.7 |
| Variable | Spring | Summer | Autumn | Winter |
|---|---|---|---|---|
| AMT (°C) | 13.8 | 23.9 | 13.2 | 2.0 |
| Tendency rate (°C/10a) | 0.33 *** | 0.07 | 0.20 ** | 0.28 ** |
| AMRA (mm) | 240.0 | 512.9 | 401.0 | 34.8 |
| Tendency rate (mm/10a) | −6.35 | 8.14 | −1.10 | 0.66 |
| LR (mm) | 61.2 | 68.9 | 69.0 | 20.3 |
| LR tendency rate (mm/10a) | −1.77 | −1.53 | −1.46 | 0.06 |
| MR (mm) | 66.1 | 107.0 | 80.3 | 14.5 |
| MR tendency rate (mm/10a) | −3.36 | 2.06 | −2.78 | 0.10 |
| HR (mm) | 48.6 | 113.5 | 70.6 | -- |
| HR tendency rate (mm/10a) | −0.83 | 3.03 | 0.33 | -- |
| TR (mm) | 64.1 | 98.8 | 72.9 | -- |
| TR tendency rate (mm/10a) | −0.36 | 2.06 | 0.41 | -- |
| DR (mm) | -- | 124.7 | 108.1 | -- |
| DR tendency rate (mm/10a) | -- | 1.16 | -- | -- |
| Elevation (m) | Longitude (°E) | Latitude (°N) | |
|---|---|---|---|
| AMT (°C) | −0.700 *** | 0.147 *** | −0.617 *** |
| AMRA (mm) | 0.142 *** | −0.233 *** | −0.868 *** |
Disclaimer/Publisher’s Note: The statements, opinions and data contained in all publications are solely those of the individual author(s) and contributor(s) and not of MDPI and/or the editor(s). MDPI and/or the editor(s) disclaim responsibility for any injury to people or property resulting from any ideas, methods, instructions or products referred to in the content. |
© 2023 by the authors. Licensee MDPI, Basel, Switzerland. This article is an open access article distributed under the terms and conditions of the Creative Commons Attribution (CC BY) license (https://creativecommons.org/licenses/by/4.0/).
Share and Cite
Lei, Y.; Liao, R.; Su, Y.; Zhang, X.; Liu, D.; Zhang, L. Variation Characteristics of Temperature and Rainfall and Their Relationship with Geographical Factors in the Qinling Mountains. Atmosphere 2023, 14, 696. https://doi.org/10.3390/atmos14040696
Lei Y, Liao R, Su Y, Zhang X, Liu D, Zhang L. Variation Characteristics of Temperature and Rainfall and Their Relationship with Geographical Factors in the Qinling Mountains. Atmosphere. 2023; 14(4):696. https://doi.org/10.3390/atmos14040696
Chicago/Turabian StyleLei, Yangna, Rongwei Liao, Yumeng Su, Xia Zhang, Duanyang Liu, and Lei Zhang. 2023. "Variation Characteristics of Temperature and Rainfall and Their Relationship with Geographical Factors in the Qinling Mountains" Atmosphere 14, no. 4: 696. https://doi.org/10.3390/atmos14040696