

Study of the Freeze–Thaw Weathering’s Influence on Thermal Properties of Stone Artifacts
by
 ,
,
Jia’nan Zhang
1, 
Xue Yang
2,*,
Beichen Chen
1,*,
Xiangyu Wang
2,
Gangbo Hu
2,
Ning Tao
2 and
Jiangang Sun
2 1
School of History, Capital Normal University, Beijing 100089, China
2
Key Laboratory of Terahertz Optoelectronics, Ministry of Education, Beijing Advanced Innovation Center for Imaging Theory and Technology, Department of Physics, Capital Normal University, Beijing 100048, China
*
Authors to whom correspondence should be addressed.
Atmosphere 2023, 14(4), 666; https://doi.org/10.3390/atmos14040666
Submission received: 16 February 2023
/
Revised: 24 March 2023
/
Accepted: 29 March 2023
/
Published: 31 March 2023
(This article belongs to the Special Issue Advances in Preservation Environment for Protection of Cultural Heritage Artefacts)
Abstract
:A study of the weathering process of three types of stones, sandstone, marble, and granite, which are commonly found in artifacts worldwide, is presented. Freeze–thaw cycles are used to accelerate changes in the stone’s physical properties, such as the surface morphology, mass, and porosity. Pulsed infrared thermography, as an in situ non-destructive testing method, is adopted to measure the stone’s thermal properties, such as the diffusivity, effusivity, and conductivity. These thermal parameters influence the natural weathering process, and in turn can change with the decay of the stone materials. Preliminary experimental results show that all three types of stone experience a process of mass loss and porosity increase after the freeze–thaw cycles, and their thermal properties change differently depending on their types. Since the thermal effusivity can be obtained non-destructively by reflectance thermography, we propose for the first time the use of thermal effusivity to characterize the influence of the weathering process and as an indicator of the aging degree of stone artifacts.
1. Introduction
Stone artifacts are not as strong as they may seem. Wetting–drying, microorganisms, heating, freezing–thawing, salt crystallization, and many other weathering factors cause exfoliation, bio-weathering deterioration, cracking, erosion, and mass loss in them. [1,2,3] The influence of weathering on stone buildings had been noticed no later than the 5th century BC, when Herodotus indicated that the pyramids were corroded by salt on the surface [4]. More recently, many studies of stone heritage preservation report the influence of weathering on stone materials all over the world. For example, the sandstone blocks of the Chengde Mountain Resort in Hebei (China) have suffered from scaling and disintegration due to weathering; [5] the sandstone constructions of the Church of San Mateo in Tarifa, Cádiz (Spain) have undergone hydric expansion and deterioration; [6] limestone houses and walls in Jerusalem (Israel) have suffered from dissolution due to the growing of endogenous lichen; [7] and the building stones of Anahita Temple (Iran) have experienced severe weather damage due to long-term freezing–thawing and salt crystallization processes [8].
Aging mechanisms of different types of stones have been discussed through a variety of artificial weathering experiments, in which researchers simulate and accelerate natural weathering processes by controlling specific factors such as the temperature of heating, [9] the number of freeze–thaw cycles, [10] and the type and concentration of salt and chemical contaminants [11]. Close attention has been paid to the alteration of petrophysical and mechanical properties between untreated and weathered stones, such as their static elastic modulus, compressive strength, and tensile strength [12]. However, a large number of stone artifacts are exposed to dramatic temperature changes, and in the ageing process, thermal properties play a complicated role, because they influence the natural weathering but also change as the stone material decays. This two-way process, however, has not been properly addressed in previous studies.
Typically, outdoor stone artifacts age slowly and unnoticeably. When damage becomes apparent, the strength of the artifacts has already declined significantly and irreversibly. Therefore, health condition monitoring methods are urgently needed. In previous studies, many methods have been applied to characterize the stones’ properties, but those based on taking samples for characterization are considered destructive and are thus not allowed to be applied to artifacts of cultural heritage. In recent years, infrared thermography (IRT), as a non-destructive testing method, has been applied in the field of archaeology and cultural heritage conservation on different kinds of art work, such as metal artifacts, [13,14] architectural grottoes, [15] panel paintings, [16] marqueteries, [17] mosaics, [18] and frescos [19]. As for stone artifacts, IRT has been successfully used for evaluation of conservation status and treatments of ancient buildings and cultural heritage monuments [20,21,22,23]. Passive IRT has been applied to monitor water ingress, assess stone cleaning and consolidate treatments through surface temperature mapping. Active IRT has been used to detect subsurface structures and defects, for example, disclosing the original mosaic-tesserae beneath plastered mosaic surfaces. Quantitative IRT measurements of the thermal diffusivity of stone materials have been reported in order to obtain a more accurate mathematical modelling. It has also been mentioned that thermal properties could be good indicators material decay. However, to the best of our knowledge, there is no existing study investigating the correlation between the stone materials’ degradation and their thermal properties yet.
This paper aims to analyze how thermal properties change with aging, and the mechanism behind this change. This study applies freeze–thaw cycles to three types of stones (sandstone, marble, and granite) to simulate and accelerate their aging process. The mass loss, porosity change, and pore size distribution of the samples with different freeze–thaw cycles are evaluated. Pulsed IRT configuration is applied to analysis of the variations in thermal properties (thermal diffusivity, thermal effusivity, and thermal conductivity in particular) [24,25]. The correlation between the freeze–thaw aging process and the thermal properties is analyzed. To obtain the thermal diffusivity and conductivity, a transmission experimental geometry is required, which is difficult to accomplish for in situ measurement. Based on that, we propose, for the first time, to use thermal effusivity obtained from reflectance thermography to characterize the influence of the weathering process and as an indicator of the aging degree of stone artifacts.
2. Materials and Methods
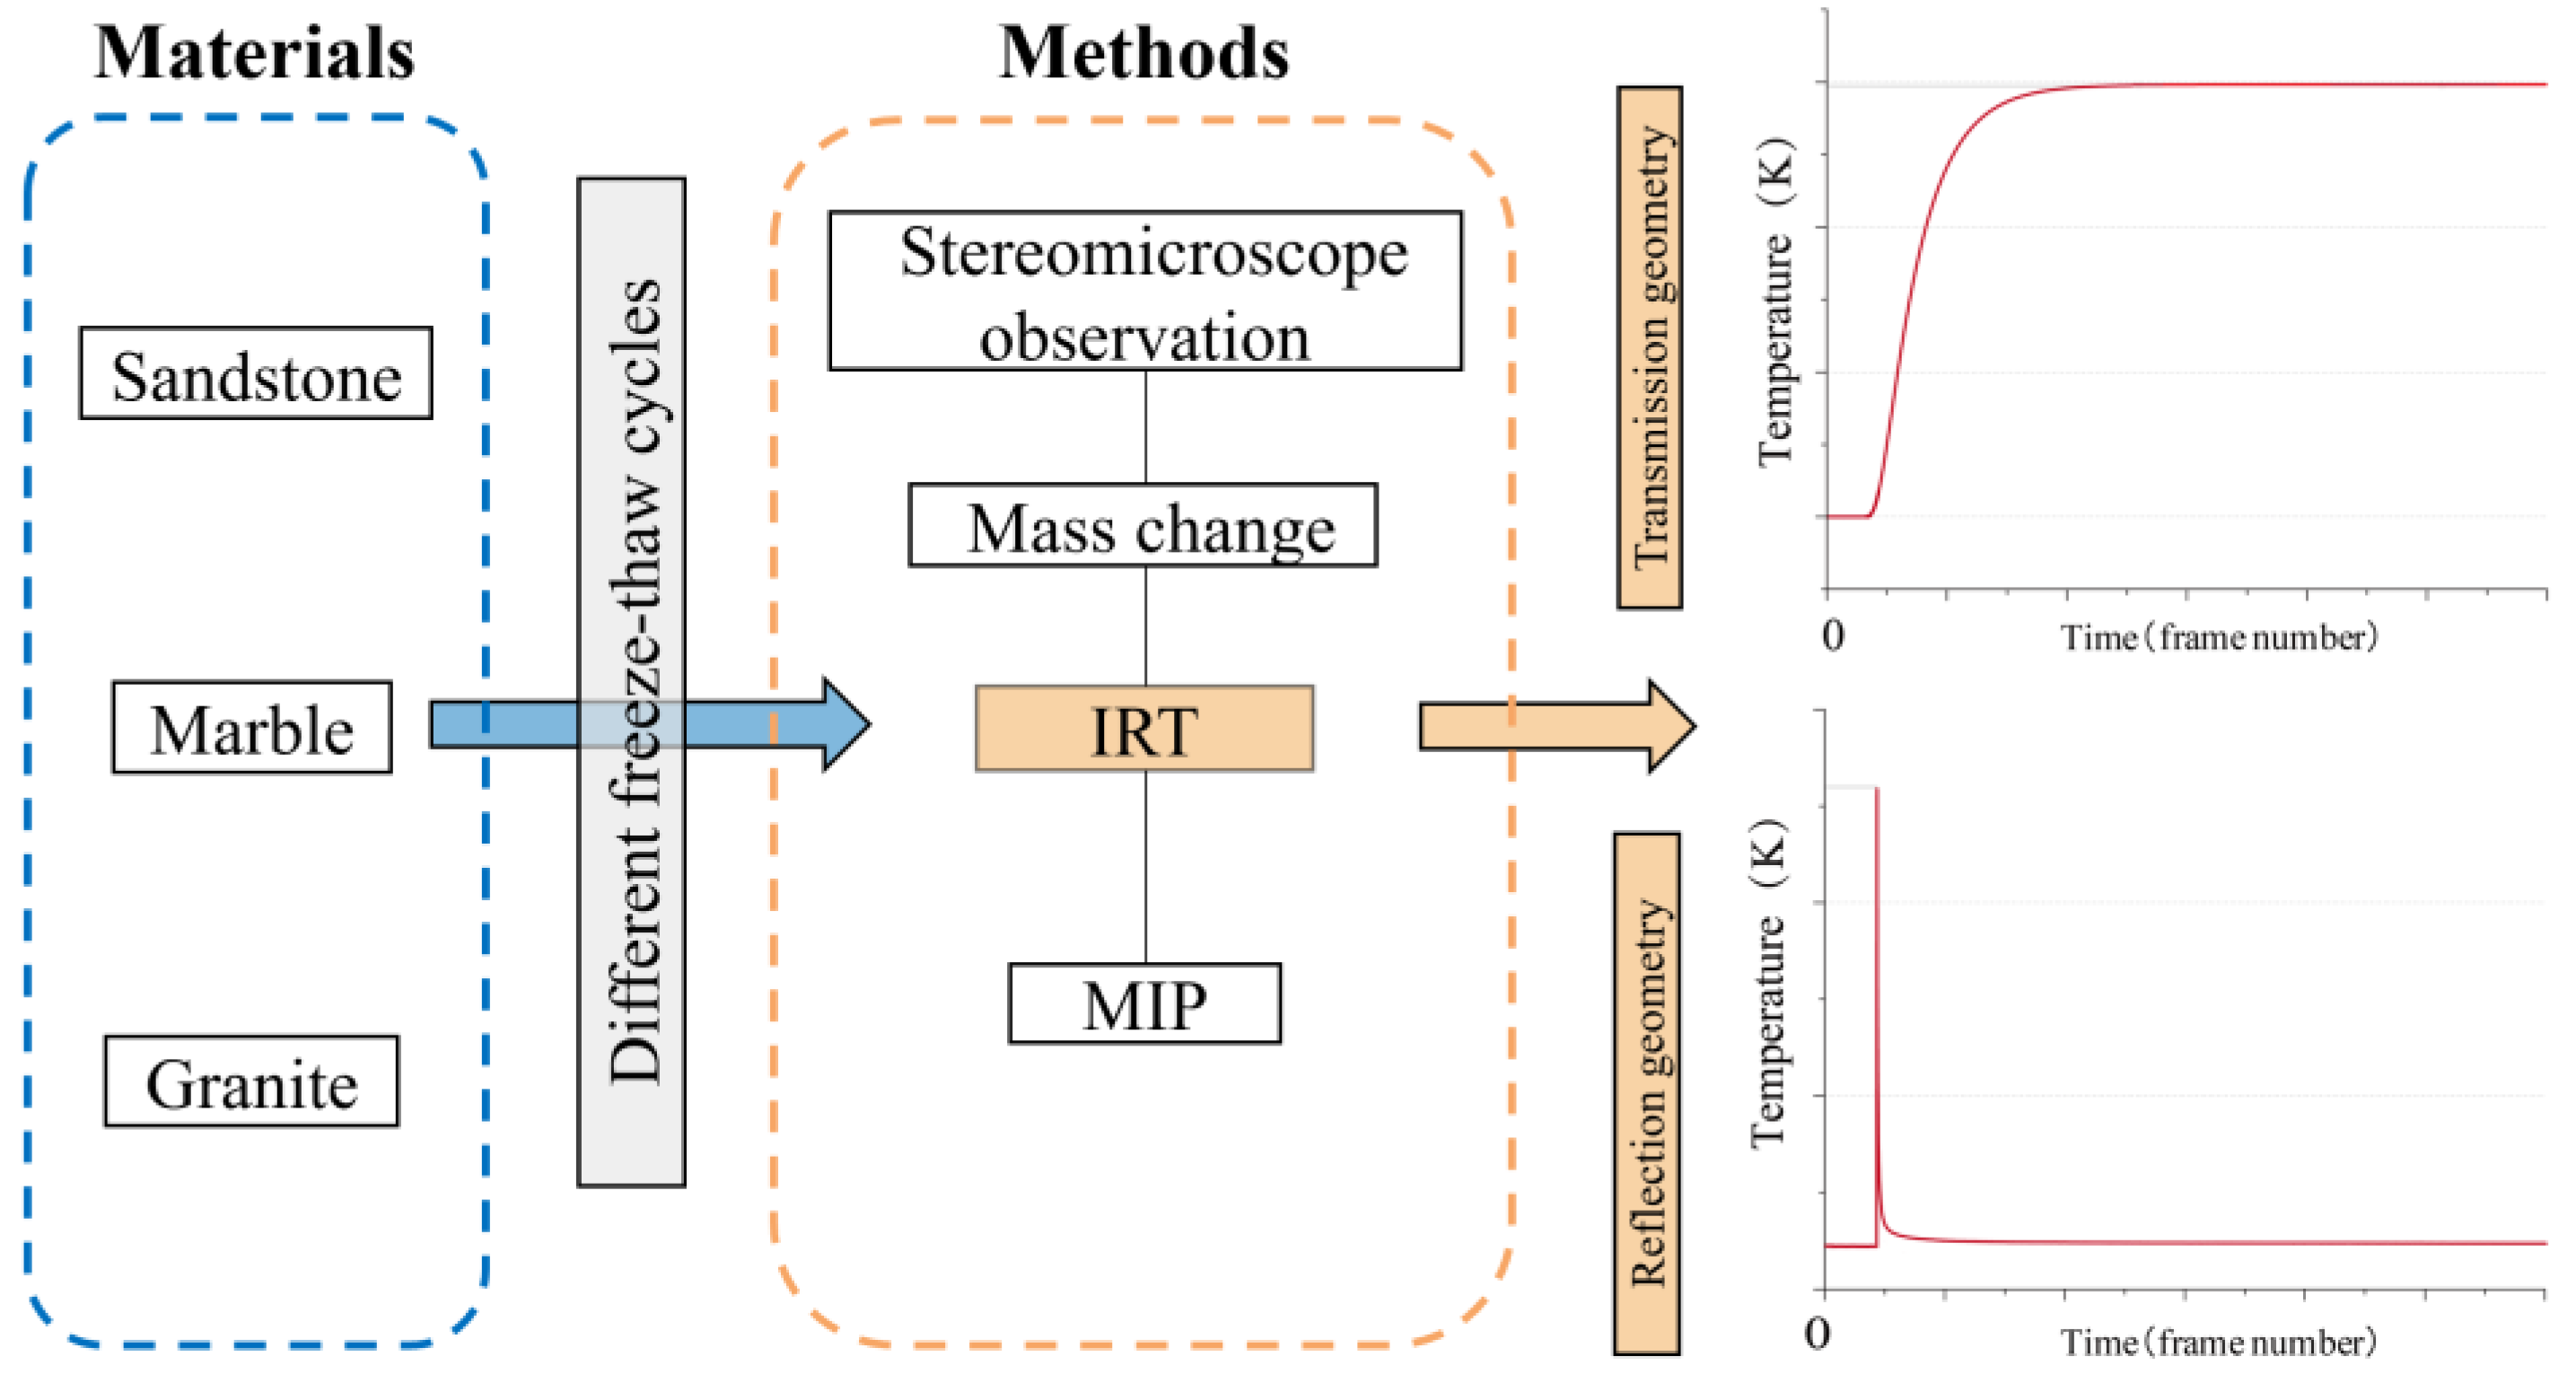
In this section, the research objects (three types of stones) are described, with their distribution and mineral components. Then, the research methods applied in this study are introduced, including freeze–thaw weathering cycles, mercury intrusion porosimetry, and active infrared thermography. Figure 1 explains the research process of the study.
2.1. Material Description
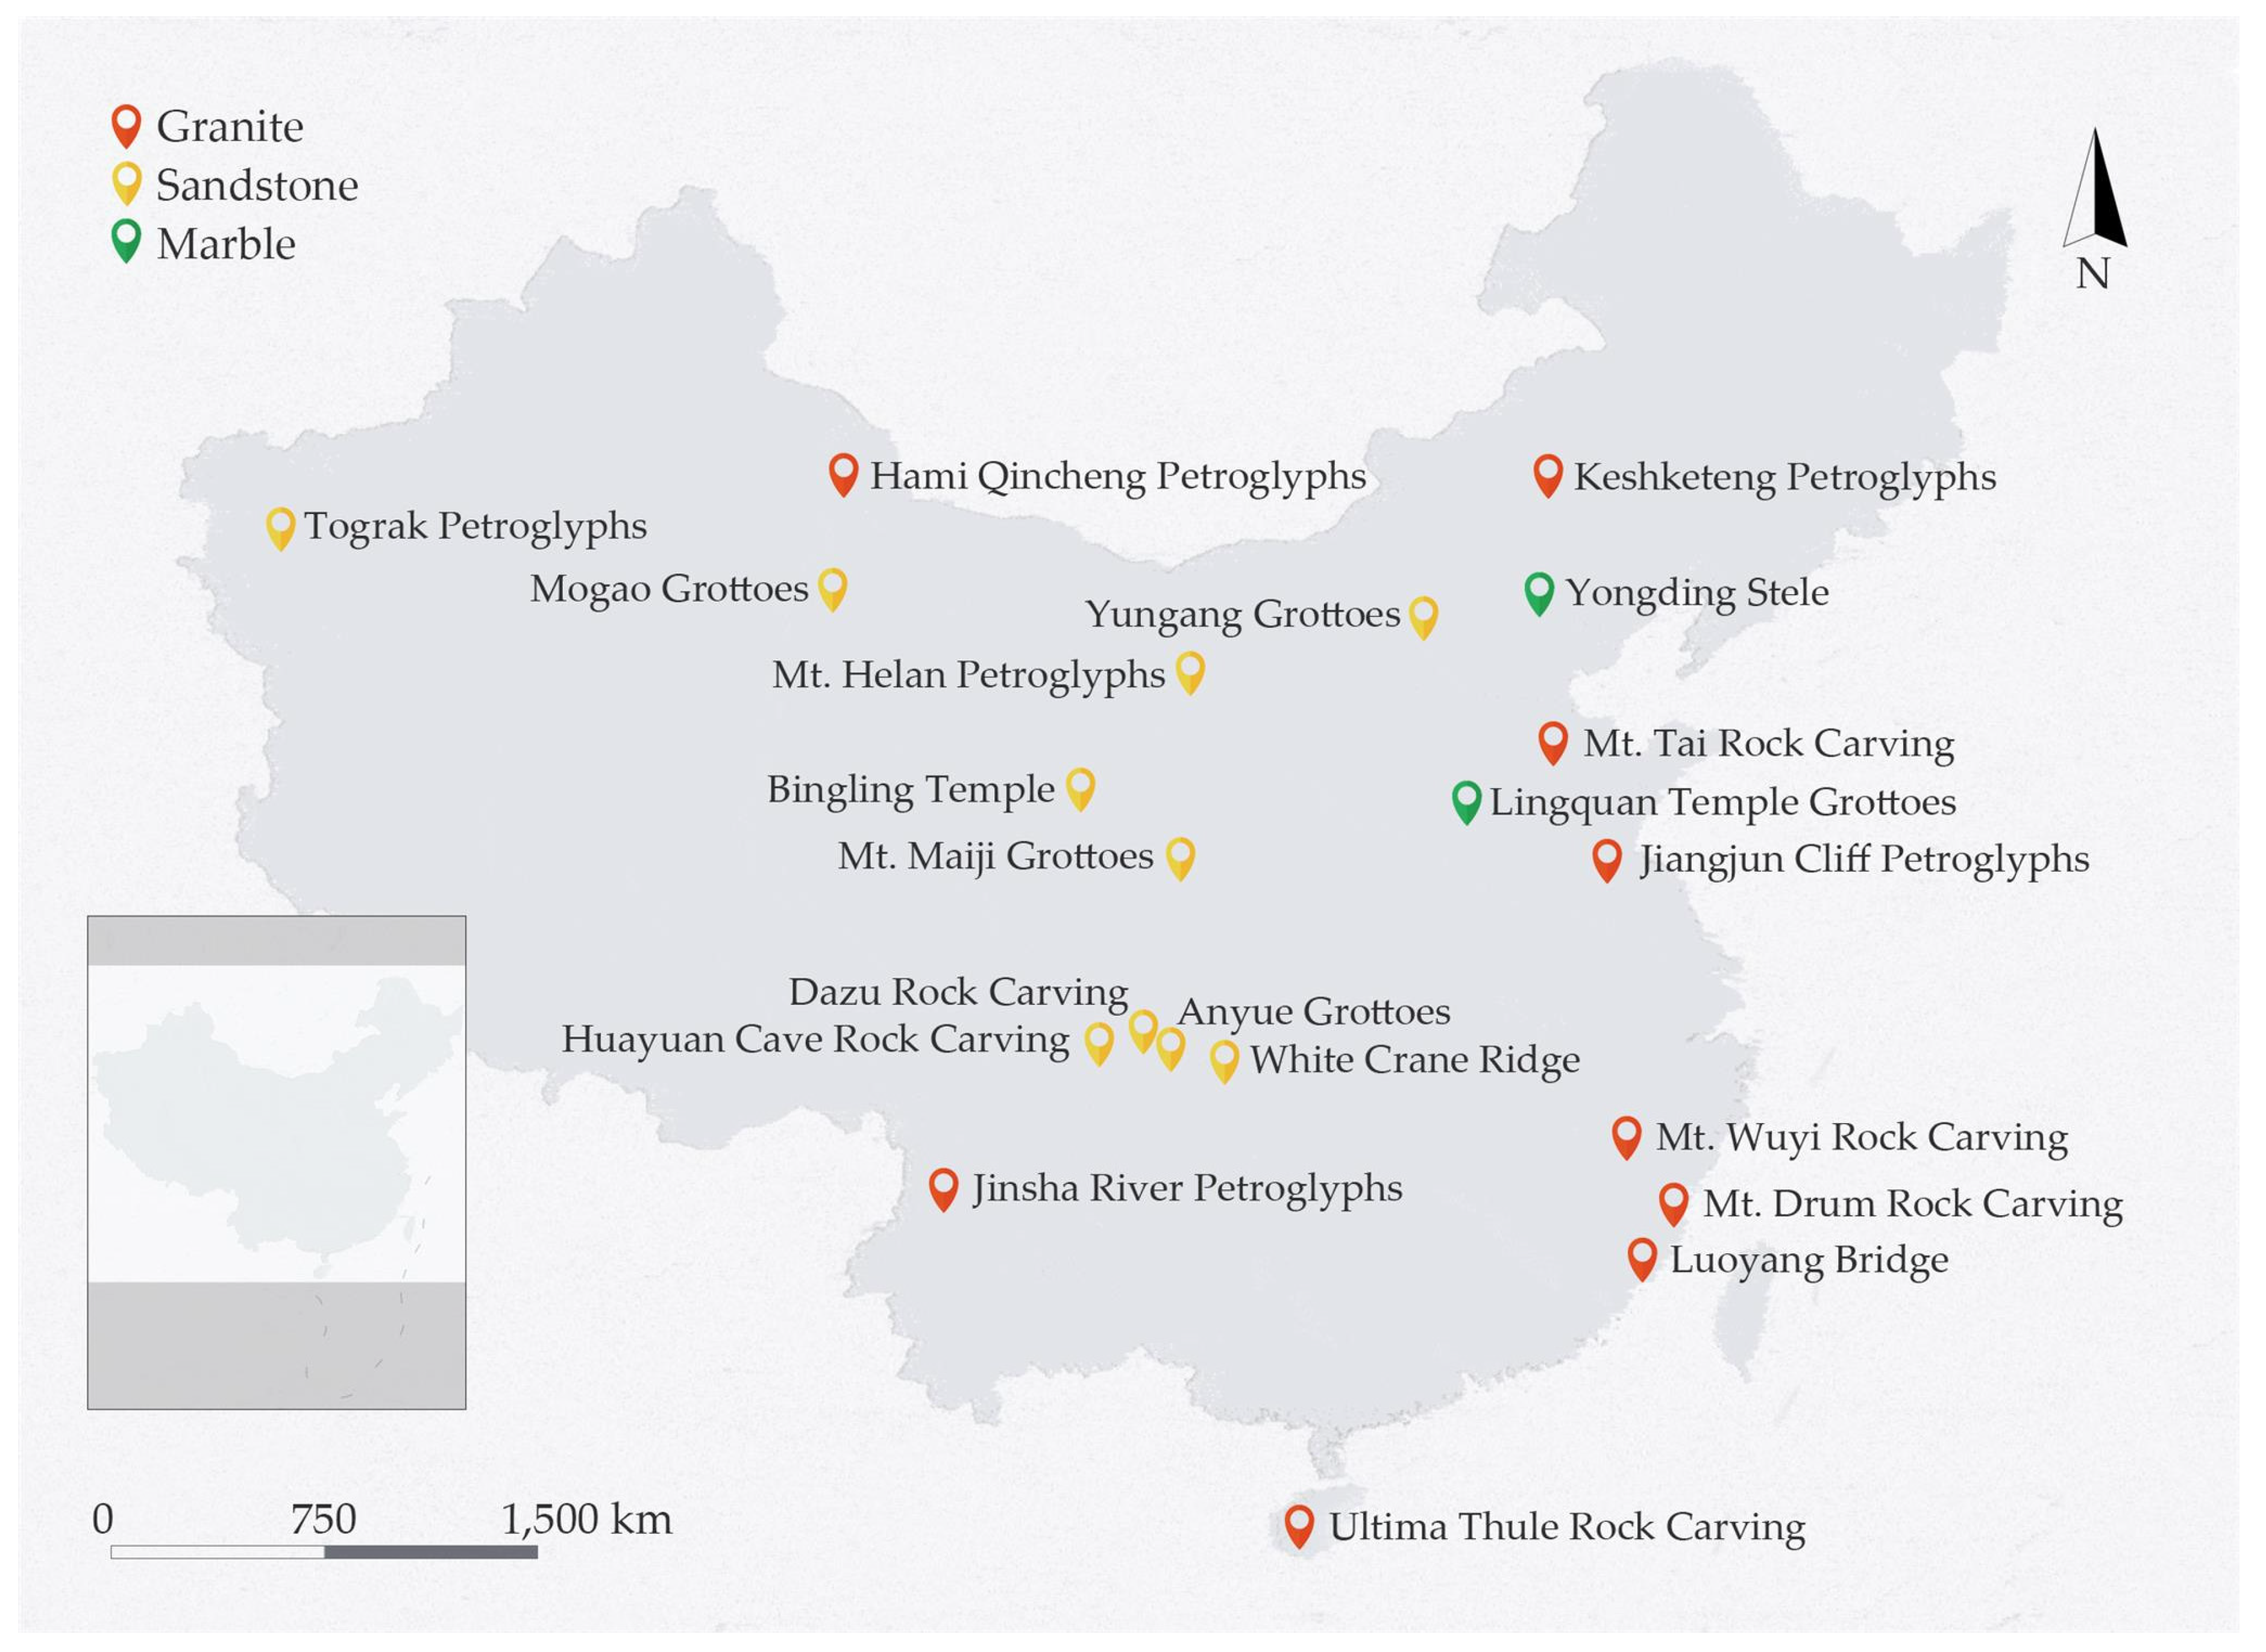
Stone artifacts are widely distributed in China. Many of them are made of sandstone, marble, and granite, representing sedimentary rock, metamorphic rock, and igneous rock, respectively. Figure 2 shows the wide range of geographical distribution and therefore great variety in the environmental conditions of artifacts made of the three stone types in China. The samples used in the current paper were freshly mined in Shandong Province and were without weathering damage; the mineral components were obtained with an Olympus TERRA II Portable XRD Analyzer and are summarized in Table 1.
These three stone materials are defined and described as follows:
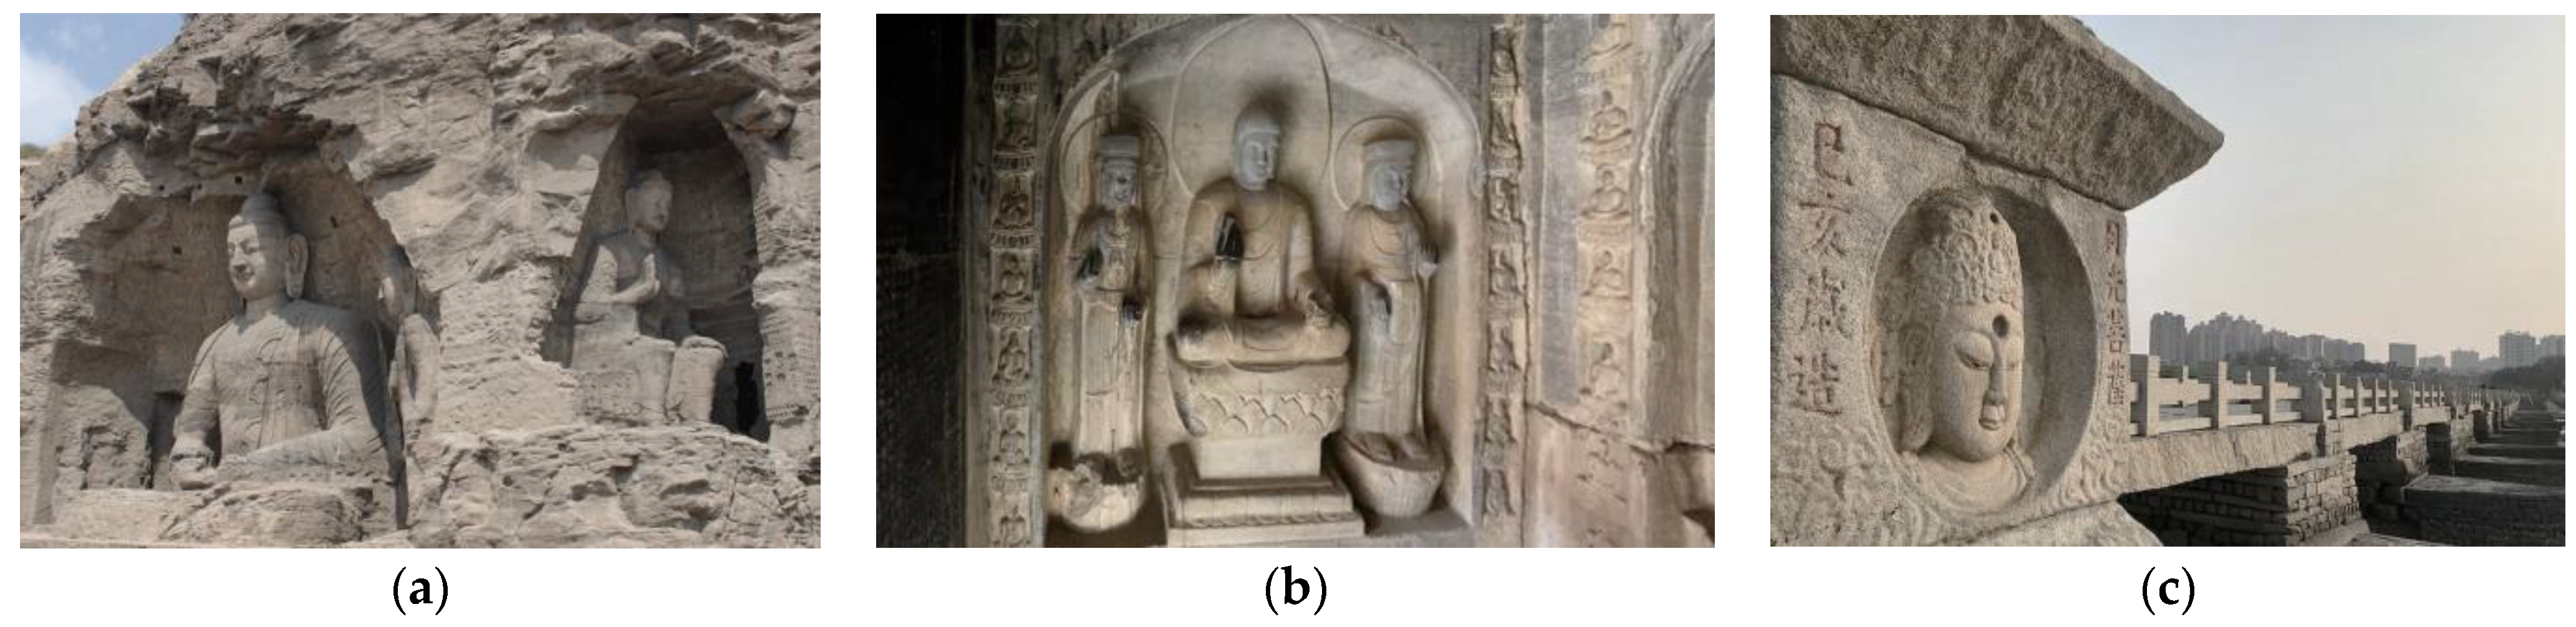
- Sandstone is mainly composed of albite quartz and feldspars, with a small amount of magmatic rocks and metamorphic rocks. It is a common building material worldwide, and has been used to construct important cultural heritage sites such as the Notre Dame Cathedral in Paris (France), and the Colosseum in Rome (Italy). In China, more than 80% of grottoes are dug in sandstone, for example, the Longmen Grottoes in Luoyang; the Mogao Grottoes in Dunhuang; and the Yungang Grottoes in Datong (Figure 3a). In addition to grottoes, ancient stone inscriptions are also found in sandstone.
- Marble is mainly made up of calcite. Thanks to its hard and dense texture, marble is also commonly used in ancient buildings, such as the marble railings in the Forbidden City in Beijing, and the Lingquan Temple Grottoes in Anyang (Figure 3b).
- The granite used in the experiment consists of albite crystals and quartz, which is the most representative stone of magmatic rocks. It is also one of the most popular materials for stone buildings, such as the walls of the Goguryeo tombs excavated in Tonghua, and the Northern Song dynasty bridge/Luoyang Bridge in Quanzhou (Figure 3c).
2.2. Artificial Weathering of Stone by Freeze–Thaw Cycles
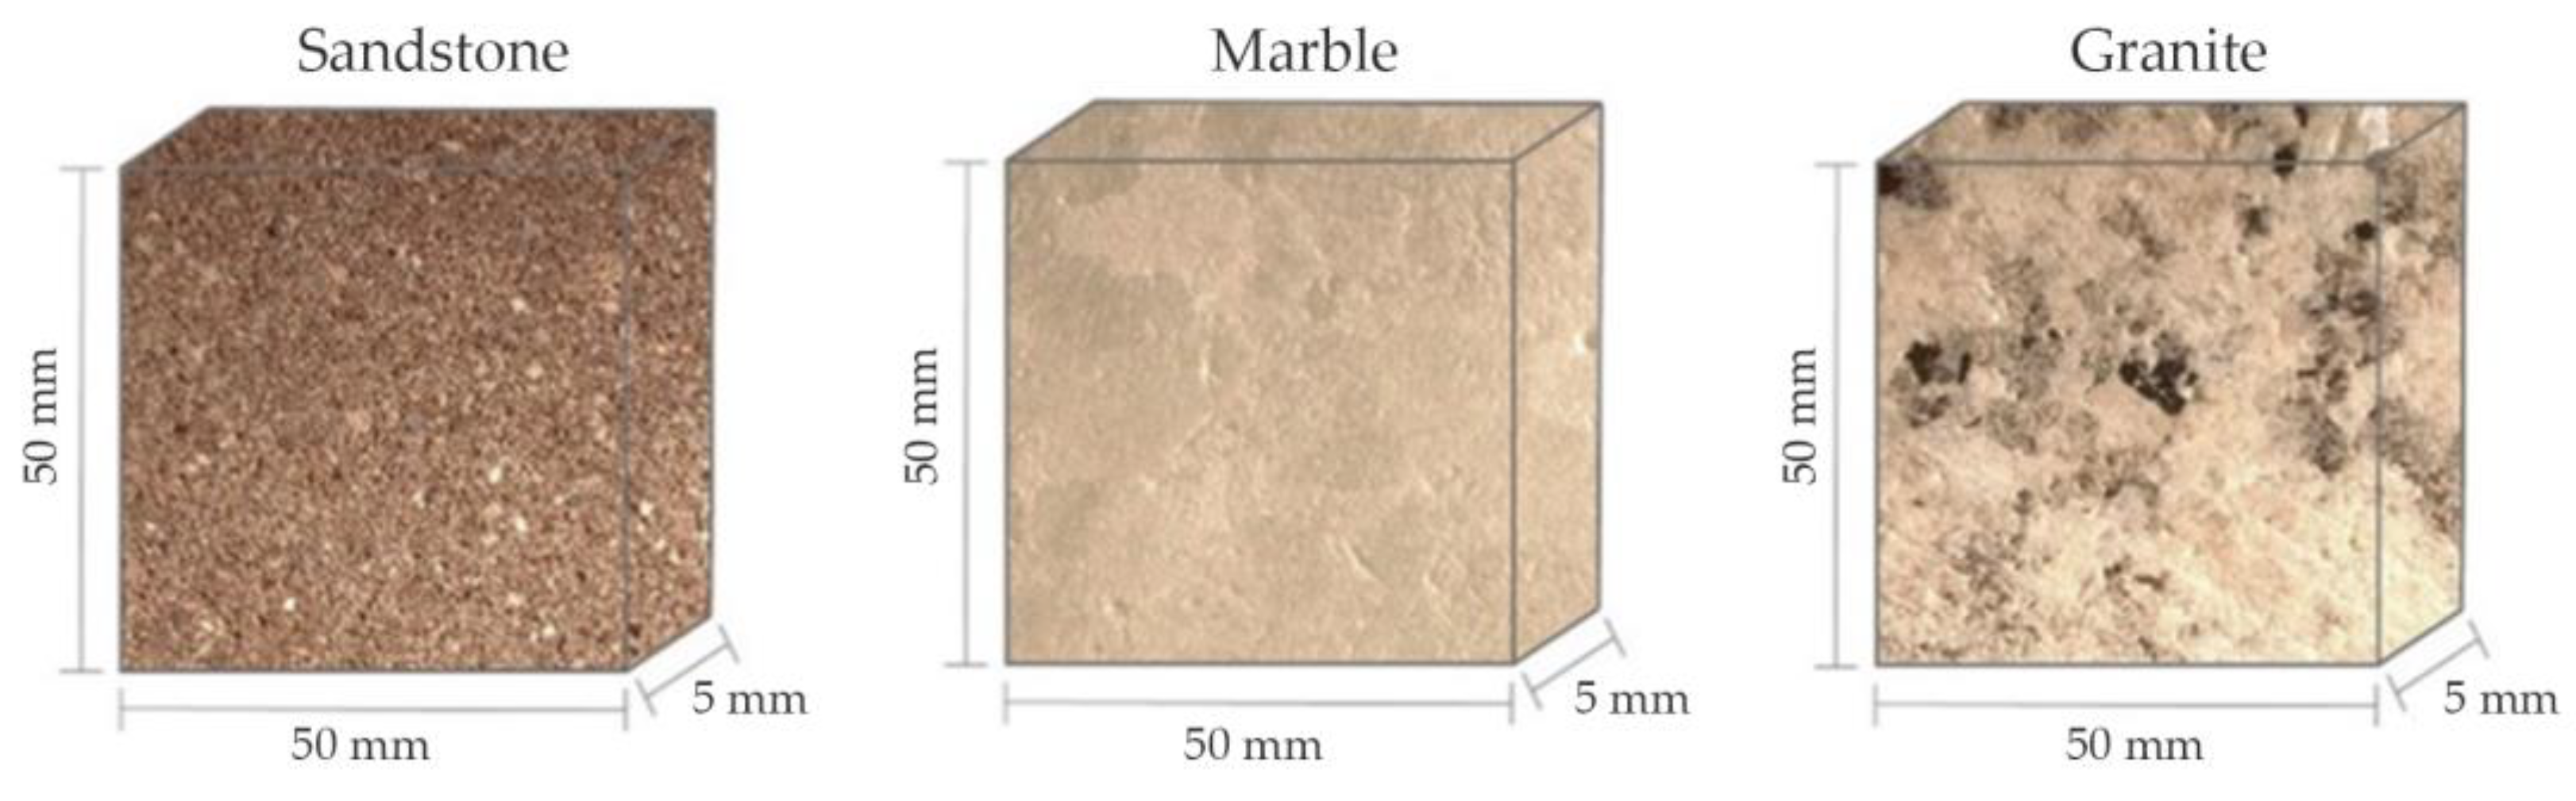
The process of freeze–thaw cycles is widely accepted as a promising method for artificial weathering. In this experiment, all stone samples have been shaped as square pieces (length 50 mm; width 50 mm; height 5 mm, as shown in Figure 4). The freeze–thaw weathering process is conducted according to the following procedures:
- Water saturation: put the dry samples in water at room temperature for 24 h;
- Freezing: freeze the wet samples at −35 °C for 24 h;
- Thawing: soak the frozen samples in water at room temperature for 24 h;
- Drying: place the wet samples in a heating device at 100 °C for one hour, and then keep them at room temperature for 24 h.
During each pass of the four steps, all the samples are weighted after step one for their water-saturated mass, and after step four for the dry mass. After three passes, the readings of the two masses are averaged, and all the samples are tested by active infrared thermography for their thermal properties, which marks the end of a cycle. This procedure is illustrated in Figure 5. When the cycle has been repeated four times, mercury intrusion porosimetry is used to measure the porosity of the samples. The drying process is carried out to accelerate the evaporation of the wet stone samples. It is not guaranteed to remove all the water in the stones.
2.3. Mercury Intrusion Porosimetry
Mercury intrusion porosimetry (MIP) is widely used for characterizing interparticle and intraparticle porosities, pore size distribution, and pore tortuosity in porous materials. In this experiment, MIP (performed by the PoreMaster from Quantachrome Instruments) is carried out to evaluate the modification of the stone samples after different freeze–thaw cycles. At 25 °C and 101 kPa, mercury is in liquid state. When a certain inlet pressure is applied, the liquid mercury is forced into pores after its surface tension is overcome. At each pressure step, the intrusion volume is measured, which equals the accessible pore volume. In the meantime, the inlet pressure can be translated into an equivalent pore radius, following the Washburn equation, to obtain the pore size distribution [26]. Interparticle porosity refers to the proportion of voids between particles to the total particle volume, while the intraparticle porosity refers to the proportion of voids inside the particles to the total particle volume. They are calculated by the following equations:
where is the bulk volume of the sample, is the volume of mercury intrusion up to the interparticle filling limit, and is the total volume of mercury intrusion up to the maximum pressure.
2.4. Active Infrared Thermography
Traditional thermal property measurement methods, such as differential scanning calorimetry (DSC) and hot wire methods, cannot be performed on site and require carefully prepared samples or calibrated instruments. On the contrary, IRT relies on the sample surface temperature variation in time and space to determine the structural discontinuity or thermal properties, and is considered a non-destructive testing method suitable for in situ applications.
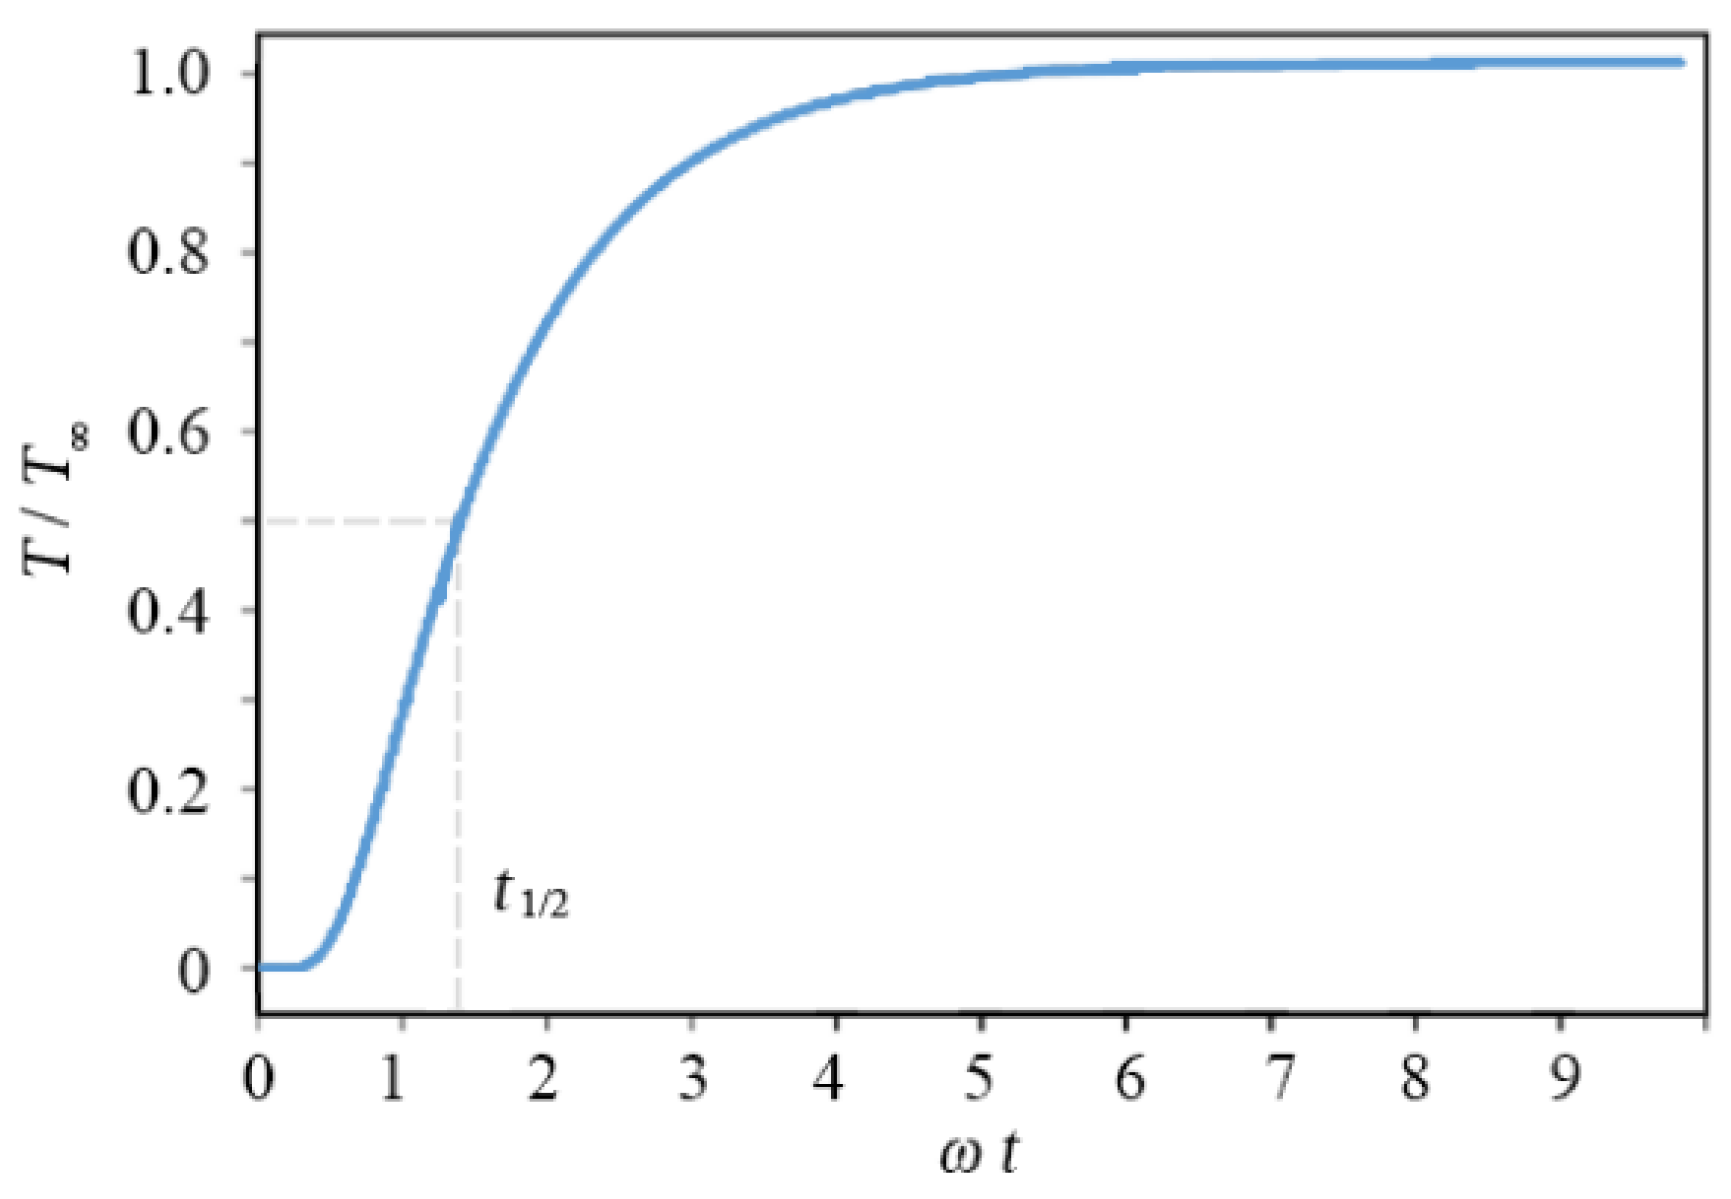
In this study, active IRT is performed to measure the thermal properties of the stone samples after each freeze–thaw cycle. The thermal diffusivity () describes the rate at which the temperature spreads through a material. The flash method is adopted for thermal diffusivity measurements with a transmission geometry [27]. The analytical solution of the temperature evolution can be derived from a heat conduction equation, using the method of Laplace transform with the corresponding initial and boundary conditions. For a single-layer sample of finite thickness , the temperature change after an instantaneous (Dirac delta) thermal excitation at the back surface is
where is the absorbed energy density on the surface, and and are the thermal diffusivity, density, and the specific heat of the sample, respectively. When the energy of the heat pulse is fully absorbed by the sample, ignoring the heat exchange with ambient air, the equilibrium temperature is . The normalized thermal response is shown in Figure 6, in which . Thermal diffusivity of the sample can be obtained by locating when the surface temperature reaches the half of the maximum value, using . However, here, is obtained from the measured surface temperature using a least-squares fit of Equation (1) for better accuracy.
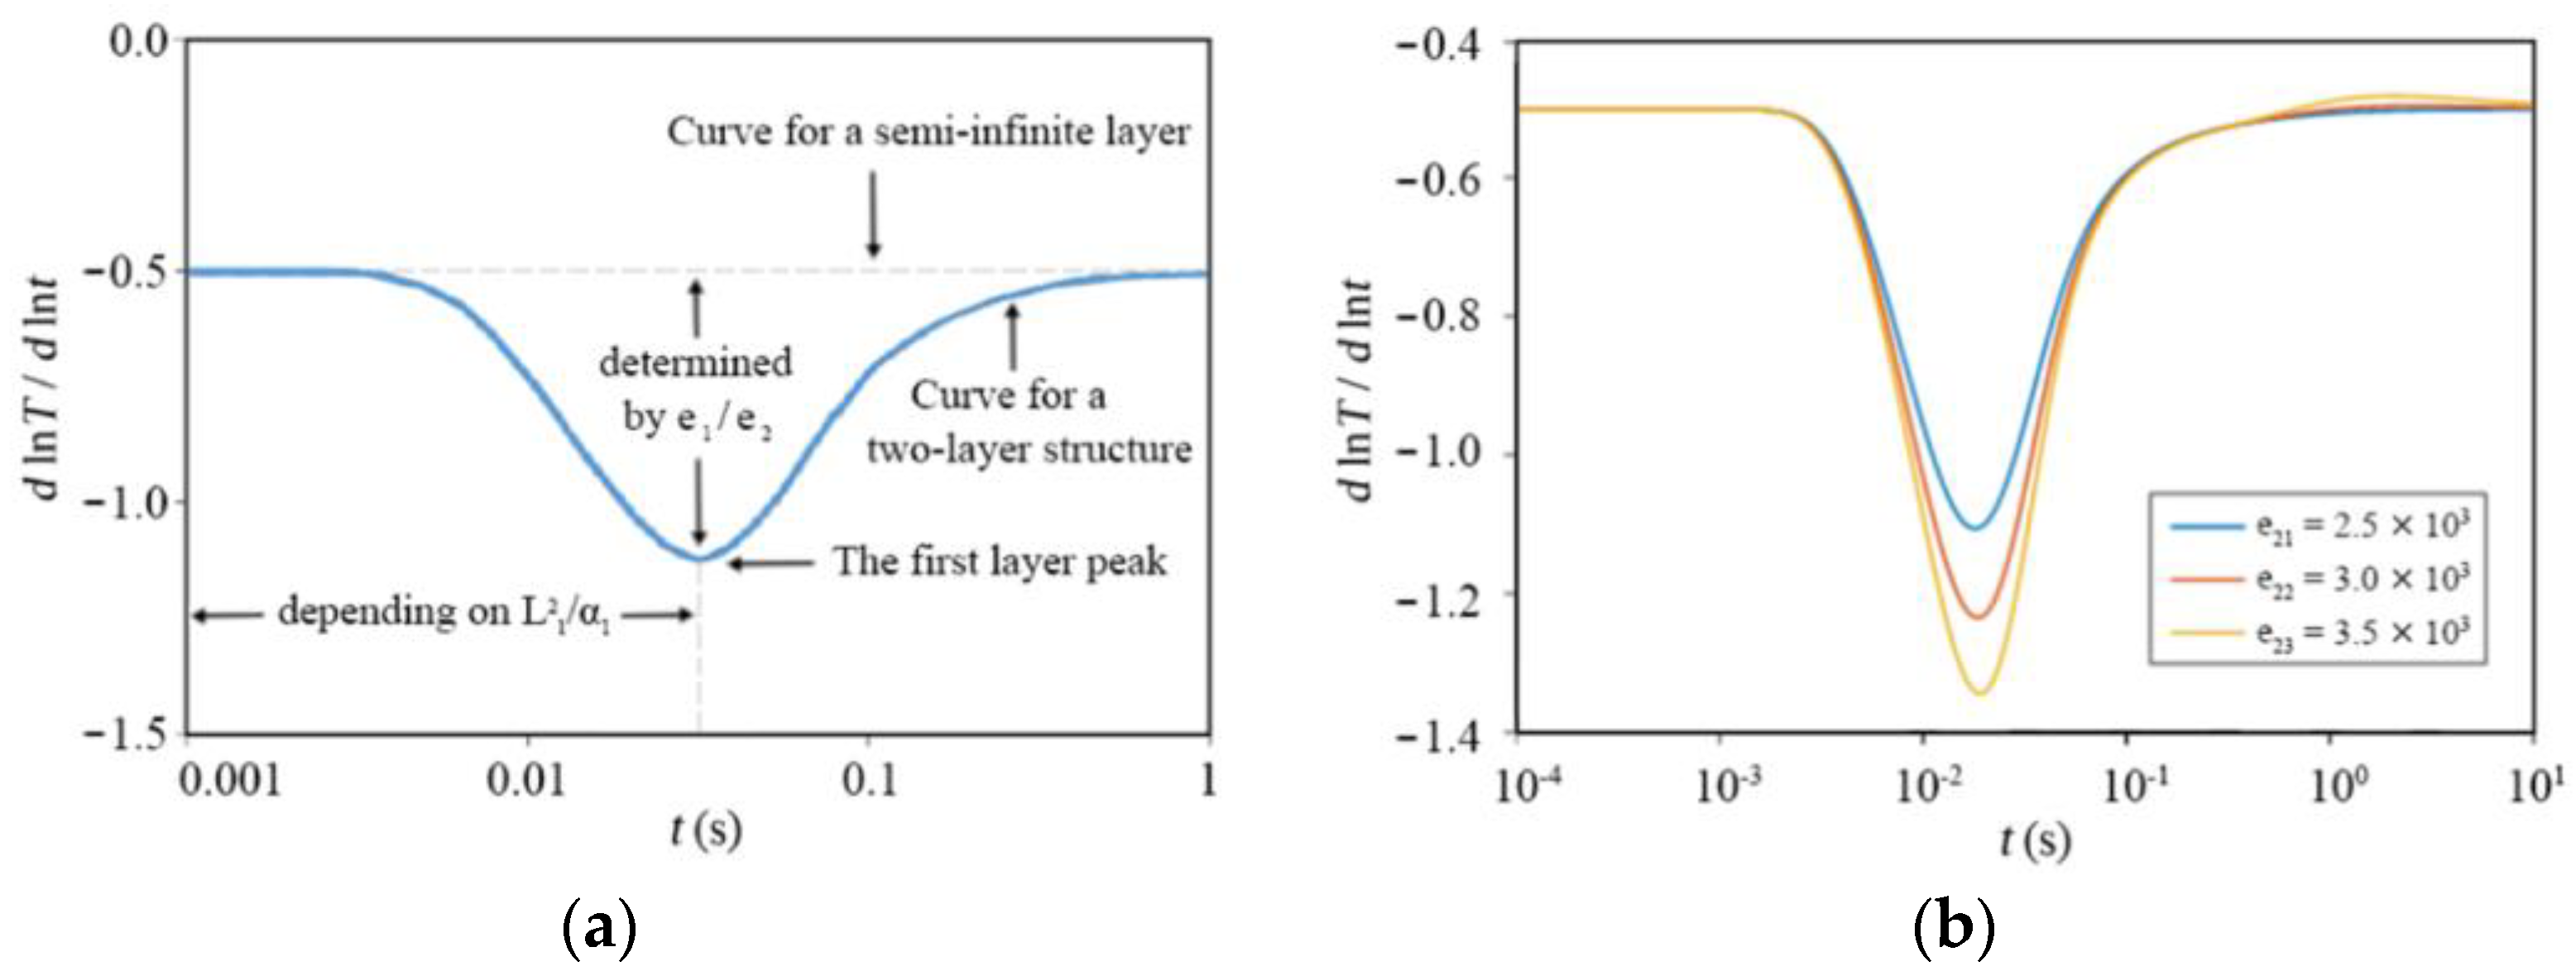
The thermal effusivity () describes a material’s ability to exchange heat with its surroundings, and thermal conductivity () is a measure of the ability to transfer heat through a material by conduction. They can be obtained simultaneously by active IRT in a reflection geometry. For a two-layer material with a semi-infinite substrate, the evolution of its front surface temperature after an instantaneous thermal excitation is
where e is the thermal effusivity, and the subscripts 1 and 2 denote the first and second layer materials, respectively. From Equation (2), we can find that the logarithmic temperature slope, , plotted as a function of time exhibits a negative peak below the baseline of −0.5. As shown in Figure 7a, the thermal effusivity ratio can be uniquely determined from the peak amplitude, and this is independent of all other material parameters. The logarithmic surface temperature of a two-layer material, with the second layer having different thermal effusivity, is shown in Figure 7b. Because typical thermography data have a low signal-to-noise ratio, direct implementation of Equation (2) would result in a low measurement accuracy. The pulse thermal imaging–multilayer analysis (PTI-MLA) method seeks a numerical solution of the governing heat transfer equation based on a Crank-Nicolson discretization algorithm. Based on fitting the numerical solution with the experimental surface temperature by least-squares fitting, can be determined, from which we can obtain the substrate’s thermal effusivity, when is known, or vice versa. From the measured thermal effusivity and diffusivity, the thermal conductivity can be calculated [28,29,30].
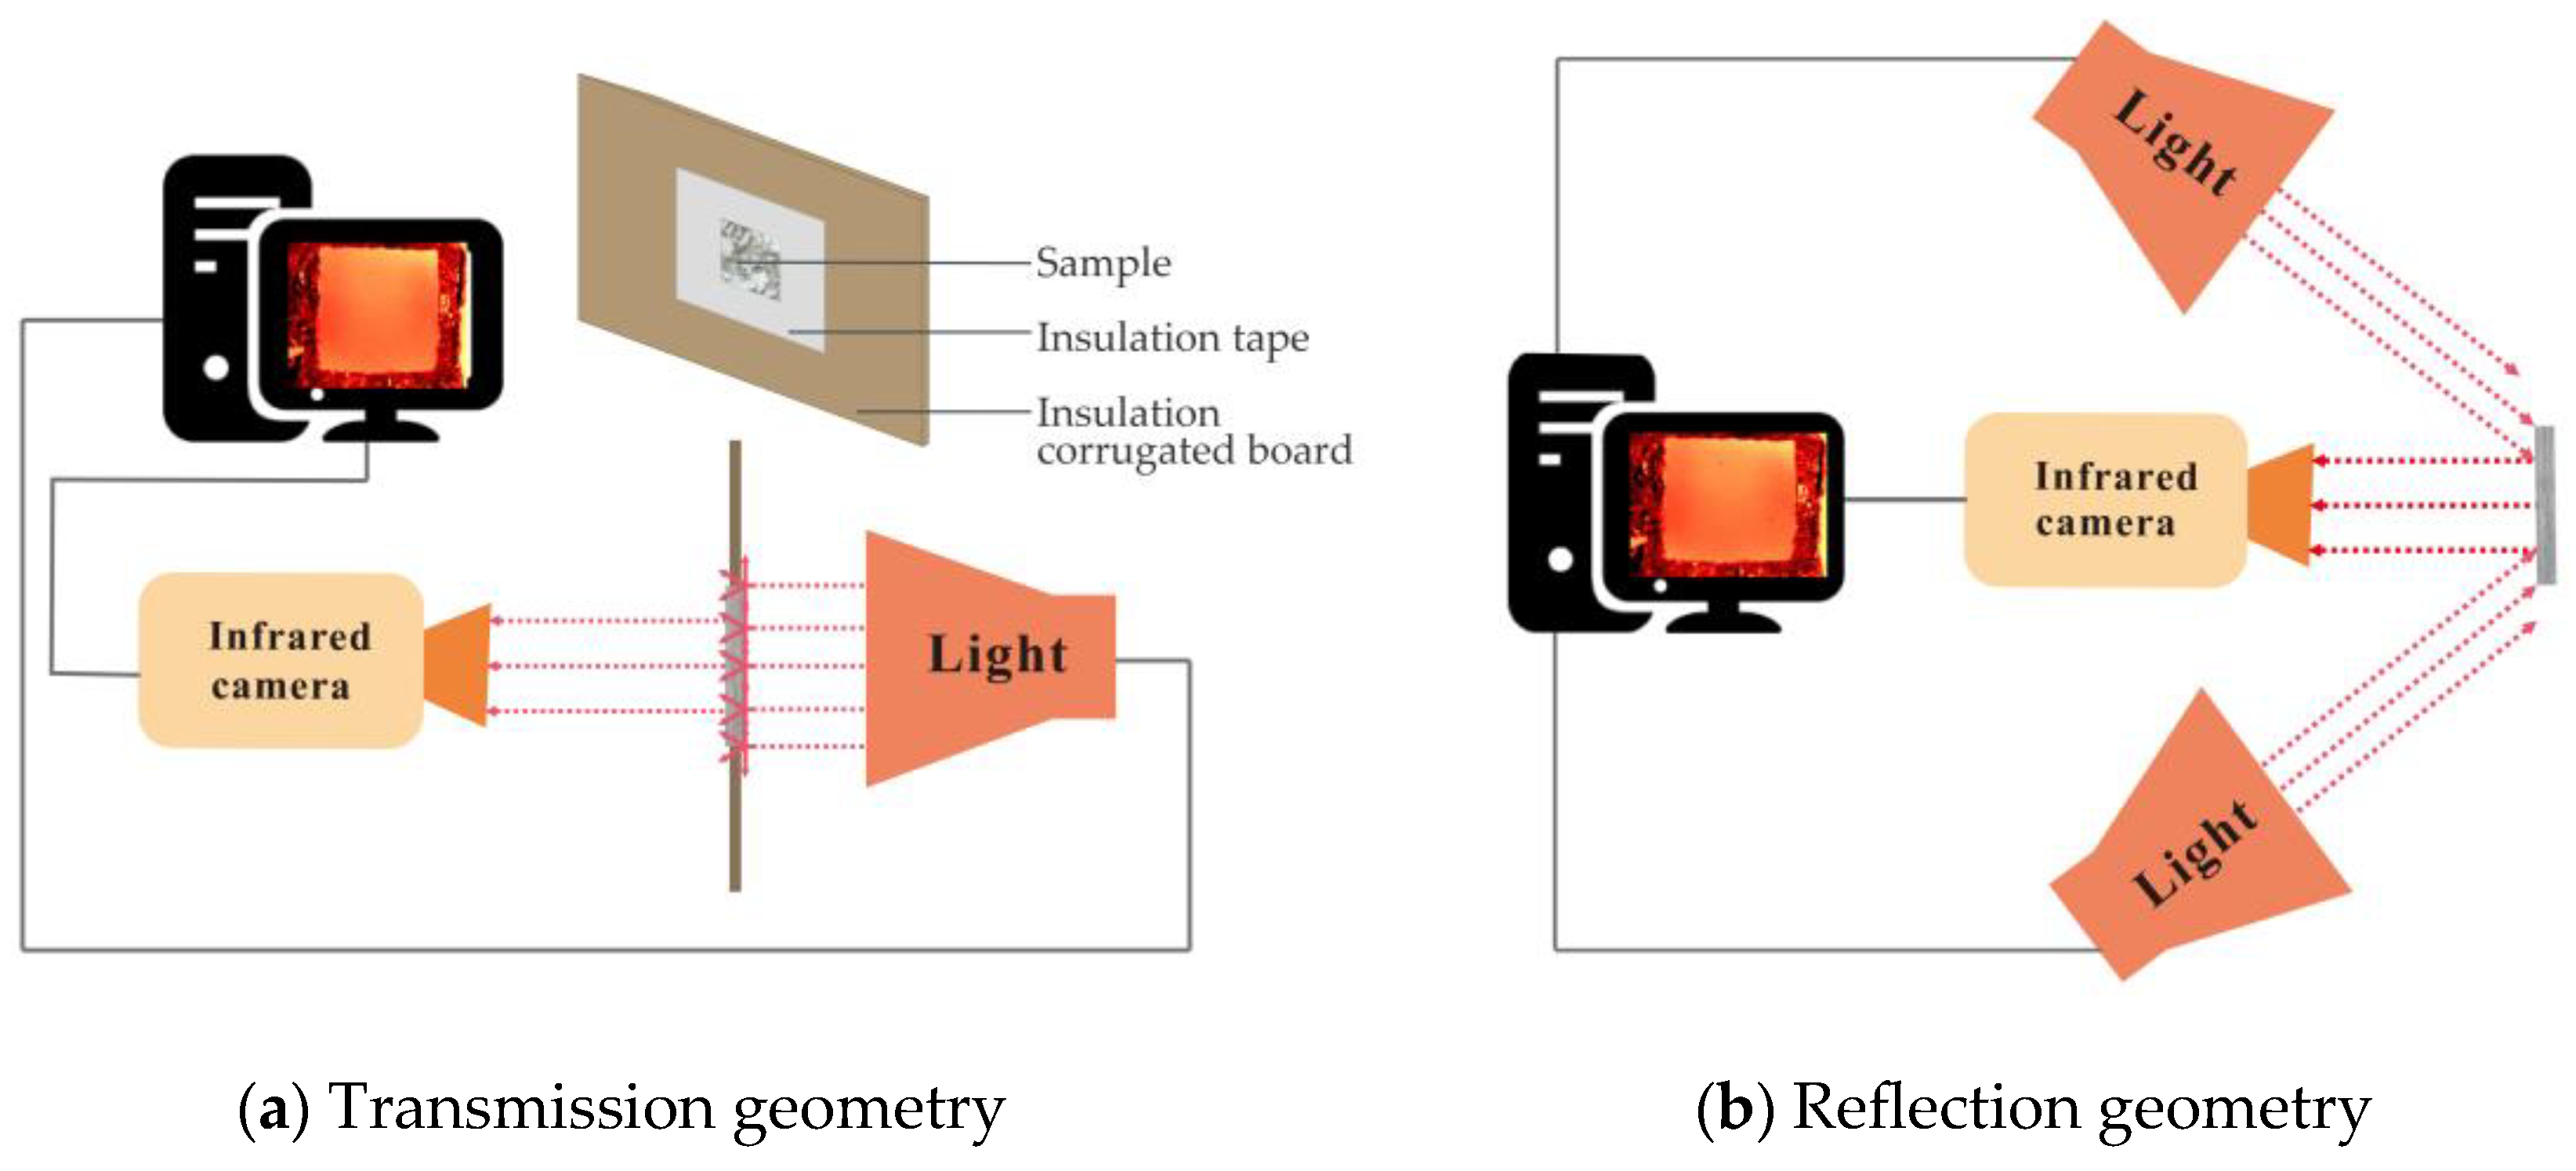
Due to the inhomogeneity and semi-transparency of granite and marble, a thin layer of graphite spray with an emissivity of 0.99 is applied on the sample surface to maximize the experimental accuracy. The sandstone is denser and more homogeneous. Therefore, no surface processing is required. Flash lamps are used for uniform heat exposure. An IR camera (FLIR SC7000) sensitive to long wavelengths (7.7–9.3 μm) is used for capturing the thermal response on the surface of the sample. The infrared camera is operated at 50 Hz with a window size of 160 × 128 pixels. For thermal diffusivity measurements, a transmission thermograph is employed, with a flash lamp and IR camera placed on opposite sides of the sample. The experimental setup is shown in Figure 8a. For thermal effusivity measurement, a reflectance thermography is adopted, with two flash lamps placed in front of the sample at 45° for thermal excitation, and the infrared camera is placed in the center at the same side of the sample, as shown in Figure 8b. A layer of electric tape with known thickness and thermal effusivity is pasted on the surface of the sample to form a two-layer structure. The thermal conductivity of the sample can be calculated from the obtained effusivity and diffusivity [31].
3. Results
This section focuses on the experimental results of this study, corresponding to the research methods, including the stones’ physical change (surface condition and mass change), porosity change, and thermal property change.
3.1. Surface Condition
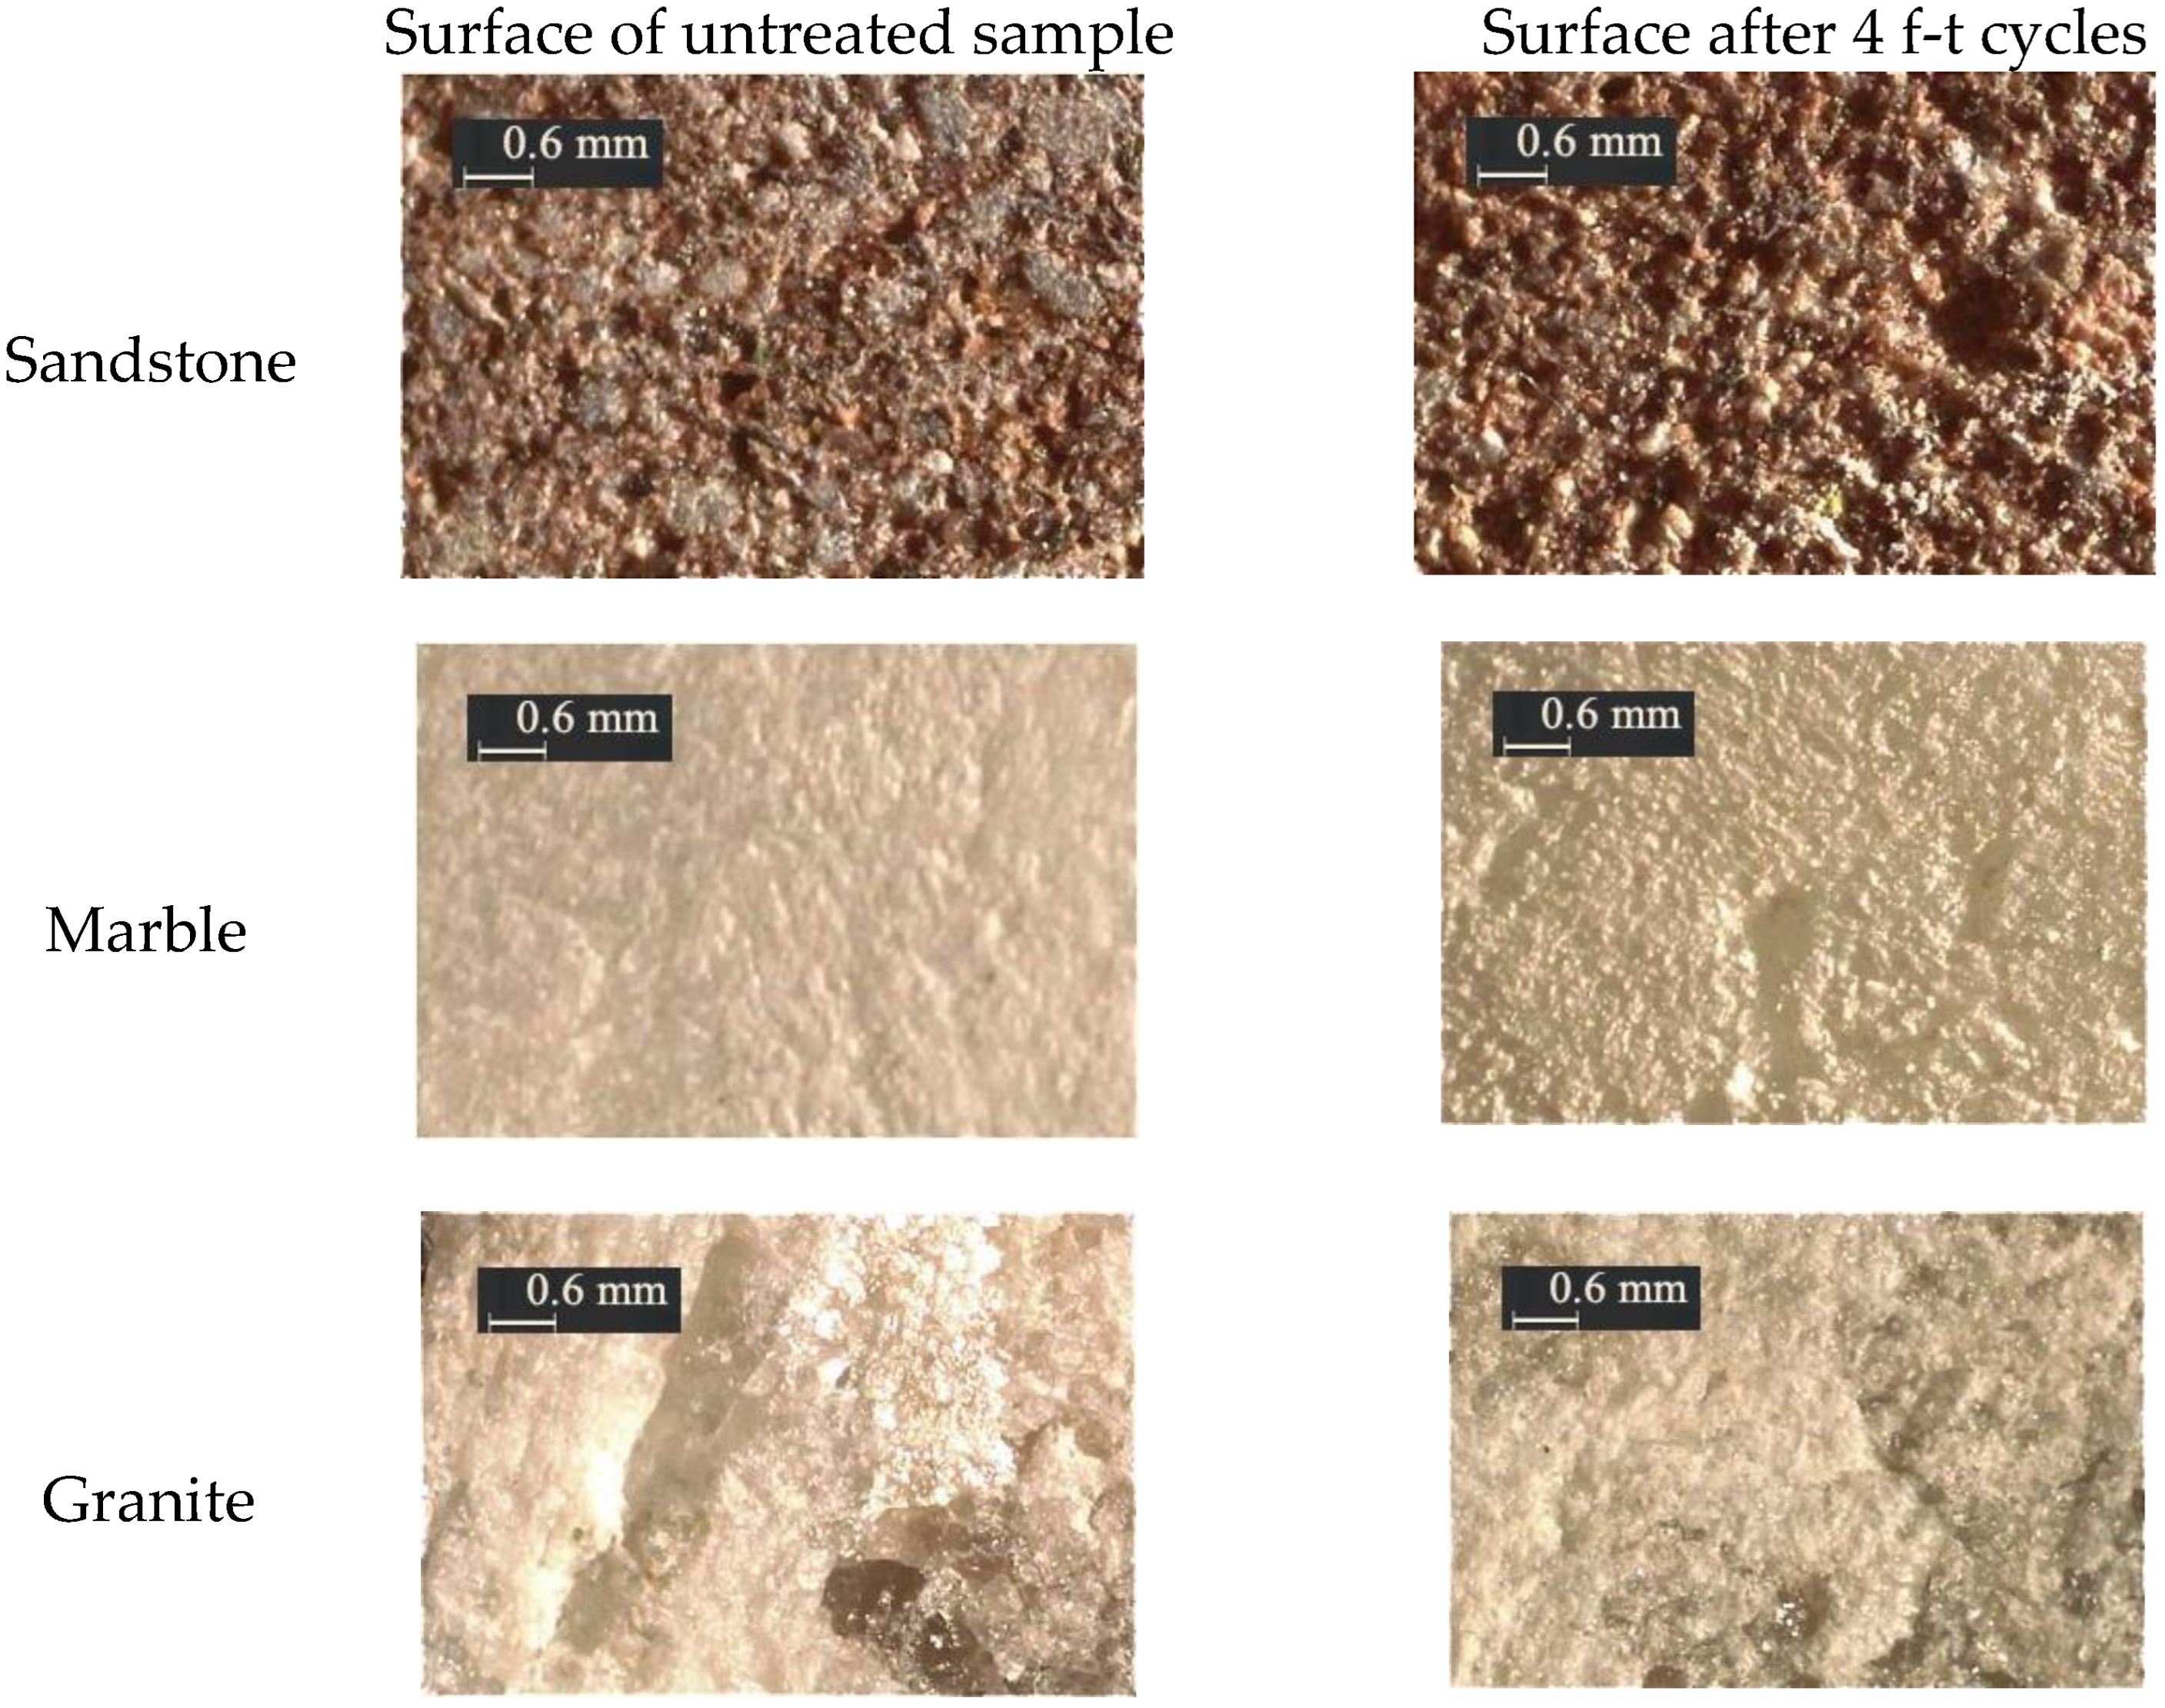
Figure 9 shows microscopic images of the sample surface before and after four freeze–thaw cycles (recorded by Leica S91 stereomicroscope). Most of the target areas have visually changed after the weathering process. An increase in surface roughness is observed, and the samples become powdery in texture and grayish in color.
3.2. Mass Change
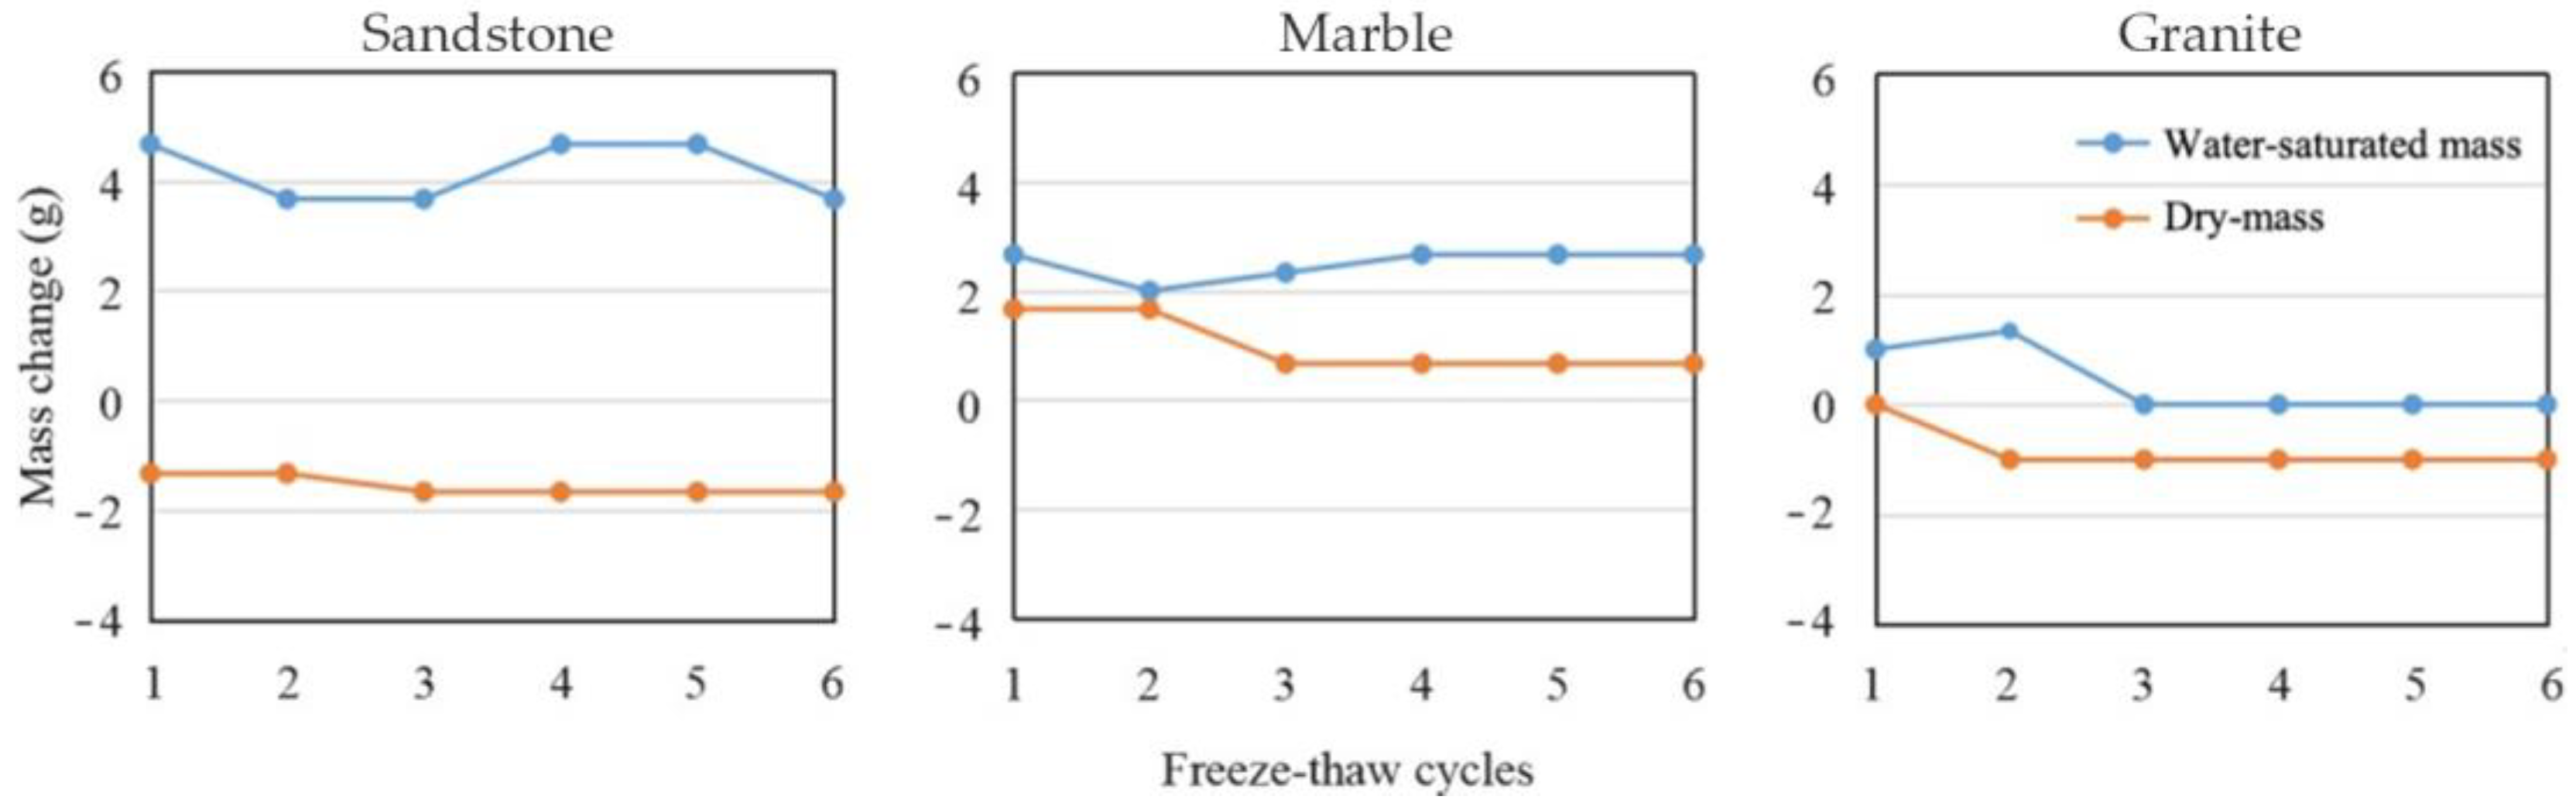
The change between water-saturated mass and dry mass is an important indicator of the stones’ porosity and sorptivity. It is measured after each freeze–thaw pass and averaged after each cycle, as described in Section 2.2. Figure 10 shows that sandstone samples have the most dramatic weight change between water-saturated mass and dry mass. The difference fluctuates up and down between 5.0 and 7.3 g (about 1.98–2.89% of the total mass), indicating that the sandstone has a higher initial porosity and a stronger water absorption capacity than the other two types. For marble and granite samples, the mass differences between water-saturated mass and dry mass are smaller and fairly stable. The former is between 0.3 and 2.0 g (0.11–0.75% of the total mass), and the latter is between 1.0 to 2.3 g (0.36–0.82% of the total mass). This is because the textures of marble and granite are much denser than that of the sandstone, so water cannot easily get in or out of the material.
3.3. Mercury Porosimetry
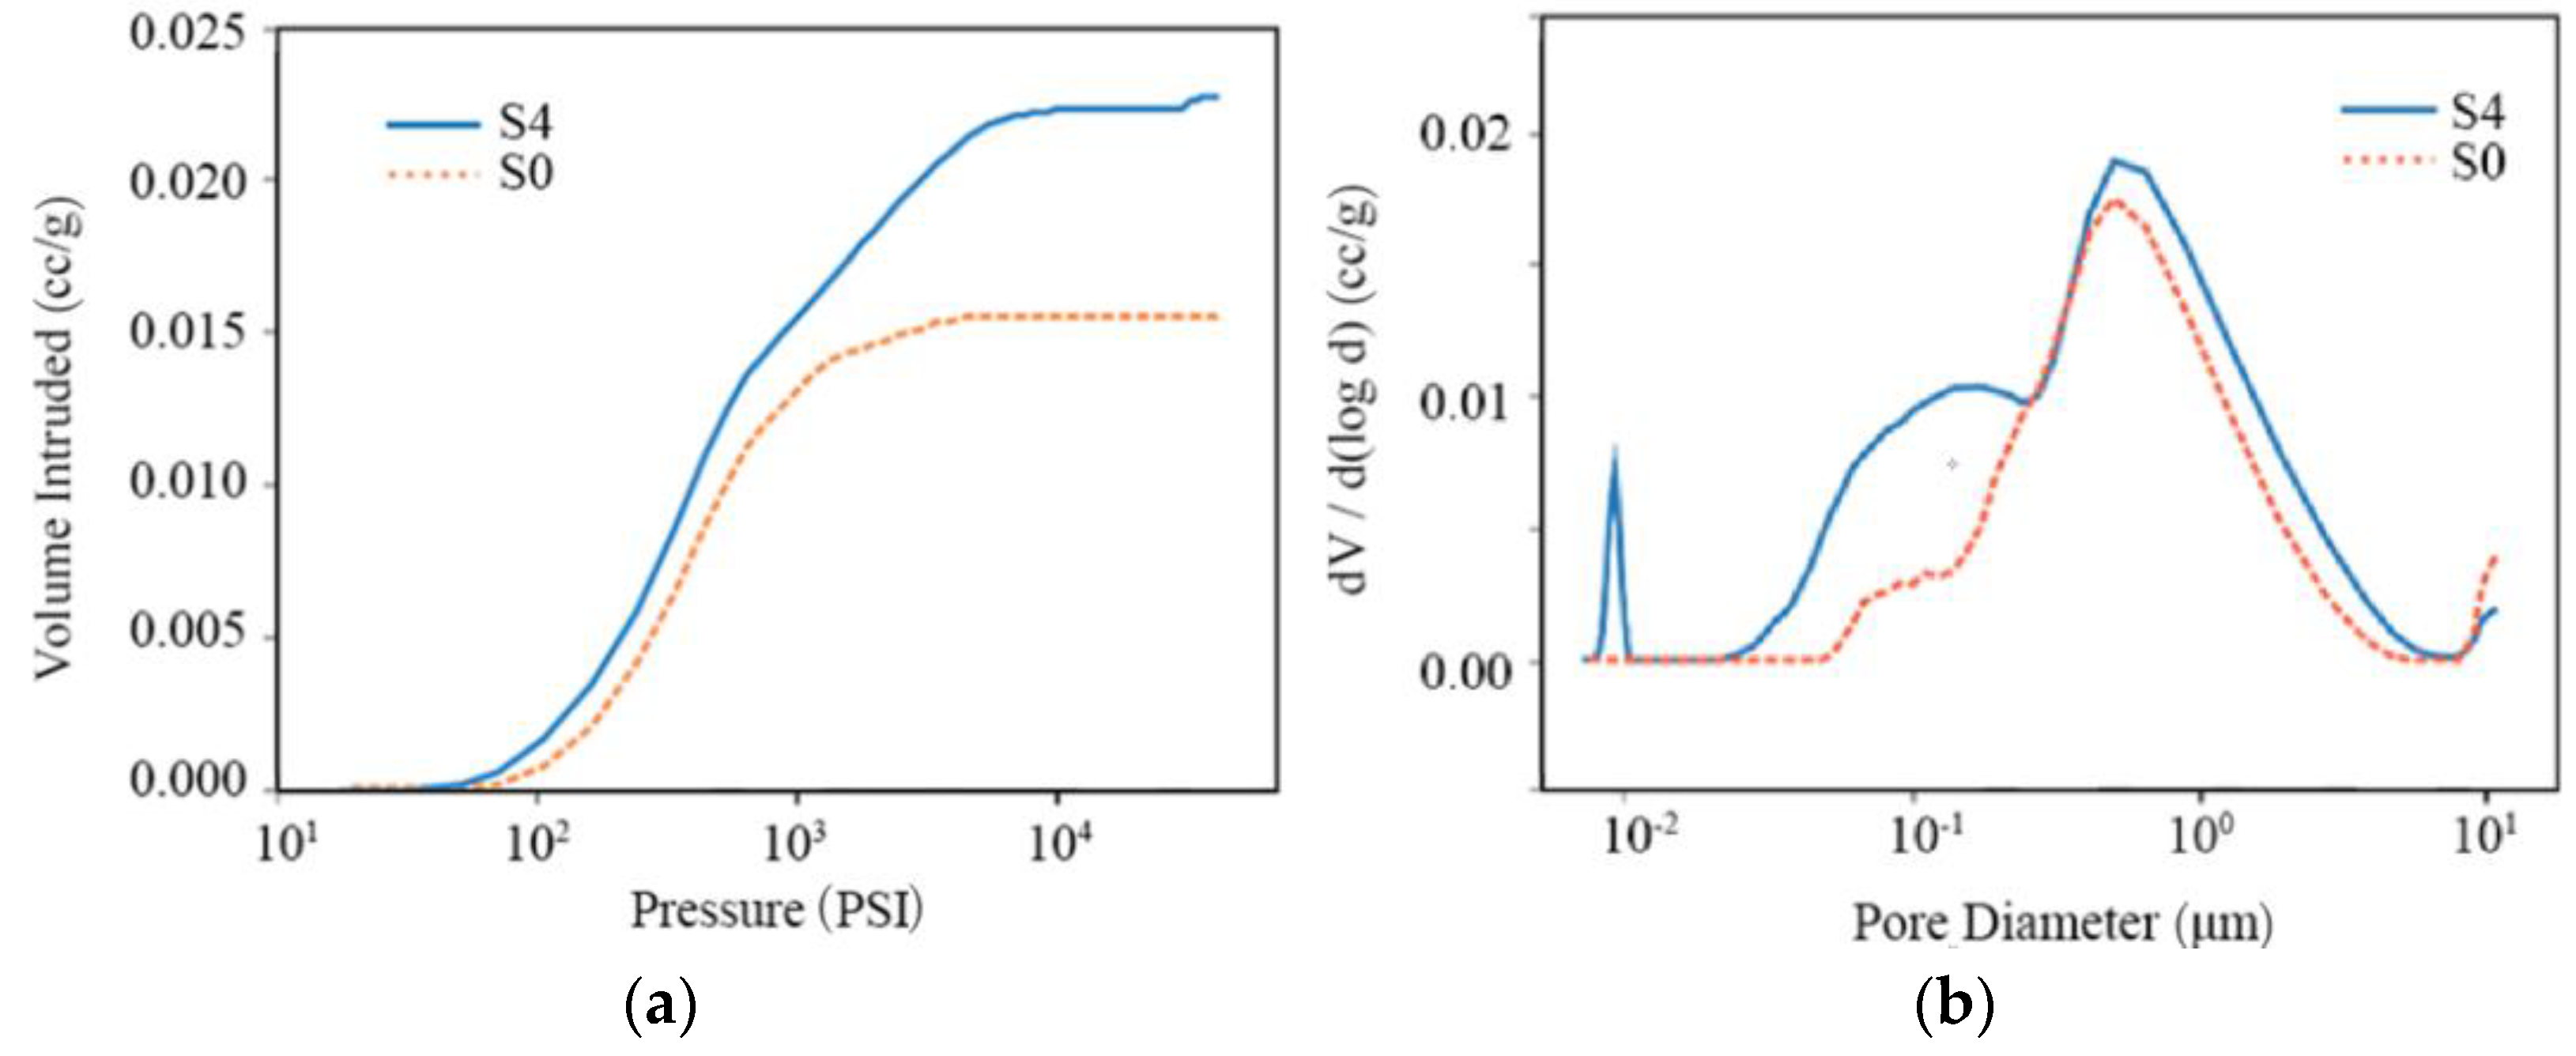
To investigate the effects of freeze–thaw cycles on porosity, mercury porosimetry measurements were conducted on the three stone types. The results are shown in Figure 11 for untreated samples (dashed lines) and after four freeze–thaw cycles (solid lines). Figure 11a,c,e show the cumulative intruding mercury volume with pressure for sandstone, marble, and granite, respectively. The corresponding pore size distribution is derived from the pressure applied for the mercury intrusion and presented in Figure 11b,d,f, where the peak value corresponds to the dominant pore radius.
The intraparticle, interparticle and the total porosity provided by the mercury intrusion pore size analyzer are summarized in Table 2, showing that the growth in porosity is caused by the increase in intraparticle porosity. The last column in Table 2 presents the data of pore tortuosity, which shows a slightly decreasing trend after the freeze–thaw cycles for all the stone types.
In sandstone, the intruding mercury volume increases proportionally in the fourth freeze–thaw cycle, compared with the untreated samples (Figure 11a). The pore size distribution (Figure 11b) broadens with a larger contribution from small pores, indicating that after weathering, new intraparticle pores have developed, whereas other pores have enlarged. As a result, the total porosity increased from 0.2597% to 0.9115%, i.e., about 3.5 times.
In marble, the intruding mercury volume (Figure 11c) is higher when the pressure is low for the untreated samples. This could be caused by the inhomogeneity of the tested material. The sharp slope at high pressure indicates the existence of pores of a size below the MIP detection limit. After weathering, many small pores develop (Figure 11d), resulting in an increase in intraparticle porosity by more than ten times. The total porosity increases from 0.0175% to 0.0447%, about 2.5 times.
In granite, the intruding mercury volume after weathering shows a sudden increase at high pressure (Figure 11e) due to the formations of pores with a diameter smaller than 20 nm (Figure 11f). Compared with the untreated granite samples, the number of large pores is mostly unchanged. The total porosity of granite increased from 0.0290% to 0.4625%, i.e., about 16 times.
3.4. Active Infrared Thermography
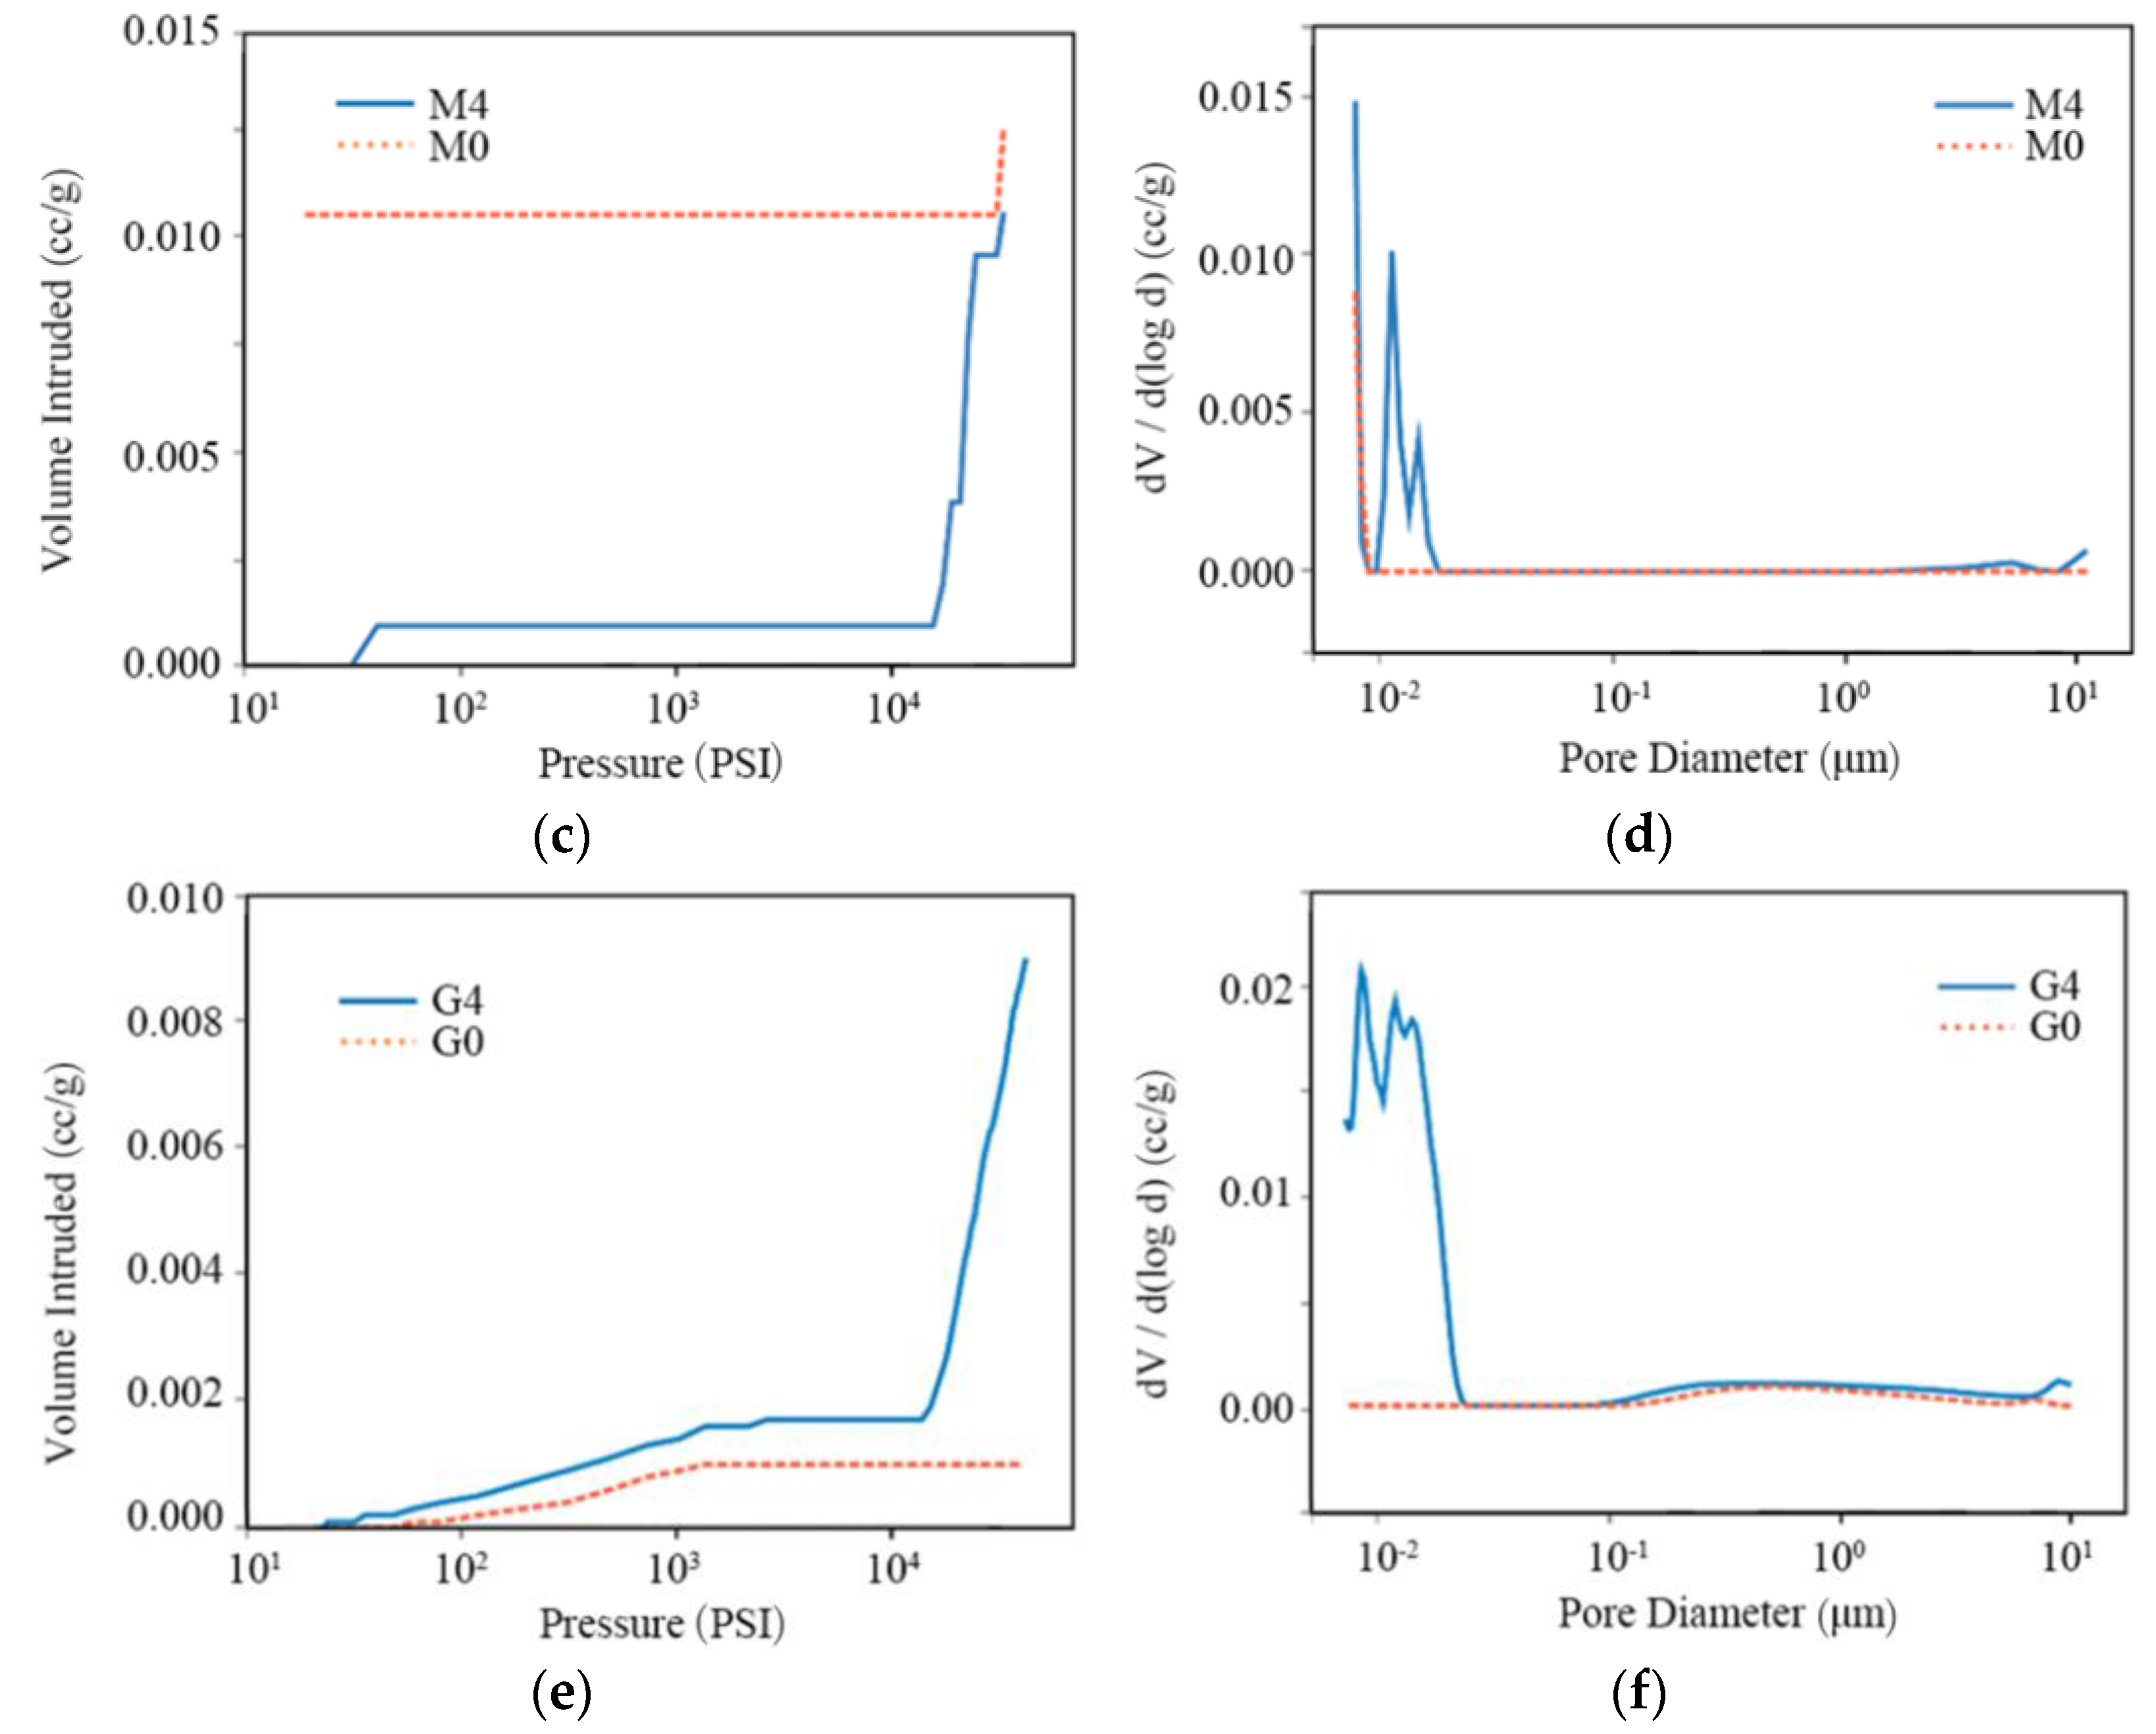
The porosity change after the freeze–thaw weathering treatment also affects the thermal properties of the stone samples, which in turn play an important part in the aging process. The normalized experimental thermal response in transmission () and reflection geometry after pulsed excitation for the three types of samples is summarized in Figure 12a,b. The thermal diffusivity is calculated from a fit of the analytical solution for a single-layer sample, as shown in Figure 13a. The thermal effusivity obtained from PTI-MLA method based on fitting a two-layer structure is shown in Figure 13b. The thermal conductivity derived from Figure 13a,b is presented in Figure 13c.
The thermal diffusivity of sandstone drops from 1.10 mm2/s to 0.92 mm2/s with the freeze–thaw cycles, while for marble and granite samples, the thermal diffusivity slightly increases from 1.25 mm2/s to 1.31 mm2/s, and from 1.34 mm2/s to 1.51 mm2/s, respectively (Figure 13a). The thermal effusivity and conductivity, on the other hand, increase for all three stone types, with small fluctuation (Figure 13b,c). Sandstone and granite experience a mild increase in thermal effusivity, from 1896.88 Ws1/2/m2K to 2309.26 Ws1/2/m2K and from 2151.28 Ws1/2/m2K to 2386.25 Ws1/2/m2K, respectively. Marble shows a larger increase from 2560.54 Ws1/2/m2K to 3303.59 Ws1/2/m2K. The thermal conductivity of sandstone increases only slightly, from 1.99 to 2.21, due to decreasing diffusivity and increasing effusivity. The marble and granite samples present an obvious increase from 2.87 to 3.78 and from 2.49 to 2.93 , respectively.
4. Discussion
This paper focuses on four aspects of the weathering evolution of stone samples: changes in (1) appearance; (2) mass; (3) porosity; and (4) thermal properties. After freeze–thaw weathering, the appearance shows a clear increase in surface roughness, indicating a possible growth in porosity and pore size. The texture and color change due to the precipitation of dissolved minerals and inorganic salts on the surface. The change between water-saturated mass and dry mass also meets expectations. Sandstone samples have the largest weight change due to their high initial porosity and water absorption capacity, while marble and granite are relatively compact and weakly permeable, resulting in a mass change limited to only about one-fifth of sandstone’s data. Both the water-saturated mass and dry mass show minor variations with the increase in the weathering process. The dry mass, for instance, decreases slightly, indicating a gradual increase in porosity, with the formation of more void spaces inside the material. Notably, when designing this experiment, the last step of drying does not aim to remove all the water, but to reach a humidity equilibrium, because complete dehydration is very unlikely to happen in a natural environment. Therefore, in the dry mass measurements, there might still be water trapped inside the stone samples. The MIP measurements verify again that sandstone has the largest initial porosity, and reveal that the freeze–thaw weathering process induces mostly intraparticle pores in all three types of stones. In marble and granite, new pores develop, with a diameter smaller than 20 nm. In sandstone, existing pores expand. The change in thermal conductivity in the freeze–thaw cycles is studied by performing IRT experiments in the laboratory, thereby obtaining the thermal diffusivity and effusivity. The results show a dependence on the stone type, which may potentially be correlated to the degree of the weathering process.
The shape of the samples was chosen to facilitate thermal diffusivity measurements in transmission geometry, but this is unlikely to be possible using materials acquired on site. On the other hand, thermal effusivity measurements are performed in reflection geometry using samples with a two-layer structure. The first layer is artificial, with known thermal properties. The second layer is the measured object, which can have an irregular chape and is approximated as a semi-infinite layer. In this case, a correlation between the weathering and the thermal effusivity must be established. According to the experimental results, the effusivity increases after the freeze–thaw aging process.
The thermal conductivity of porous materials can be calculated using existing models, depending on the fractal theories applied, such as the parallel and series model, the Maxwell–Eucken model, and the EMT model [32,33,34,35,36]. Under normal circumstances, the increase in the porosity of the samples is expected to produce a decrease in the effective thermal conductivity, since the air’s thermal conductivity is lower than that of bulk solids. However, in this study, the measured thermal conductivity of all stone samples grew, rather than dropping off, with the number of freeze–thaw cycles. This result can be interpreted by referencing the research conducted on soils. Ghauman found that thermal conductivity increases with an increase in the proportion of water content in soil [37]. Abu-Hamdeh also pointed out that for the same moisture content, the growth in soil density increases its thermal conductivity. Meanwhile, for the same soil density, the thermal conductivity in soil increases as the moisture increases [38]. In this freeze–thaw experiment, the newly developed pores, especially those of nanometer scale, lead to a higher moisture content after weathering. The sandstone’s thermal conductivity did not change much after the freeze–thaw cycles, suggesting that the relatively large pores facilitate water evaporation. Less moisture content also implies a slower weathering process in the natural environment. Therefore, sandstone artifacts are likely to be more resistant to freeze–thaw weathering. For marble and granite, however, their initial porosity and permeability are much lower than that of the sandstone. However, due to the large quantity of micropores developed in the freeze–thaw cycles, their aging process accelerates. From the trend line, it can be predicted that the value difference in thermal conductivity across the three types of stones will keep increasing if the aging test continues.
From a standpoint of reality, the weathering of stone artifacts is a combined effect of several factors. In the natural environment, where most stone artifacts are preserved, temperature changes dramatically over time. Taking northwest China for instance, the temperature fluctuates by as much as 20 °C between day and night. When the stone temperature is lower than the dew-point temperature, moisture in the environment will condense on the surface of the stone artifacts and penetrate deep into the stone through pores and other tiny open spaces. Temperature changes below and above the freezing point of water can force the water inside the stone to switch between liquid and solid state, further damaging the artifacts from the inside. If the thermal conductivity of the stones increases, water in the pores will freeze more easily with the drop in the external temperature, and as a consequence, the pores will be further expanded, creating a vicious and self-reinforcing cycle of aging. On the other hand, water in the pores forms condensation more quickly than on the surface, [39] implying that in a low-temperature environment, water may freeze and deteriorate at a faster pace inside the stone.
5. Conclusions
This paper studies the influence of the freeze–thaw weathering process on three types of stones (i.e., sandstone, marble, and granite), which can be seen as representatives of stone artifacts worldwide. It focuses on changes in the stones’ physical properties, such as surface condition, mass, porosity, and thermal properties. The surface morphology, mass, and porosity are characterized by stereomicroscope, weight, and mercury intrusion porosimetry, respectively. The thermal properties are characterized by pulsed IRT measurements, which provide thermal diffusivity and effusivity using different experimental implementations in transmission and reflection geometry, respectively. They are then used to calculate thermal conductivity.
Microscopic images recorded after the freeze–thaw cycles show a change in surface texture and an increase in surface roughness. The dry mass decreases with the aging process, indicating an increase in the stone’s porosity. The difference between the dry mass and the water-saturated mass corresponds to the stone’s texture and porosity. The experimental accuracy of the water-saturated mass is affected by water seeping out from the pores during the weighing process. The interparticle and intraparticle porosity obtained from the MIP measurements provide an insight into the material influence of the freeze–thaw cycles. The thermal diffusivity decreases for sandstone and increases for the other two types of stone with the aging process, due to their texture difference. The thermal effusivity and conductivity increase with the aging process. Normally, a low thermal conductivity can mitigate the temperature fluctuations, but our results show that for all the three stone types, the thermal conductivity increases with the freeze–thaw cycles, further accelerating the aging process. From our understanding, this is due to the humidity within the examined materials, which cannot be completely dried in the natural environment.
The main innovation of this study is that it is proposed for the first time to use the evolution of thermal effusivity to characterize the aging degree of materials using a non-destructive method. Although many thermal property measurement techniques are available in academia, most of them are time-consuming and inconvenient to use in the field. In contrast, thermal property measurements based on transient IRT methods require simple instrumentation and a shorter testing time.
Although absolute control of the humidity inside a porous material is difficult to achieve, further research is required to gain a more rigorous control of environmental humidity and to study the influence of moisture on the thermal properties of stone samples. More freeze–thaw cycles will be carried out to verify the predictions shown by the trend lines. Most stone artifacts are too complicated to be treated as simple experimental samples, not only because of the complex shape and spatial density variation, but also because they are normally kept in different environmental conditions, in which they are subject to different weathering forces, resulting in varying freeze–thaw processes and different levels of damage. Therefore, case-by-case studies are needed to verify our experimental conclusions and evaluate the diversity and the degree of influence of the main factors. Moreover, studies have been planned to examine more stone types to assess the variation in the results.
Author Contributions
Conceptualization, J.Z., X.Y. and B.C.; Methodology, J.Z., X.Y., N.T. and J.S.; formal analysis and investigation, J.Z., X.Y., X.W. and G.H.; writing—original draft preparation, J.Z., X.Y. and B.C.; writing—review and editing, X.Y. and B.C.; funding acquisition, B.C. All authors have read and agreed to the published version of the manuscript.
Funding
This research was funded by National Social Science Fund of China, grant number 19CKG024.
Institutional Review Board Statement
Not applicable.
Informed Consent Statement
Not applicable.
Data Availability Statement
The data that support the findings of this study are available from the corresponding author upon reasonable request.
Conflicts of Interest
The authors declare no conflict of interest.
References
- Johnson, J.B.; Montgomery, M.; Thompson, G.E.; Wood, G.C.; Sage, P.W.; Cooke, M.J. The influence of combustion-derived pollutants on limestone deterioration. Corros. Sci. 1996, 38, 267–278. [Google Scholar] [CrossRef]
- Brimblecombe, P.; Lefèvre, R. Weathering of materials at Notre Dame from changes in air pollution and climate in Paris, 1325-2090. J. Cult. Herit. 2021, 50, 88–94. [Google Scholar] [CrossRef]
- Cárdenes, V.; Mateos, F.; Fernández-Lorenzo, S. Analysis of the correlations between freeze-thaw and salt crystallization tests. Env. Earth Sci. 2014, 71, 1123–1134. [Google Scholar] [CrossRef]
- Herodotus; Macaulay, G., Translators; The History of Herodotus; MacMillan and Co.: London, UK, 1914; Volume 1. [Google Scholar]
- Shao, M. Properties and deterioration mechanism of sandstone blocks in Chengde royal buildings between 1703 and 1792. J. Eng. Geol. 2015, 3, 533–538. [Google Scholar]
- Sebastián, E.; Cultrone, G.; Benavente, D.; Fernandez, L.L.; Elert, K.; Rodriguez-Navarro, C. Swelling damage in clay-rich sandstones used in the church of San Mateo in Tarifa (Spain). J. Cult. Herit. 2008, 9, 66–76. [Google Scholar] [CrossRef]
- Danin, A.; Caneva, G. Deterioration of limestone walls in Jerusalem and marble monuments in Rome caused by cyanobacteria and cyanophilous lichens. Int. Biodeterior. 1990, 26, 397–417. [Google Scholar] [CrossRef]
- Heidari, M.; Torabi-Kaveh, M.; Mohseni, H. Assessment of the effects of freeze–thaw and salt crystallization ageing tests on Anahita Temple Stone, Kangavar, West of Iran. Geotech. Geol. Eng. 2017, 35, 21–136. [Google Scholar] [CrossRef]
- Franzoni, E.; Sassoni, E.; Scherer, G.W.; Naidu, S. Artificial weathering of stone by heating. J. Cult. Herit. 2013, 14, 85–93. [Google Scholar] [CrossRef]
- Ruedrich, J.; Kirchner, D.; Siegesmund, S. Physical weathering of building stones induced by freeze-thaw action: A laboratory long-term study. Environ. Earth Sci. 2011, 63, 1573–1586. [Google Scholar] [CrossRef] [Green Version]
- Nogueira, R.; Pinto, A.; Gomes, A. Artificial aging by salt crystallization: Test protocol and salt distribution patterns in lime-based rendering mortars. J. Cult. Herit. 2020, 45, 180–192. [Google Scholar] [CrossRef]
- Mahmutoğlu, Y. Prediction of weathering by thermal degradation of a coarse-grained marble using ultrasonic pulse velocity. Environ. Earth Sci. 2017, 76, 1–20. [Google Scholar] [CrossRef]
- Yang, X.; Chen, B.; Hu, G.; Wang, X.; Fang, W.; Zhang, J.; Tao, N.; Yuan, G. Pulsed infrared thermographic study of a Chinese bronze lei. Herit. Sci. 2022, 10, 152. [Google Scholar] [CrossRef]
- Li, X.; Tao, N.; Sun, J.; Lei, Y.; Qu, L.; Gao, F.; He, Y.; Wang, G.; Feng, L. Evaluation of an ancient cast-iron Buddha head by step-heating infrared thermography. Infrared Phys. Technol. 2019, 98, 223–229. [Google Scholar] [CrossRef]
- Avdelidis, N.; Moropoulou, A. Applications of infrared thermography for the investigation of historic structures. J. Cult. Herit. 2004, 5, 119–127. [Google Scholar] [CrossRef]
- Ambrosini, D.; Daffara, C.; Di Biase, R.; Paoletti, D.; Pezzati, L.; Bellucci, R.; Bettini, F. Integrated reflectography and thermography for wooden paintings diagnostics. J. Cult. Herit. 2010, 11, 196–204. [Google Scholar] [CrossRef]
- Tavakolian, P.; Shokouhi, E.B.; Sfarra, S.; Gargiulo, G.; Mandelis, A. Non-destructive imaging of ancient marquetries using active thermography and photothermal coherence tomography. J. Cult. Herit. 2020, 46, 159–164. [Google Scholar] [CrossRef]
- Theodorakeas, P.; Avdelidis, N.P.; Cheilakou, E.; Koui, M. Quantitative analysis of plastered mosaics by means of active infrared thermography. Constr. Build. Mater. 2014, 73, 417–425. [Google Scholar] [CrossRef]
- Bodnar, J.L.; Candoré, J.C.; Nicolas, J.L.; Szatanik, G.; Detalle, V.; Vallet, J.M. Stimulated infrared thermography applied to help restoring mural paintings. NDT E Int. 2012, 49, 40–46. [Google Scholar] [CrossRef]
- Grinzato, E.; Bison, P.G.; Marinetti, S. Monitoring of ancient buildings by the thermal method. J. Cult. Herit. 2002, 3, 21–29. [Google Scholar] [CrossRef]
- Spodek, J.; Rosina, E. Application of infrared thermography to historic building investigation. J. Archit. Conserv. 2009, 15, 65–81. [Google Scholar] [CrossRef]
- Moropoulou, A.; Avdelidis, N.P.; Aggelakopoulou, E.; Griniezakis, S.; Koui, M.; Aggelopoulos, A.; Karmis, P.; Uzunoglou, N.K. Examination of plastered mosaic surfaces using NDT techniques. J. Insight 2001, 43, 241–243. [Google Scholar]
- Brooke, C. Thermal Imaging for the Archaeological Investigation of Historic Buildings. Remote Sensing 2018, 10, 1401. [Google Scholar] [CrossRef] [Green Version]
- Maldague, X. Theory and Practice of Infrared Technology for Nondestructive Testing; John Wiley & Sons, Inc.: New York, NY, USA, 2001. [Google Scholar]
- Avdelidis, N.P.; Almond, D.P.; Dobbinson, A.; Hawtin, B.C. Pulse thermography: Philosophy, qualitative and quantitative analysis on certain aircraft applications. Insight 2006, 48, 286–289. [Google Scholar] [CrossRef]
- Washburn, E. The dynamics of capillary flow. Phys. Rev. 1921, 17, 273–283. [Google Scholar] [CrossRef] [Green Version]
- Parker, W.J.; Jenkins, R.J.; Butler, C.P.; Abbott, G.L. Flash method of determining thermal diffusivity, heat capacity and thermal conductivity. J. Appl. Phys. 1961, 32, 1679–1684. [Google Scholar] [CrossRef]
- Sun, J. Pulsed thermal imaging measurement of thermal properties for thermal barrier coatings based on a multilayer heat transfer model. J. Heat Transf. 2014, 136, 1–9. [Google Scholar] [CrossRef]
- Sun, J.; Tao, N. Thermal property measurement for thermal barrier coatings using pulsed thermal imaging–multilayer analysis method. In AIP Conference Proceedings; AIP Publishing LLC: New York, NY, USA, 2016; Volume 1706, p. 100004. [Google Scholar]
- Tao, N.; Wang, C.; Zhang, C.; Sun, J. Quantitative measurement of cast metal relics by pulsed thermal imaging. Quant. Infrared Thermogr. J. 2020, 19, 27–40. [Google Scholar] [CrossRef]
- Tao, N.; Li, X.; Sun, J. Simultaneous measurement of thermal conductivity and heat capacity by flash thermal imaging methods. Rev. Sci. Instrum. 2017, 88, 064903. [Google Scholar] [CrossRef]
- Tavman, I. Effective thermal conductivity of granular porous materials. Int. Commun. Heat Mass Transf. 1996, 23, 169–176. [Google Scholar] [CrossRef]
- Pietrak, K.; Wiśniewski, T. A review of models for effective thermal conductivity of composite materials. J. Power Technol. 2015, 95, 14. [Google Scholar]
- Maxwell, J. A Treatise on Electricity and Magnetism, 3rd ed.; Clarendon Press: Oxford, UK, 1904. [Google Scholar]
- Krupiczka, R. Analysis of thermal conductivity in granular materials. Int. Chem. Eng. 1967, 7, 122–144. [Google Scholar]
- Hasselman, D.; Johnson, L. Effective thermal conductivity of composites with interfacial thermal barrier resistance. J. Compos. Mater. 1986, 21, 1011–1013. [Google Scholar] [CrossRef]
- Ghauman, B.; Lal, R. Thermal conductivity, thermal diffusivity, and thermal capacity of some Nigerian soils. Soil Sci. 1985, 139, 74–80. [Google Scholar] [CrossRef]
- Abu-Hamdeh, N.; Khdair, A.; Reeder, R. A comparison of two methods used to evaluate thermal conductivity for some soils. Int. J. Heat Mass Transf. 2001, 44, 1073–1078. [Google Scholar] [CrossRef]
- Huang, J.; Zheng, Y.; Li, H. Study of internal moisture condensation for the conservation of stone cultural heritage. J. Cult. Herit. 2022, 56, 1–9. [Google Scholar] [CrossRef]
Figure 1.
Illustration of the research process.

Figure 2.
Distribution of sandstone-, marble-, and granite-related heritage sites in China.

Figure 3.
Representative heritage sites of the three types of stone in China (a) Yungang Grottoes, (b) Lingquan Temple Grottoes, (c) Luoyang Bridge.
Figure 3.
Representative heritage sites of the three types of stone in China (a) Yungang Grottoes, (b) Lingquan Temple Grottoes, (c) Luoyang Bridge.

Figure 4.
Samples of the three stone materials after cutting.

Figure 5.
Illustration of one freeze–thaw cycle and the research methods applied to the sample.

Figure 6.
Temperature variation at the back surfaces for a single-layer sample.

Figure 7.
Illustration of the logarithmic 1st derivative of surface temperature (a) for a two-layer material with a semi-infinite second layer under instantaneous surface heating, and (b) for the second layer with a different thermal effusivity.
Figure 7.
Illustration of the logarithmic 1st derivative of surface temperature (a) for a two-layer material with a semi-infinite second layer under instantaneous surface heating, and (b) for the second layer with a different thermal effusivity.

Figure 8.
Experimental setups for (a) transmission and (b) reflection IRT measurements.

Figure 9.
Sample surface observed under stereomicroscope.

Figure 10.
Mass change of three types of samples after different freeze–thaw cycles.

Figure 11.
Intruding mercury volume with pressure (a,c,e) and the first derivative of pore volume with logarithmic pore diameter (b,d,f), for sandstone (S), marble (M), and granite (G).
Figure 11.
Intruding mercury volume with pressure (a,c,e) and the first derivative of pore volume with logarithmic pore diameter (b,d,f), for sandstone (S), marble (M), and granite (G).


Figure 12.
Thermal response in (a) transmission (single-layer material) geometry and (b) reflection geometry (two-layer material).
Figure 12.
Thermal response in (a) transmission (single-layer material) geometry and (b) reflection geometry (two-layer material).

Figure 13.
Variation of (a) thermal diffusivity (b) thermal effusivity and (c) thermal conductivity (solid line) with different freeze–thaw cycles, and the trend (dash line).
Figure 13.
Variation of (a) thermal diffusivity (b) thermal effusivity and (c) thermal conductivity (solid line) with different freeze–thaw cycles, and the trend (dash line).


Table 1.
Mineral components of the stones and their proportions by X-ray diffraction.
| Stone Type | Albite Low-Na (AlSi3O8) (Wt%) | Quartz Low, syn-SiO2 (Wt%) | Calcite, syn-CaCO3 (Wt%) | Clinochlore IIb-4 (Wt%) | Muscovite-2M1 (Wt%) |
|---|---|---|---|---|---|
| S | 71.8 | 18.0 | 4.7 | 2.2 | 3.3 |
| M | - | - | 100 | - | - |
| G | 72.9 | 27.1 | - | - | - |
Note: “S” = Sandstone; “M” = Marble; “G” = Granite; “-” = not present.
Table 2.
Mercury intrusion pore sizing test.
| Sample ID | Interparticle Porosity (%) | Intraparticle Porosity (%) | Total Porosity (%) | Pore Tortuosity |
|---|---|---|---|---|
| S-0 | 0.0038 | 0.2559 | 0.2597 | 2.2271 |
| S-4 | 0.0066 | 0.9049 | 0.9115 | 2.2197 |
| M-0 | 0.0129 | 0.0046 | 0.0175 | 2.2298 |
| M-4 | 0.0024 | 0.0423 | 0.0447 | 2.2295 |
| G-0 | 0.0012 | 0.0278 | 0.0290 | 2.2297 |
| G-4 | 0.0128 | 0.4497 | 0.4625 | 2.2248 |
Disclaimer/Publisher’s Note: The statements, opinions and data contained in all publications are solely those of the individual author(s) and contributor(s) and not of MDPI and/or the editor(s). MDPI and/or the editor(s) disclaim responsibility for any injury to people or property resulting from any ideas, methods, instructions or products referred to in the content. |
© 2023 by the authors. Licensee MDPI, Basel, Switzerland. This article is an open access article distributed under the terms and conditions of the Creative Commons Attribution (CC BY) license (https://creativecommons.org/licenses/by/4.0/).
Share and Cite
MDPI and ACS Style
Zhang, J.; Yang, X.; Chen, B.; Wang, X.; Hu, G.; Tao, N.; Sun, J. Study of the Freeze–Thaw Weathering’s Influence on Thermal Properties of Stone Artifacts. Atmosphere 2023, 14, 666. https://doi.org/10.3390/atmos14040666
AMA Style
Zhang J, Yang X, Chen B, Wang X, Hu G, Tao N, Sun J. Study of the Freeze–Thaw Weathering’s Influence on Thermal Properties of Stone Artifacts. Atmosphere. 2023; 14(4):666. https://doi.org/10.3390/atmos14040666
Chicago/Turabian StyleZhang, Jia’nan, Xue Yang, Beichen Chen, Xiangyu Wang, Gangbo Hu, Ning Tao, and Jiangang Sun. 2023. "Study of the Freeze–Thaw Weathering’s Influence on Thermal Properties of Stone Artifacts" Atmosphere 14, no. 4: 666. https://doi.org/10.3390/atmos14040666
Note that from the first issue of 2016, this journal uses article numbers instead of page numbers. See further details here.