Article

Characteristics, Ozone Formation Potential and Sources of VOCs in Shandong Province, Eastern China

1
Shandong Ecology and Monitoring Center, Jinan 250101, China
2
China National Environment Monitoring Center, Beijing 100012, China
3
Hubei Key Laboratory of Biomass Resource Chemistry and Environmental Biotechnology, School of Resource and Environmental Sciences, Wuhan University, Wuhan 430079, China
*
Authors to whom correspondence should be addressed.
Atmosphere 2023, 14(4), 667; https://doi.org/10.3390/atmos14040667
Submission received: 14 January 2023 / Revised: 11 March 2023 / Accepted: 29 March 2023 / Published: 31 March 2023
(This article belongs to the Special Issue Industrial Air Pollution: Emission, Management and Policy)

Abstract

:
Between 9 July and 19 August 2016, the air concentrations of 57 volatile organic compounds (VOCs) were measured in Shandong Province, eastern China. Seven sampling sites representing urban, coastal and background sites were selected for sampling. The measured data were employed to investigate the VOCs’ characteristics, ozone formation potential, and main sources. During the sampling period, the concentrations of the VOCs ranged between 15.3 and 883 ppbv, with a mean of 139 ppbv. The most severely polluted city was Zibo (833 ppbv), followed by Jinan (33.5 ppbv) and Qingdao (32.8 ppbv). Propane was the most abundant species in all of the sampling sites, with a concentration range of 1.05–9.86 ppbv. Ethene, i-butane, 1-butene, cis-2-butene, n-butane, i-pentane, n-pentane, benzene and toluene were the predominant species in both the urban and coastal sites. Propylene equivalent concentrations (Pro-Equiv) and maximum incremental reactivity (MIR) were employed to assess the reactivity and contribution of each species to the photochemical ozone formation. The results showed that alkenes and aromatics were the most active species performing a key function in the ozone formation, accounting for 43.9–90.7% of the Pro-Equiv and 41.0–93% of the ozone formation potential (OFP). The ratios of ethylbenzene and m/p-xylene were calculated, and the results showed that local emissions were the main sources. Gasoline exhaust/fuel evaporation, industry process/solvent usage, diesel exhaust/petrochemical emission and coal burning were the dominant sources of VOCs in Shandong Province.

1. Introduction

In recent years, the ozone pollution has become one of China’s environment challenges in summer [1,2], especially in the Beijing-Tianjin-Hebei region, where the annual ozone concentration reached 196 μg/m3 in 2019, exceeding the Chinese National Air Quality Standard Grade (160 μg/m3) [3]. Ozone pollution has received considerable attention because of its adverse effects on human health, with ozone–related health impacts in 338 Chinese cities increasing by more than 60% during 2015–2020 [4]. Moreover, ozone pollution has negative effects on crops [5]. The global ozone concentration is still increasing, and the worldwide average annual concentration increased from 47 ppbv in 2000 to 52 ppbv in 2019, with an increasing rate of 0.25 ppbv/yr [6]. VOCs are precursors of tropospheric ozone and play an important role in atmospheric photochemical reactions [7,8,9]; however, recent studies have shown that controlling the emissions of industrial VOCs is not enough to reduce ozone pollution [10]. Although a significant reduction in the VOCs was achieved, ozone pollution during autumn in the Pearl River Delta was more severe in 2019 than in 2018 [11]. Anthropogenic VOCs come from a variety of sources; in addition to industrial emissions, motor vehicle exhaust, combustion, product volatilization and landfill release are all important emission sources [12,13,14].
Shandong Province is one of the most urbanized and industrialized regions in eastern China, located on the lower section of the Yellow River in the northeast section of the east coast of China. Over the past few decades, it has undergone rapid economic development and industrialization; at the same time, the energy consumption and traffic volumes have rapidly increased, as is the case in most areas of China, and it has undergone serious deterioration of ozone pollution [15,16]. A big sampling campaign was conducted in the summer of 2016 at seven heavily ozone-polluted sites in Shandong Province. The objectives of this study are as follows: (1) to analyze the ambient VOCs’ concentrations and characteristics in Shandong Province during that time; (2) to estimate the contribution of VOCs to the ozone formation potential (OFP); (3) to identify the major sources of VOCs and provide historical data for evaluating the control effect of VOCs.

2. Materials and Methods
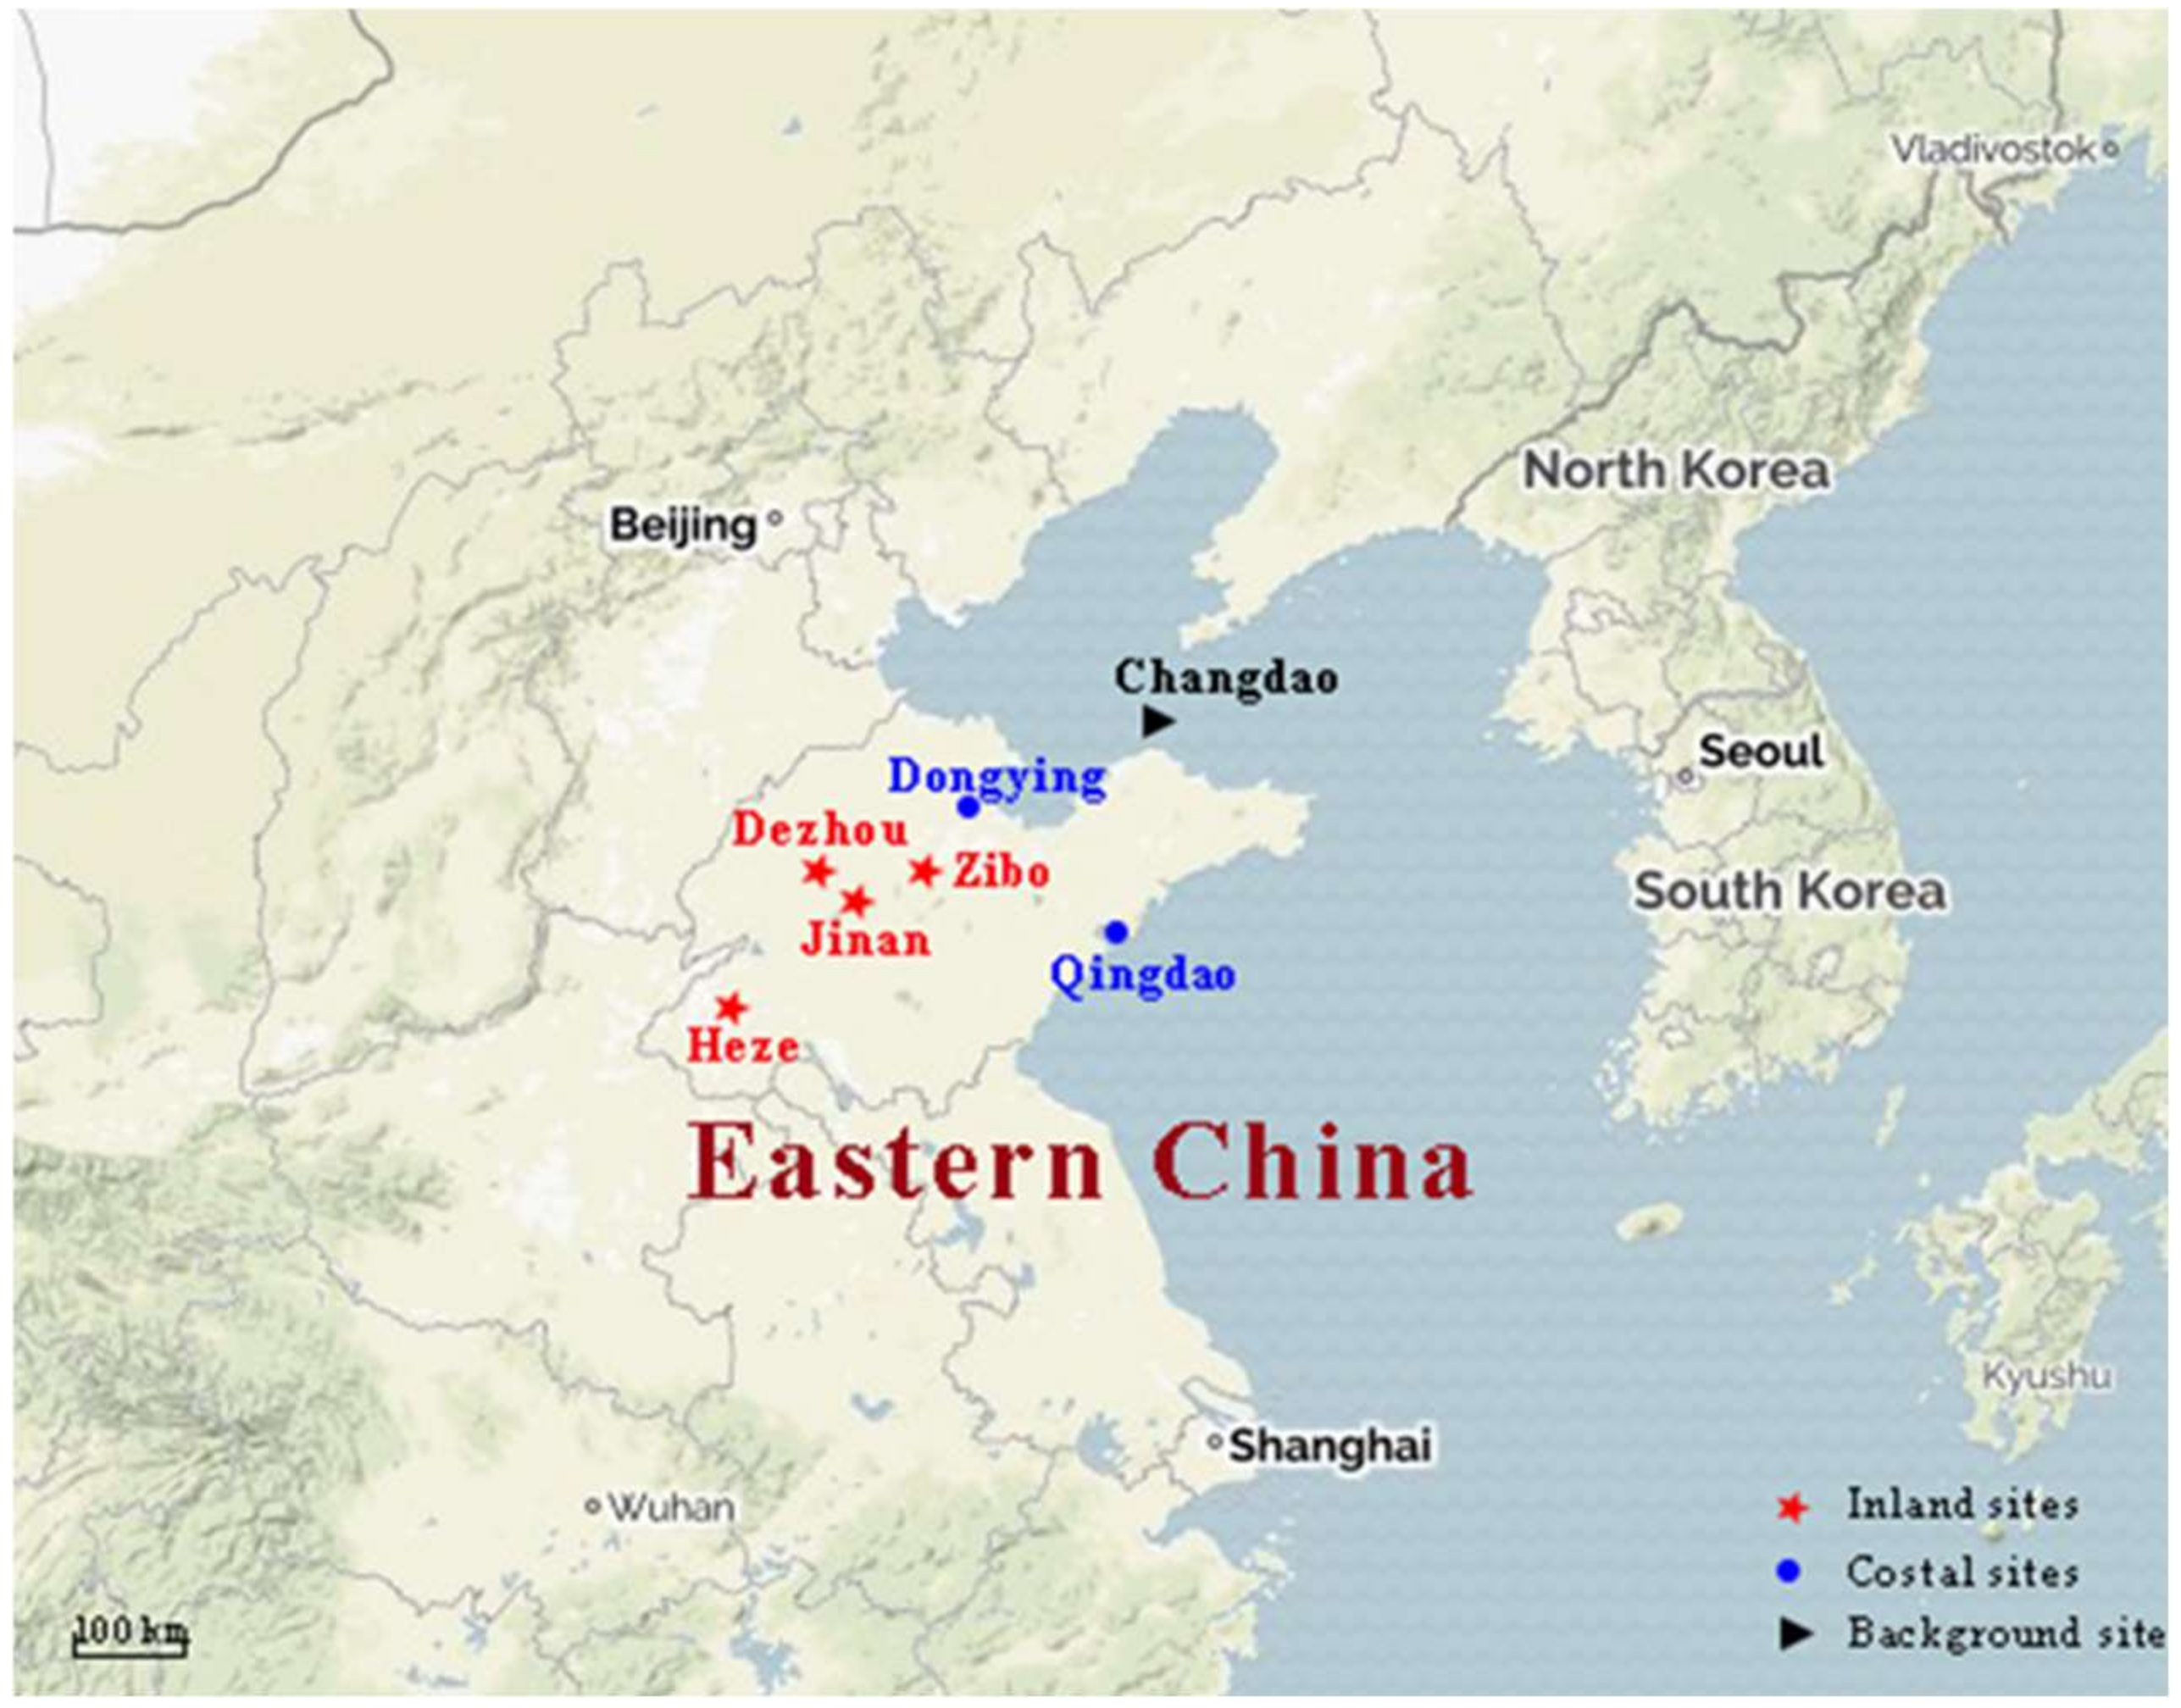
2.1. Sampling Sites

The measurement was conducted at 7 sampling sites between 9 July and 19 August 2016. The locations of these sampling sites are shown in Figure 1. The seven sampling sites Jinan (JN), Zibo (ZB), Dezhou (DZ), Heze (HZ), Qingdao (QD), Dongying (DY) and Changdao (CD) comprised inland and coastal sites, as well as commercial and industrial areas. JN (37.4° E, 116.3° N) is situated in the middle of Shandong Province, is the capital city of Shandong Province, and the sampling site is adjacent to traffic roads, a residential area and commercial areas; ZB (36.8° E, 118.0° N) is an industrial city with many large factories, such as a petroleum refinery, petrochemical complex and pharmacy, and it has recently experienced severe haze pollution [2]; DZ (37.4° E, 116.3° N) belongs to the Beijing–Tianjin–Hebei region; HZ is located at the southwest of Shandong Province. The above four cities are selected as the urban sites. QD (36.0° E, 120.0° N) is located in the southeast of Shandong Peninsula, bordering the Yellow Sea, and it is the economic center of Shandong Province; DY is located in the northeast of the Shandong Peninsula, bordering the Bohai Sea, it is abundant in petroleum and many petroleum refinery factories are located in this area; CD (38.1° E, 120.7° N) is the State background, and was selected as the background site in this study.

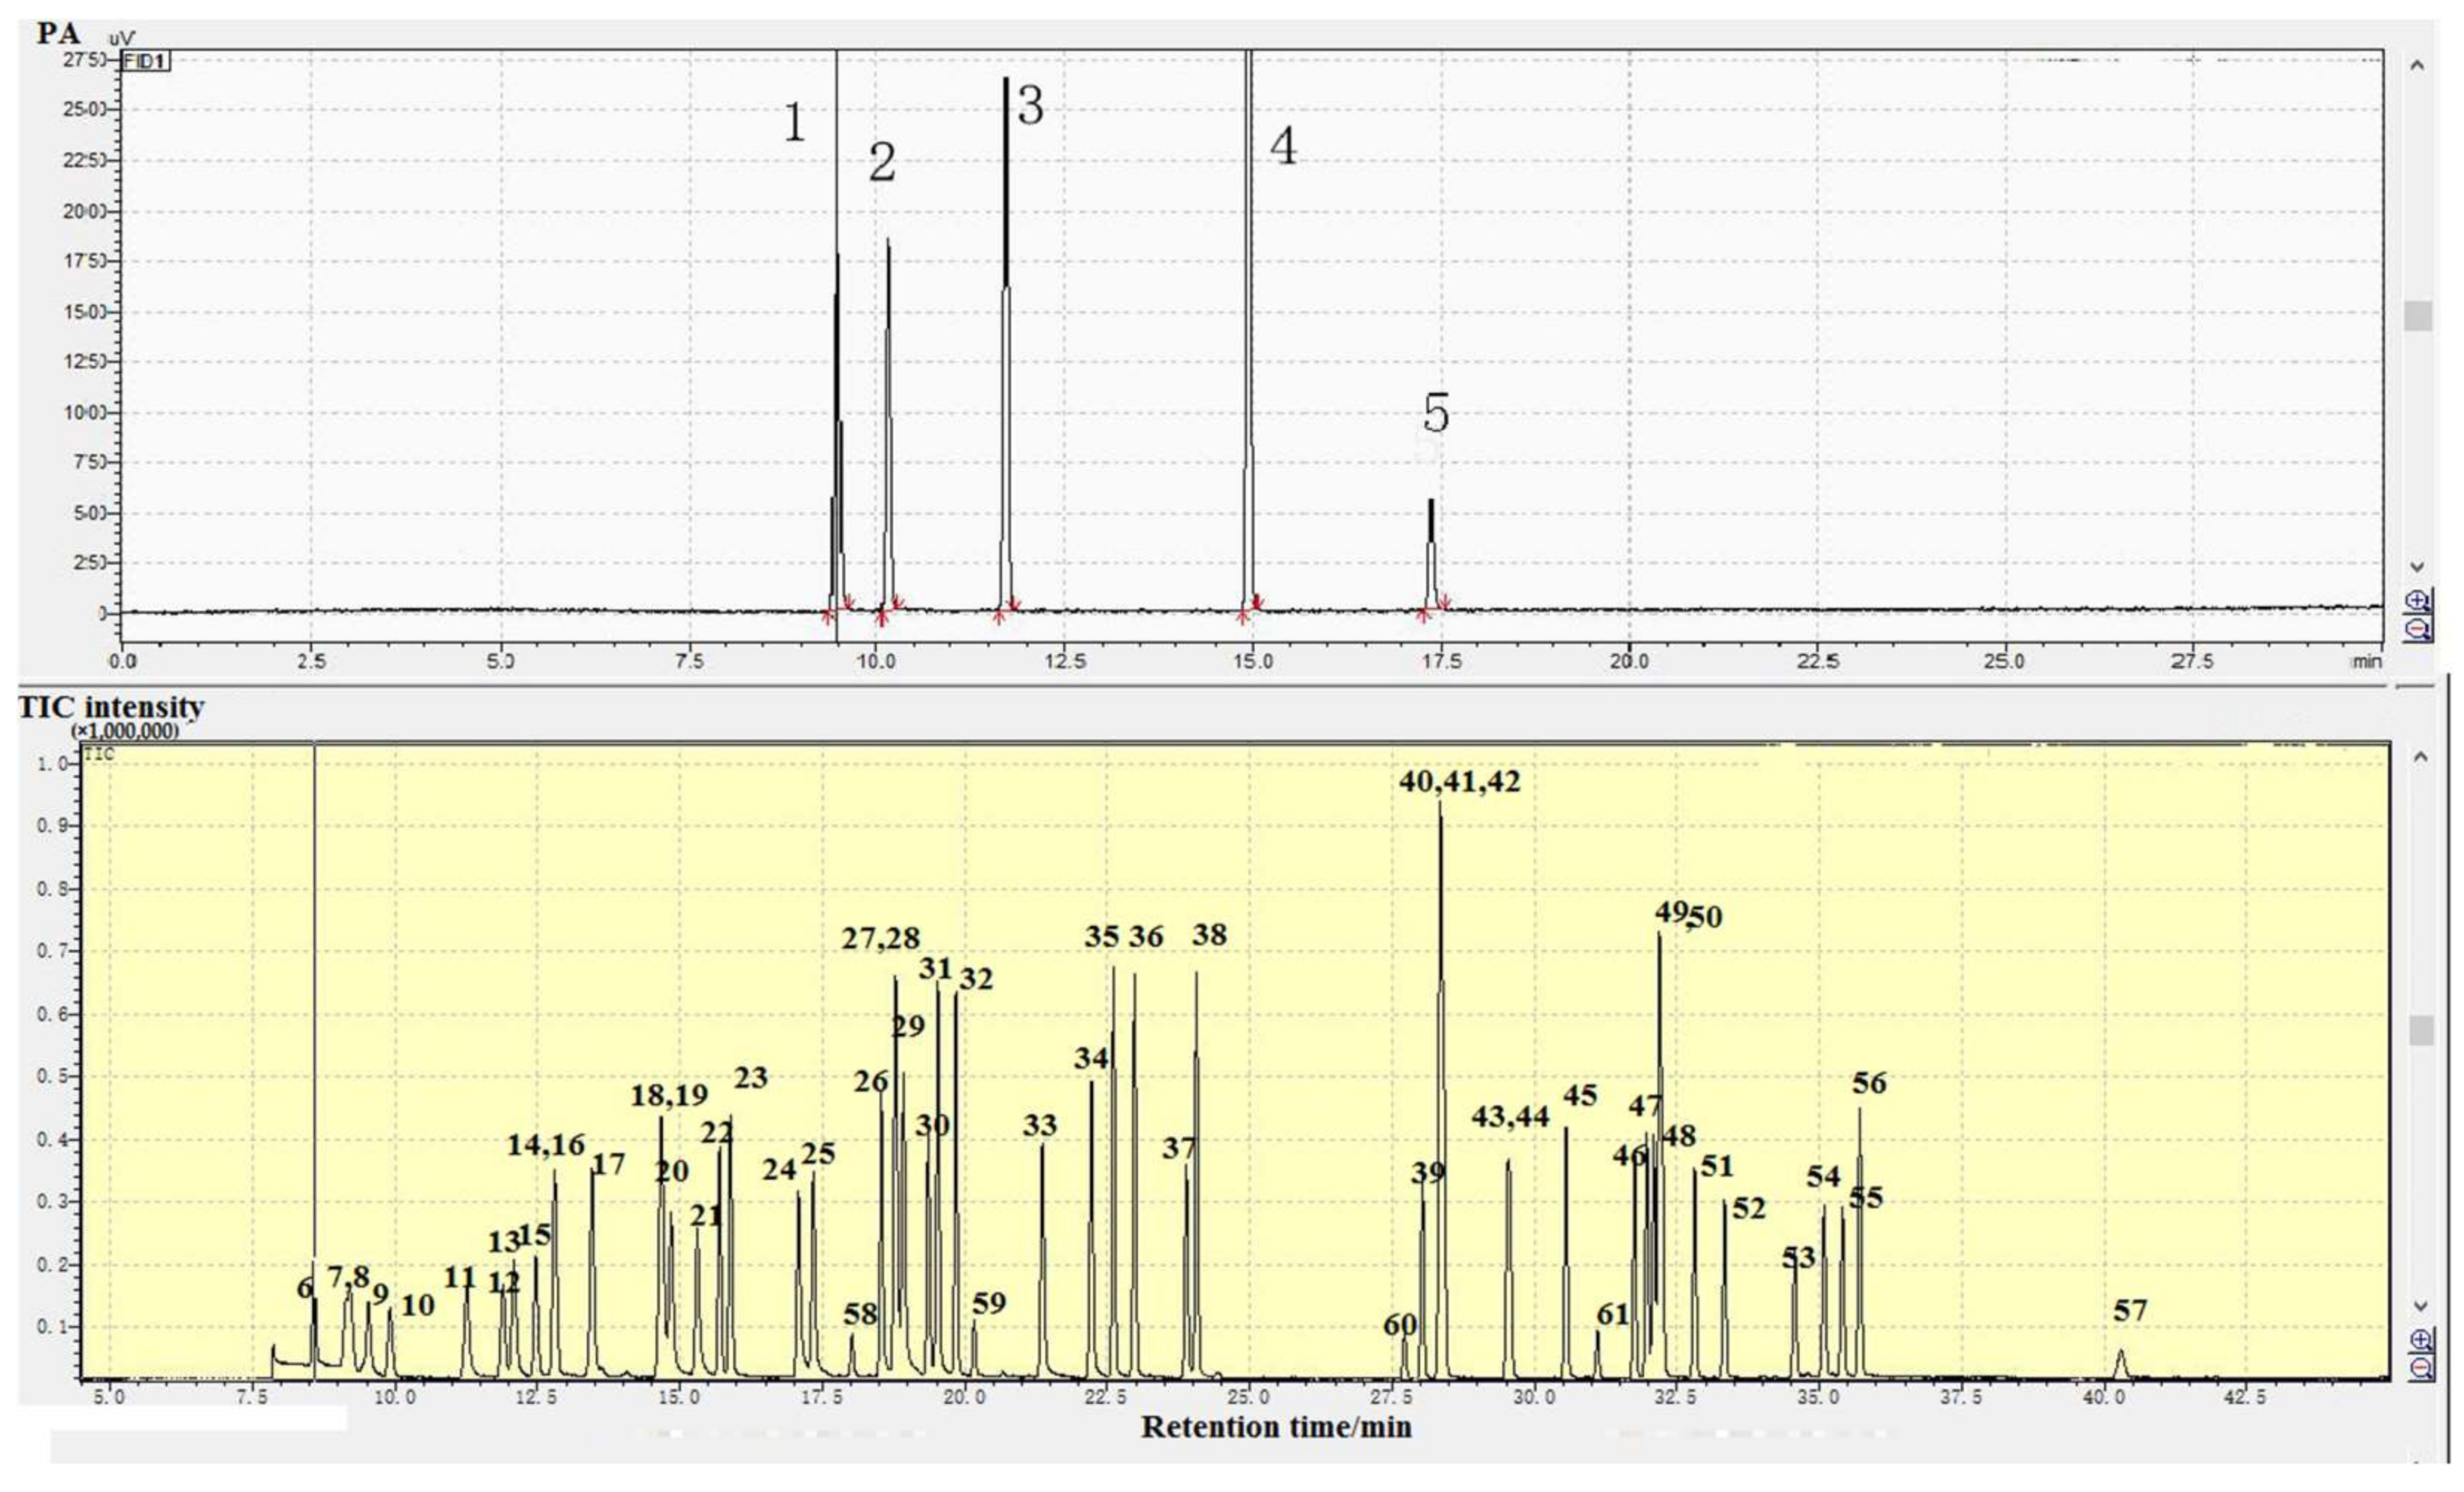
2.2. Sampling and Analysis

Ambient air samples were collected by clean evacuated 3.2 L deactivated stainless canisters placed on the rooftop of a monitoring station (approximately 13 m above the ground-level) to avoid local area emissions contamination. The canisters were cleaned three times by high purity nitrogen in order to avoid polar VOCs pollution, the canister was cleaned at 60 °C, and high purity nitrogen was passed throw water to increase the humidity before being flush into the canister; finally, the canister was evacuated to <10 mTorr. Thereafter, they were placed in an area free of VOC contamination before sampling. A flow controller was connected to the canister to keep the airflow rate constant. The sampling time for each canister was approximately 1 h. Three canister samples were collected daily, at 8:30, 13:30 and 17:30, at each site.
After sampling, the samples were delivered to the lab for chemical analysis within two weekdays. The VOCs were concentrated and purified using three steps of cryogenic pre-concentration (Model 7200, Entech Instruments, Simi Valley, CA, USA). The first cryogenic trap was filled with glass beads and TENAX, which were previously cooled to −120 °C. Each 100-mL aliquot from the sampling canister was drawn into the trap for pre-concentration. The first cryogenic trap was thereafter heated to 20 °C, and a stream of high purity He carried the trapped VOCs into the second cryogenic trap. The second cryogenic trap was cooled down to −50 °C to trap the target compounds. These compounds were thereafter heated to 180 °C. The VOCs were then transferred to the third cryogenic trap for concentration. Finally, the third cryogenic trap was heated to 90 °C and the VOCs were transferred to a gas chromatograph (GC) that employs three column/detector combinations. After concentration and desorption, all of the volatile organic compounds were carried to a HP-1 column (60 m × 0.32 mm × 1.8 μm) by carrier gas for primary separation; during this step, the HP-1 column was connected with an empty column by a splitter, and when the aimed samples flowed out of the empty column, VOCs will be detected by the MS detector. Light hydrocarbons, such as the C2–C4 species, cannot be separated completely by HP-1 column; when ethane flowed out from the HP-1 column, they were transferred to a polar GS-GASPRO column (30 m × 0.32 μm). In this step, the first HP-1 column was turned to connect with a GS-GASPRO column by a splitter for further separation, and the C2–C4 species can be separated by the polar column, the GS-GASPRO column was connected with a flame ionization detector (FID), and the C2–C4 species were quantified by FID. When all of the C2–C4 species flowed out from the HP-1 column, the HP-1 column resumed the beginning status, and the C5–C12 species were passed through an empty column, were detected and quantified by MS and for accurate quantification. The GC oven was initially maintained at 40 °C for 3 min and raised to 50 °C at 8 °C/min held for 2 min. The temperature was then raised to 150 °C at 8 °C/min held for 10 min and to 185 °C at 15 °C/min, and held for 17 min. The flow of the carrier gas was set at 3.0 mL/min. The chromatography behaviors of 57 VOCs are shown in Figure 2.

2.3. Quality Assurance and Control (QA/QC)

A standard gas containing Photochemical Assessment Monitoring Stations (PAMS) standard mixture (57 VOCs) was used for the internal standard method. The TO-15 internal standard (4 components) was used during the sample analysis and standard curve establishment. A precision diluter (Entech 4700, Simi Valley, CA, USA) was used to dilute the standard mixture (1.00 ppbv, 2.00 ppbv, 4.00 ppbv, 8.00 ppbv, and 10.0 ppbv), and each 100 milliliters of the standard mixture was analyzed to obtain the calibration curve. A 4.00 ppbv standard mixture was analyzed per 20 samples to check the accuracy of the standard curve. A blank test was carried out on one of 20 cleaned canisters before sampling, and the blank test was also carried out before each batch of sample analysis to check for system contamination. The concentrations of VOCs in each blank were less than 4 times of the method detection limit (MDL). In this study, the coefficients of determination (R2) of the calibration curve all exceed 0.99 for every VOC compound. The method detection limit (MDL) ranged between 0.02 and 0.3 ppbv, and the precision of each species was within 7.2%.
The interior surfaces of the canisters used for sampling in this study are passivated by electropolishing to avoid active sites for the adsorption or decomposition of the labile VOCs, and a canister blank check was performed before the sample analysis or the high concentration sample was sampled. The analytical system may result in contamination, including carryover from the high-concentration samples or standards and solvent vapors in the laboratory. An analytical system blank was performed before the analysis and a duplicate sample was analyzed within each batch of samples.

3. Results and Discussion

3.1. Characteristics of Gaseous Pollutant

3.1.1. Characteristics of Ozone Pollution

The summer season is the typical ozone pollution period in northern China. Table 1 shows an overview of the ozone and NOx and the meteorological conditions of seven sampling sites during the observation period. During the monitoring period, high relative humidity and low temperature was observed at QD and CD, whilst DY and the other inland sites shared similar meteorological conditions. The average ozone concentration among the seven sampling sites ranged between 1 and 220 μg/m3, with a mean of 91 μg/m3, in Shandong Province. The average NOx concentration ranged between 2 and 164 mg/m3, with a mean of 29 mg/m3. The highest average ozone concentration was observed at CD (127 μg/m3), followed by DZ (107 μg/m3), QD (93 μg/m3) and JN (90 μg/m3). The ozone peaked at DY (the highest1-h average concentration was 220 μg/m3) and serious ozone pollution also occurred in CD (the highest 1-h average concentration was 217 μg/m3). Although DY and CD suffered more serious ozone pollution compared with the other sites, the weather conditions were different between CD and DY. While high temperature and low humidity meteorological parameters were observed at DY, in contrast, high humidity and low temperature was observed at CD. Previous reports found that high ozone concentrations generally occurred under high temperature and low humidity conditions and that the weather conditions did not play a decisive role in ozone formation. As depicted between DY and CD, the ozone pollution was affected by other parameters. The NOx peaked at ZB, but the ozone concentration in ZB was the lowest among the seven sampling sites, and the temperature and humidity conditions were similar to the other inland sites. This indicates that NOx and the meteorological parameters were not the most important parameters influencing the ozone formation. VOCs are precursors of the ground ozone and they may play the most important role in the ozone formation in Shandong Province.

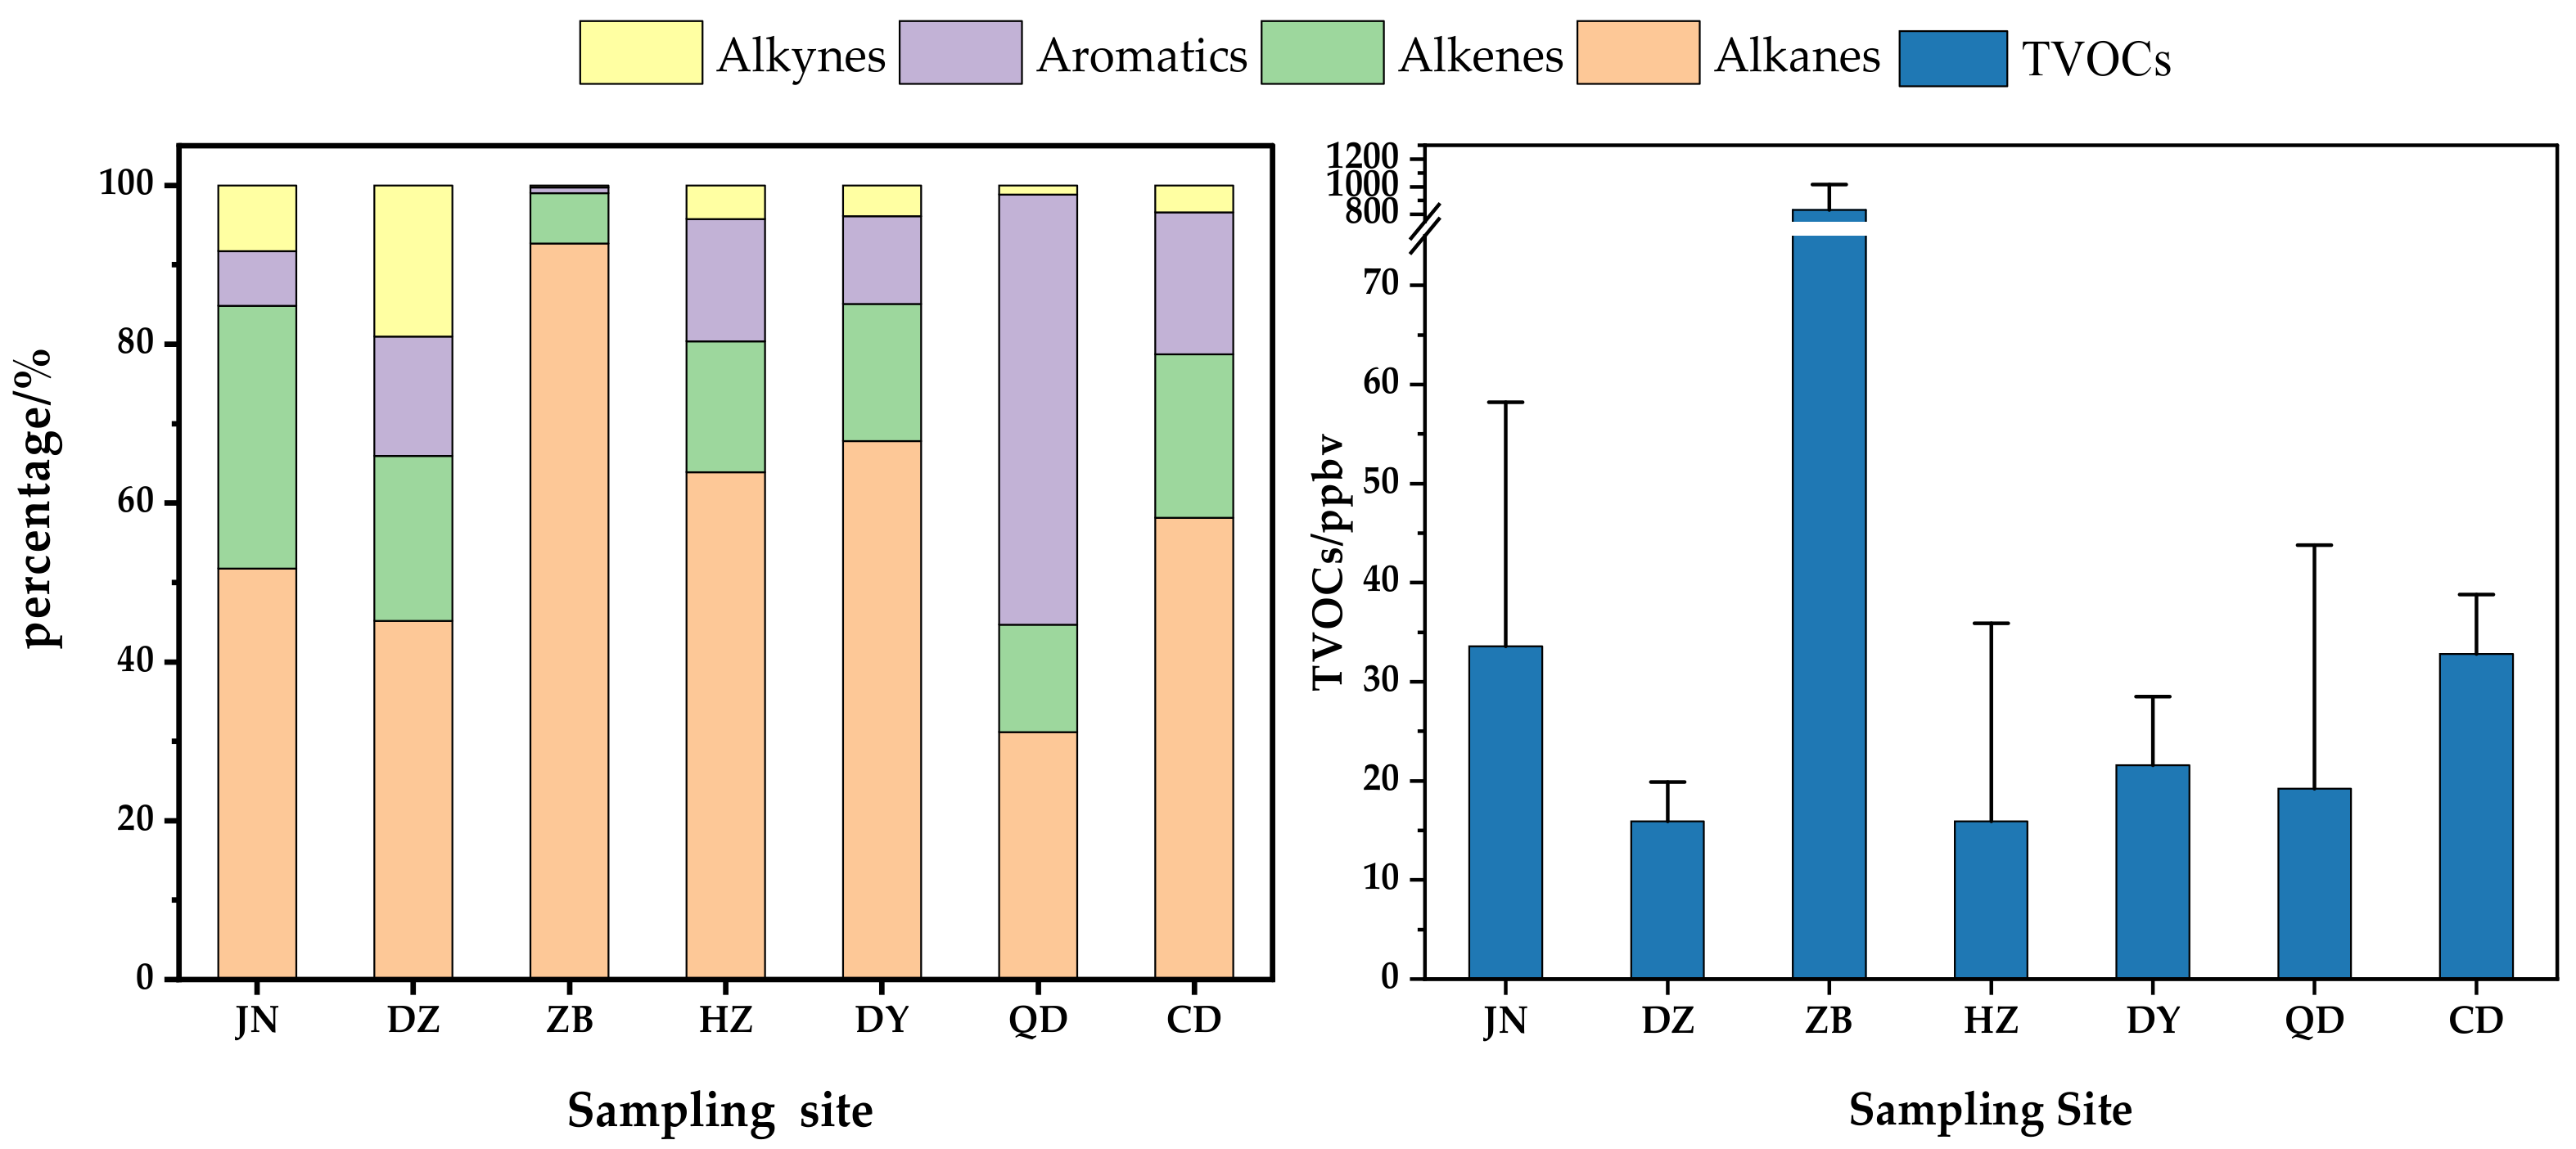
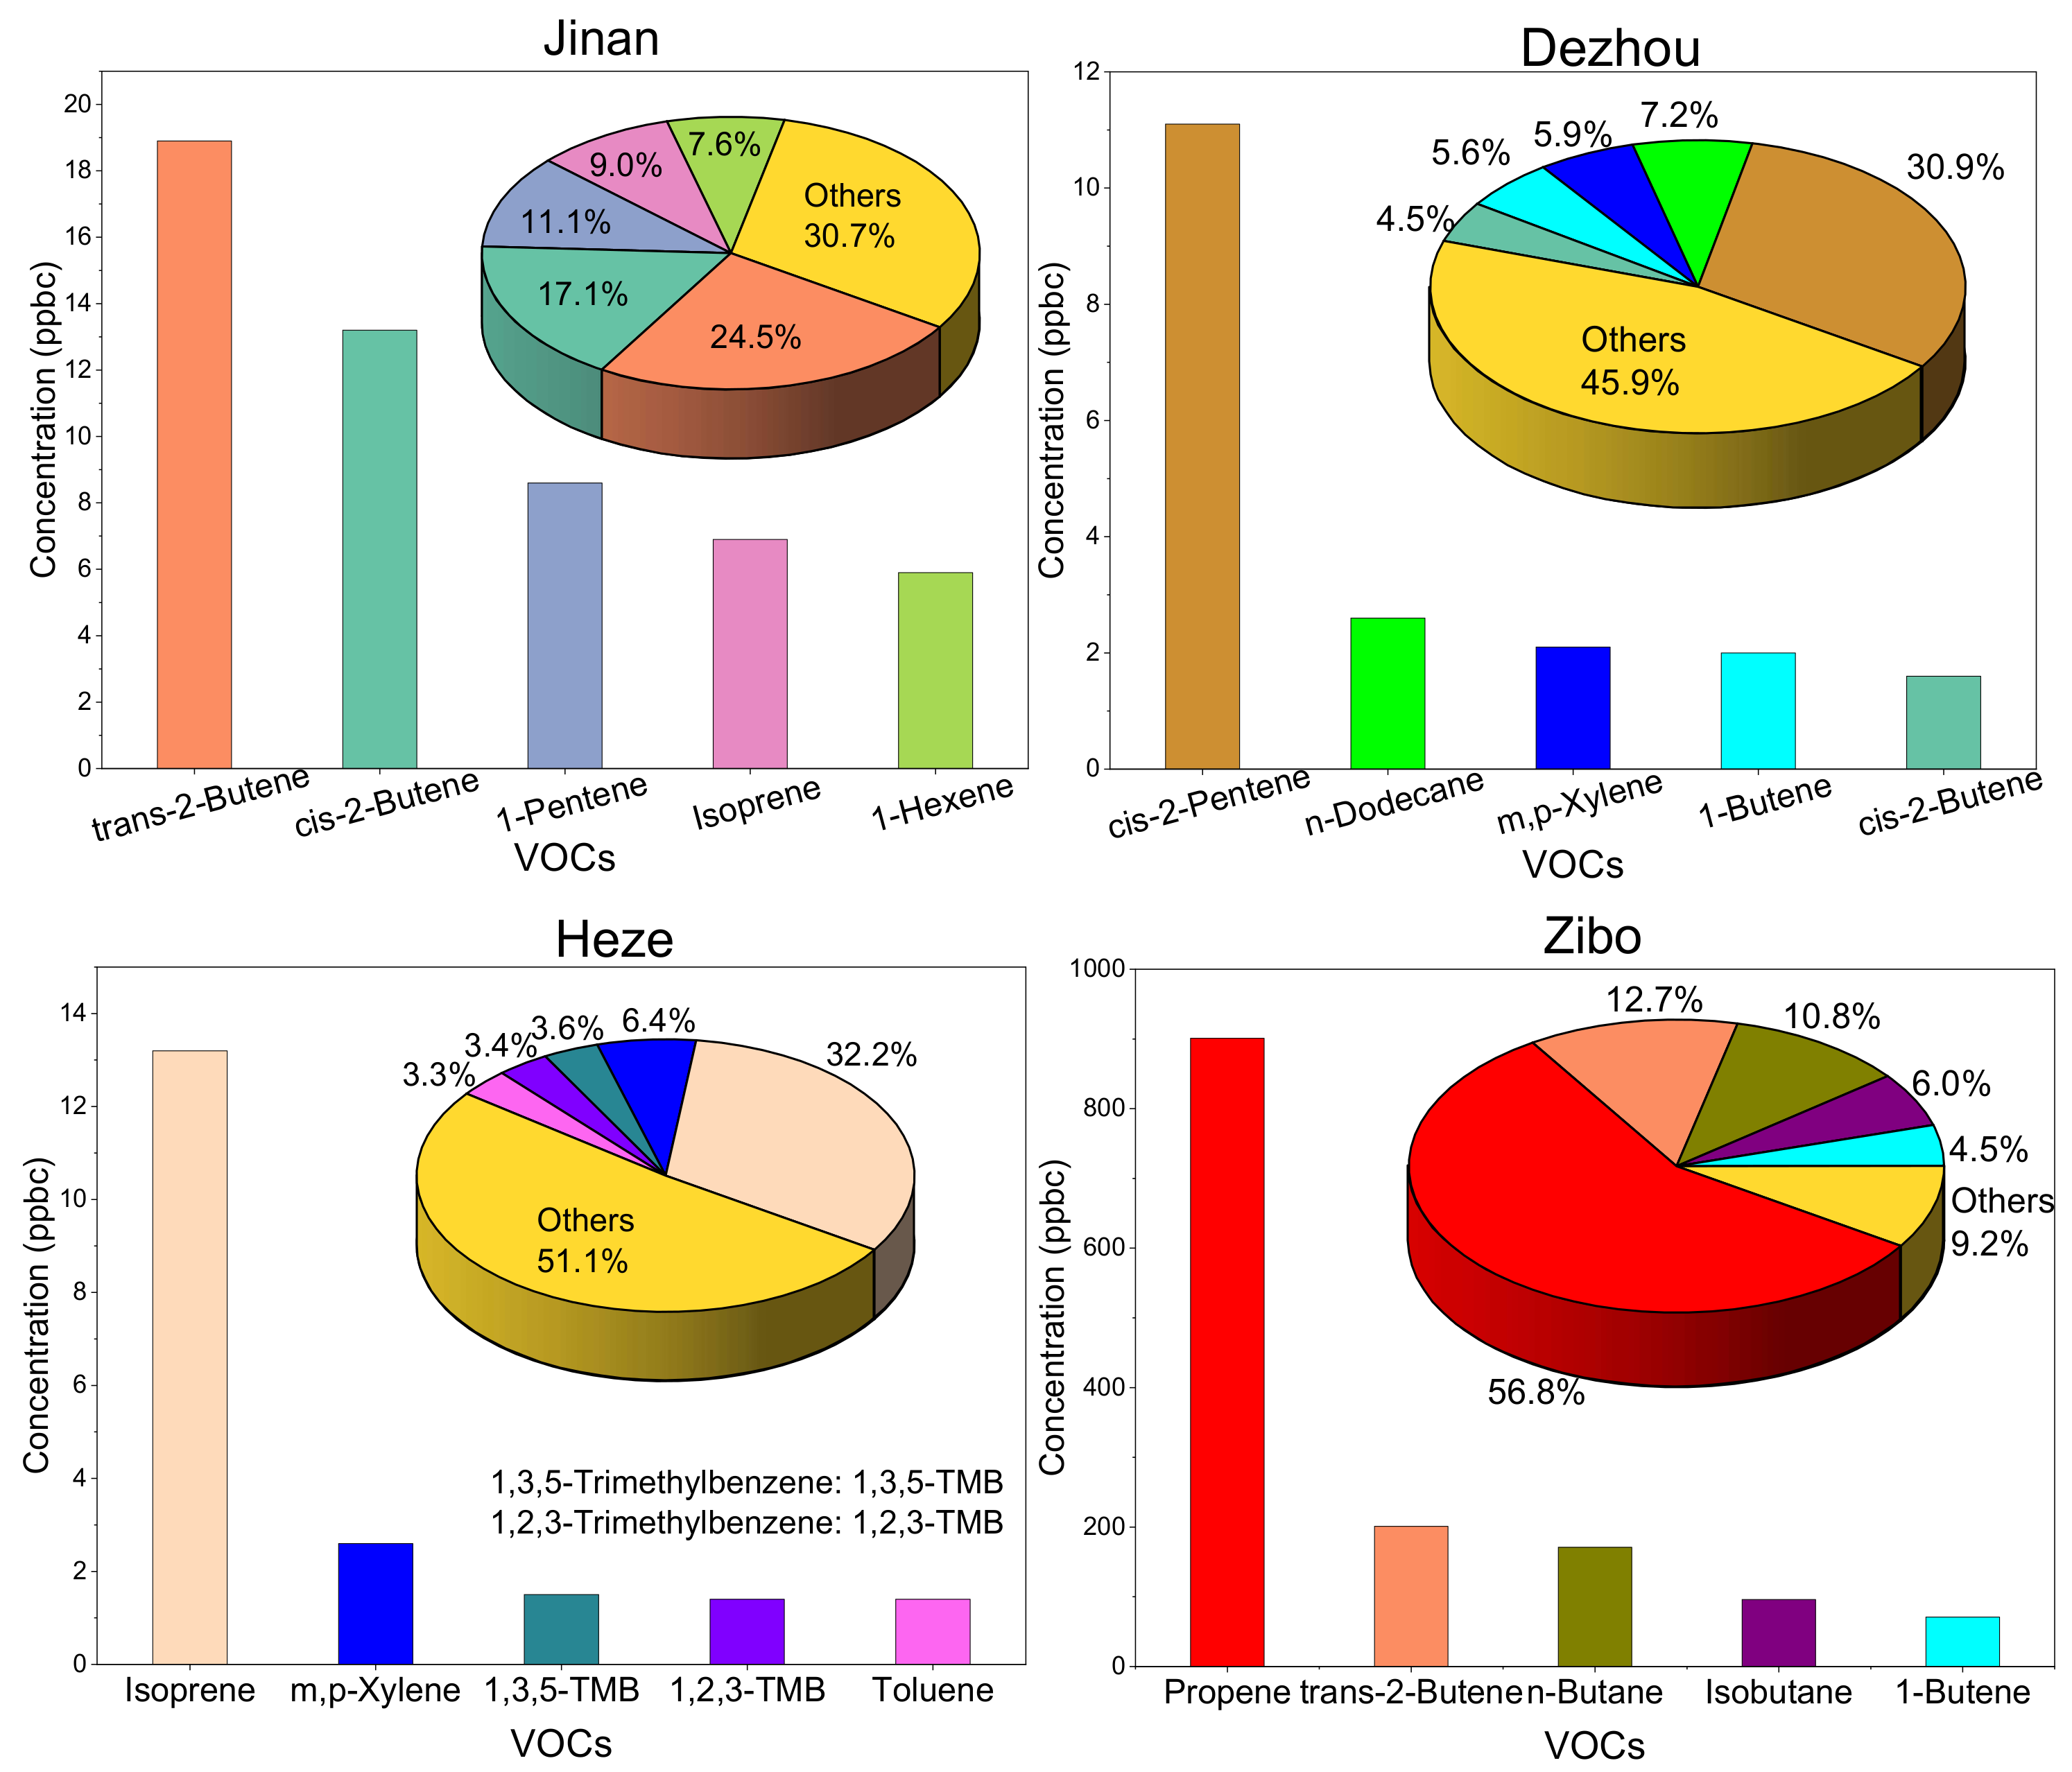
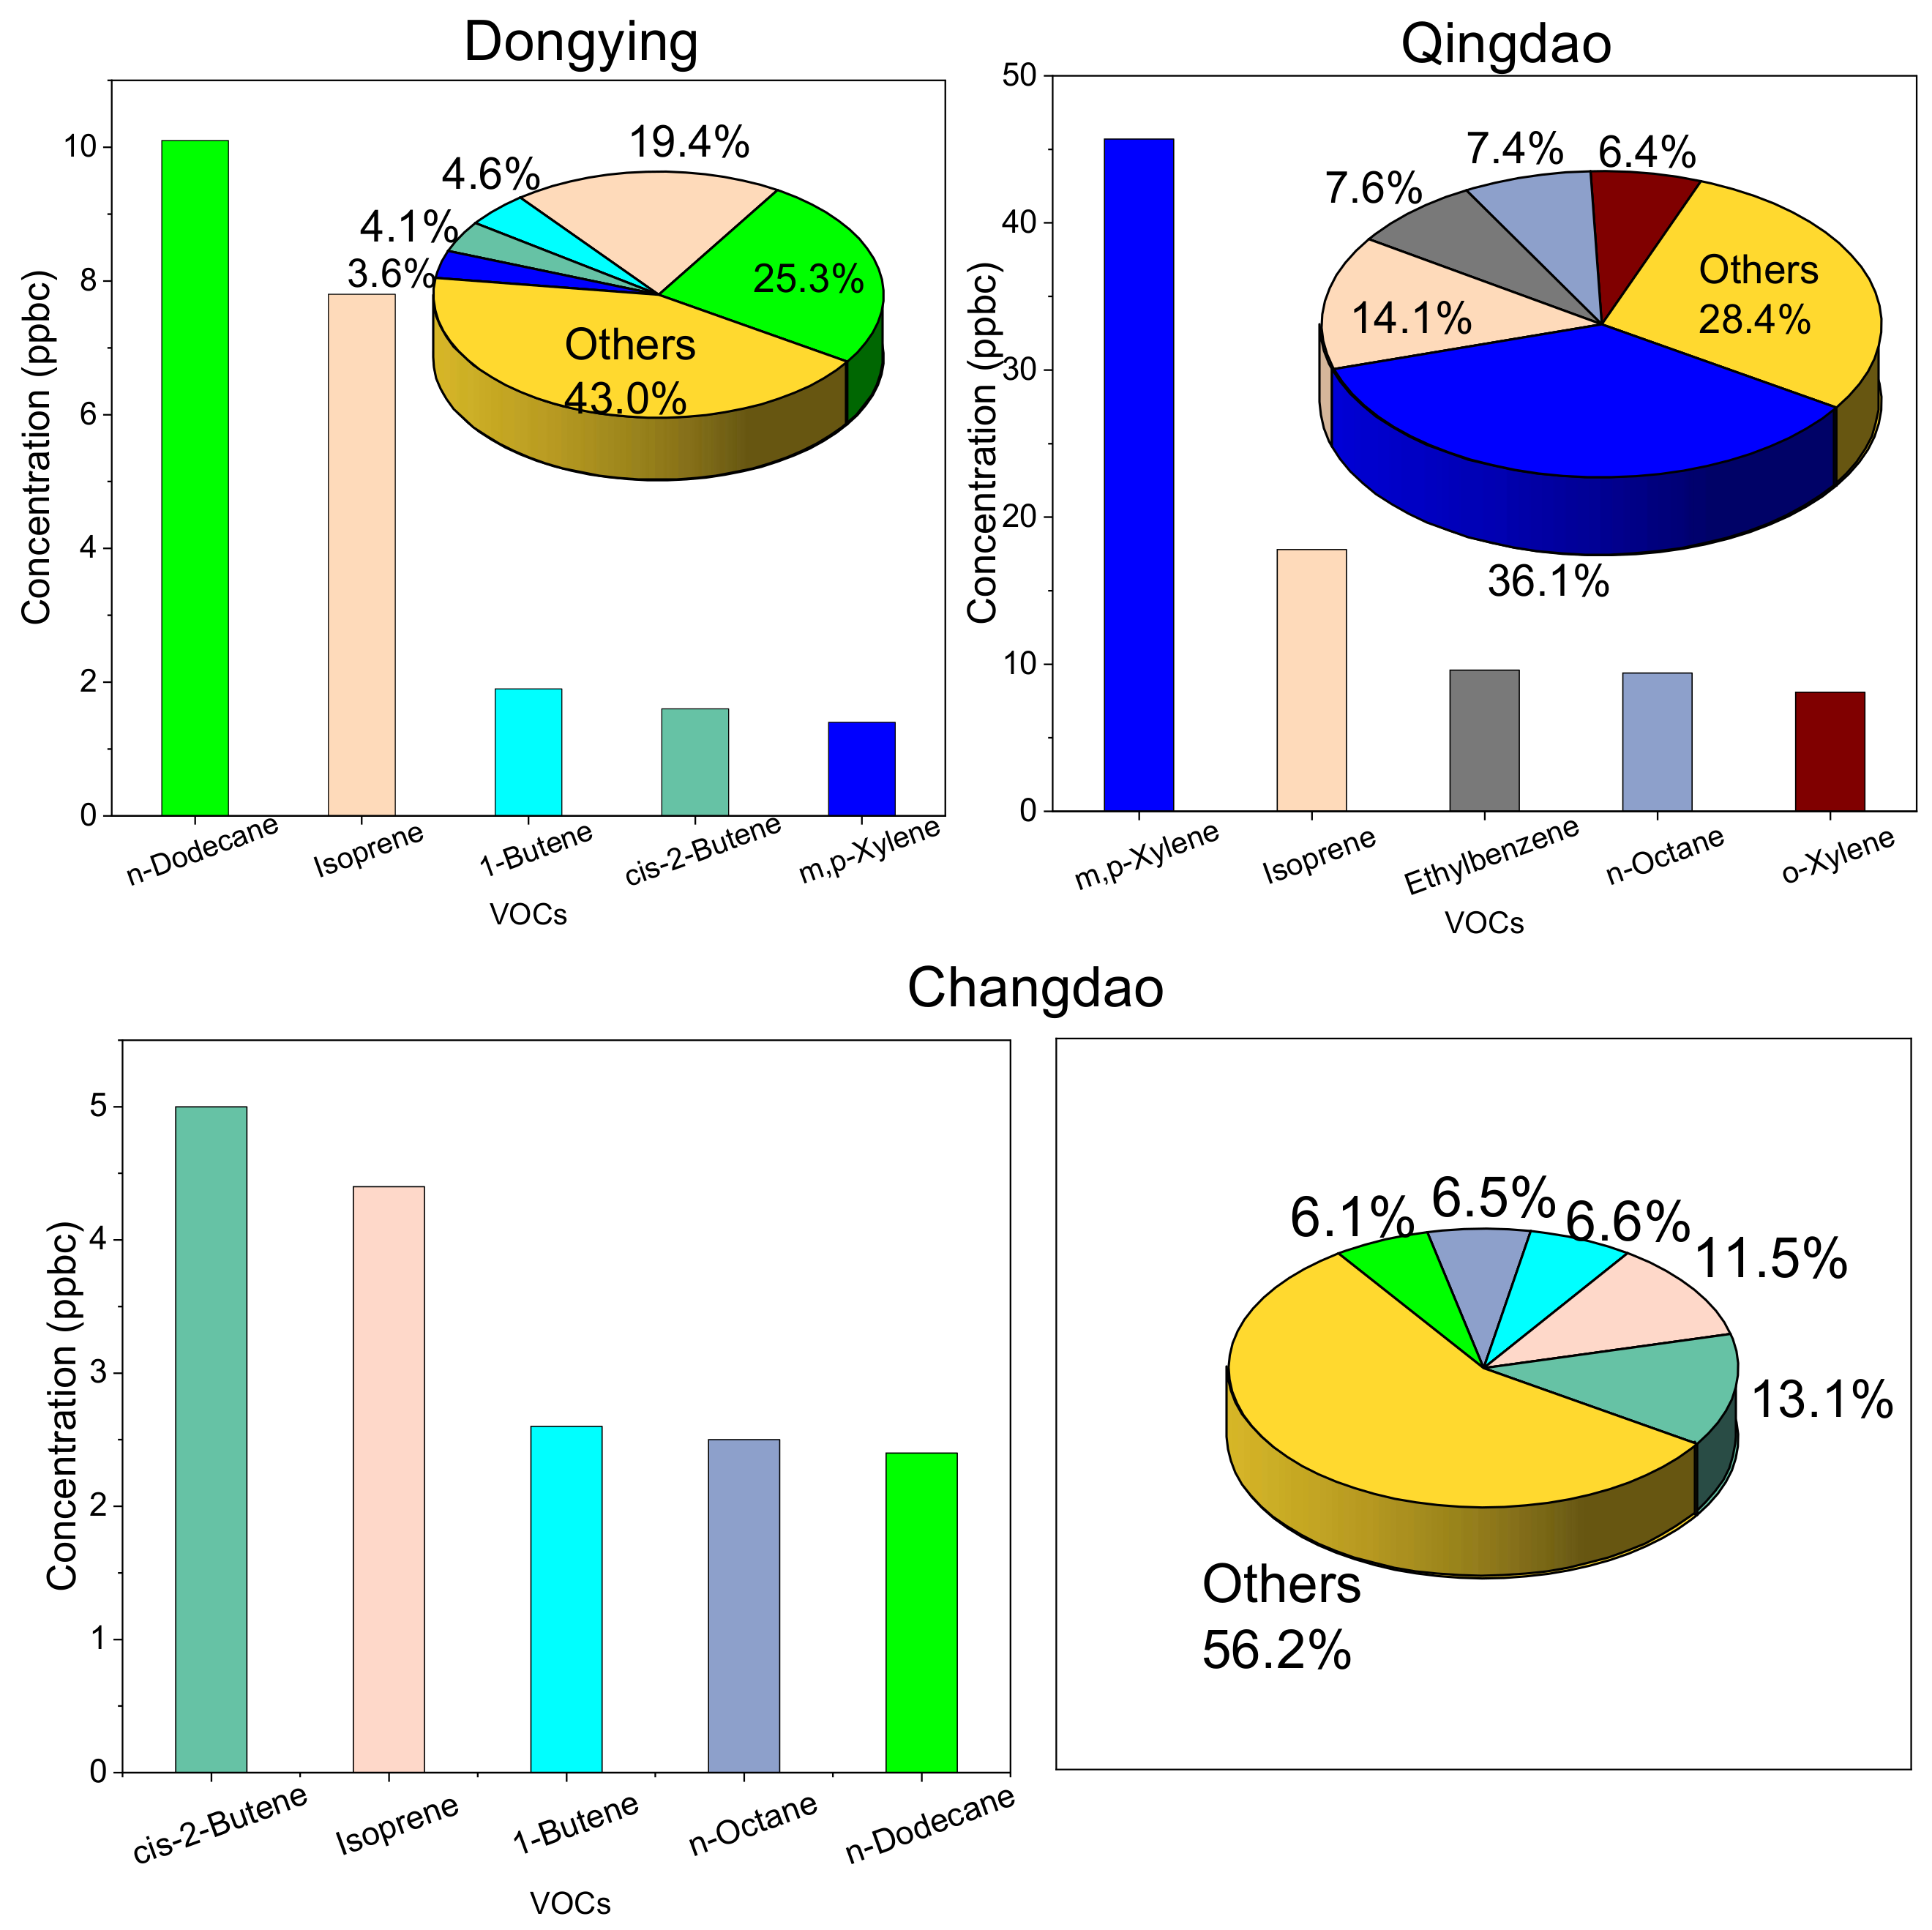
3.1.2. General Characteristics of VOCs

The mean concentrations of the 22 most abundant compounds are summarized in Table 2. It shows that the VOCs’ composition was similar among the seven sampling sites, with the top 22 compounds accounting for 79.3–99.0% of the total VOCs. During the sampling period, the concentrations of the VOCs were in the range of 15.3–883 ppbv, and the average concentration of the total VOCs was 139 ppbv in Shandong Province. The highest concentration of VOCs was observed at ZB (883 ppbv), which was higher than the concentrations during the summer in Beijing (11.2 ppbv) [17] and Yangtze River Delta, a typical industrial area (34.4 ppbv) [18]. ZB is an industrial city and industrial activities may have a significant impact on the VOCs emission. The lowest concentration of VOCs was detected in DZ (15.9 ppbv), which were comparable to the background station CD (15.3 ppbv), similar to the national station-Yucheng (16.1 ppbv) in DZ in summer 2013 [19], and lower than Beijing (40.2 ppbv) [20] and Nanjing (35.0 ppbv) [21]. JN (33.6 ppbv) and HZ (21.6 ppbv) are urban cities, and the VOCs concentrations were comparable to the coastal city QD (32.8 ppbv) and DY (19.2 ppbv), lower than Shanghai (42.7 ppbv) [22] and Xinxiang (33.6–41.2 ppbv) [23], and comparable to Zhejiang (25.4 ppbv) [24]. The VOCs concentrations showed no significant differences between the urban and coastal cities in Shandong Province, but varied between the industrial sites and background sites. ZB and DY are both abundant in petroleum refineries factories, but DY was less polluted than ZB. Local emissions were the major source of VOCs, and heavily polluted areas may have strong VOCs emissions.
During the sampling campaign, n-butane (442 ppbv) and isobutane (298 ppbv) were the most abundant species in ZB, accounting for 88.8% of the total VOCs. The correlation between butane and isobutane was strong, with a correlation coefficient value of 0.91, indicating that they have similar or equal emission sources. The ratio of isobutane/butane is often used to evaluate the source of the VOCs, and previous studies have shown that isobutane/butane ratios in the range of 0.6–1.0, 0.46, 0.2–0.3 are associated with natural gas, liquefied petroleum gas and vehicle exhaust, respectively [25]. In this study, the ratio was 0.67 in ZB, indicating that these two species were mainly from natural gas. Moreover, lighter hydrocarbons (C2–C4), including ethene, propene, 1-butene, cis-2-butene, trans-2-butene, pentane, isopentane and propane, were the prevalent species in ZB, and their total ratios reached 70.0 ppbv. Previous studies have shown that lighter alkanes (C2–C4) are associated with natural gas and liquefied petroleum gas, but have a low correlation with vehicle emissions [26,27]. Therefore, petrochemical emission and natural gas usage production or processes were the dominant emission source of VOCs in ZB during the observation period, which was still the most important source in 2018 [7].
QD is a coastal city with mixing ratios of VOCs comparable to that of JN, but the VOCs’ compositions were different. M,p-xylene, ethylbenzene, n-octane, o-xylene, isopentane, propane, benzene, 1-butene, isoprene and ethane are the ten most prevelant compounds in QD, accounting for 73.8% of the total VOCs, while propane, butane, ethene, 1-butene, acetylene, trans-2-butene, isopentane, 1-pentene, isobutane and pentane are the ten most prevelant compounds in JN, accounting for 72.1% of the total VOCs. Although the total VOCs concentrations in the urban city, JN, and coastal city, QD, were comparable, the difference in the predominant VOCs species indicates different emission sources. Benzene, toluene, ethylbenzene and xylene (BTEXs) were the major compounds in QD. Toluene is the most abundant compound in aromatic hydrocarbons, as reported by previous studies [8], but xylene was the most abundant species (mean ratio of 9.85 ppbv), followed by ethylbenzene and benzene, accounting for 86.8% of the total aromatic hydrocarbons in QD. Xylene is mainly used in ink, rubber, adhesive and painting processes, while toluene is a typical industrial solvent [28,29]. Therefore, industry activities influence the VOCs in QD. Lighter alkanes and alkenes were the dominant compounds in JN. Propane, butane, iso-pentane, isobutane and pentane are related to vehicle emissions [30]. Therefore, vehicle exhaust may be the major source in JN.
As shown in Figure 3, alkanes were the dominant components in all of the sampling sites, with the exception of QD, where aromatics are the most abundant species. Alkenes were the second most dominant species in all of the sampling sites. Propane was the most abundant species in Shandong, with a concentration range of 1.05–9.86 ppbv. It has been reported that propane is mainly vaporized from liquefied petroleum gas (LPG) leakages, and a minor proportion is from vehicular emissions [30]. The high level of propane may be attributed to the leakage from LPG-fueled vehicles, as well as vehicle combustion. Ethene, isobutane, 1-butene, cis-2-butene, butane, isopentane, pentane, benzene and toluene are the predominant species in both the urban and coastal areas of Shandong, accounting for 1.29%, 2.98%, 3.95%, 4.38%, 2.74%, 2.63%, 4.17%, 1.69% and 1.61% of the total VOCs, respectively. The composition of the major VOCs species in Shandong were similar, but the VOCs’ characteristics were different across the seven sampling sites, indicating that the VOCs had local emission sources. It is important to form a specific strategy to reduce the concentrations of VOCs according to the VOCs’ characteristics and sources.

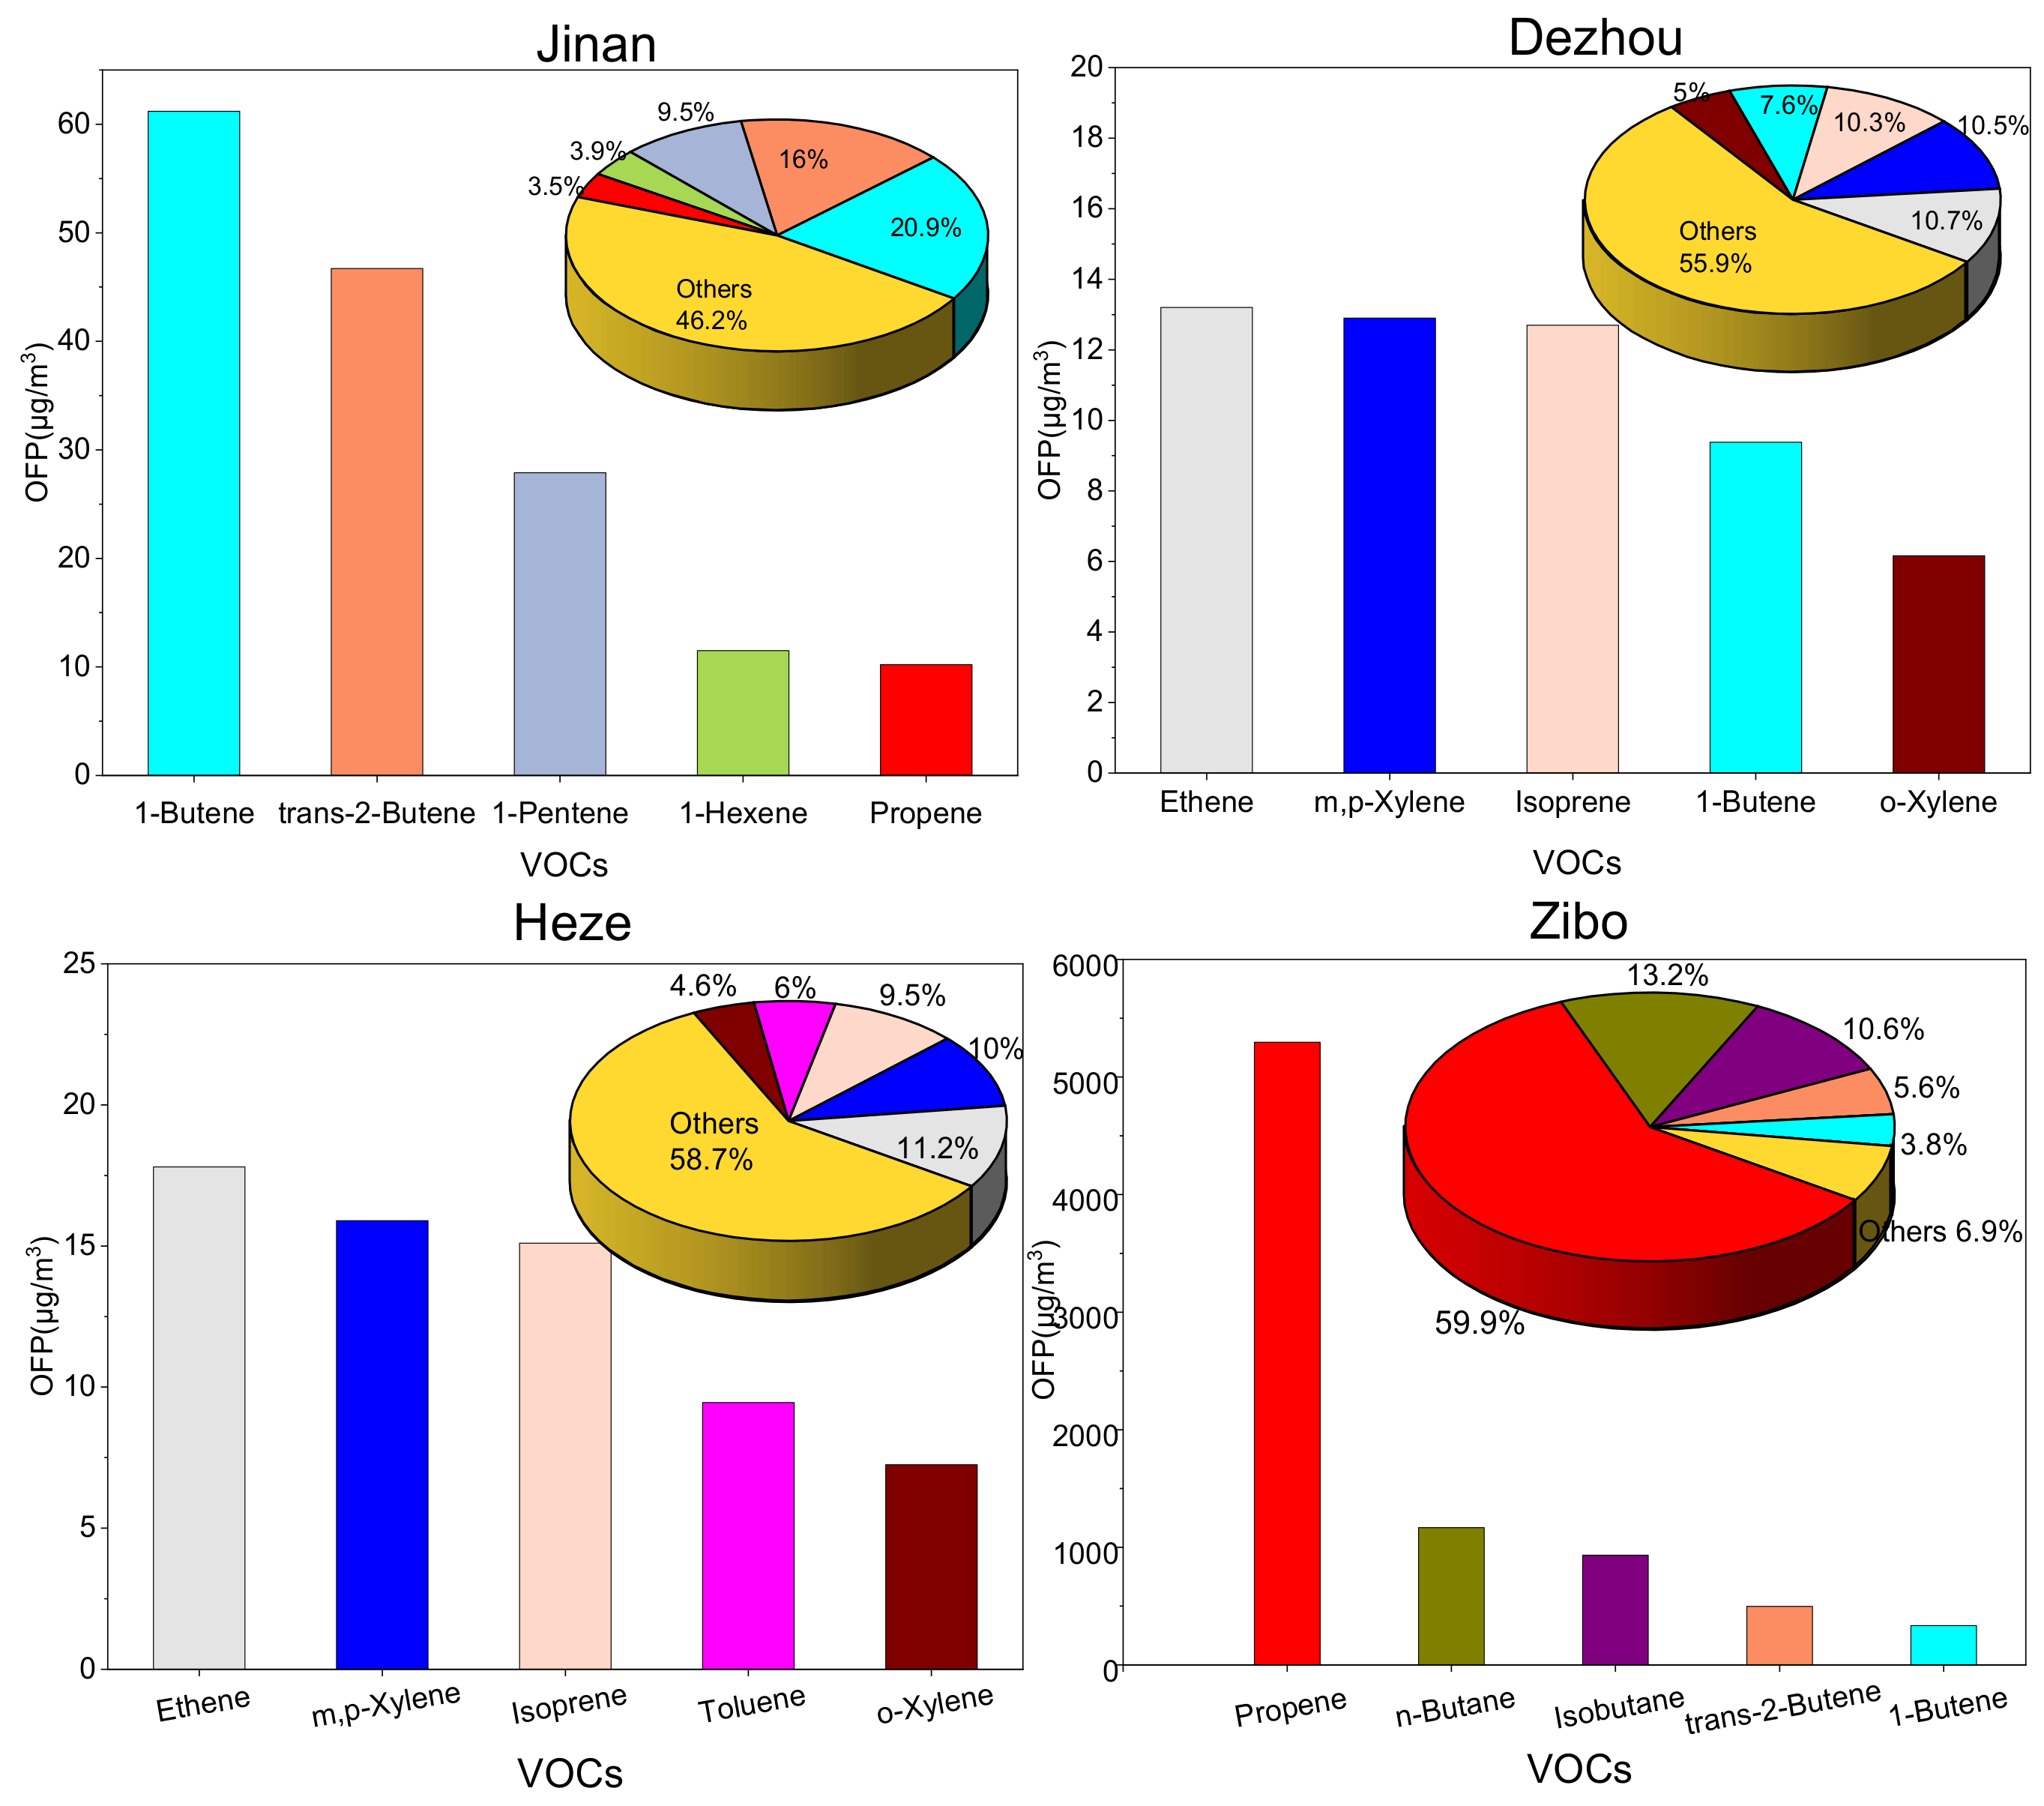
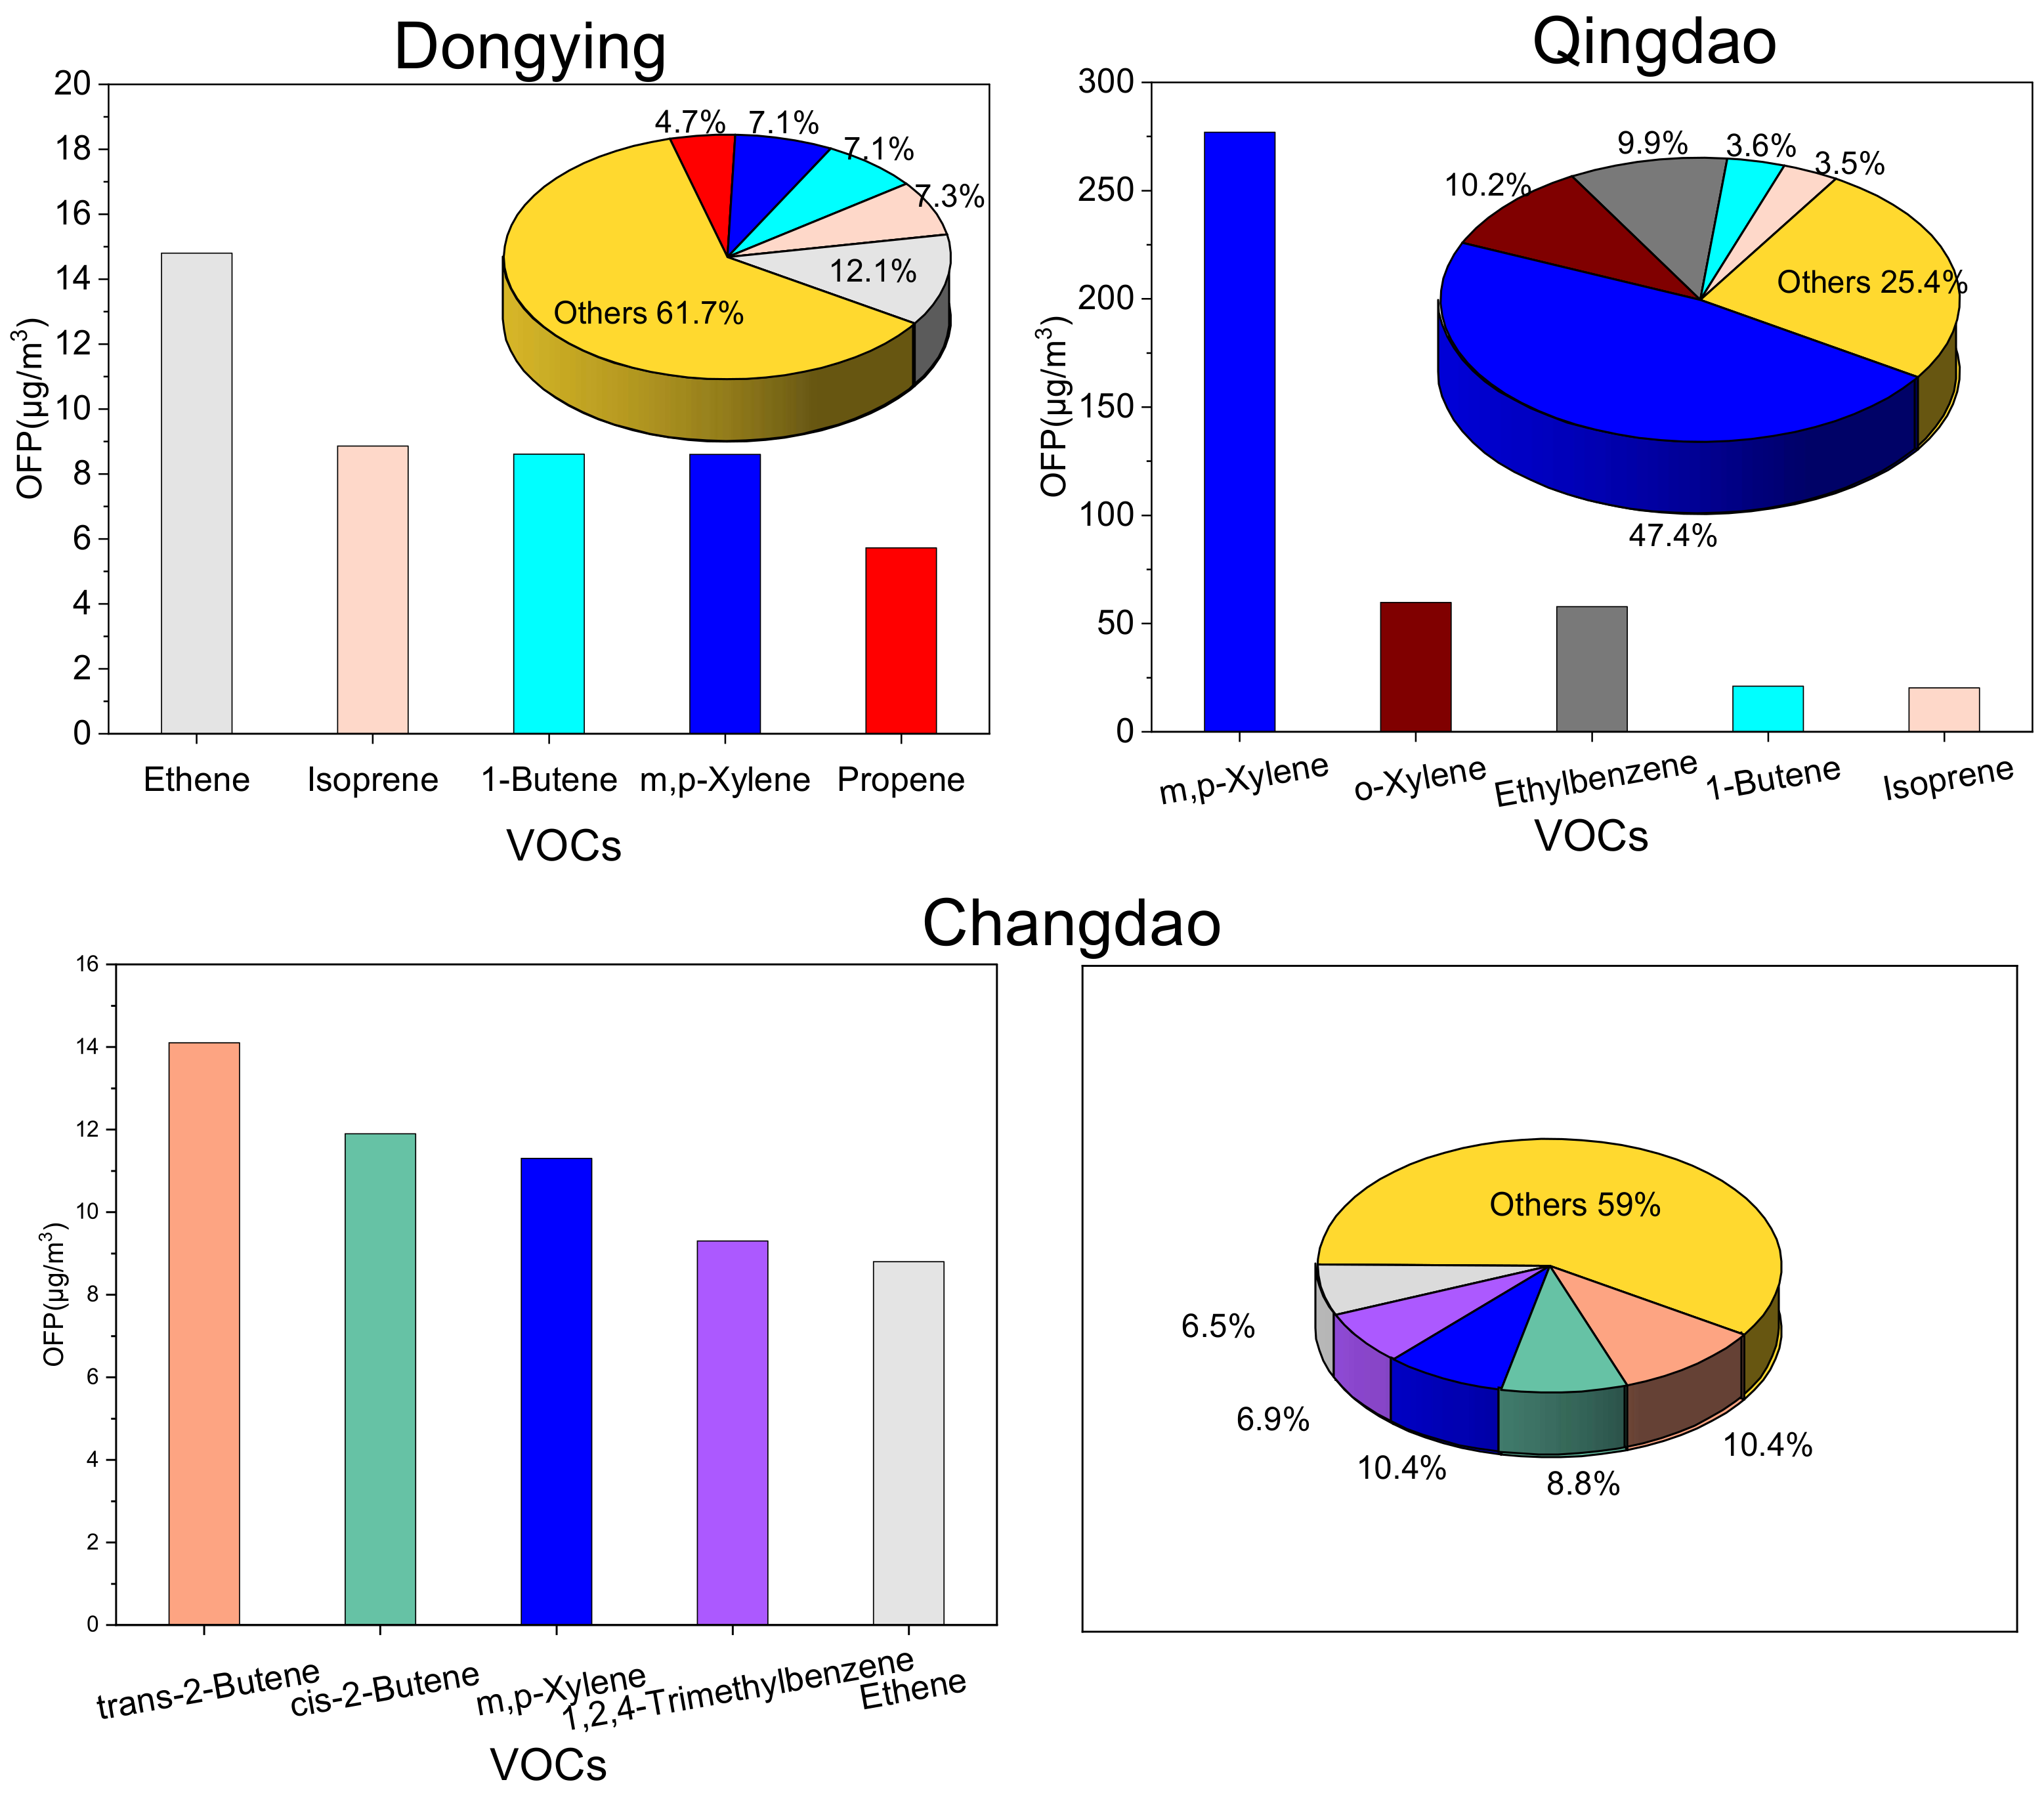
3.2. Reactivity and Ozone Formation Potential of VOCs

In order to estimate the reactivity and contribution of each species to the photochemical ozone formation, propylene equivalent concentrations (Pro-Equiv) [31] and maximum incremental reactivity (MIR) [32] are employed in this study.
The Pro-Equiv(j) of hydrocarbon j is defined as:
P r o E q u i v ( j ) = C o n . ( j ) × K O H ( j ) K O H ( p r o p e n e )
where Pro-Equiv (j) is the reactivity of species j on the OH reactivity base; Conc. (j) is the concentration of j expressed in ppbc; KOH (j) and KOH (propene) denote the rate constant of the reaction between species j or propene and OH, and the K(OH) of each species are list in Table 3.
In this research, the MIR proposed by Carter [32] was employed to compare the ozone formation potential (OFP) of the individual species. The following equation is employed to calculate the OFP of each compound under optimized conditions.
OFP j = Conc . j × MIR j
The MIR coefficients are obtained from Carter [32].
The top five compounds that are ranked according to their Pro-Equiv concentrations and OFP, as well as the contribution percentage of each species, are displayed in Figure 4Figure 5Figure 6 and Figure 7. In this study, ZB had the highest Pro-Equiv concentration and OFP, followed by QD. N-butane and iso-butane were the most abundant species in ZB, and the high mixing ratios resulted in 933–1168 μg/m3 OFP and 96.0–171 ppbc Pro-Equiv concentration. Propene is the most active species and accounts for 56.8% and 59.8% of the total Pro-Equiv concentration and OFP, respectively. No distinct differences in the Pro-Equiv concentrations or OFPs were observed among the other sampling sites.
It can be observed that alkenes and aromatics are the most active species that perform a key role in ozone formation. They accounted for 43.9–90.7% of the Pro-Equiv concentration and 41.0–93% of the OFP. Aromatics contributed the most to the Pro-Equiv concentration and OFP in HZ and QD. In QD, m/p-xylene, o-xylene and ethylbenzene account for 50.1% of the Pro-Equiv concentration and 67.6% of the OFP. m/p-xylene and ethene were the most abundant contributors to the OFP in DZ, HZ, DY and CD, accounting for 14.9–21.2% of the total OFP. Cis-2 butene and 1-butene were among the top five hydrocarbons that contributed to the Pro-Equiv concentrations in DZ, DY and CD, accounting for 8.7–19.7% of the total Pro-Equiv concentrations. Aromatics made the most significant contribution to the OFP and Pro-Equiv concentrations in HZ and QD.

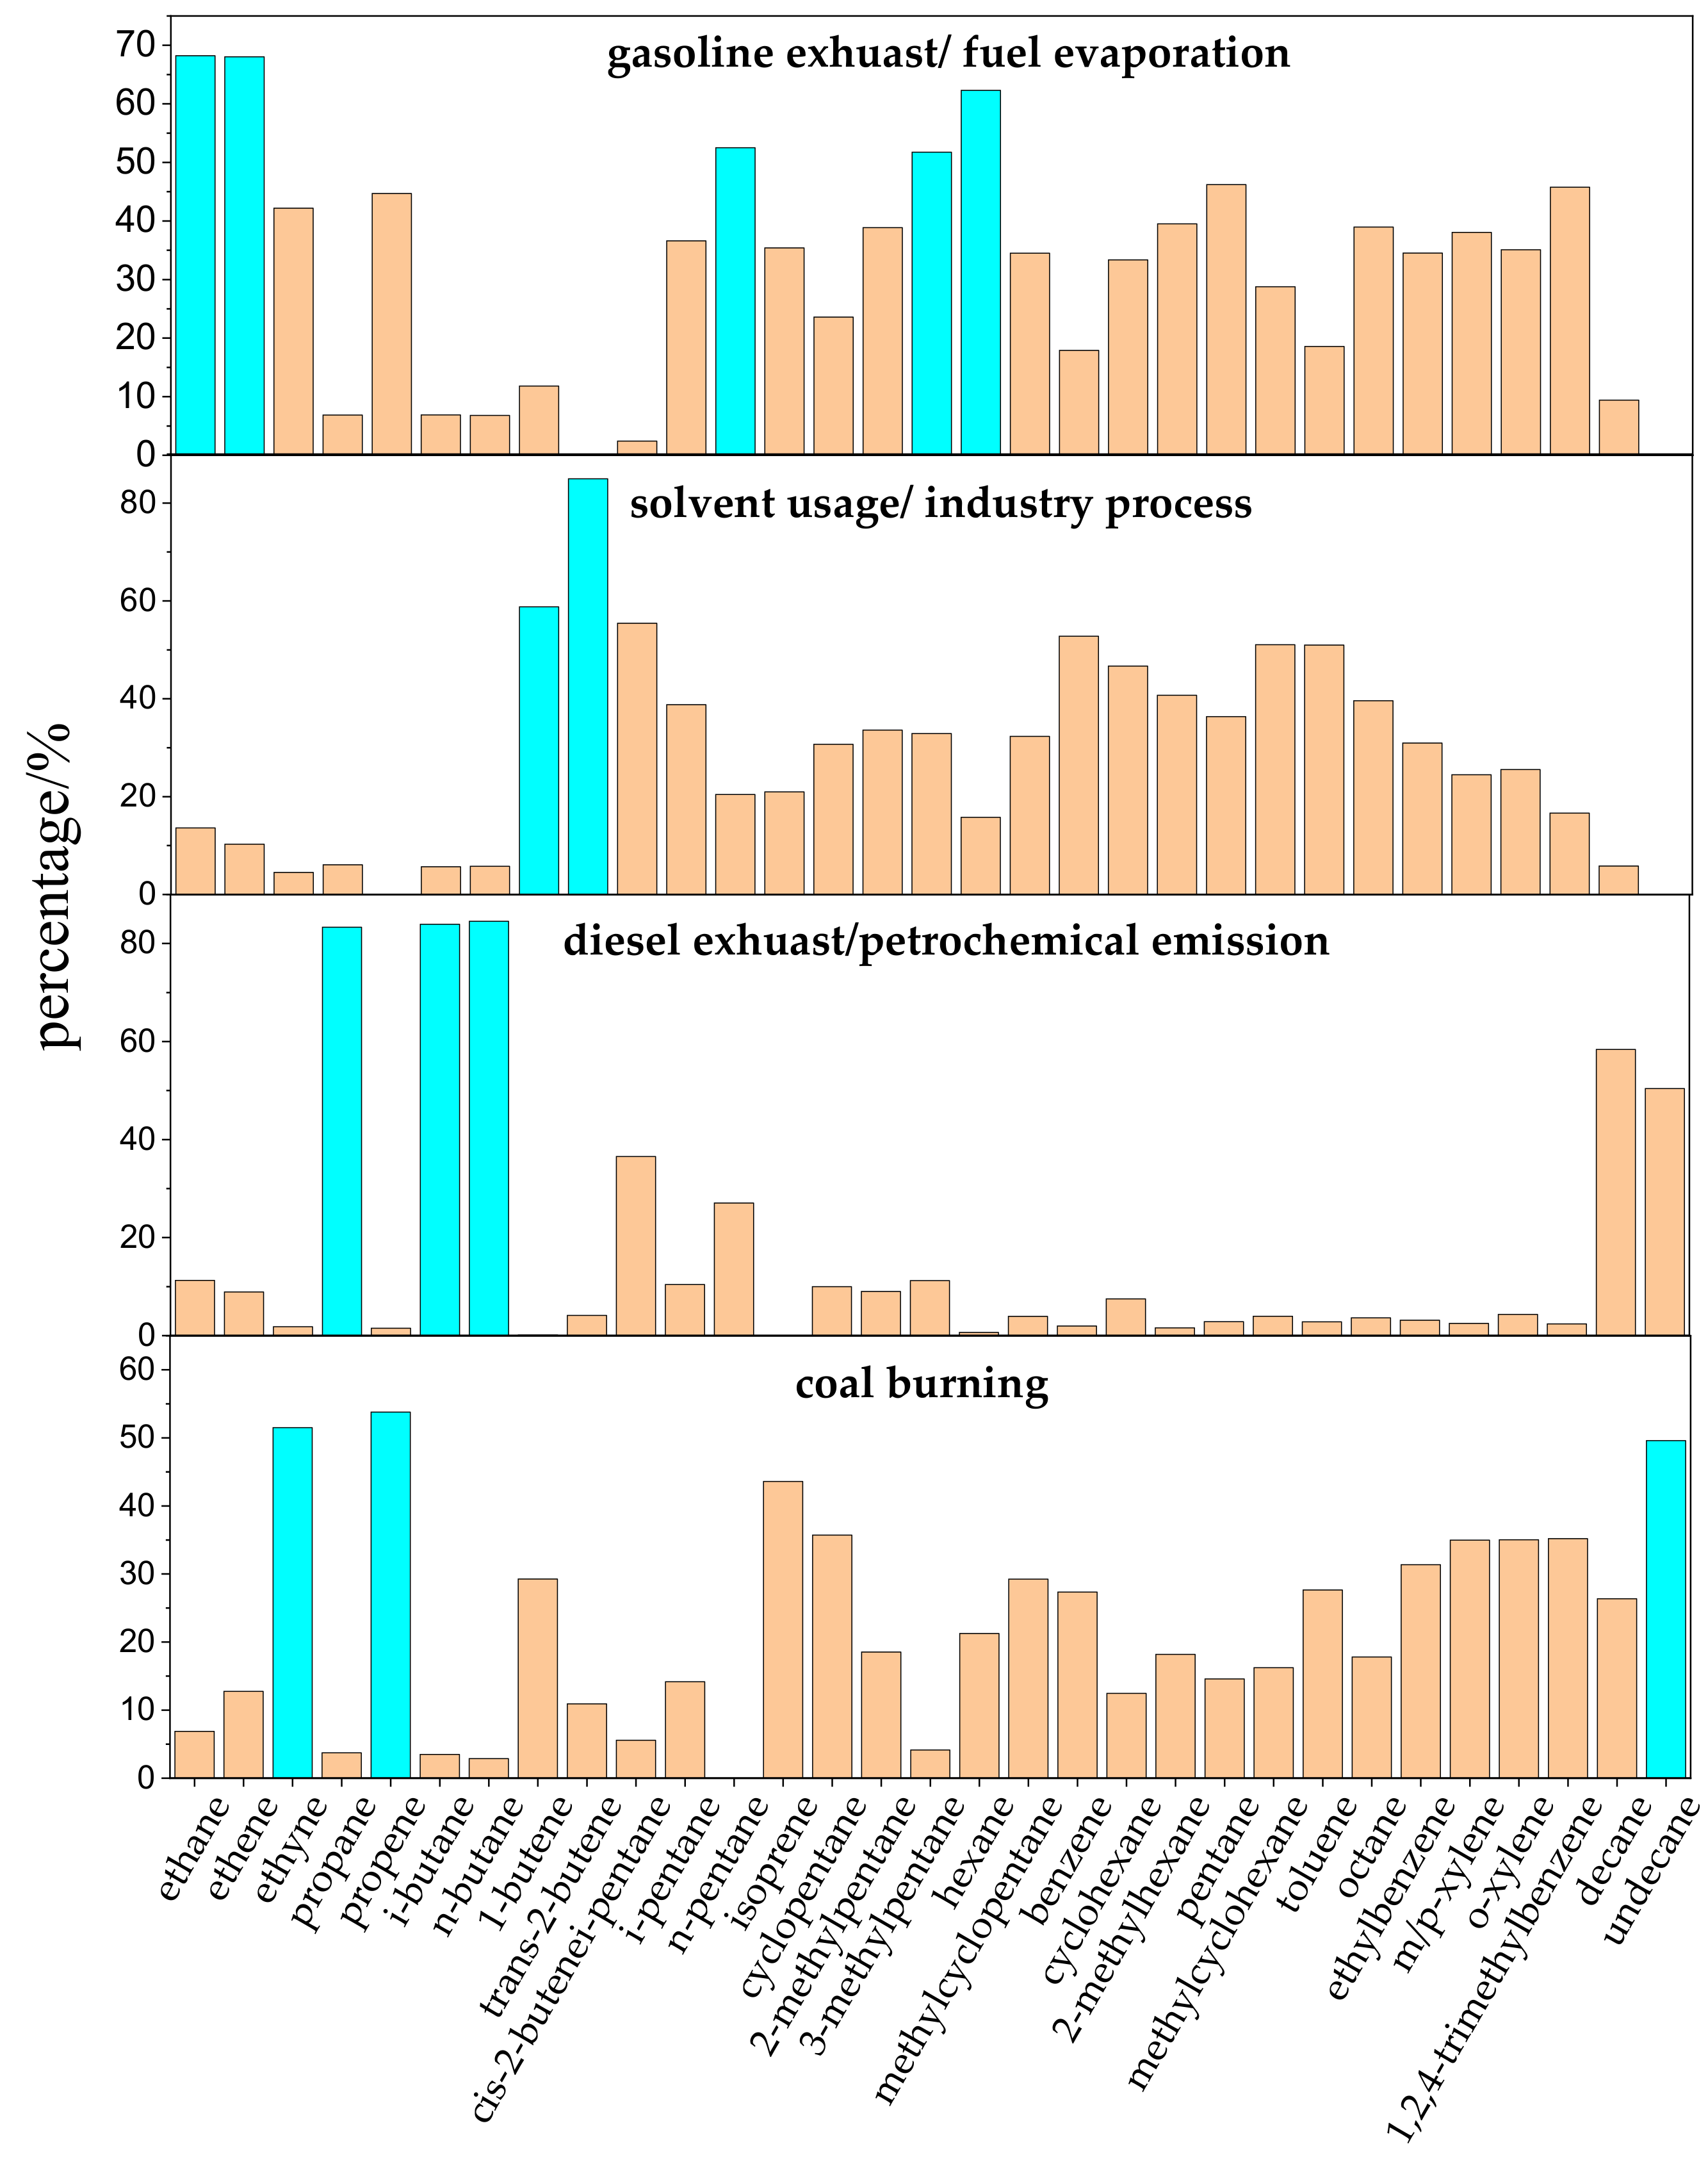
3.3. Emission Sources of VOCs

In order to determine whether the VOCs emanated from local emissions or were transported by the air mass from up-wind origins, the ratios of ethylbenzene to m/p-xylene were calculated. Ethylbenzene and m/p-xylene are considered to have a common origin but differ in terms of reactivity. The lifetimes of the ethylbenzene, m-xylene and p-xylene were 1.6 days, 11.8 h and 19.4 h, respectively; hence, low and high E/X ratios indicate fresh air and aged air, respectively [33,34]. The correlation coefficient between ethylbenzene and m/p-xylene was higher than 0.84 during the sampling period (Table S1). The good correlation coefficient suggested that ethylbenzene and m/p-xylene emanated from similar sources, and the E/X ratios could be used to estimate aged air or fresh air. The calculated E/X ratios in the seven sampling sites were all lower than 1.0, indicating that the VOC ratios depended on local emissions in Shandong Province. Therefore, according to the specific emission sources of the VOCs in each region, targeted emission reduction measures will help to reduce the concentration of atmospheric VOCs in Shandong Province.
The ratio of toluene to benzene (T/B) is often used to identify VOC sources. When T/B > 2, it is assumed that solvent usage is important; when T/B < 2, the VOCs are mainly affected by vehicle exhaust; when T/B < 1, ambient VOCs mainly come from the burning of biofuel, charcoal and coal [35,36]. The T/B ratios were lower than 2 in the JN, DZ, DY, QD, CD and HZ sites, indicating that the burning of biofuel and vehicle emissions were the main sources in these sites. The T/B ratios in the ZB site ranged between 0.60 and 3.17, implying that both vehicle emission and solvent usage are important sources in ZB.
In this study, the positive matrix factorization (PMF, version 5.0) model was used to analyze the source of VOCs in Shandong Province and the details of the PMF 5.0 have been described in previous reports [37]. PMF is a multi-factor analysis tool that can decompose the specific VOCs’ observation data matrix (X) into two matrices, including a matrix of factor contributions (G) and a matrix of factor profiles (F)(Equation (3)):
x i j = k = 1 p g i j f k j + e i j
where xij is the mixing ratio for the jth VOCs species in the ith sample; gik is the contribution of the kth factor to the total mixing ratio of VOCs in the ith sample; fkj means the chemical profile of VOCs for the kth factor; eij represents the residual for the jth VOCs species in the ith sample. Finally, 4 factors were identified and the factor frofiles were showed in Figure 8.
Factor 1 was distinguished by a high abundance of ethane, ethene, pentane and isopentane, which contributed 11.5% to the VOCs. Light hydrocarbons, such as iso/n-pentane, dominated the composition of the gasoline vapor, and ethene was used as a tracer for gasoline-vehicle exhaust [38]. Therefore, Factor 1 was interpreted as gasoline exhaust, and it was mixed with fuel evaporation. Factor 2 was abundant with 1-butene, trans-2-butene, cis-2-butene, benzene, toluene and methylcyclohexane. The cis/trans-2-butene were fingerprints of fugitive emissions and benzene, toluene and methylcyclohexane were mainly used as industry solvents; therefore, this factor was defined as industrial solvent usage or industry process fugitive, and it accounted for 8.93% of the total VOCs. Factor 3 was highly enriched with propane, i-butane, n-butane, decane and undecane. Decane and undecane are recognized as tracers of diesel exhaust [3], i/n-butane mainly contributed by the ZB site, and petrochemical emission was the main source of i/n-butane. Therefore, Factor 3 was defined as diesel exhaust and petrochemical emissions, and it accounted for 46.7% of the total VOCs. Factor 4 exhibited abundances of acetylene, propene, and 1,3-butadiene, and ethylbenzene, acetylene, ethylene and 1,3-butadiene were the most abundant species in the wood burning emission [39]. As summer does not require the supply of heating for residents, Factor 4 would be related to industrial coal burning emission; this process contributed 6.58% to the total VOCs.

4. Conclusions

In this study, 57 VOCs were measured between 9 July and 19 August at seven sampling sites, including inland sites, coastal sites and a background site in Shandong Province, eastern China, 2016. The results showed that the VOCs’ average concentrations ranged between 15.3 and 883 ppbv, with the average mixing ratio of 139 ppbv. Alkanes were the dominant components in all of the sampling sites, except QD, while aromatics were the most abundant components in QD; alkenes were the second most abundant components. Propane was the highest compound, followed by ethene, isobutane, 1-butene, cis-2-butene, butane, isopentane, pentane, benzene and toluene in Shandong Province. The most polluted site was ZB, n-butane and isobutane were the most prevalent species, and they contributed 88.8% of the total VOCs. The average mixing ratio of VOCs in QD was comparable with JN, but the composition of VOCs was different; BTEXs were the major components in QD and lighter alkanes and alkenes were the dominant components in JN. DZ was the cleanest site in Shandong, which was comparable with CD. There were no significant differences in the concentrations between the urban and coastal sites, with the exception of ZB.
ZB had the highest Pro-Equiv concentration and OFP, followed by QD, and the other sites shared similar activity. Alkenes and aromatics were the most active species, which perform a key role in ozone formation; they accounted for 43.9–90.7% of the Pro-Equiv concentrations and 41.0–93% of the ozone formation potentials. Aromatics are the most active species in HZ and QD.
The T/B ratio indicated that the burning of biofuel and vehicle emissions were the main sources in the JN, DZ, DY, QD, CD and HZ sites; solvent usage was also an important source in ZB. The PMF Model was used to analyze the sources of VOCs in Shandong Province, and the results showed that gasoline exhaust or fuel evaporation, industry process solvent usage, diesel exhaust or petrochemical emission and coal burning were the four main sources in Shandong, and they contributed 11.5%, 8.93%, 46.7% and 6.58%, respectively. Diesel exhaust or petrochemical emission were the most important source for the high concentration of n-butane, and isobutane was detected in ZB.

Supplementary Materials

The following supporting information can be downloaded at: https://www.mdpi.com/article/10.3390/atmos14040667/s1, Table S1: Coefficient between ethylbenzene and xylene.

Author Contributions

Conceptualization, F.C. and X.X.; methodology, F.C.; software, F.C.; validation, F.C. and F.Z.; formal analysis, F.C.; investigation, F.C.; resources, J.S., X.X. and L.T.; data curation, F.C.; writing—original draft preparation, F.C.; writing—review and editing, F.C. and J.L.; visualization, F.C.; supervision, X.X. and X.Y.; project administration, Y.C. and J.S.; funding acquisition, Y.C., L.T. and X.X. All authors have read and agreed to the published version of the manuscript.

Funding

This work was funded by the Ministry of Science and Technology of China (2019YFC0214503).

Acknowledgments

This work is grateful to the help from Minmin Yang, and the projects that were financially supported by Natural Science Foundation of Shandong Province (ZR2020ZD21, ZR2021MD013).

Conflicts of Interest

The authors declare no conflict of interest.

References

  1. Li, K.; Jacob, D.J.; Liao, H.; Qiu, Y.; Shen, L.; Zhai, S.; Bates, K.H.; Sulprizio, M.P.; Song, S.; Lu, X.; et al. Ozone pollution in the North China Plain spreading into the late-winter haze season. Proc. Natl. Acad. Sci. USA 2021, 118, e2015797118. [Google Scholar] [CrossRef] [PubMed]
  2. Li, Y.; Zhang, Z.; Xing, Y. Long-Term Change Analysis of PM2.5 and Ozone Pollution in China’s Most Polluted Region during 2015–2020. Atmosphere 2022, 13, 104. [Google Scholar] [CrossRef]
  3. Li, J.; Deng, S.; Li, G.; Lu, Z.; Song, H.; Gao, J.; Sun, Z.; Xu, K. VOCs characteristics and their ozone and SOA formation potentials in autumn and winter at Weinan, China. Environ. Res. 2022, 203, 111821. [Google Scholar] [CrossRef] [PubMed]
  4. Guan, Y.; Xiao, Y.; Chu, C.; Zhang, N.; Yu, L. Trends and characteristics of ozone and nitrogen dioxide related health impacts in Chinese cities. Ecotoxicol. Environ. Saf. 2022, 241, 113808. [Google Scholar] [CrossRef] [PubMed]
  5. Wang, T.; Zhang, L.; Zhou, S.; Zhang, T.; Zhai, S.; Yang, Z.; Wang, D.; Song, H. Effects of ground-level ozone pollution on yield and economic losses of winter wheat in Henan, China. Atmos. Environ. 2021, 262, 118654. [Google Scholar] [CrossRef]
  6. Malashock, D.A.; Delang, M.N.; Becker, J.S.; Serre, M.L.; West, J.J.; Chang, K.-L.; Cooper, O.R.; Anenberg, S.C. Global trends in ozone concentration and attributable mortality for urban, peri-urban, and rural areas between 2000 and 2019: A modelling study. Lancet Planet. Health 2022, 6, e958–e967. [Google Scholar] [CrossRef]
  7. Zhou, M.; Jiang, W.; Gao, W.; Zhou, B.; Liao, X. A high spatiotemporal resolution anthropogenic VOC emission inventory for Qingdao City in 2016 and its ozone formation potential analysis. Process Saf. Environ. Prot. 2020, 139, 147–160. [Google Scholar] [CrossRef]
  8. Tohid, L.; Sabeti, Z.; Sarbakhsh, P.; Benis, K.Z.; Shakerkhatibi, M.; Rasoulzadeh, Y.; Rahimian, R.; Darvishali, S.J.A.P.R. Spatiotemporal variation, ozone formation potential and health risk assessment of ambient air VOCs in an industrialized city in Iran. Atmos. Pollut. Res. 2018, 10, 556–563. [Google Scholar] [CrossRef]
  9. Wang, Q.; Li, S.; Dong, M.; Li, W.; Gao, X.; Ye, R.; Zhang, D. VOCs emission characteristics and priority control analysis based on VOCs emission inventories and ozone formation potentials in Zhoushan. Atmos. Environ. 2018, 182, 234–241. [Google Scholar] [CrossRef]
  10. Wang, J.; Zhang, Y.; Wu, Z.; Luo, S.; Song, W.; Wang, X. Ozone episodes during and after the 2018 Chinese National Day holidays in Guangzhou: Implications for the control of precursor VOCs. J. Environ. Sci. 2022, 114, 322–333. [Google Scholar] [CrossRef]
  11. Zhao, M.; Zhang, Y.; Pei, C.; Chen, T.; Mu, J.; Liu, Y.; Wang, Y.; Wang, W.; Xue, L. Worsening ozone air pollution with reduced NOx and VOCs in the Pearl River Delta region in autumn 2019: Implications for national control policy in China. J. Environ. Manag. 2022, 324, 116327. [Google Scholar] [CrossRef]
  12. Zheng, H.; Kong, S.; Yan, Y.; Chen, N.; Qi, S. Compositions, sources and health risks of ambient volatile organic compounds (VOCs) at a petrochemical industrial park along the Yangtze River. Sci. Total Environ. 2019, 703, 135505. [Google Scholar] [CrossRef]
  13. Hsu, C.-Y.; Chiang, H.-C.; Shie, R.-H.; Ku, C.-H.; Lin, T.-Y.; Chen, M.-J.; Chen, N.-T.; Chen, Y.-C. Ambient VOCs in residential areas near a large-scale petrochemical complex: Spatiotemporal variation, source apportionment and health risk. Environ. Pollut. 2018, 240, 95–104. [Google Scholar] [CrossRef]
  14. Dave, P.N.; Sahu, L.K.; Tripathi, N.; Bajaj, S.; Patel, K. Emissions of non-methane volatile organic compounds from a landfill site in a major city of India: Impact on local air quality. Heliyon 2020, 6, e04537. [Google Scholar] [CrossRef]
  15. Zhang, Y.; Yu, S.; Chen, X.; Li, Z.; Li, M.; Song, Z.; Liu, W.; Li, P.; Zhang, X.; Lichtfouse, E.; et al. Local production, downward and regional transport aggravated surface ozone pollution during the historical orange-alert large-scale ozone episode in eastern China. Environ. Chem. Lett. 2022, 20, 1577–1588. [Google Scholar] [CrossRef]
  16. Li, J.; Cai, J.; Zhang, M.; Liu, H.; Xu, Y. Model analysis of meteorology and emission impacts on springtime surface ozone in Shandong. Sci. Total Environ. 2021, 771, 144784. [Google Scholar] [CrossRef]
  17. Zhan, J.; Feng, Z.; Liu, P.; He, X.; He, Z.; Chen, T.; Wang, Y.; He, H.; Mu, Y.; Liu, Y. Ozone and SOA formation potential based on photochemical loss of VOCs during the Beijing summer. Environ. Pollut. 2021, 285, 117444. [Google Scholar] [CrossRef]
  18. Shao, P.; An, J.; Xin, J.; Wu, F.; Wang, J.; Ji, D.; Wang, Y. Source apportionment of VOCs and the contribution to photochemical ozone formation during summer in the typical industrial area in the Yangtze River Delta, China. Atmos. Res. 2016, 176–177, 64–74. [Google Scholar] [CrossRef]
  19. Zhu, Y.; Yang, L.; Chen, J.; Wang, X.; Xue, L.; Sui, X.; Wen, L.; Xu, C.; Yao, L.; Zhang, J.; et al. Characteristics of ambient volatile organic compounds and the influence of biomass burning at a rural site in Northern China during summer 2013. Atmos. Environ. 2016, 124, 156–165. [Google Scholar] [CrossRef]
  20. Zhang, C.; Liu, X.; Zhang, Y.; Tan, Q.; Feng, M.; Qu, Y.; An, J.; Deng, Y.; Zhai, R.; Wang, Z.; et al. Characteristics, source apportionment and chemical conversions of VOCs based on a comprehensive summer observation experiment in Beijing. Atmos. Pollut. Res. 2021, 12, 230–241. [Google Scholar] [CrossRef]
  21. Mozaffar, A.; Zhang, Y.-L.; Fan, M.; Cao, F.; Lin, Y.-C. Characteristics of summertime ambient VOCs and their contributions to O3 and SOA formation in a suburban area of Nanjing, China. Atmos. Res. 2020, 240, 104923. [Google Scholar] [CrossRef]
  22. Liu, Y.; Wang, H.; Jing, S.; Gao, Y.; Peng, Y.; Lou, S.; Cheng, T.; Tao, S.; Li, L.; Li, Y.; et al. Characteristics and sources of volatile organic compounds (VOCs) in Shanghai during summer: Implications of regional transport. Atmos. Environ. 2019, 215, 116902. [Google Scholar] [CrossRef]
  23. Li, Y.; Liu, Y.; Hou, M.; Huang, H.; Fan, L.; Ye, D. Characteristics and sources of volatile organic compounds (VOCs) in Xinxiang, China, during the 2021 summer ozone pollution control. Sci. Total Environ. 2022, 842, 156746. [Google Scholar] [CrossRef] [PubMed]
  24. Xu, Z.; Zou, Q.; Jin, L.; Shen, Y.; Shen, J.; Xu, B.; Qu, F.; Zhang, F.; Xu, J.; Pei, X.; et al. Characteristics and sources of ambient Volatile Organic Compounds (VOCs) at a regional background site, YRD region, China: Significant influence of solvent evaporation during hot months. Sci. Total Environ. 2023, 857, 159674. [Google Scholar] [CrossRef]
  25. Zhang, D.; He, B.; Yuan, M.; Yu, S.; Yin, S.; Zhang, R. Characteristics, sources and health risks assessment of VOCs in Zhengzhou, China during haze pollution season. J. Environ. Sci. 2021, 108, 44–57. [Google Scholar] [CrossRef]
  26. Blake, D.R.; Rowland, F.S. Urban Leakage of Liquefied Petroleum Gas and Its Impact on Mexico City Air Quality. Science 1995, 269, 953. [Google Scholar] [CrossRef] [Green Version]
  27. Choi, E.; Heo, J.-B.; Yi, S.-M. Apportioning and Locating Nonmethane Hydrocarbon Sources to a Background Site in Korea. Environ. Sci. Technol. 2010, 44, 5849–5854. [Google Scholar] [CrossRef]
  28. Carriero, G.; Neri, L.; Famulari, D.; Lonardo, S.D.; Piscitelli, D.; Manco, A.; Esposito, A.; Chirico, A.; Facini, O.; Finardi, S. Composition and emission of VOC from biogas produced by illegally managed waste landfills in Giugliano (Campania, Italy) and potential impact on the local population. Sci. Total Environ. 2018, 640–641, 377–386. [Google Scholar] [CrossRef]
  29. Miri, M.; Rostami Aghdam Shendi, M.; Ghaffari, H.R.; Ebrahimi Aval, H.; Ahmadi, E.; Taban, E.; Gholizadeh, A.; Yazdani Aval, M.; Mohammadi, A.; Azari, A. Investigation of outdoor BTEX: Concentration, variations, sources, spatial distribution, and risk assessment. Chemosphere 2016, 163, 601–609. [Google Scholar] [CrossRef]
  30. Kang, S.; Kim, J.-A.; Lee, M.; Park, J.; Jeon, E.; Shim, M.; Shin, Y. An analysis of the temporal variability in volatile organic compounds (VOCs) within megacity Seoul and an identification of their sources. Atmos. Pollut. Res. 2022, 13, 101338. [Google Scholar] [CrossRef]
  31. Chameides, W.L.; Fehsenfeld, F.; Rodgers, M.O.; Cardelino, C.; Martinez, J.; Parrish, D.; Lonneman, W.; Lawson, D.R.; Rasmussen, R.A.; Zimmerman, P.; et al. Ozone precursor relationships in the ambient atmosphere. J. Geophys. Res. Atmos. 1992, 97, 6037–6055. [Google Scholar] [CrossRef]
  32. Carter; William, P. L. Development of Ozone Reactivity Scales for Volatile Organic Compounds. Air Waste 1994, 44, 881–899. [Google Scholar] [CrossRef] [Green Version]
  33. Monod, A.; Sive, B.C.; Avino, P.; Chen, T.; Blake, D.R.; Sherwood Rowland, F. Monoaromatic compounds in ambient air of various cities: A focus on correlations between the xylenes and ethylbenzene. Atmos. Environ. 2001, 35, 135–149. [Google Scholar] [CrossRef] [Green Version]
  34. Atkinson, R. Gas-phase tropospheric chemistry of organic compounds: A review. Atmos. Environ. Part A Gen. Top. 1990, 24, 1–41. [Google Scholar] [CrossRef]
  35. Wang, T.; Guo, H.; Blake, D.R.; Kwok, Y.H.; Simpson, I.J.; Li, Y.S. Measurements of Trace Gases in the Inflow of South China Sea Background Air and Outflow of Regional Pollution at Tai O, Southern China. J. Atmos. Chem. 2005, 52, 295. [Google Scholar] [CrossRef]
  36. Barletta, B.; Meinardi, S.; Sherwood Rowland, F.; Chan, C.-Y.; Wang, X.; Zou, S.; Yin Chan, L.; Blake, D.R. Volatile organic compounds in 43 Chinese cities. Atmos. Environ. 2005, 39, 5979–5990. [Google Scholar] [CrossRef] [Green Version]
  37. Wang, M.; Lu, S.; Shao, M.; Zeng, L.; Zheng, J.; Xie, F.; Lin, H.; Hu, K.; Lu, X. Impact of COVID-19 lockdown on ambient levels and sources of volatile organic compounds (VOCs) in Nanjing, China. Sci. Total Environ. 2020, 757, 143823. [Google Scholar] [CrossRef]
  38. Liu, Y.; Shao, M.; Fu, L.; Lu, S.; Zeng, L.; Tang, D. Source profiles of volatile organic compounds (VOCs) measured in China: Part I. Atmos. Environ. 2008, 42, 6247–6260. [Google Scholar] [CrossRef]
  39. Baudic, A.; Gros, V.; Sauvage, S.; Locoge, N.; Sanchez, O.; Sarda-Estève, R.; Kalogridis, C.; Petit, J.E.; Bonnaire, N.; Baisnée, D.; et al. Seasonal variability and source apportionment of volatile organic compounds (VOCs) in the Paris megacity (France). Atmos. Chem. Phys. 2016, 16, 11961–11989. [Google Scholar] [CrossRef] [Green Version]
Figure 1. Locations of sampling sites in Shandong Province.
Atmosphere 14 00667 g001
Figure 2. Chromatography behavior of 57 VOCs. Denote: 1ethane; 2ethene; 3propane; 4propene; 5acetylene; 6isobutane; 71-butene; 8n-butane; 9trans-2-butene; 10cis-2-butene; 112-methylbutane; 121-pentene; 13n-pentane; 141,3-butadine; 15trans-2-pentene; 16cis-2-pentene; 172,2-dimethylbutane; 18cyclopentane; 192,3-dimethylbutane; 202-methylpentane; 213-methylpentane; 221-hexene; 23hexane; 24methylcyclopentane; 252,4-dimethylpentane; 26benzene; 27cyclohexane; 282-methylhexane; 292,3-dimethylpentane; 303-methylhexane; 31,2,2,4-trimethylpentane; 32heptane; 33methylcyclohexane; 34,2,3,4-trimethylpentane; 35toluene; 36,2-methylheptane; 37,3-methylheptane; 38octane; 39ethylbenzene; 40nonane; 41/42m,p-xylene; 43o-xylene; 44styrene; 45isopropylbenzene; 46propylbenzene; 47m-ethyltoluene; 48p-ethyltoluene; 49mesitylene; 50o-ethyltoluene; 511,2,4-trimethylbenzene; 52decane; 531,2,3-trimethylbenzene; 54m-diethylbenzene; 55p-diethylbenzene; 56undecane; 57dodecane; 58bromochloromethane(Internal standard 1); 59 1,2-difluorobenzene(Internal standard 2); 60 chlorobenzene(Internal standard 3); 61bromochlorobenzene(Internal standard 4).
Atmosphere 14 00667 g002
Figure 3. Percentage of VOCs component and mixing ratios of TVOCs in each sampling site.
Atmosphere 14 00667 g003
Figure 4. Top five VOCs ranked according to Pro-Equiv concentrations in inland sites.
Atmosphere 14 00667 g004
Figure 5. Top five VOCs ranked according to Pro-Equiv concentrations in coastal and background sites.
Atmosphere 14 00667 g005
Figure 6. Top five VOCs ranked according to ozone formation potential and contributions in inland sites.
Atmosphere 14 00667 g006
Figure 7. Top five VOCs ranked according to ozone formation potential and contributions in coastal and background sites.
Atmosphere 14 00667 g007
Figure 8. Source profiles and contribution percentages from each source during the observation period by PMF model.
Atmosphere 14 00667 g008
Table 1. Concentrations of ozone, NOx and metrological parameters in Shandong Province during the sampling periods.
Site Weather Condition
NOX (mg/m3)O3 (μg/m3)T (°C)H (%)
JNMax1041923870
Average36903258
Min1792742
SD194238
DZMax561933588
Average181073168
Min212652
SD1358210
ZBMax1641483587
Average56623067
Min1152452
SD4349311
HZMax421473585
Average21763170
Min9172649
SD839211
DYMax732203583
Average44793167
Min34122749
SD858210
QDMax371643096
Average15932877
Min7222659
SD835110
CDMax2321729100
Average151272781
Min11112555
SD361112
Table 2. Mixing ratios of the most abundant 22 species during sampling (ppbv).
CompoundsMDLInland SitesCoastal SitesBackground Site
JNDZZBHZDYQDCD
MeanSDMeanSDMeanSDMeanSDMeanSDMeanSDMeanSD
Ethane0.20.700.740.420.371.914.20.910.580.850.810.360.340.310.29
Propane0.14.862.51.060.319.821.65.391.03.651.61.050.801.20.64
Isobutane0.051.420.870.400.082982.00.520.250.740.290.190.200.270.15
n-Butane0.13.174.00.670.354421.21.110.291.881.20.320.210.580.37
Isopentane0.021.562.51.060.202.971.91.170.461.200.921.430.221.130.30
n-Pentane0.021.112.31.190.649.872.00.780.350.890.230.690.412.161.4
n-Hexane0.30.621.10.360.200.760.671.220.820.330.310.260.120.240.11
Cyclohexane0.10.091.00.180.130.140.100.760.810.110.090.180.150.120.14
n-Octane0.10.130.23ND a 0.160.150.280.220.040.043.551.10.951.8
Ethene0.093.162.41.420.483.351.01.920.541.601.40.870.300.950.18
Propene0.060.580.400.250.1010.31.00.300.090.320.240.320.460.160.06
1-Butene0.22.752.890.420.1015.11.90.230.10.390.150.950.380.530.28
cis-2-Butene0.050.110.130.190.030.370.430.080.040.190.070.410.070.590.59
trans-2-Butene0.051.943.650.120.0520.71.90.060.030.120.040.280.040.180.03
1-Pentene0.021.442.690.210.160.350.720.050.020.100.050.50.470.160.16
1,3-butadine0.050.360.310.580.212.011.00.690.490.400.120.930.590.230.15
Bezene0.030.791.910.730.261.410.590.600.250.710.571.020.060.980.40
Toluene0.030.410.680.430.281.811.70.860.560.400.270.670.340.530.44
Ethylbenzene0.10.230.470.200.090.390.170.240.160.130.194.521.30.190.23
m,p-Xylene0.050.250.210.370.200.950.500.450.310.250.317.911.30.320.38
o-Xylene0.050.090.100.200.120.350.190.240.110.180.071.941.20.130.12
Acetylene0.072.771.493.030.852.051.40.920.370.750.310.380.180.520.16
TVOC 33.6 15.9 833 21.6 23.3 32.8 15.3
a: not detected.
Table 3. Rate constant of VOCs react with OH.
CompoundsKOH × 1012CompoundsKOH × 1012
ethane0.262,3-dimethylpentane6.3
ethene8.523-methylhexane7.18
acetylene0.92,2,4-trimethylpentane3.34
propane1.15heptane7.15
propene26.3methylcyclohexane10.4
isobutane2.122,3,4-trimethylpentane6.6
n-butane2.54toluene5.96
1-butene31.402-methylheptane5.2
trans-2-butene56.43-methylheptane8.54
cis-2-butene64octane8.68
isopentane3.6ethylbenzene7
1-pentene31.4m/p-xylene19
pentane3.94styrene10
1,3-butadine101o-xylene13.7
trans-2-pentene65nonane8.11
cis-2-pentene67isopropylbenzene6.3
2,2-dimethylbutane2.32propylbenzene6
cyclopentane5.16m-ethyltoluene0.32
2,3-dimethylbutane6.3p-ethyltoluene0.37
2-methylpentane5.6mesitylene57.5
3-methylpentane5.7o-ethyltoluene0.8
1-hexene371,2,4-trimethylbenzene32.5
hexane5.61decane11
methylcyclopentane7.051,2,3-trimethylbenzene32.7
2,4-dimethylpentane4.77m-diethylbenzene24.3
benzene1.23p-dimethylbenzene24.3
cyclohexane7.49undecane12.3
2-methylhexane7.18dodecane13.2
Disclaimer/Publisher’s Note: The statements, opinions and data contained in all publications are solely those of the individual author(s) and contributor(s) and not of MDPI and/or the editor(s). MDPI and/or the editor(s) disclaim responsibility for any injury to people or property resulting from any ideas, methods, instructions or products referred to in the content.

