Article

Screening of Absorbents for Viscose Fiber CS2 Waste Air and Absorption–Desorption Process

Jiangsu Co-Innovation Center of Efficient Processing and Utilization of Forest Resources, College of Chemical Engineering, Nanjing Forestry University, Nanjing 210037, China
*
Author to whom correspondence should be addressed.
Atmosphere 2023, 14(3), 602; https://doi.org/10.3390/atmos14030602
Submission received: 8 February 2023 / Revised: 10 March 2023 / Accepted: 20 March 2023 / Published: 22 March 2023
(This article belongs to the Section Air Pollution Control)

Abstract

:
Screening of absorbents is essential for improving the removal rate of carbon disulfide (CS2) waste air by absorption. In this work, the UNIFAC model in Aspen Plus was utilized to calculate the excess Gibbs function and absorption potential of the binary system of CS2 with various alcohols, ethers, esters, amines, and aromatic hydrocarbons. The results were used to quantitatively compare the efficiency of each solvent for CS2 absorption. The theoretical predictions were then verified by absorption experiments in a packed tower. The results showed that the performance of various solvents to CS2 roughly followed the order of esters < alcohols < amines < heavy aromatics < glycol ethers. Meanwhile, N-methyl-2-pyrrolidone (NMP) is the optimal absorbent for CS2 waste air treatment. Additionally, the process parameters of absorption and desorption of NMP were optimized. The results illustrated that the average mass removal efficiency of CS2 by NMP is 95.2% under following conditions: liquid–gas ratio of 3.75 L·m−3, a temperature of 20 °C, and inlet concentration lower than 10,000 mg·m−3. Under the conditions of 115 °C, 10 kPa, and a desorption time of 45 min, the average desorption rate of CS2 is 99.6%, and the average water content after desorption is 0.39%. Furthermore, the recycled lean liquid can maintain an excellent CS2 purification effect during the recycling process.

1. Introduction

Viscose fiber is classified as regenerated cellulose prepared using natural cellulose as raw material through the viscose process. With the merits of absorbing features and excellent performance, viscose fiber has been widely used. As the most critical solvent, carbon disulfide (CS2) is often used to produce viscose fiber. Because of this, CS2 is inevitably emitted into the atmosphere through exhaust gases [1,2]. Meanwhile, studies on the traceability of CS2 in the atmosphere have also confirmed that human activity is the primary source of CS2 [3,4,5]. Atmospheric CS2 is rapidly oxidized to carbonyl sulfide and sulfur dioxide, which play an essential role in the global sulfur cycle [6]. The newly produced carbonyl sulfide and CS2 affect stratospheric ozone levels and contribute to acid rain formation [4]. Furthermore, CS2 is a dual odorous and harmful gas [7], which not only damages the human reproductive system [8], but also causes hearing loss [9,10]. Moreover, Schramm et al. [11] reported that long-term exposure to CS2 increases the risk of cardiovascular disease in humans. Therefore, it is urgent to achieve efficient recovery and environmental treatment of CS2 waste air in industrial processes.
Currently, the treatment technology of CS2 waste air can be divided into two categories: elimination and recovery [2]. The elimination technologies mainly include catalytic hydrolysis [12,13,14,15], oxidation [16,17], and biodegradation [18,19,20]. Elimination technologies, as a promising strategy for CS2 treatment, have attracted widespread scientific attention. However, the complex process and the issue of destroying the molecular structures of CS2 considerably hamper its practical application in industrial processes, while the recovery technologies mainly include adsorption [21,22,23,24,25] and absorption. The adsorption method performs excellent removal, which is particularly applied for CS2 waste air with large air volumes and low concentrations [26,27,28]. However, the adsorption method has poor applicability due to the adsorbent being easily deactivated and hardly regenerated under the conditions of actual CS2 waste air in viscose fiber plants. In contrast, the absorption method comes to the fore in the CS2 waste air recovery strategy on account of the advantages of a simple process, convenient operation, recyclable absorbent, and suitability for treating high-concentration waste air. Thus, it has received the attention of many scholars. For instance, Heldebrant et al. [29] studied the absorption and desorption of CS2 in three ionic liquids, drawing on the experience of CO2 absorption. They noted that CS2 reacts similarly to CO2 towards amidine/alcohol and guanidine/alcohol blends. Huo et al. [30] developed the UDS-F solvent to decline the simulated CS2 waste air concentration from 400 mg·m−3 to 79 mg·m−3 (atmospheric pressure, 50 °C, and the liquid–gas ratio of 500). Although the mass removal efficiency of UDS-F solvent obtained from their experiments was only 80.3% for CS2 exhaust, its removal effect was already significantly better than that of the conventional absorbent N-methyldiethanolamine (MDEA).
It is well-known that the screening of absorbents is critical to enhance the mass removal efficiency and reduce process energy consumption and cost. Previously, some scholars have proposed methods for screening absorbents or evaluating absorbents’ merits and demerits [31,32]. An absorbent screening method was established by Wang et al. [33] with SO2 absorption capacity and desorption reaction heat values as indicators. Yet their method is inappropriate for the screening of absorbents for physical absorption processes. In addition, Lhuissier et al. [34] established a mass transfer model (i.e., SSR model) for predicting the total transfer coefficient of a packed tower. They successfully predicted the removal rate of VOCs, such as ethyl acetate, isopropanol, and toluene, from transformer oil and lubricant oil with the help of the SSR model. Rodriguez Castillo et al. [35] derived Henry’s law constants between different ionic liquids and toluene or dichloromethane by measuring the liquid–gas partition coefficients at equilibrium and then measured the diffusion coefficients of the gas molecules in the ionic liquid using a thermogravimetric microbalance (IGA-003). Finally, they used the above physical parameters obtained from these experiments to simulate the absorption process and evaluate the removal of toluene and methylene chloride from 23 different ionic liquids. Wang et al. [36] used IGA-003 to evaluate the absorption effect of dichloromethane in [Bmim][PF6] through a similar research approach. The difference is that they obtained data on the solubility of dichloromethane in [Bmim][PF6] at different pressures and then used a thermodynamic model fit to obtain Henry’s law constant. Although the scholars mentioned above provided three different methods for screening or evaluating absorbents, each requires extensive experiments to provide mass transfer data. This experimental process is costly and time-consuming; for example, each set of solubility data in the study of Wang et al. [36] took over 72 h. Meanwhile, IGA-003 requires a very low saturation vapor pressure of the solvent being measured, which limits its use in assessing the physical property data between organic solvents and exhaust gases. Furthermore, to our knowledge, no scholars have proposed a simple sorbent screening method in which CS2 was selected as the primary treatment target.
In this paper, the CS2 absorbers were effectively screened based on the theory of excess Gibbs function and absorption potential. Then, the feasibility of this theoretical prediction method was verified through the absorption experiment. Moreover, the absorption and desorption process parameters were experimentally optimized, laying the foundation for further industrial applications. The study results provide specific theoretical support for the resource recovery of CS2 waste air from viscose fiber plants and also provide an academic reference for the design of absorber compound formulations.

2. Materials and Methods

2.1. Experimental Reagents

Table 1 presents the reagents utilized in the experiments along with their respective specification parameters.

2.2. UNIFAC Model Simulation Calculation

The excess Gibbs function ( G E ) of the binary system is expressed as Equation (1).
G E = R T ( n 1 ln ξ 11 x 1 + n 2 ln ξ 22 x 2 ) ξ 11 = x 11 V m 1 x 11 V m 1 + x 21 V m 2 ; ξ 22 = x 22 V m 2 x 12 V m 1 + x 22 V m 2
where x i is i -molecular macromolecular fraction, ξ 11 and ξ 22 are local volume fractions, x i j is the local molecular fraction of j -molecules around i -molecules, and V m 1 and V m 2 both represent the local molecular volume.
If V m 1 V m 2 , ξ 11 x 11 , ξ 22 x 22 can be obtained according to Equation (1). When the attraction between different molecules is stronger than that between the same molecules, then ξ 11 < x 1 , ξ 22 < x 2 . The further conclusion is that G E < 0 , and the smaller G E illustrates the stronger attraction between dissimilar molecules. The maximum excess Gibbs function ( G max E ) is an extreme point of G E that exists under a certain temperature and pressure. The value of G max E is inversely proportional to the affinity between the absorbent molecules.
The absorption potential ( ψ i ) of the binary system is calculated by Equation (2).
ψ i = 1 γ i
where ψ i is the absorption potential, and γ i is the infinite dilution activity coefficient of the i -component in the binary system. ψ i can reflect the solubility of a component in a solvent within a certain range; a larger value of ψ i shows a better compatibility of the corresponding solute with the solvent.
G max E and ψ i can be further calculated from the liquid–gas equilibrium data in the full concentration range of the binary system calculated by the UNIFAC model in Aspen Plus V11. Herein, G max E and ψ i of the binary system composed of CS2 and 30 pure solvents (water, alcohols, glycol ethers, esters, amines, aromatic hydrocarbons, etc.) were calculated, respectively. In order to verify the feasibility of extending the absorbent screening theories of G max E and ψ i into the screening of CS2 waste air absorbents, we selected the solvents from the abovementioned solvents for absorption experiments.

2.3. Experimental Method

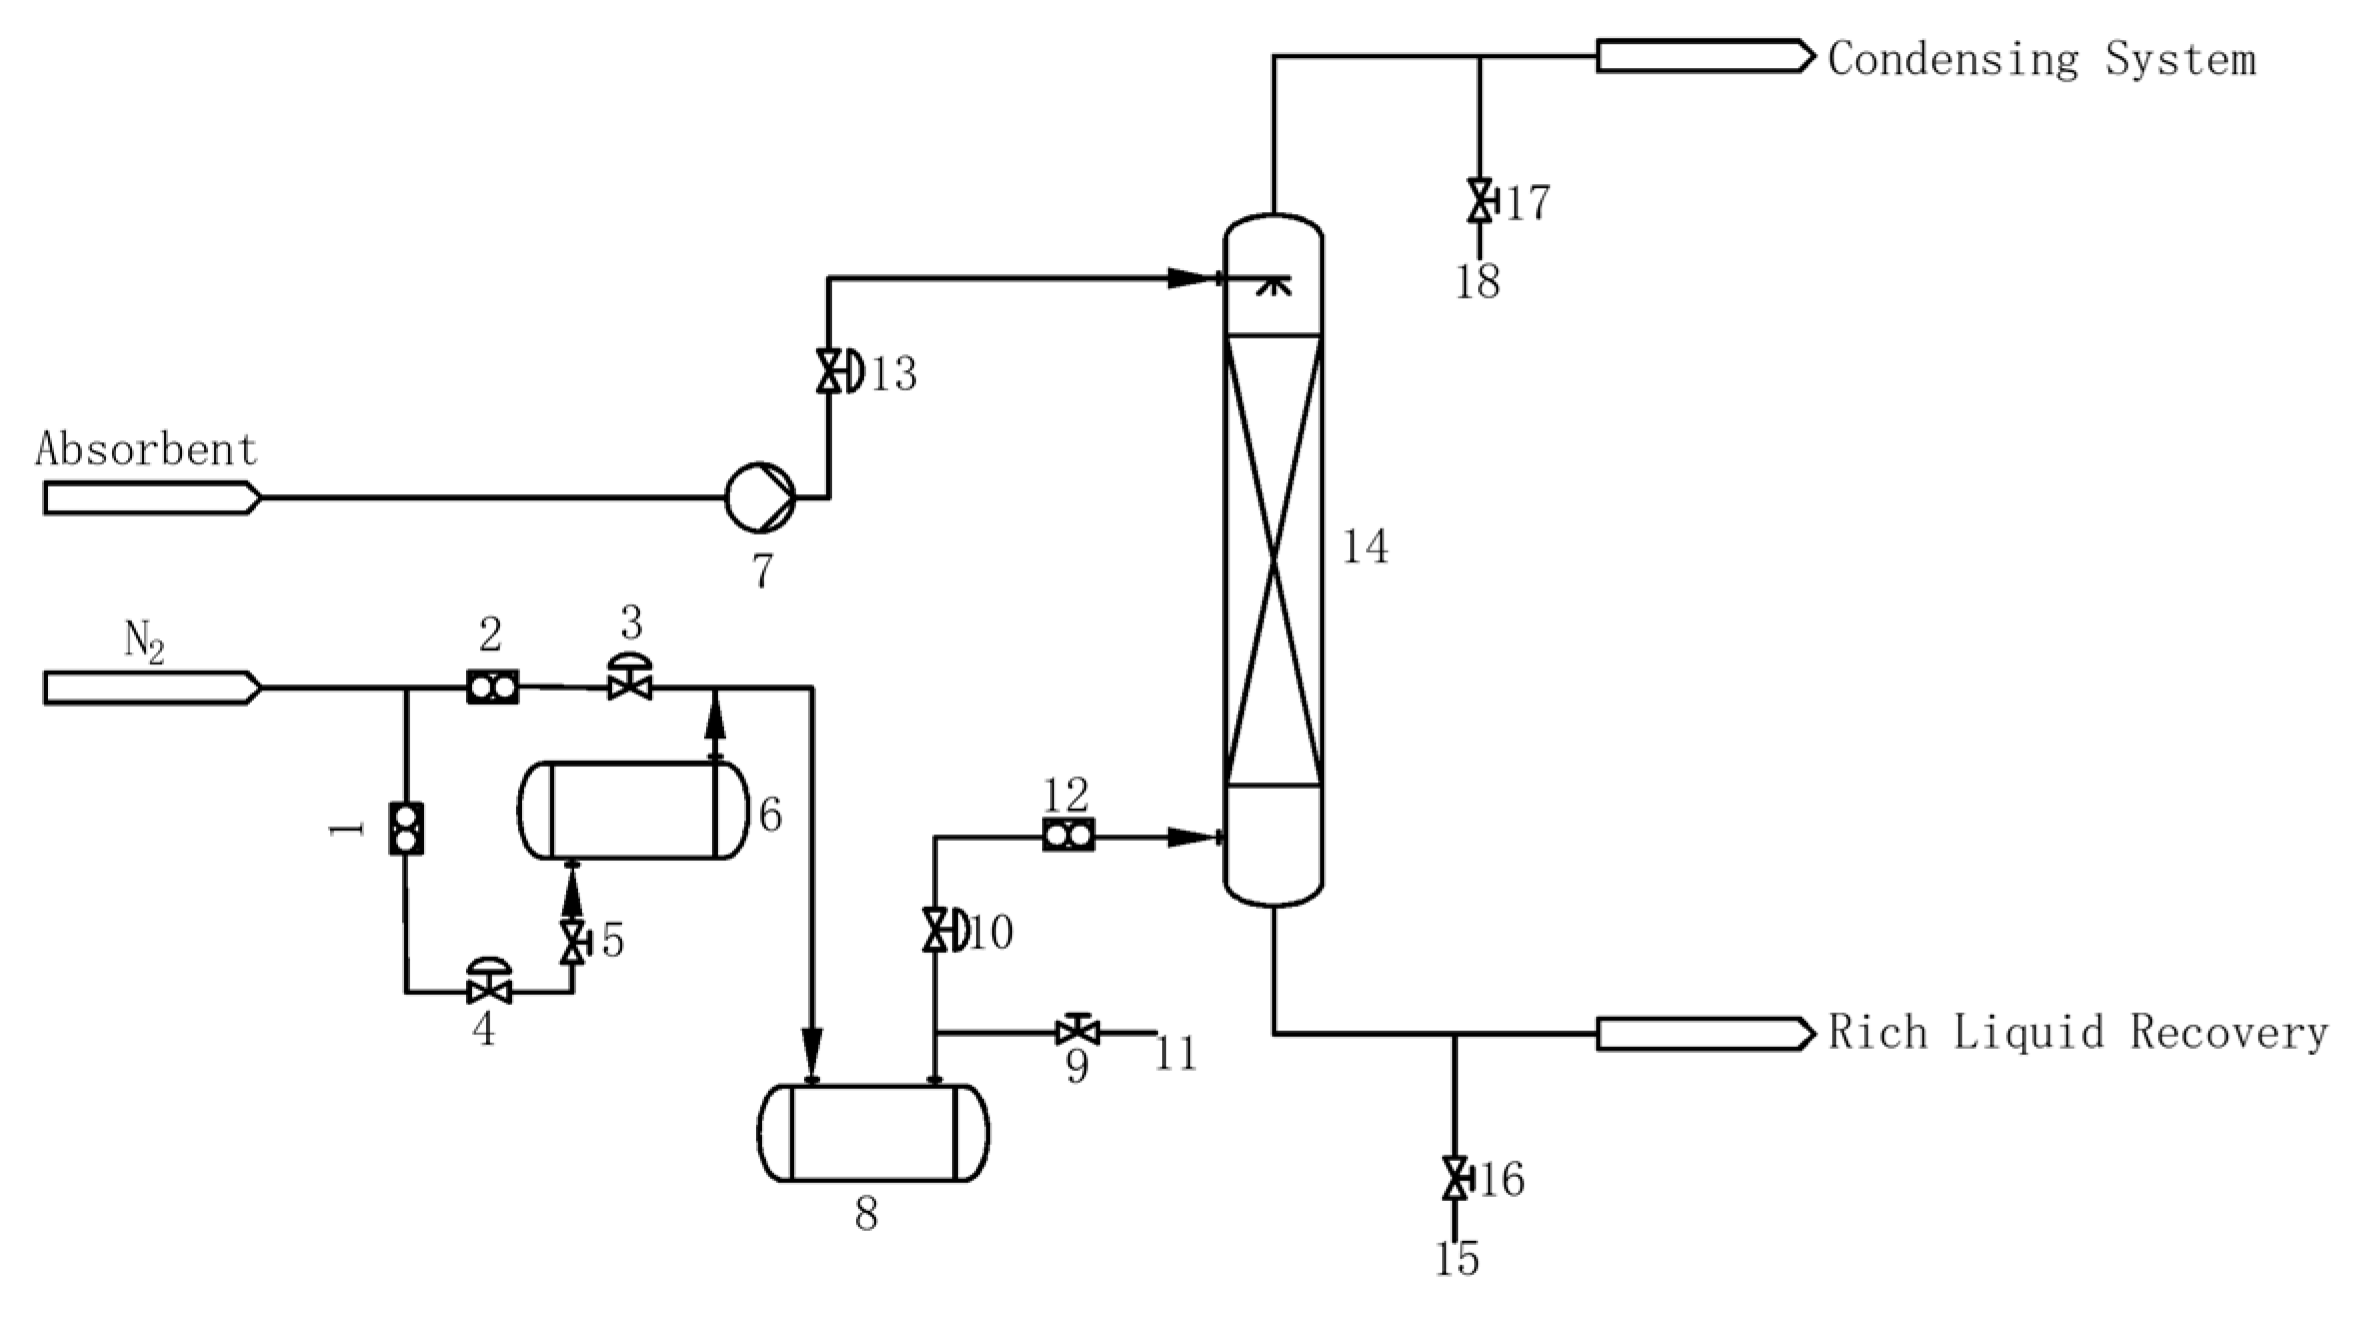
2.3.1. Absorption Experiment Process

The specified concentration of CS2 waste air was simulated by bubbling. The CS2 waste air flows from bottom to top in the tower, and the absorbent contacts the gas countercurrent in the tower. After the absorption treatment, the tail gas enters the condensation system, and the absorption-rich liquid is extracted from the discharge port of the lower section of the absorption tower.

2.3.2. Experimental Analysis

The concentration of CS2 gas was measured by DEA spectrophotometry (GB/T 14680-93) [37,38]. The specific measurement method is as follows:
(1)
Preparation of absorption solution: 0.0500 g of copper acetate was dissolved in anhydrous ethanol in a 100.0 mL volumetric flask, and the volume was fixed and stored in a refrigerator at low temperature. After adding 300.0 mL of absolute ethanol to the 500.0 mL volumetric flask, 10.0 mL of copper acetate ethanol solution, 2.5 mL of DEA, and 2.5 mL of triethanolamine were added to the solution in sequence. After the above operations, anhydrous ethanol was used to make up the volume to the mark to obtain the absorption solution. (The above solutions need to be used and prepared now.)
(2)
Preparation of CS2 standard solution: 15.0 mL of absolute ethanol and 1 to 2 drops of CS2 were sequentially added to a 25.0 mL volumetric flask, and the mass was recorded (accurate to 0.0001 g) with the stopper closed. Absolute ethanol was used to bring up to the mark and calculate the concentration of CS2. The above solution was then diluted with absolute ethanol to contain about 10.00 μg of CS2 standard solution per milliliter.
Draw the CS2 standard curve: The standard solutions in Table 2 were prepared in 10 colorimetric tubes (10.0 mL) with stoppers. After each tube was mixed evenly, it was placed for 20 min. The absorbance of different samples was measured with absolute ethanol as a reference (435 nm, 3 cm cuvette). The CS2 standard curve was plotted as shown in Figure 1.

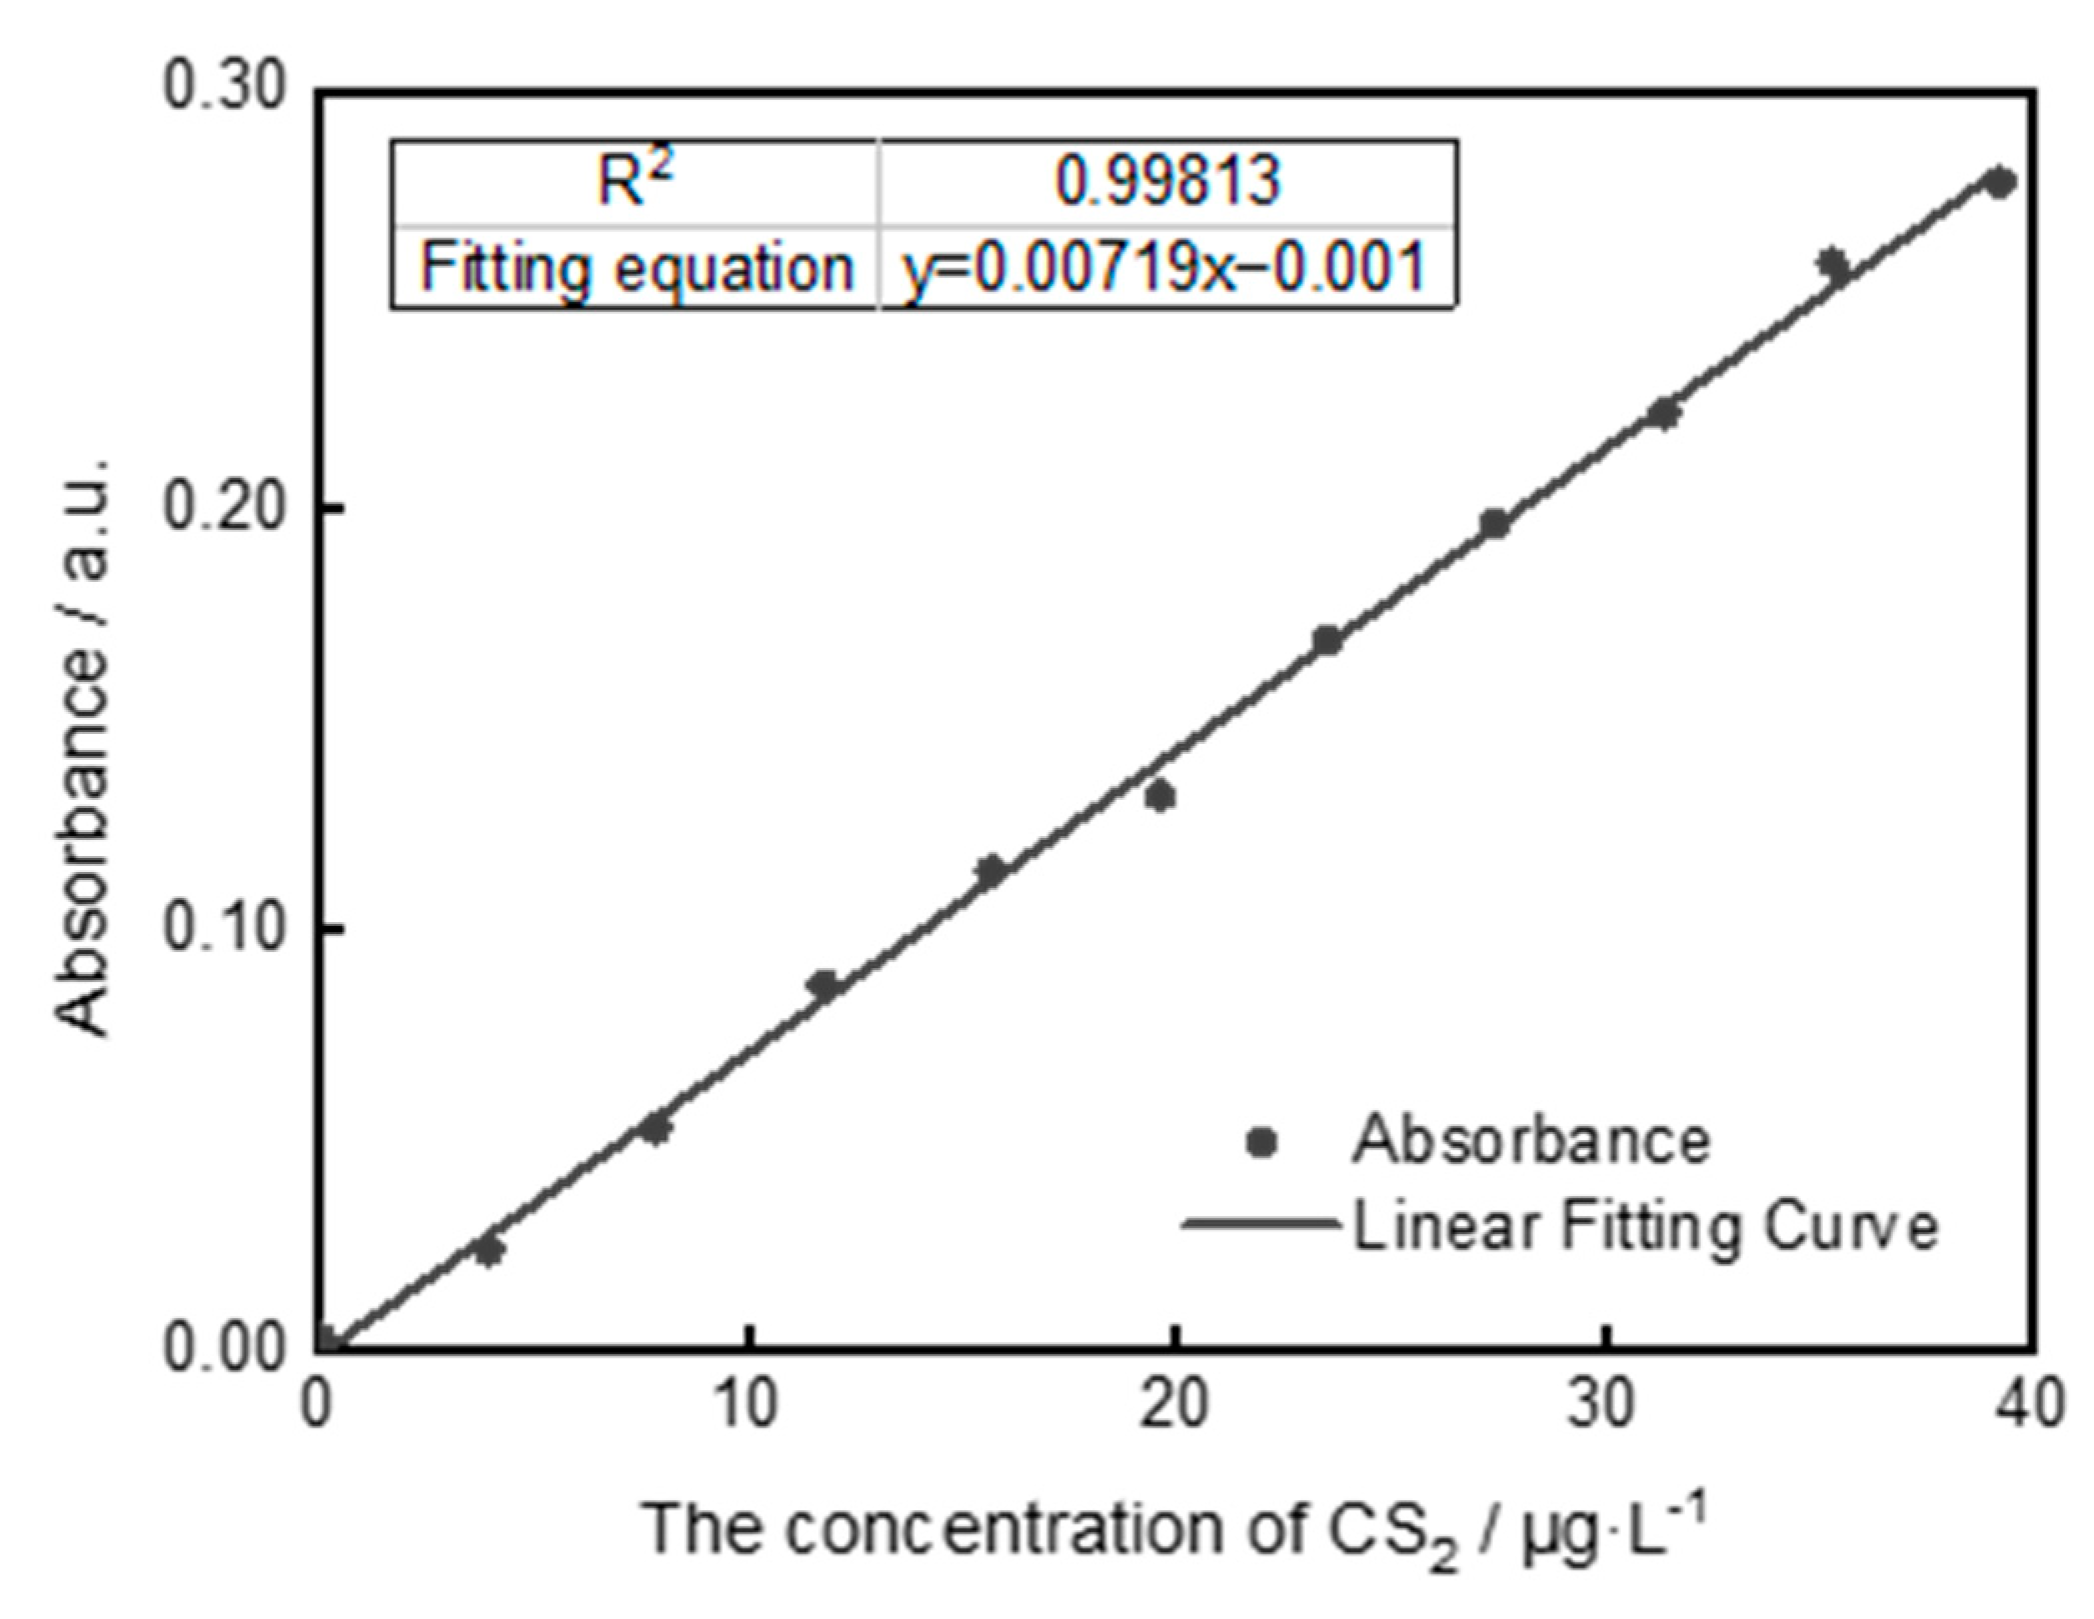
2.3.3. CS2 Gas Mass Concentration

Gas sampling was carried out using an absorbing liquid in an ice-water bath, the sample was placed at room temperature, and the sample liquid was prepared. Take an appropriate amount of sample into a 10.0 mL colorimetric tube with a stopper, add absorbing solution to the mark, and shake well. Then, follow the steps of drawing a standard curve, and check the content of CS2 on the standard curve.
The formula for calculating the mass concentration of CS2 gas is shown in Equation (3).
C = m V 1 V 2 V n
where C is the concentration of CS2 in the measured gas, mg·m−3; m is the amount of CS2 in the sample liquid taken during the sample measurement, μg; V 1 is the constant volume of the sample solution, mL; V 2 is the volume of the sample solution taken during the measurement, mL; and V n is the gas production volume in the standard state, L.

2.3.4. Mass Removal Efficiency for CS2

The calculation formula of the CS2 mass removal efficiency is shown in Equation (4) [34].
η 1 = C i n C o u t C i n × 100 %
where η 1 is the mass removal efficiency for CS2; C i n is the intake concentration for CS2, mg·m−3; and C o u t is the CS2 waste air concentration, mg·m−3.

2.4. Absorption and Desorption Process

2.4.1. Absorption Process

The absorption experiment device shown in Figure 2 is used in the study of the absorption process. The influence of process parameters such as liquid–gas ratio, absorbent temperature, and intake air concentration on the mass removal efficiency, is considered, and the optimal absorption process conditions are determined through multiple sets of experiments.
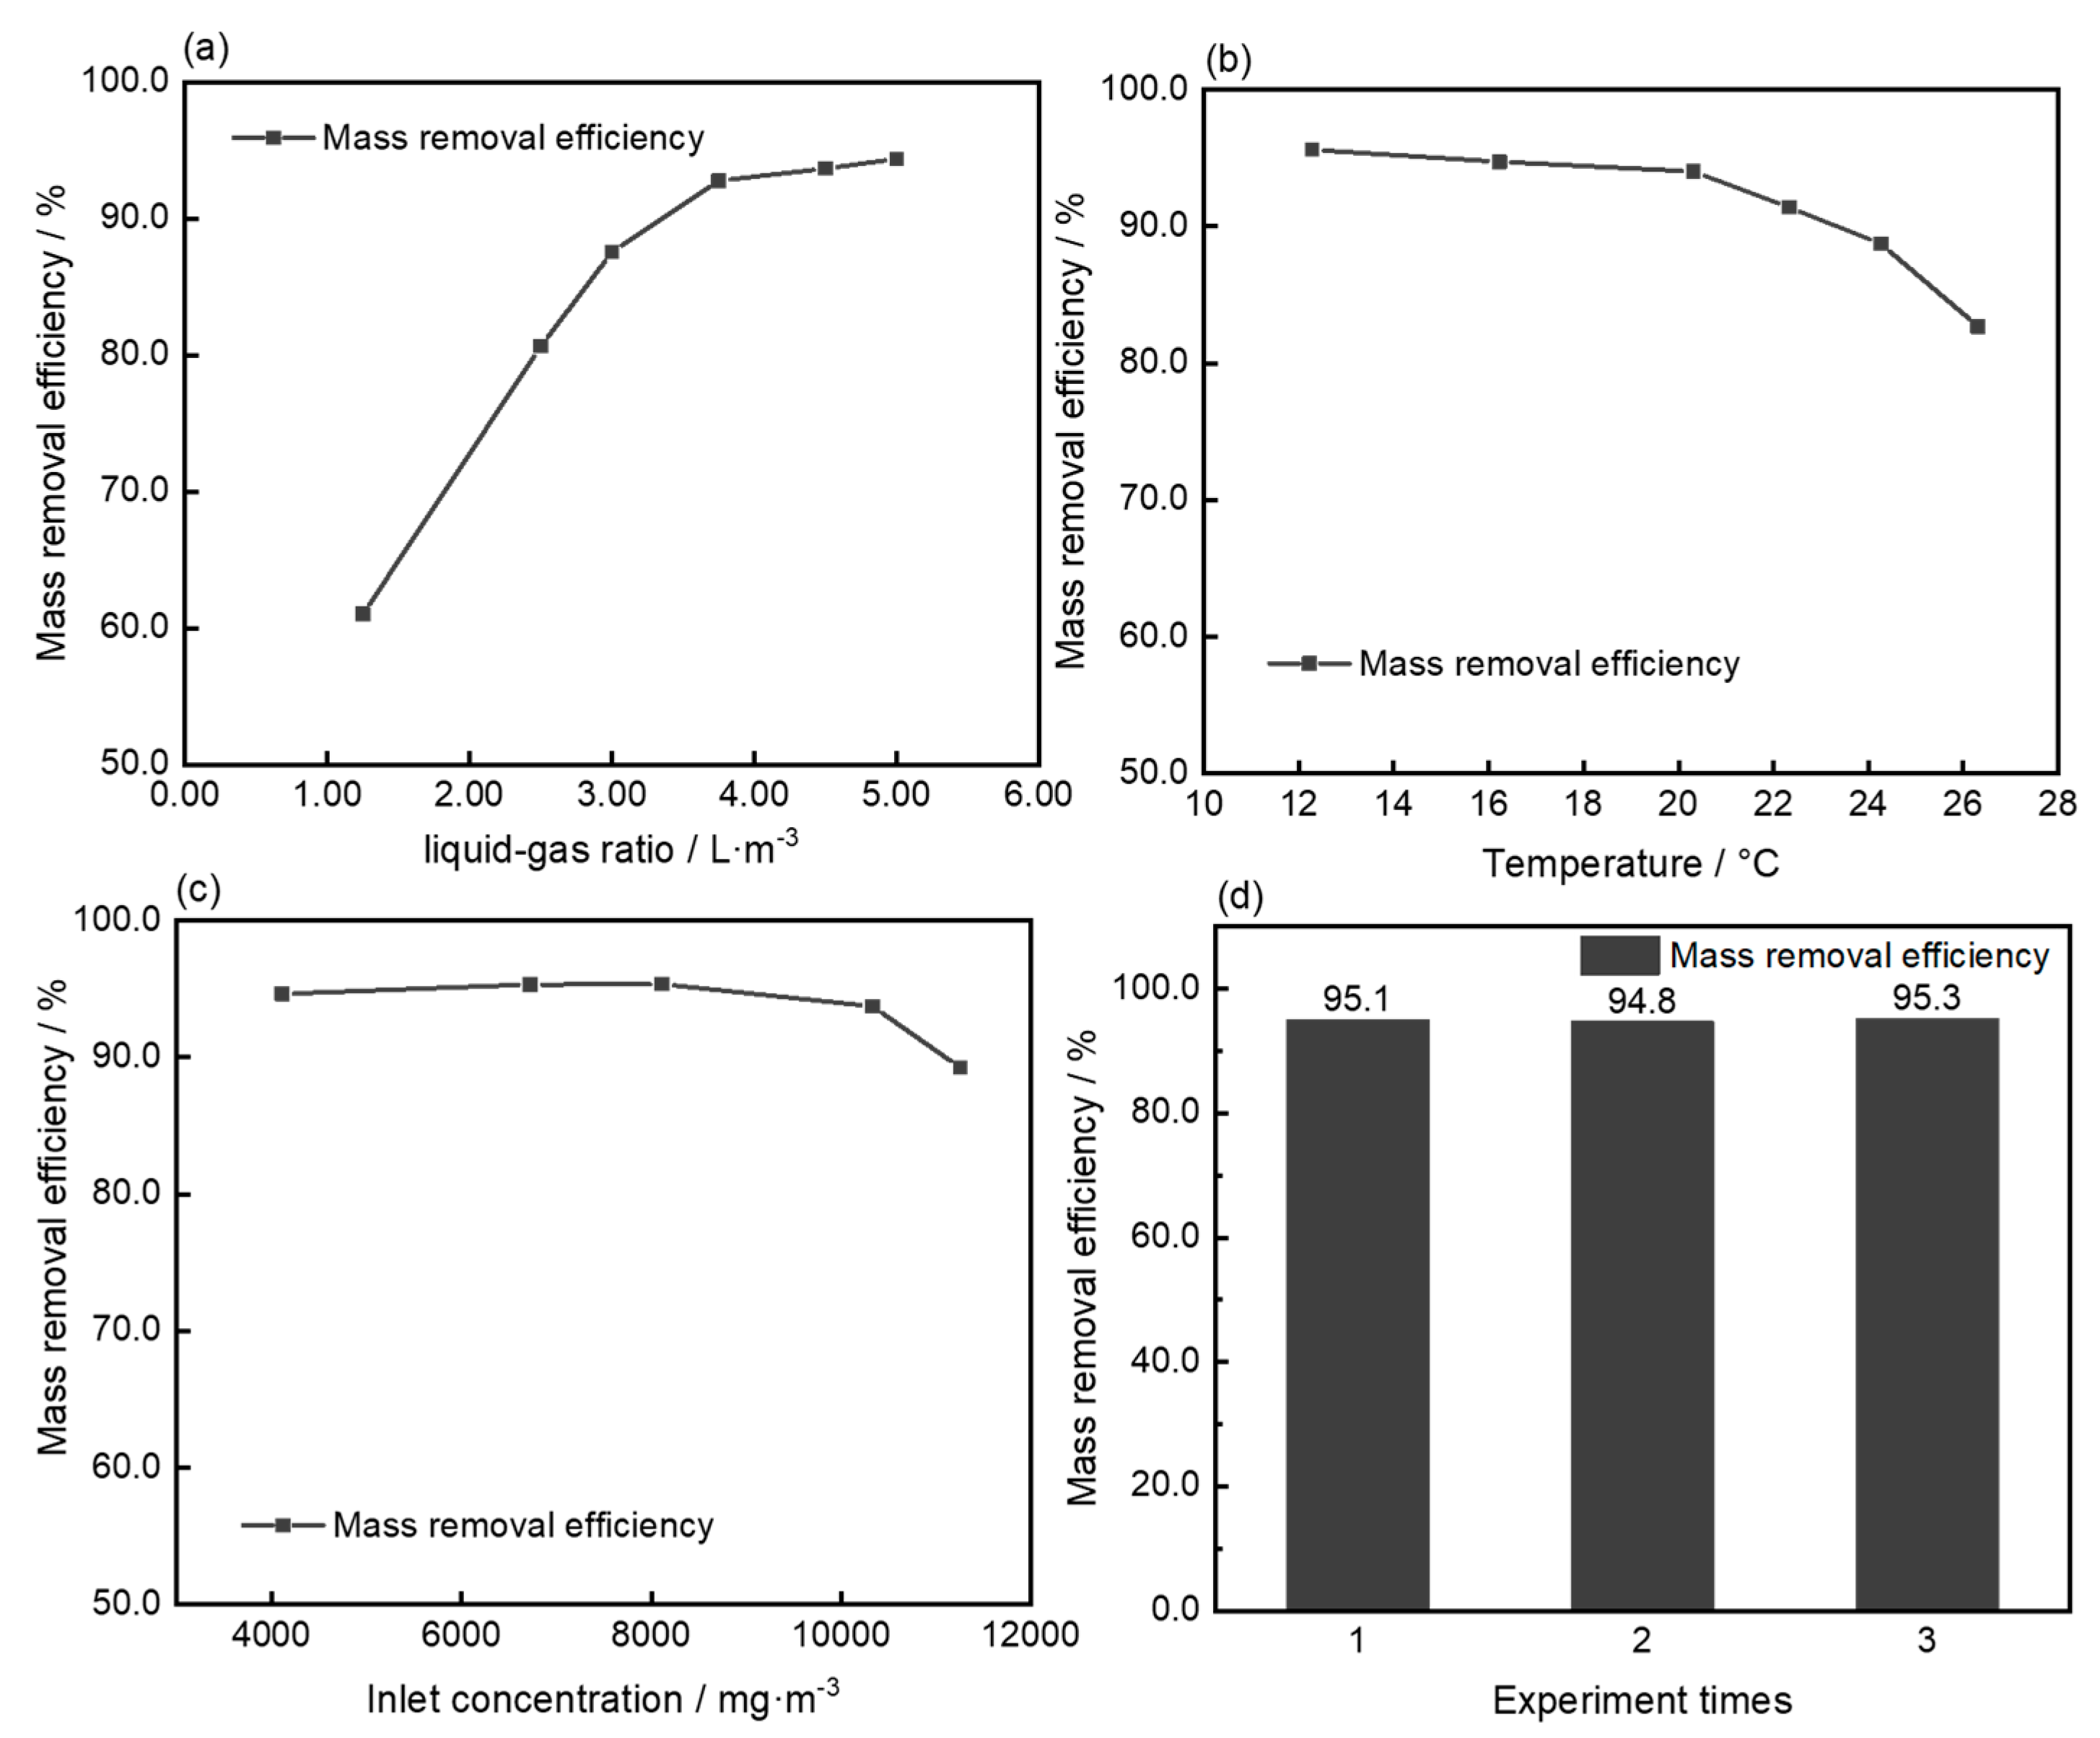
  • The effect of the liquid–gas ratio on mass removal efficiency
Under the condition that other factors remain unchanged, the liquid–gas ratio is adjusted by fixing the gas flow rate and adjusting the liquid flow rate. The other relevant experimental conditions are as follows: the intake air concentration is 8000 mg·m−3, the gas flow rate is 0.24 m3·h−1, and the absorption temperature is 20 °C.
2.
The effect of temperature on the mass removal efficiency
When investigating the effect of different temperatures on the mass removal efficiency of CS2, the remaining relevant experimental conditions are: the intake air concentration is 8000 mg·m−3 and the liquid–gas ratio is 3.75 L·m−3.
3.
The effect of intake air concentration on the mass removal efficiency
When investigating the effect of different intake air concentrations on the CS2 mass removal efficiency, the remaining relevant experimental conditions are: temperature 20 °C, liquid–gas ratio 3.75 L·m−3.

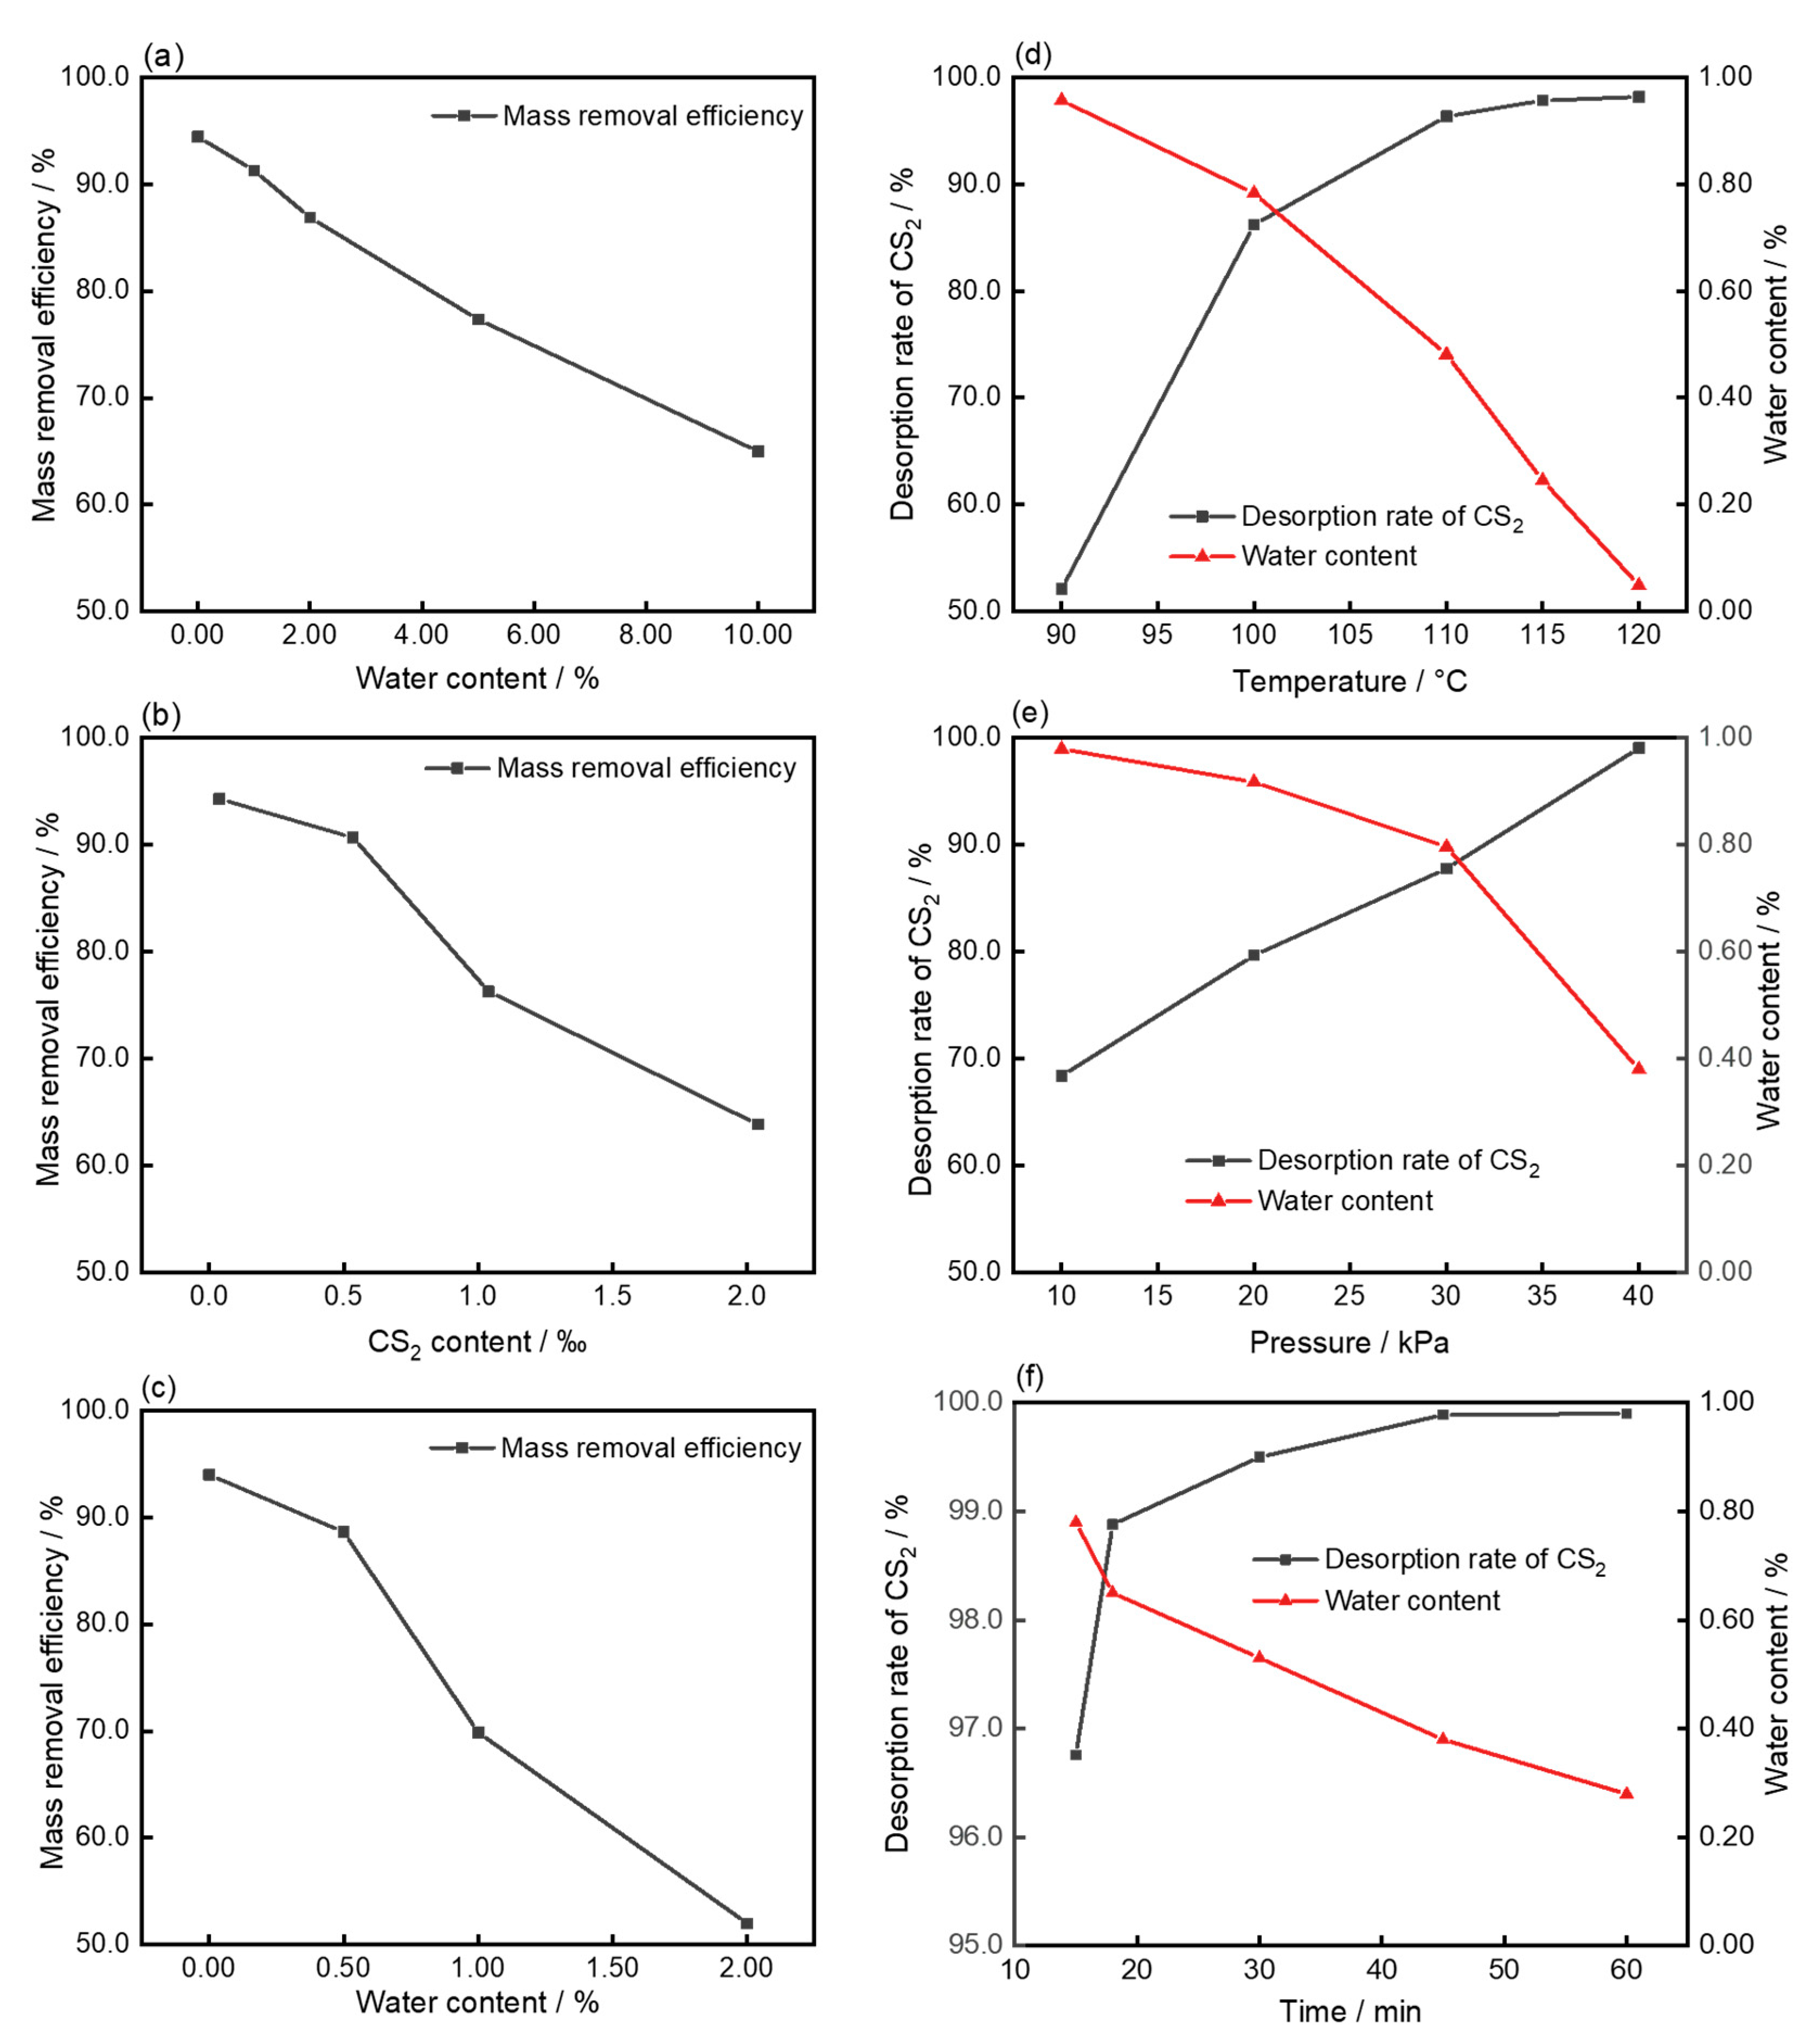
2.4.2. Factors Affecting the Resorption Performance of Regeneration Lean Liquid

Generally speaking, the water content and CS2 content in the absorbent are the main factors affecting the absorption performance of the regeneration lean liquid. Using the absorption apparatus depicted in Figure 2, this study investigated the influence of water and CS2 contents on the mass removal efficiency of the regenerated lean liquid. Considering that the water and CS2 contents in the absorbent have a synergistic effect on the mass removal efficiency, 0.5‰ of CS2 was added to the absorbent with different water contents to investigate the synergistic effect on the mass removal efficiency (the intake air concentration was 8000 mg·m−3; the liquid–gas ratio was 3.75 L·m−3; the temperature was 20 °C).
The moisture content was measured using a Karl Fischer method trace moisture analyzer (BYES-8, Bangyi Precision Measuring Instrument Co., Ltd., Shanghai, China), and the formula for calculating the moisture content is (Equation (5)):
W = T × V m × 100 %
where W is the moisture content, %; T is the titer of Karl Fischer reagent in water, g/mL; V is the injection volume, mL; and m is the quality of the sample, g.
The content of CS2 in the liquid before and after desorption was measured by UV spectrophotometer. The calculation formula of CS2 desorption rate is (Equation (6)):
η 2 = m 1 m 2 m 1 × 100 %
where η 2 is the CS2 desorption rate, %; m 1 is the CS2 content in the rich liquid before desorption, g; and m 2 is the residual CS2 content in the lean liquid after desorption, g.

2.4.3. Desorption Process

The main factors that influence the desorption effect are temperature, pressure, and time. To simulate the absorption of rich liquid, 1% water and 1.5‰ CS2 are added to the absorbent. The effect of temperature on the analytical effect is analyzed (10 kPa, 20 min). The effect of pressure on the analytical effect is analyzed (115 °C, 20 min). The effect of time on the analytical effect is analyzed (115 °C, 15 kPa).

3. Results and Discussion

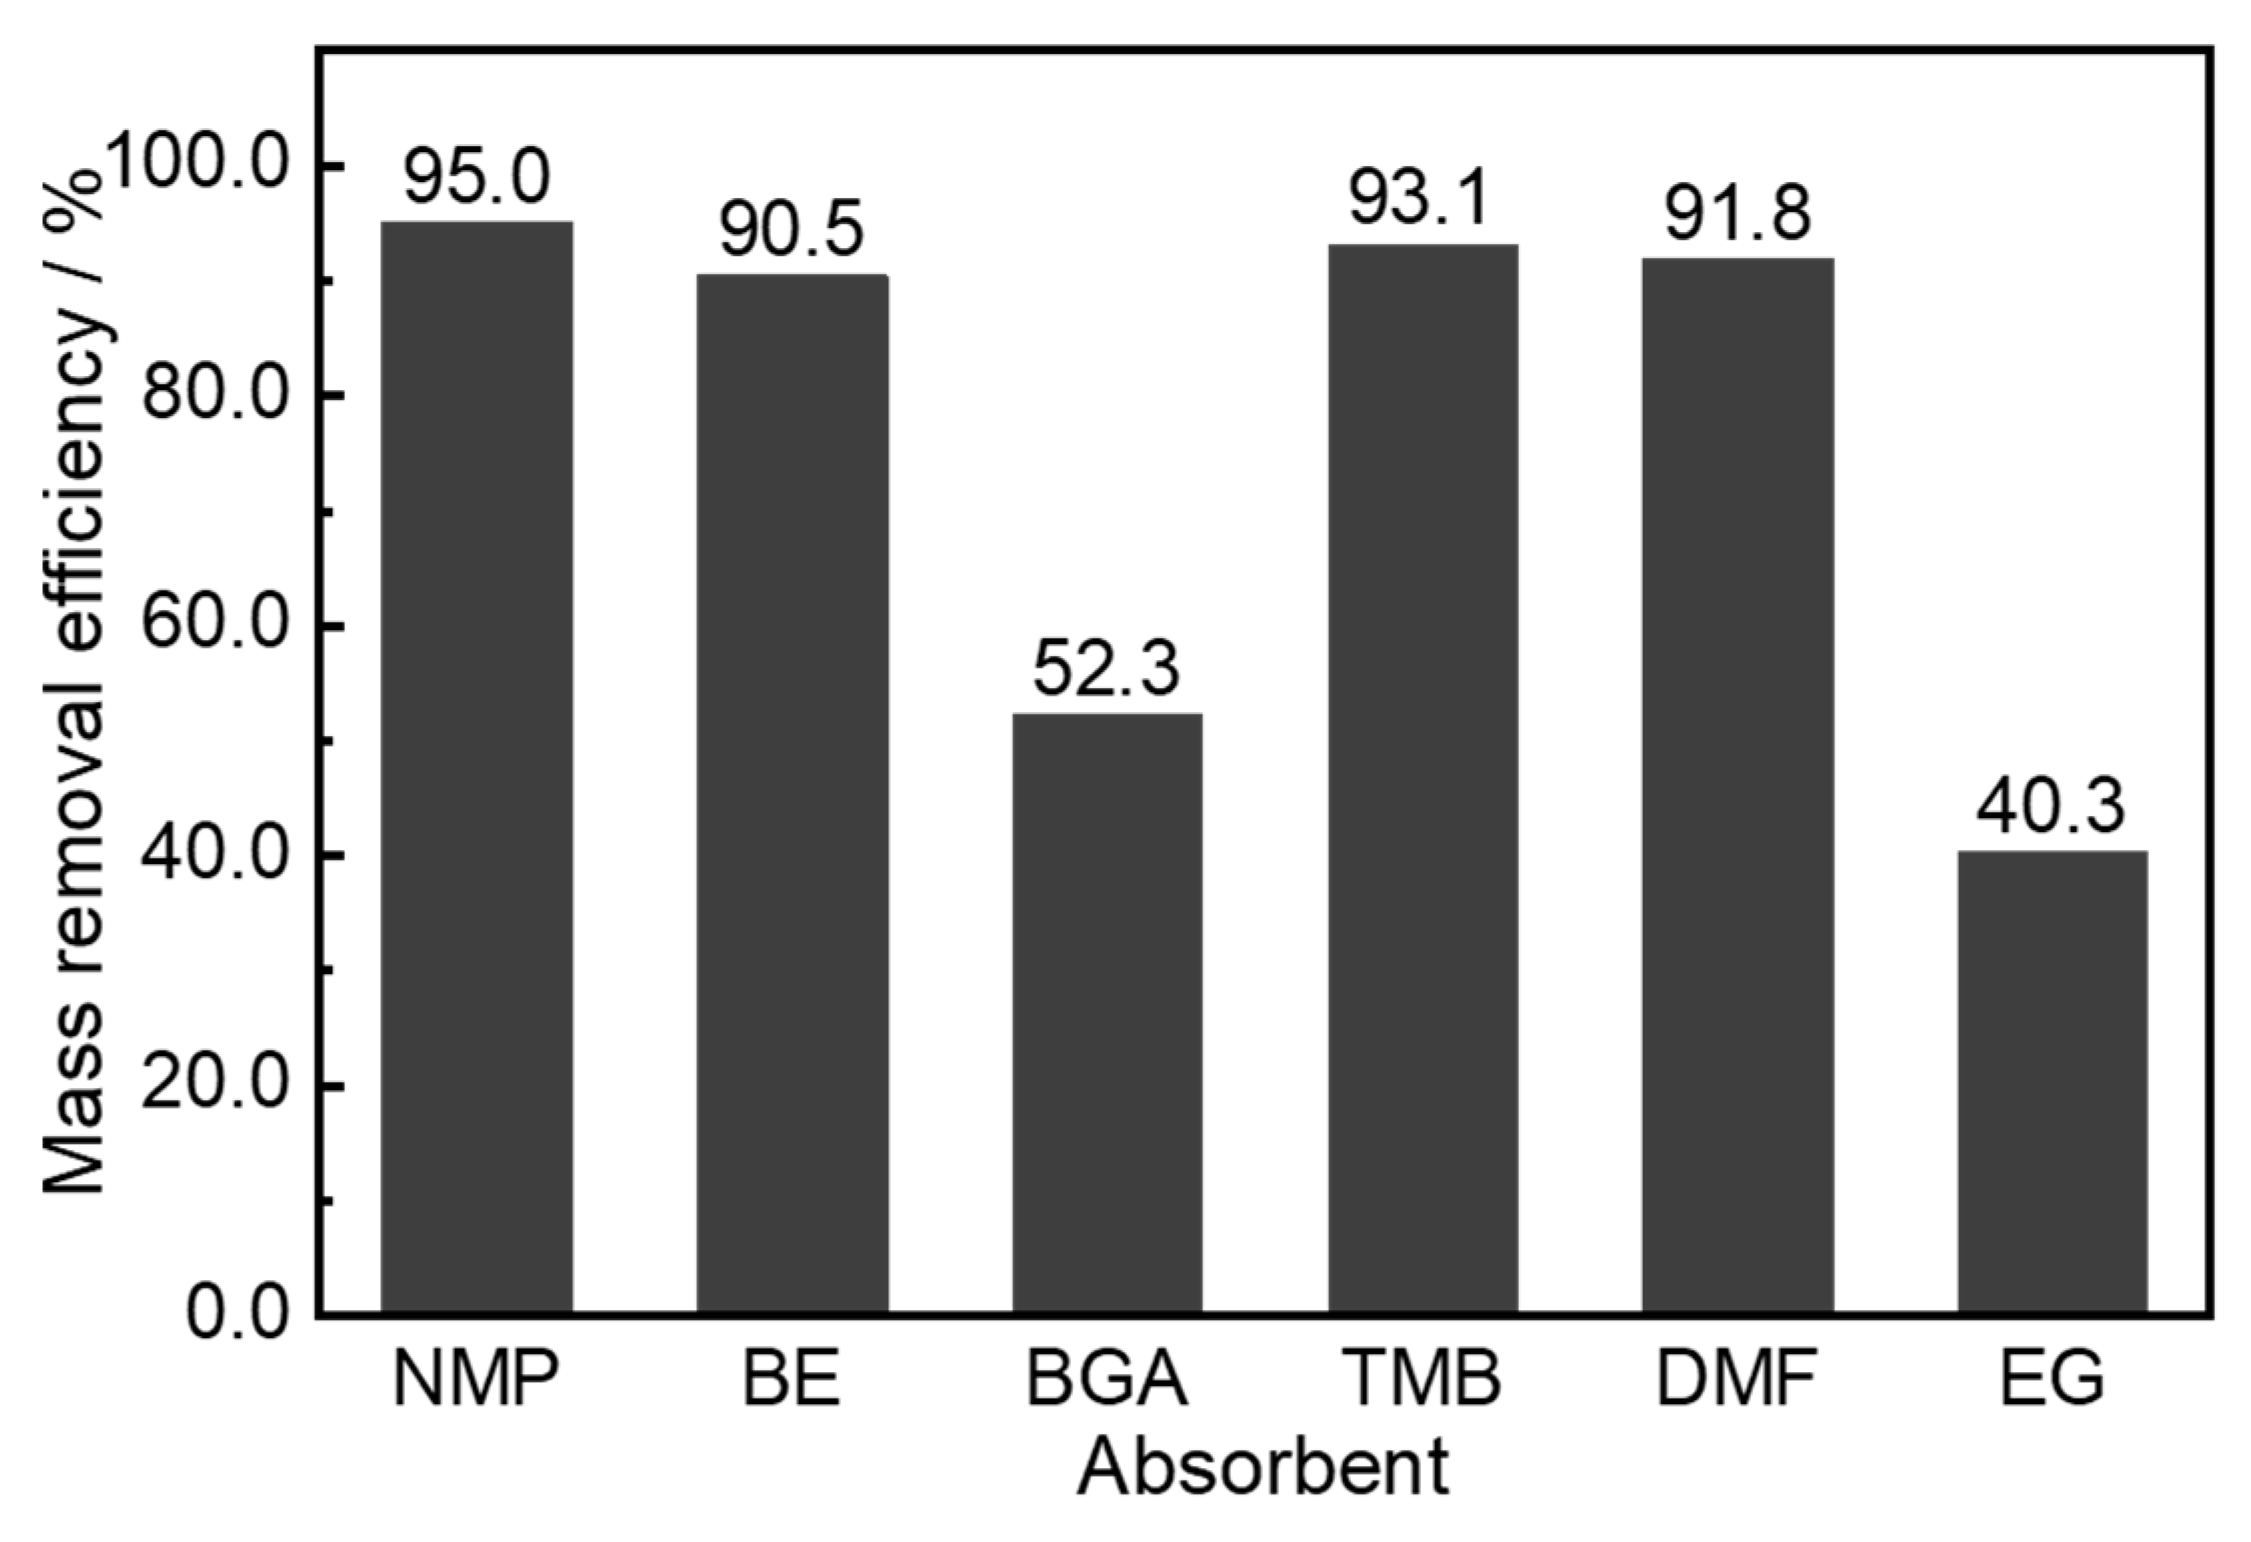
3.1. Analysis of Absorbent Screening Results

G max E and ψ i of various solvent and CS2 composition systems calculated by Aspen Plus V11 are shown in Table 3. As can be seen from Table 3, the absorption capability follows the order of esters < alcohols < amines < heavy aromatics < glycol ethers. Generally, according to the principle of “similarity-solubility”, the order of the above should be glycol ethers > heavy aromatics > esters > alcohols > amines. However, CS2 is a nonpolar reagent with a linear geometry similar to CO2. It interacts with polar molecules via van der Waals forces and dipole–dipole interactions, which may be responsible for the superior affinity of CS2 even in partially polar solvents. In fact, reports of the increased physical uptake of CO2 resulting from van der Waals and dipole–dipole forces are commonplace [39,40].
The average mass removal efficiency results obtained after multiple groups of absorption experiments for NMP, BE, BGA, TMB, DMF, and EG are shown in Figure 3. The order of the mass removal efficiency of each solvent on CS2 waste air is as follows: NMP > TMB > DMF > BE > BGA > EG. Combining with the data in Table 3, it can be seen that in addition to BE and EG, the mass removal efficiencies of NMP, TMB, DMF, and BGA on CS2 waste air are consistent with the trends predicted by G max E and ψ i . Combining the viscosity data of the six absorbents given in Table 4, it can be found that compared with NMP, TMB, and DMF, BE has good affinity, but its viscosity is large. Similarly, the viscosity of EG is greater than that of BGA. Overall, the greater viscosity leads to greater interfacial mass transfer resistance between the liquid–gas two phases, which in turn leads to a decrease in mass transfer rate and a poorer absorption effect [41]. Therefore, the mass removal efficiency of BE and EG on CS2 waste air has an opposite trend to the predicted effect of G max E and ψ i .
In conclusion, in the low viscosity system, it is feasible to use G max E and ψ i to screen CS2 absorbents, and it can greatly reduce the complicated screening process and expensive screening costs in previous studies. At the same time, it can be seen that NMP is a CS2 waste air absorbent with good compatibility with CS2 waste air, low volatility, and slight toxicity.

3.2. NMP Solution Absorption Process Conditions

The NMP absorption process study using experiments is shown in Figure 4. It can be seen from Figure 4a that when the liquid–gas ratio does not reach 3.75 L·m−3, the CS2 mass removal efficiency increases significantly, and the change tends to be gentle after reaching 3.75 L·m−3. The improvement of the liquid–gas ratio increases the effective contact area between the CS2 gas and the NMP liquid, thereby improving the mass transfer efficiency of the liquid–gas interface. However, when the liquid–gas ratio is increased to a certain level, the effective contact area is already large enough. The effect of further improving the liquid–gas ratio on the mass removal efficiency is not obvious, while the energy consumption continues to increase.
It can be seen from Figure 4b that increasing the temperature will lead to a decrease in the mass removal efficiency, and the decrease in the mass removal efficiency is particularly significant when the temperature exceeds 20 °C. The main reason for this phenomenon is that the increase of temperature will increase the kinetic energy of each molecule in the absorbent, and it will both weaken the interaction between CS2 and NMP molecules and increase the desorption rate, resulting in a decrease in the absorption of CS2 molecules by NMP.
Figure 4c shows the experimental results of the absorption of CS2 waste air with six different intake concentrations. It can be seen from Figure 4c that the mass removal efficiency of NMP to CS2 first increases and then decreases sharply with the increase of the concentration. According to double film theory, the increasing intake air concentration of CS2 will increase the CS2 partial pressure in the gas film and enhance the driving force of the mass transfer process, promoting the CS2 waste air absorption process. However, when the intake air concentration of CS2 is more significant than 10,000 mg·m−3, the dissolution capacity of the absorbent for CS2 is limited by the solubility, i.e., the absorber reaches saturation, resulting in a sharp decline in the mass removal efficiency. Meanwhile, the similar conclusion was reached by Qing et al. [42] when they studied the effect of CO2 inlet concentration on the CO2 removal rate.
Figure 4d shows the results of three groups of absorption experiments carried out under the above process conditions, and the average mass removal efficiency is up to 95.2%. To sum up, the optimal process conditions for NMP to absorb CS2 waste air are the liquid–gas ratio of 3.75 L·m−3, a temperature of 20 °C, and an intake air concentration lower than 10,000 mg·m−3.

3.3. Analysis of Desorption Experiment Results

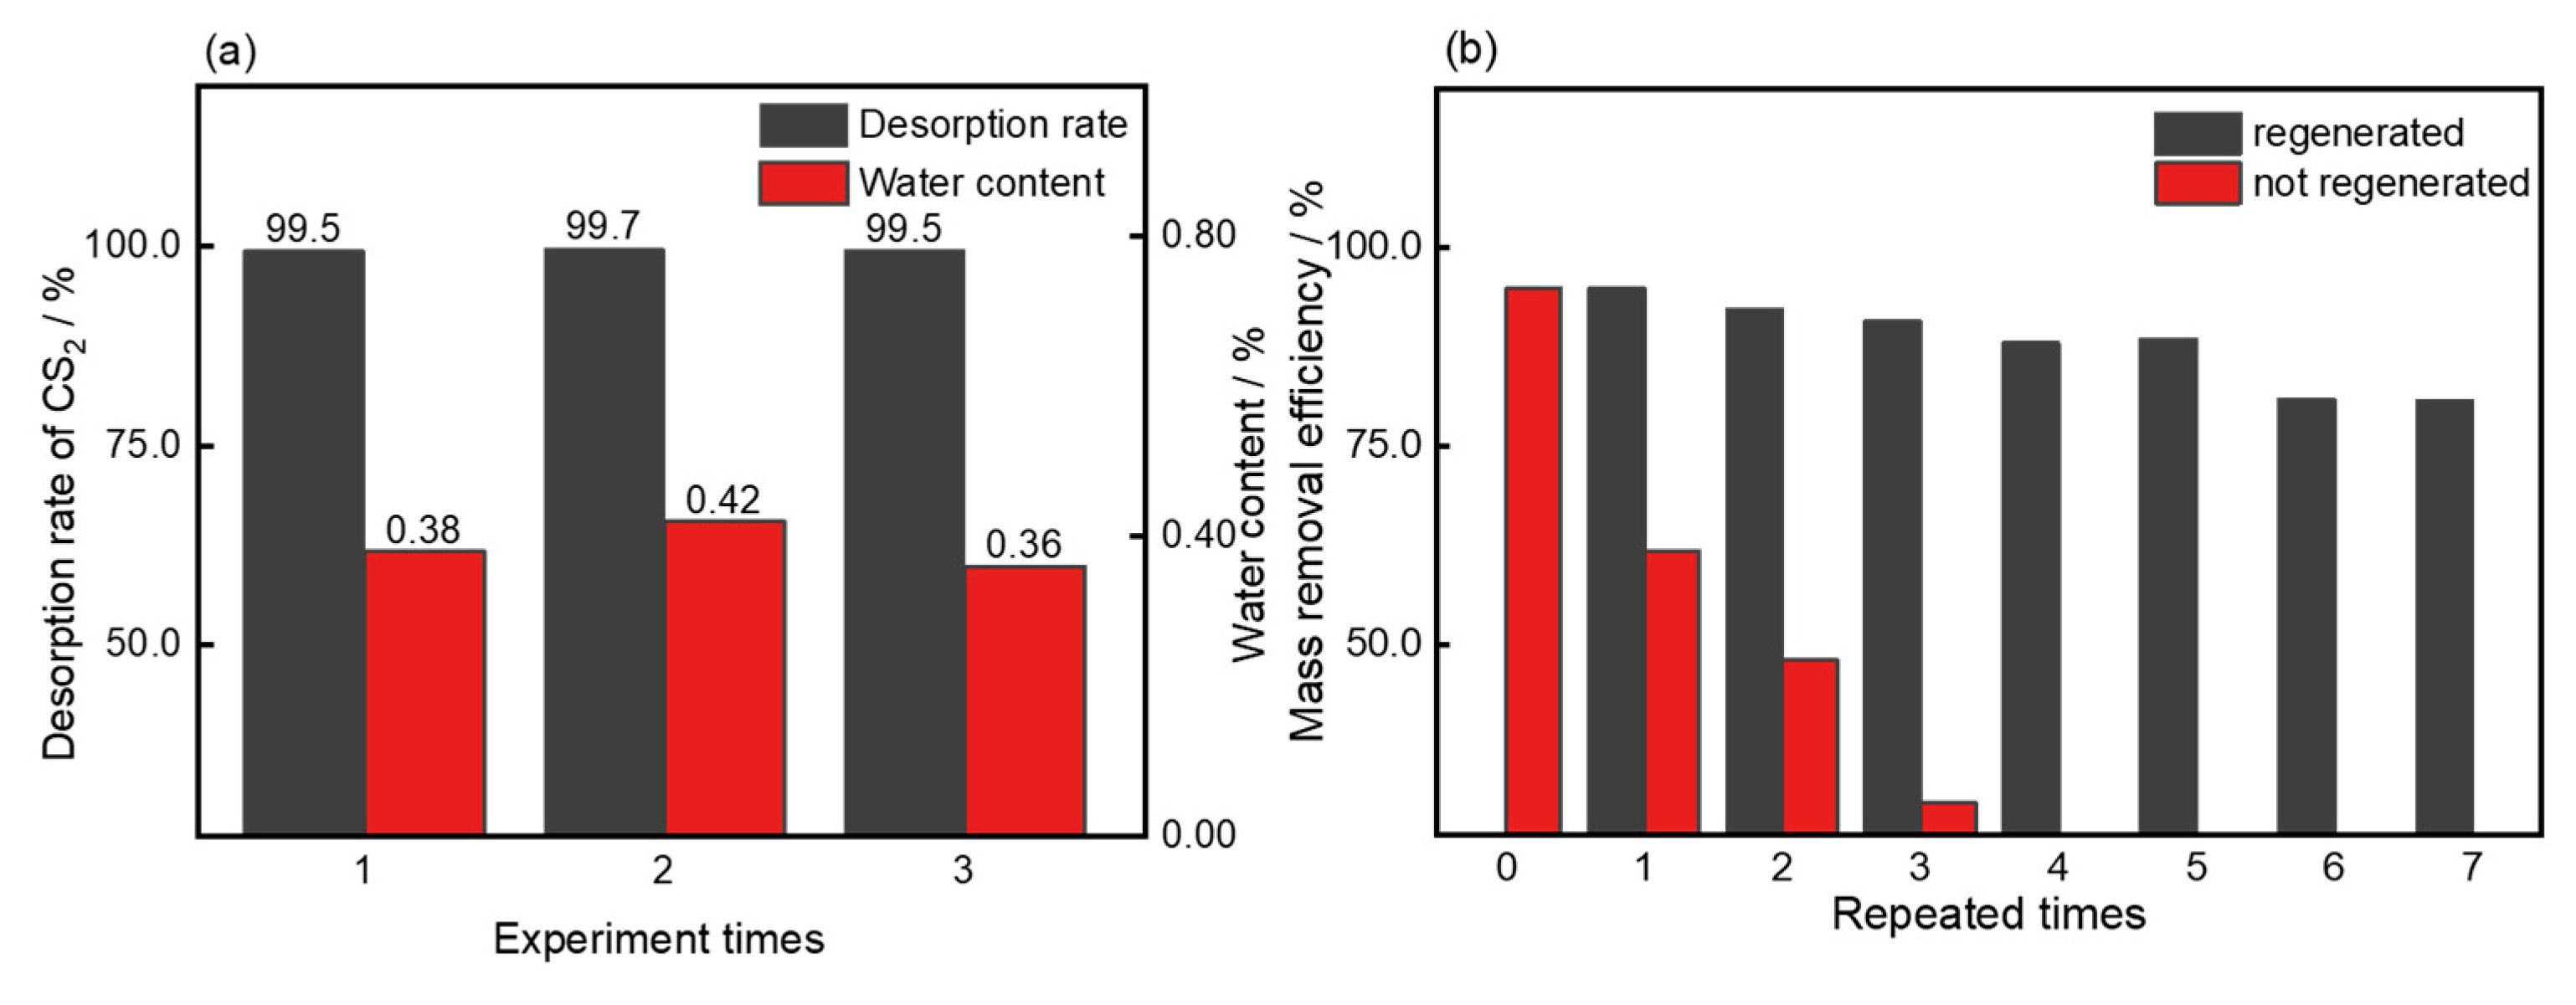
3.3.1. Regeneration of Lean Liquid Resorption Performance

Figure 5a,b show the effects of water content and CS2 content in NMP on the mass removal efficiency, respectively. Figure 5c shows the results of the synergistic effect of water content and CS2 content in NMP on the mass removal efficiency. In Figure 5a,b, the mass removal efficiency decreased sharply with the increase of water content and CS2 content in NMP. When the moisture content exceeds 1.00%, or the CS2 content exceeds 0.5‰, the mass removal efficiency will drop to less than 90.0%.
In Figure 5c, the CS2 content in the fixed NMP was kept constant at 0.5%. The water content was controlled within 0.5%, and the mass removal efficiency can be maintained above 89.0%. Therefore, to ensure that the desorbed absorbent retains excellent absorption, the CS2 content in the regenerated absorbent must be controlled within 0.5% and the water content within 0.50%. Comparing Figure 5b,c, it can be seen that NMP containing CS2 and water at the same time will make the mass removal efficiency drop more obviously, that is, the effect of the two on the mass removal efficiency has a synergistic effect. The effect of water content on CS2 uptake by NMP is similar to the findings of Fu et al. [43] on the effect of water content on CO2 uptake.

3.3.2. Desorption Process Conditions

Figure 5d,e show the effects of temperature and pressure on the desorption effect, respectively. When the constant pressure is 10 kPa, the CS2 desorption rate increases with the increase of temperature. When the temperature reaches 115 °C, the desorption rate is close to 99.0%. At this time, the CS2 desorption is relatively complete. The water is continuously vaporized, and the water content in the rich liquid is continuously reduced. At a constant temperature of 115 °C, the lower the pressure, the better the desorption of the rich liquid, the higher the CS2 desorption rate, and the lower the water content in the rich liquid. When the pressure is 10 kPa, the CS2 desorption rate is 99.1%, and the water content is 0.55%. At this time, the regeneration lean liquid has good absorption performance after desorption. Figure 5f shows the effect of desorption time on the desorption effect. When the desorption time was 45 min, the CS2 desorption rate reached 99.9%, and the water content in the regenerated lean liquid after desorption was 0.38%. At this time, the desorbed absorbent had good absorption performance, and the mass removal efficiency could be maintained above 90%.
Altogether, the optimal desorption process conditions for absorbing rich liquid are: temperature 115 °C, pressure 10 kPa, and desorption time 45 min. Figure 6a shows three groups of desorption experiments carried out under the abovementioned process conditions; the average desorption rate reaches 99.6%, and the average water content after desorption is 0.39%.

3.3.3. NMP Absorbent Cyclic Absorption Performance

Figure 6b shows the experimental results of multiple absorptions of CS2 exhaust gas with the regenerated and unregenerated absorber. As shown in Figure 6b, when the NMP-rich liquid without desorption is subjected to the cyclic absorption experiment, it no longer has the absorption capacity after four absorption operations. However, the mass removal efficiency of the desorbed NMP lean liquid can reach more than 90.0% in the first three times, and the mass removal efficiency of the regenerated lean liquid after seven times of desorption can still be maintained at 80.6%. Due to incomplete regeneration and continuous loss of absorbent during regeneration, the mass removal efficiency of the regeneration lean liquid shows a trend of gradual deterioration. In engineering, the mass removal efficiency of regeneration lean liquid can be restored by intermittently replenishing fresh NMP solvent.

4. Conclusions

In this paper, the theory of the maximum excess Gibbs function and the absorption potential for screening absorbents were successfully introduced to the process of CS2 waste air absorbent screening. Based on the absorption experiments, we concluded that it is feasible in low-viscosity systems. At the same time, NMP with slight toxicity and easy regeneration was selected as a highly efficient absorbent to recycle CS2 (95.2%). Our method of screening absorbents is simpler and more efficient than previous methods of evaluating absorbents and has a broader range of applications [34,35,36]. Moreover, the optimal process conditions for NMP to absorb CS2 waste air are: liquid–gas ratio 3.75 L·m−3, temperature 20 °C, and intake air concentration lower than 10,000 mg·m−3. The regenerated lean liquid has excellent resorption performance and can be recycled.
In summary, we simplify the screening steps of CS2 waste air absorbent in a low-viscosity system, contributing to efficiently screening absorbents with low operating cost. Meanwhile, we believe that further design of low-cost composite absorbers should also prioritize NMP as the primary component. This paper has significant application value for recycling CS2 waste air in viscose fiber plants and reducing CS2 pollution and carbon emissions from the source.

Author Contributions

Conceptualization, M.C., X.Z. and B.F.; methodology, J.L.; software, K.C. and R.X.; validation, J.L., K.C. and M.C.; investigation, R.X.; data curation, K.C.; writing—original draft preparation, R.X.; writing—review and editing, R.X.; funding acquisition, M.C., X.Z. and B.F. All authors have read and agreed to the published version of the manuscript.

Funding

The project is supported financially by the National Natural Science Foundation of China (No. 21606133), and the Jiangsu Province Industry University Research Prospective Joint Research Project (BY2016006-02).

Institutional Review Board Statement

Not applicable.

Informed Consent Statement

Not applicable.

Data Availability Statement

The data will be available upon reasonable request.

Conflicts of Interest

The authors declare no competing financial interest.

References

  1. Aldalbahi, A.; El-Naggar, M.E.; El-Newehy, M.H.; Rahaman, M.; Hatshan, M.R.; Khattab, T.A. Effects of Technical Textiles and Synthetic Nanofibers on Environmental Pollution. Polymers 2021, 13, 155. [Google Scholar] [CrossRef] [PubMed]
  2. Smet, E.; Lens, P.; Langenhove, H.V. Treatment of Waste Gases Contaminated with Odorous Sulfur Compounds. Crit. Rev. Environ. Sci. Technol. 2010, 28, 89–117. [Google Scholar] [CrossRef]
  3. Anwar, K.; Benjamin, R.; Simon, G.; Carl, P.; Dudley, S. Global analysis of carbon disulfide (CS2) using the 3-D chemistry transport model STOCHEM. AIMS Environ. Sci. 2017, 4, 484–501. [Google Scholar] [CrossRef] [Green Version]
  4. Chin, M.; Davis, D. Global sources and sinks of OCS and CS2 and their distributions. Global Biogeochem. Cycles 1993, 7, 321–337. [Google Scholar] [CrossRef]
  5. Lee, C.-L.; Brimblecombe, P. Anthropogenic contributions to global carbonyl sulfide, carbon disulfide and organosulfides fluxes. Earth-Sci. Rev. 2016, 160, 1–18. [Google Scholar] [CrossRef] [Green Version]
  6. Zeng, Z.; Altarawneh, M.; Dlugogorski, B.Z. Atmospheric oxidation of carbon disulfide (CS2). Chem. Phys. Lett. 2017, 669, 43–48. [Google Scholar] [CrossRef]
  7. Zhu, C.; Lu, J.; Wang, X.; Huang, Q.; Huang, L.; Wang, J. Removal of Carbon Disulfide from Gas Streams Using Dielectric Barrier Discharge Plasma Coupled with MnO2 Catalysis System. Plasma Chem. Plasma Process. 2013, 33, 569–579. [Google Scholar] [CrossRef]
  8. Wu, Y.; Wang, Z. Research progress in reproductive toxicity of carbon disulfide among exposed workers. Chin. J. Public Health 2016, 32, 1133–1136. [Google Scholar]
  9. Chalansonnet, M.; Carreres-Pons, M.; Venet, T.; Thomas, A.; Merlen, L.; Boucard, S.; Cosnier, F.; Nunge, H.; Bonfanti, E.; Llorens, J.; et al. Effects of co-exposure to CS2 and noise on hearing and balance in rats: Continuous versus intermittent CS2 exposures. J. Occup. Med. Toxicol. 2020, 15, 9. [Google Scholar] [CrossRef]
  10. Venet, T.; Carreres-Pons, M.; Chalansonnet, M.; Thomas, A.; Merlen, L.; Nunge, H.; Bonfanti, E.; Cosnier, F.; Llorens, J.; Campo, P. Continuous exposure to low-frequency noise and carbon disulfide: Combined effects on hearing. Neurotoxicology 2017, 62, 151–161. [Google Scholar] [CrossRef]
  11. Schramm, A.; Uter, W.; Brandt, M.; Goen, T.; Kohrmann, M.; Baumeister, T.; Drexler, H. Increased intima-media thickness in rayon workers after long-term exposure to carbon disulfide. Int. Arch. Occup. Environ. Health 2016, 89, 513–519. [Google Scholar] [CrossRef]
  12. Li, K.; Ning, P.; Li, K.; Wang, C.; Sun, X.; Tang, L.; Liu, S. Low Temperature Catalytic Hydrolysis of Carbon Disulfide on Activated Carbon Fibers Modified by Non-thermal Plasma. Plasma Chem. Plasma Process. 2017, 37, 1175–1191. [Google Scholar] [CrossRef]
  13. Song, X.; Chen, X.; Sun, L.; Li, K.; Sun, X.; Wang, C.; Ning, P. Synergistic effect of Fe2O3 and CuO on simultaneous catalytic hydrolysis of COS and CS2: Experimental and theoretical studies. Chem. Eng. J. 2020, 399, 125764. [Google Scholar] [CrossRef]
  14. Song, X.; Ning, P.; Wang, C.; Li, K.; Tang, L.; Sun, X.; Ruan, H. Research on the low temperature catalytic hydrolysis of COS and CS2 over walnut shell biochar modified by Fe–Cu mixed metal oxides and basic functional groups. Chem. Eng. J. 2017, 314, 418–433. [Google Scholar] [CrossRef]
  15. Li, Q.; Yi, H.; Tang, X.; Zhao, S.; Zhao, B.; Liu, D.; Gao, F. Preparation and characterization of Cu/Ni/Fe hydrotalcite-derived compounds as catalysts for the hydrolysis of carbon disulfide. Chem. Eng. J. 2016, 284, 103–111. [Google Scholar] [CrossRef]
  16. Glarborg, P.; Halaburt, B.; Marshall, P.; Guillory, A.; Troe, J.; Thellefsen, M.; Christensen, K. Oxidation of reduced sulfur species: Carbon disulfide. J Phys Chem A 2014, 118, 6798–6809. [Google Scholar] [CrossRef] [Green Version]
  17. Chen, J.; Chen, A.; Qiu, P.; Huang, L.; Zhou, Q. Removal of carbon disulfide from air stream by absorption combined with electrochemical oxidation. J. Environ. Chem. Eng. 2019, 7, 103167. [Google Scholar] [CrossRef]
  18. Xia, G.; Zhou, X.; Hu, J.; Sun, Z.; Yao, J.; Chen, D.; Wang, J. Simultaneous removal of carbon disulfide and hydrogen sulfide from viscose fibre waste gas with a biotrickling filter in pilot scale. J. Clean. Prod. 2019, 230, 21–28. [Google Scholar] [CrossRef]
  19. Prenafeta-Boldu, F.X.; Rojo, N.; Gallastegui, G.; Guivernau, M.; Vinas, M.; Elias, A. Role of Thiobacillus thioparus in the biodegradation of carbon disulfide in a biofilter packed with a recycled organic pelletized material. Biodegradation 2014, 25, 557–568. [Google Scholar] [CrossRef]
  20. Rojo, N.; Gallastegi, G.; Barona, A.; Gurtubay, L.; Ibarra-Berastegi, G.; Elías, A. Biotechnology as an alternative for carbon disulfide treatment in air pollution control. Environ. Rev. 2010, 18, 321–332. [Google Scholar] [CrossRef]
  21. Samanta, A.; Zhao, A.; Shimizu, G.K.H.; Sarkar, P.; Gupta, R. Post-Combustion CO2 Capture Using Solid Sorbents: A Review. Ind. Eng. Chem. Res. 2012, 51, 1438–1463. [Google Scholar] [CrossRef]
  22. Gunawardene, O.H.P.; Gunathilake, C.A.; Vikrant, K.; Amaraweera, S.M. Carbon Dioxide Capture through Physical and Chemical Adsorption Using Porous Carbon Materials: A Review. Atmosphere 2022, 13, 397. [Google Scholar] [CrossRef]
  23. Zhang, X.-F.; Wang, Z.; Ding, M.; Feng, Y.; Yao, J. Advances in cellulose-metal organic framework composites: Preparation and applications. J. Mater. Chem. A 2021, 9, 23353–23363. [Google Scholar] [CrossRef]
  24. Gunathilake, C.A.; Ranathunge, G.G.T.A.; Dassanayake, R.S.; Illesinghe, S.D.; Manchanda, A.S.; Kalpage, C.S.; Rajapakse, R.M.G.; Karunaratne, D.G.G.P. Emerging investigator series: Synthesis of magnesium oxide nanoparticles fabricated on a graphene oxide nanocomposite for CO2 sequestration at elevated temperatures. Environ. Sci. Nano 2020, 7, 1225–1239. [Google Scholar] [CrossRef]
  25. Gunathilake, C.A.; Dassanayake, R.S.; Fernando, C.A.N.; Jaroniec, M. Zirconium Containing Periodic Mesoporous Organosilica: The Effect of Zr on CO2 Sorption at Ambient Conditions. J. Compos. Sci. 2022, 6, 168. [Google Scholar] [CrossRef]
  26. McGuirk, C.M.; Siegelman, R.L.; Drisdell, W.S.; Runcevski, T.; Milner, P.J.; Oktawiec, J.; Wan, L.F.; Su, G.M.; Jiang, H.Z.H.; Reed, D.A.; et al. Cooperative adsorption of carbon disulfide in diamine-appended metal-organic frameworks. Nat. Commun. 2018, 9, 5133. [Google Scholar] [CrossRef] [Green Version]
  27. Jin, J.; Zhang, Z.; Bai, H. Preparation and performance of γ-Fe2O3/AC desulfurizer at low temperature for CS2 removal. Chem. Ind. Eng. Prog. 2018, 37, 4397–4404. [Google Scholar] [CrossRef]
  28. Nagarajan, V.; Chandiramouli, R. CS2 And H2S adsorption studies on novel hex-star phosphorene nanosheet—A DFT perspective. Mol. Phys. 2022, 120, 2066027. [Google Scholar] [CrossRef]
  29. Heldebrant, D.J.; Yonker, C.R.; Jessop, P.G.; Phan, L. Reversible uptake of COS, CS2, and SO2: Ionic liquids with O-alkylxanthate, O-alkylthiocarbonyl, and O-alkylsulfite anions. Chemistry 2009, 15, 7619–7627. [Google Scholar] [CrossRef]
  30. Huo, Z.; Shen, B.; Chen, X.; Sun, H.; Zhan, G.; Yu, H. Compositional design of UDS and its application on removal of CS2 from viscose fiber waste gas. Chem. Ind. Eng. Prog. 2018, 37, 292–300. [Google Scholar] [CrossRef]
  31. Bai, Y.; Yu, M.; Zhang, X.-F.; Yao, J. Deep eutectic solvent assisted preparation of ZnO deposited carbonized wood for efficient CO2 storage and oil absorption. J. Mol. Liq. 2023, 376, 121409. [Google Scholar] [CrossRef]
  32. Zhu, X.; Fan, Z.; Zhang, X.-F.; Yao, J. Metal-organic frameworks decorated wood aerogels for efficient particulate matter removal. J. Colloid Interface Sci. 2023, 629, 182–188. [Google Scholar] [CrossRef]
  33. Wang, D.; Xie, J.; Zhou, H.; Liu, L.; Li, H.; Li, G.; Fan, X. Multiscale energy reduction of amine-based absorbent SO2 capture technology: Absorbent screening and process improvement. Sep. Purif. Technol. 2022, 301, 121949. [Google Scholar] [CrossRef]
  34. Lhuissier, M.; Couvert, A.; Kane, A.; Amrane, A.; Audic, J.-L.; Biard, P.-F. Volatile organic compounds absorption in a structured packing fed with waste oils: Experimental and modeling assessments. Chem. Eng. Sci. 2021, 238, 116598. [Google Scholar] [CrossRef]
  35. Rodriguez Castillo, A.-S.; Biard, P.-F.; Guihéneuf, S.; Paquin, L.; Amrane, A.; Couvert, A. Assessment of VOC absorption in hydrophobic ionic liquids: Measurement of partition and diffusion coefficients and simulation of a packed column. Chem. Eng. J. 2019, 360, 1416–1426. [Google Scholar] [CrossRef]
  36. Wang, B.; Zhang, X.; Shang, D.; Fen, J.; Wu, H.; Zhang, Y.; Li, J. Efficient Recovery of Dichloromethane by [Bmim][PF6] and Process Simulation. Chin. J. Process Eng. 2018, 18, 82–87. [Google Scholar] [CrossRef]
  37. Wang, C.; Zhang, Y.; Han, J.; Zhang, M. Analysis of influencing factors for determination of carbon disulfide in ambient air by diethylamine spectrophotometry. Instrum. Anal. Monit. 2009, 97, 44–46. [Google Scholar] [CrossRef]
  38. Wang, Y.-n.; Xu, R.; Kai, Y.; Wang, H.; Sun, Y.; Zhan, M.; Gong, B. Evaluating the physicochemical properties of refuse with a short-term landfill age and odorous pollutants emission during landfill mining: A case study. Waste Manag. 2021, 121, 77–86. [Google Scholar] [CrossRef] [PubMed]
  39. Ma, H.; Wang, Z.; Zhang, X.-F.; Ding, M.; Yao, J. In situ growth of amino-functionalized ZIF-8 on bacterial cellulose foams for enhanced CO2 adsorption. Carbohydr. Polym. 2021, 270, 118376. [Google Scholar] [CrossRef] [PubMed]
  40. Gunathilake, C.; Dassanayake, R.S.; Kalpage, C.S.; Jaroniec, M. Development of Alumina–Mesoporous Organosilica Hybrid Materials for Carbon Dioxide Adsorption at 25 C. Materials 2018, 11, 2301. [Google Scholar] [CrossRef] [Green Version]
  41. Song, D.; Seibert, A.F.; Rochelle, G.T. Mass Transfer Parameters for Packings: Effect of Viscosity. Ind. Eng. Chem. Res. 2018, 57, 718–729. [Google Scholar] [CrossRef]
  42. Qing, Z.; Yincheng, G.; Zhenqi, N. Experimental studies on removal capacity of carbon dioxide by a packed reactor and a spray column using aqueous ammonia. Energy Procedia 2011, 4, 519–524. [Google Scholar] [CrossRef] [Green Version]
  43. Fu, K.; Zheng, M.; Wang, H.; Fu, D. Effect of water content on the characteristics of CO2 capture processes in absorbents of 2-ethylhexan-1-amine + diglyme. Energy 2022, 244, 122656. [Google Scholar] [CrossRef]
Figure 1. CS2 standard curve.
Atmosphere 14 00602 g001
Figure 2. Absorption experiment setup: 1, 2, 12—rotameter; 3, 4, 10, 13—valve; 5, 9, 16, 17—stop valve; 6—CS2 storage tank; 7—peristaltic pump; 8—mixing tank; 11, 15, 18—sampling test point; 14—absorption tower.
Atmosphere 14 00602 g002
Figure 3. Average mass removal efficiency of CS2 waste air by six different absorbents.
Atmosphere 14 00602 g003
Figure 4. Absorption process research: (a) The effect of liquid-gas ratio on absorption, (b) The effect of temperature on absorption, (c) The effect of inlet concentration on absorption, (d) Repeated absorption experiments.
Atmosphere 14 00602 g004
Figure 5. Desorption process research: (a) The effect of water content on absorption (CS2-free), (b) The effect of CS2 content on absorption (water-free), (c) The effect of water and CS2 content on absorption (0.5‰ CS2), (d) The effect of temperature on desorption, (e) The effect of pressure on desorption, (f) The effect of time on desorption.
Atmosphere 14 00602 g005
Figure 6. Absorbent regeneration experiment: (a) Repeated desorption experiments, (b) Regenerated lean liquid circulation absorption experiment.
Atmosphere 14 00602 g006
Table 1. Reagent specifications.
Experiment ReagentPurity
N-Methyl-2-pyrrolidone (NMP)99.7%
Ethylene glycol butyl ether acetate (BGA)99.7%
Ethylene glycol (EG)99.7%
N,N-Dimethylformamide (DMF)99.7%
Ethylene glycol monobutyl ether (2-Butoxyethanol, BE)99.7%
1,2,4-Trimethylbenzene (TMB)99.5%
Ethanol absolute99.7%
Triethanolamine (TEA)99.7%
Diethylamine (DEA)99.7%
Copper acetate99.7%
Karl Fischer reagent99.7%
CS299.5%
Note: The manufacturing company is Sinopharm Chemical Reagent Co., Ltd. (Shanghai, China).
Table 2. CS2 content corresponding to different standard solutions.
No.012345678910
Absorbent
(mL)
10.09.99.89.79.69.59.49.39.29.19.0
Standard solution
(mL)
00.10.20.30.40.50.60.70.80.91.0
CS2 content
(μg)
03.927.8411.7615.6819.6023.5227.4431.3635.2839.20
Table 3. CS2-solvent system maximum excess Gibbs function and absorption potential (20 °C, atmospheric pressure).
No.SolventMolecular Formula γ i ψ i G max E /J·mol−1
1WaterH2O3979.4582.513 × 10−43157.89
2EGC2H6O21.0920.91659.37
31-PentanolC5H12O2.4700.405764.03
41-OctanolC8H18O1.5300.654428.75
5Tripropylene glycolC6H14O41.8760.533788.37
6Hexylene glycolC6H14O23.2760.3051175.25
7Dibutyl etherC8H18O1.0210.98028.21
8BEC6H14O20.5111.959−518.43
9Diethylene glycol butyl etherC8H18O30.5481.824−514.26
10Triethylene glycol monobutyl etherC10H22O41.2050.830301.70
11Triethylene glycol dimethyl etherC8H18O41.2590.794283.23
12Ethylene glycol monomethyl etherC3H8O20.7691.300−180.79
13Ethylene glycol propyl etherC5H12O20.5681.762−423.45
14Ethylene glycol monoethyl etherC4H10O20.6481.544−312.85
15Propylene glycol monoethyl etherC5H12O22.4200.413784.49
16Hexyl acetateC8H16O21.3410.746305.36
17Propylene carbonateC4H6O34.4670.2241110.05
18Ethylene glycol diacetateC6H10O43.0170.3311071.45
19BGAC8H16O31.4030.713370.59
20Ethylene glycol monoethyl ether acetateC6H12O31.9040.525602.54
21Ethyl acetoacetateC6H10O32.9520.339995.69
22Methyl salicylateC8H8O33.3860.2951167.32
23DMFC3H7NO0.9711.030−18.01
24MDEAC5H13NO23.8210.262852.26
25DiisopropanolamineC6H15NO22.2720.440945.29
26DiethanolamineC4H11NO21.9020.526645.66
27TEAC6H15NO34.2630.2351636.44
28NMPC5H9NO0.8381.194−132.00
29MorpholineC4H9NO0.8901.123−83.30
30TMBC9H120.8921.121−64.61
Table 4. Physical properties of absorbent.
AbsorbentViscosity/mPa·sSaturated Vapor Pressure/PaORL-RAT LD50/mg·kg−1
NMP2.0831.53915
BE3.3577.51480
TMB0.96206.55000
DMF0.87394.32800
BGA1.8080.92400
EG21.057.34700
Remark: The temperature is 20 °C; the pressure is atmospheric pressure; the LD50 test method is oral administration by rodents.
Disclaimer/Publisher’s Note: The statements, opinions and data contained in all publications are solely those of the individual author(s) and contributor(s) and not of MDPI and/or the editor(s). MDPI and/or the editor(s) disclaim responsibility for any injury to people or property resulting from any ideas, methods, instructions or products referred to in the content.

