Article

Interdecadal Variation in Rossby Wave Source over the Tibetan Plateau and Its Impact on the East Asia Circulation Pattern during Boreal Summer

1
China Meteorological Administration Key Laboratory for Climate Prediction Studies, National Climate Center, Beijing 100081, China
2
Collaborative Innovation Center on Forecast and Evaluation of Meteorological Disasters, Nanjing University of Information Science and Technology, Nanjing 210044, China
*
Author to whom correspondence should be addressed.
Atmosphere 2023, 14(3), 541; https://doi.org/10.3390/atmos14030541
Submission received: 8 February 2023 / Revised: 7 March 2023 / Accepted: 8 March 2023 / Published: 11 March 2023

Abstract

:
The wave activity flux representing the energy propagation direction of planetary Rossby wave generally originates from a large wave source area. This study investigates the interdecadal variability and formation mechanism of Rossby wave source over the Tibetan Plateau (TP-RWS) and its impact on the atmospheric circulation and precipitation pattern in East Asia based on the ERA-20C reanalysis dataset in summer (June–July–August) during 1900 to 2010. Results show that the region with the maximum variabilities of Rossby wave source (RWS) in the past 110 years appears over the Tibetan Plateau (TP) during boreal summer, and the TP-RWS shows prominent characteristics of interdecadal oscillation. Secondly, the TP-RWS is mainly composed of the vortex stretching term (RWS-S1) and the absolute vorticity advection term (RWS-S2). The interdecadal TP-RWS is a synergistic result of the snow cover over northwestern TP associated with the RWS-S1, and the deep convection over southeastern TP associated with the RWS-S2. Furthermore, the interdecadal TP-RWS can lead to an alternatively positive and negative pattern of geopotential height anomalies from the northwestern TP to the North Pacific, which has a great climate effect on the precipitation in Huang-huai River Basin, South Korea and Japan Island. Under the guidance of the anomalous cyclonic circulation in East Asia, the prevailing southerly and easterly winds occur over the West Pacific and the Huang-huai River Basin, which lead to the water vapor convergence and upward movement at middle and lower troposphere.

1. Introduction

The Rossby wave (RW) propagation caused by external forcing is one of the mechanisms leading to the configuration of wave trains called teleconnection. In the northern hemisphere (NH), a favorable area with RW-forming dynamic conditions is located in East Asia [1,2]. The Rossby wave pattern at the upper troposphere generally manifests as Rossby wave train of atmospheric response to one or more local wave sources [3,4,5]. In the NH midlatitudes, the source of RW may be related to topography, marine–terrestrial contrast, or transient baroclinic systems [6]. Ye and Zhu [7] believe that both topographic and diabatic heating play an important role in the climatological atmospheric teleconnections along the westerly jet stream, especially the large troughs over East Asia and the east coast of North America. Previous studies of Rossby wave source (RWS) have shown that most of the strong RWS are located in the subtropical zone on the seasonal timescales, although most of the upper divergent flow regions are located near the equator. Because the divergent flow is greater at the edge of the greatest divergence zone and the absolute vorticity gradient is larger at higher latitudes [2,8,9], these all provide conditions for RWS formation in the subtropics. Therefore, RWS may be associated with both local forcing and absolute vorticity advection caused by atmospheric diabatic heating. Plumb [10] shows that the main forcing of the quasi-stationary wave originates from the topographic influence over the Tibetan Plateau (TP), as well as interaction of the diabatic heating with transient flows over the Pacific, Northwest Atlantic, and Siberia by diagnosing the wave activity flux in the NH winter.
Ye [11] first applied the RW energy dispersion theory to the study of the atmospheric circulation change mechanism. Previous studies have shown that the energy propagation process of Rossby waves along the westerly jet in the NH summer is an important dynamic mechanism for the development of high-latitude trough in East Asia, and its downstream effect is also an important driver of flood disasters in China [12,13,14,15]. On the interdecadal timescale, there is a Rossby wave train in the midlatitudes. The eastward propagation of wave energy has a significant impact on the precipitation pattern in the middle and lower reaches of the Yangtze River basin [16,17]. The Tibetan Plateau, as the steepest and most complex terrain on the Earth and the region with the strongest land–atmosphere interaction in the NH midlatitudes, has a great influence on regional and global climate [18,19,20]. Moreover, its local thermal forcing can directly affect the downstream atmospheric circulation and rainfall pattern [21,22,23]. Previous studies have shown that the surface turbulent heat flux in the southeastern TP plays an important role in regulating Meiyu and rainstorm in the Yangtze River Basin [24,25,26,27]. There is also a close relationship between the variation of snow cover in different regions of the TP and the atmospheric circulation [28,29,30,31]. In addition, the anomalous diabatic heating over the TP can trigger Rossby waves propagating westward and eastward along the extratropical westerly jet to change the large-scale climate on the interannual scale [32,33,34].
The above studies on the impact of RWS mainly focus on the seasonal and interannual timescales and discuss the RW role on persistent circulation anomaly and corresponding precipitation pattern in East Asia. However, where is the key area of RW energy dispersion in the NH summer on interdecadal scale? What is the physical mechanism of the Rossby wave train excited from the TP on the precipitation anomaly in East Asia? All these are worthy of further discussion. Thus, we analyze the interdecadal variability and spatial distribution of the TP-RWS in summer during 1900 to 2010. In addition, the causes of the TP-RWS and its effects on the anomalous circulation in East Asia are discussed so as to understand the physical mechanism of precipitation anomalies associated with TP-RWS. Section 2 of the manuscript introduces the data and methods used. Section 3 analyzes the interdecadal variability of the TP-RWS and its impact on the East Asia Circulation Pattern. Conclusions and discussion are shown in Section 4 and Section 5, respectively.

2. Data and Methods

The atmospheric data used in this paper are from the ERA-20th Century (ERA-20C) monthly reanalysis dataset provided by the European Center for Medium Range Weather Forecasting (ECMWF) for 1900 to 2010 [35]. In order to compare the calculation results, we also use monthly atmospheric variables of the 20th Century Reanalysis (NCEP-20C) from the National Center for Environmental Prediction/National Center for Atmospheric Research (NCEP/NCAR) for 1836 to 2015 [36]. The horizontal resolution of the two datasets is 1° × 1°, and the rectilinear grid numbers are 181 × 360. The data include wind field (V), temperature (T), geopotential height (H), vertical velocity (ω), and specific humidity (q) of 27 layers from 1000 hPa to 100 hPa. In addition, the surface sensible heat flux (SHTFL), total cloud cover (TCC), snow albedo (ASN), and surface pressure are used. The centennial precipitation data used in our study are based on the global terrestrial meteorological grid dataset established by the University of East Anglia (CRU_ts4) from 1901 to 2010, with a horizontal resolution of 0.5° × 0.5°. The monthly land precipitation data provided by the Global Precipitation Climatology Centre (GPCC) for 1900–2010 are also used, with a horizontal resolution of 0.25° × 0.25°. The 2500 m terrain height is selected as the criteria for calculating the regional average over the TP. In this study, interdecadal variation denotes the time series of TP-RWS and other physical quantities remove the linear trend during 1900 to 2010 in summer, and then perform 10-year low-pass filtering.
According to the derivation of Sardeshmukh and Hoskins [4,8] based on the nonlinear vorticity equation, the Rossby wave source (RWS) on a horizontal level can be calculated as:
R W S = · ( f + ζ ) V χ = ( f + ζ ) D V χ · ( f + ζ )
where the RWS represents Rossby wave source. The f and ζ are planetary vorticity and relative vorticity, respectively, and absolute vorticity is the sum of the two. D represents the horizontal divergence u x + v y and V χ is the divergent component of the horizontal wind. The divergent wind component is calculated by inverting the Laplacian operator in spherical harmonic space after computing the divergence. The Formula (1) shows that time-averaged vorticity can be considered as a combination of the vortex stretching term (RWS-S1) produced by local strong divergence and the absolute vorticity advection term (RWS-S2) caused by large-scale divergent flow [2]. When an anomalous vorticity diverges outward, the local vorticity decreases, and this vorticity divergence center is called the vortex source region. The converse is the vortex sink area. Therefore, analyzing the RWS distribution and its variability can help to understand the origin and physical mechanism of planetary wave generation and atmospheric changes [37].
The method of calculating Q1 in this study is based on the inverted algorithm of Yanai et al. [38]:
Q 1 = C P [ T t + V · T + ( P P 0 ) k ω θ P ]
where T is temperature, V is horizontal wind vector, ω is vertical velocity, and θ is the potential temperature. k = R/Cp, where R and CP are dry atmospheric constant and isobaric specific heat capacity, respectively. All these variables are in p co-ordinates; thus, Q1 at each isobaric layer can be calculated.
In addition, the three-dimensional T-N wave flux derived by Takaya and Nakamura [39,40] based on the Plumb wave flux [10] is used in our study to describe the Rossby wave energy propagation. These elements are able to better describe the Rossby wave disturbance along the westerly jet in zonal inhomogeneous flow [41]. The formula is expressed as follows:
W = p cos φ 2 | U | { U a 2 cos 2 φ [ ( ψ λ ) 2 ψ 2 ψ λ 2 ] + V a 2 cos φ [ ψ λ ψ φ ψ 2 ψ λ φ ] U a 2 cos φ [ ψ λ ψ φ ψ 2 ψ λ φ ] + V a 2 [ ( ψ φ ) 2 ψ 2 ψ φ 2 ] f 0 2 N 2 { U a cos φ [ ψ λ ψ z ψ 2 ψ λ z ] + V a [ ψ φ ψ z ψ 2 ψ φ z ] }
where the φ , λ , Φ , and a represent the latitude, longitude, geopotential, and radius of the Earth, respectively.   z is the vertical co-ordinates of the log p . ψ = Φ f is the disturbance of quasi-geostrophic stream function relative to the climatology. The basic flow U represents the climate average.

3. Results

3.1. Interdecadal Variation in Rossby Wave Source over the Tibetan Plateau

In the June–July–August (JJA) period, a Rossby wave source clearly appears along the upper tropospheric westerly jet over East Asia and the extratropical Pacific, which is much stronger than that in the tropics (Figure 1a). In the North Hemisphere (NH), the Asian Monsoon–Tibet Plateau region exhibits a strong negative RWS and the North Africa and Mediterranean Sea are positive RWS regions. In addition, the eastern subtropical Pacific and the Atlantic Ocean showed weak RWSs. The RWSs in the Southern Hemisphere are mainly located over the South Indian Convergence Zone, South Pacific, and South Atlantic. These are consistent with previous studies [2,9,42]. For the JJA mean, the intertropical convergence zone moves towards the Northern Hemisphere, and its associated heavy rainfall (Figure 1b) extends northeast from East Asia and the Northwest Pacific. Meanwhile, there is a strong divergent flow and velocity potential center over the Asian monsoon region, which corresponds to its strong convection. The divergence flow radiates outward from East Asia and extends into Eurasia and the Pacific. The concurrence of large-scale divergence at 200 hPa and deep convection indicates that the velocity potential center at the upper troposphere in the NH is largely caused by diabatic heating over the Asian monsoon region [43], while North Africa occurs as a net radiation sink in summer, resulting in continuous cooling as a powerful cold source [44]. This distribution of heat and cold sources forms a divergent/convergent field center over the Asian monsoon region and the Mediterranean Sea. According to Formula (1), negative RWS sources over the Asian summer monsoon region in Figure 1a are formed. Previous studies have shown that these large-scale heating forcings and their RWSs play important roles in forming and maintaining atmospheric circulation over East Asia and the North Pacific [45,46].
How the RWSs have changed during boreal summer over the past 110 years and what physical processes they are associated with are the main concerns in this study. The NH summer RWS variability has exhibited prominent differences, as exemplified by the RWS variance patterns on interannual and interdecadal timescales in Figure 2. Notably, the maximum variability of RWSs on both timescales occurs over the northwestern TP, and the fluctuations are also large over the northeast of China and near the Mediterranean Sea. The interdecadal spatial distributions of NH RWS variabilities are very consistent with those on the interannual timescale. Furthermore, the TP-RWS variance on interdecadal timescale accounts for 22.3% of that in raw from 1900 to 2010. All these indicate that the northwestern TP, including most parts of the Eurasian continent, is the anomalous RWS fluctuation region. As the largest plateau and strongest heat source in boreal summer, the changes in TP thermal conditions may lead to the interdecadal RWS anomalies over this region.
Figure 3 shows the JJA interannual and interdecadal RWS time-series over the TP (topographic height above 2500 m) of 200 hPa from 1900 to 2010. It can be seen that the TP-RWS in the upper troposphere is characterized by multidecadal variations. From the perspective of intensity changes, the TP-RWS showed continuous strong periods during the early 20th century, the 1920s to 1940s, the 1950s to 1970s, and after 2000. Accordingly, the temporal series turned into weak periods during the 1910s to 1920s, 1940s to 1950s, and from the 1970s to the end of the 20th century. Moreover, the TP-RWS variation shows multidecadal differences in the recent 110 years. In the first half of the 20th century, it oscillated in longer periods and, after the late 1950s, decadal variations were more evident. These may be affected by the joint influence of various internal forcing oscillations, as well as the increasing instability of the climate system since global warming [47,48]. The NCEP-20C datasets from 1900 to 2015 are also used to calculate TP-RWS time evolution in order to reduce the uncertainty of calculation results from different datasets. The temporal correlation of TP-RWS between ERA-20C and NCEP-20C datasets reaches 0.72 on the interannual scale, which is 0.69 on the interdecadal scale, and they both pass the 99% confidence test. Therefore, the selected ERA-20C data in this paper can accurately reflect the variations in TP-RWS. Furthermore, in order to explore the spatial distribution characteristics with the TP-RWS interdecadal evolution in the past 110 years, we calculate one-point correlation between the TP-RWS anomalies and large-scale divergent flow in the NH summer (Figure 4). When the interdecadal intensity of TP-RWS increases, the corresponding maximum RWS area appears over the northwestern TP, which is accompanied by a strong divergence center at the upper troposphere. Meanwhile, the RWS in the south of the TP, especially in the northwestern Indo–China Peninsula, shows a weakly negative correlation with the RWS in the whole plateau. The above results show that, as a key area of the interdecadal RWS fluctuations in boreal summer, the causes of the TP-RWS and its influences are worth studying.

3.2. The Mechanisms Contributing to Interdecadal Variations in the TP-RWS

Since the large-scale divergent flow is directly related to anomalous diabatic heating of the atmosphere, we calculate the correlation map of the atmospheric heat source (Q1) with the TP-RWS in order to explore the possible causes of the TP-RWS interdecadal variations (Figure 5). It is worth noting that two Q1 key areas occur over the plateau, which are located in the northwestern TP (Pamirs plateau) and southeastern TP. When the interdecadal TP-RWS intensifies, the atmospheric heating characteristics over the two regions are significantly different, that is, the anomalous Q1 in northwestern TP is mainly found between the near-ground plateau and 300 hPa in the troposphere, while the Q1 in southeastern TP is more pronounced from 500 hPa to 200 hPa. The regional climate of Pamir Plateau and Tarim Basin are mainly characterized by drought, with less rainfall due to the faint water vapor imported from the tropical Indian Ocean. Meanwhile, the giant mountains in southeastern TP are mainly affected by the monsoon and moist water vapor from the tropical ocean in summer, resulting in abundant water vapor being lifted here, which is conducive to the occurrence of deep convection [49,50]. Therefore, dynamical mechanisms contributing to the interdecadal variations in TP-RWS may be different in northwestern and southeastern TP.
The components of RWS, i.e., the vortex stretching term (RWS-S1) and the absolute vorticity advection term caused by divergent flow (RWS-S2), can be used to determine the causes of interdecadal TP-RWS during 1900 to 2010. From Formula (1), RWS-S1 is mainly determined by absolute vorticity and strong divergence, and the RWS-S2 is directly related to absolute vorticity gradient and the divergent wind component. In general, strong atmospheric heating can lead to circulation changes, which can be understood as the local influence of the RWS-S1 term on Rossby wave source. Moreover, other regions also can affect the RWS through large-scale divergent flow, which can be used as a horizontal distribution rebalancing of absolute vorticity by RWS-S2 term. The time series of TP-RWS sub-items have obvious interdecadal changes in summer from 1900 to 2010 (Figure 6). Both RWS-S1 and RWS-S2 are closely related to TP-RWS on the interdecadal scale, with correlation coefficients of 0.81 and 0.67, respectively. By comparison, RWS-S1 seems to play a more dominant role. However, the correlation coefficient between RWS-S1 and RWS-S2 is only 0.14, which indicates that their interdecadal evolutions are independent of each other. Furthermore, we find that the interdecadal Q1 fluctuations over northwestern and southeastern TP also represent significant differences with correlation coefficient of −0.05 only. Meanwhile, similar interdecadal temporal variations exist between TPRWS-S1 and northwestern TP-Q1 and between TPRWS-S2 and southeastern TP-Q1, with the correlation coefficients reaching 0.60 and 0.51, respectively. These results show that the TPRWS-S1 and TPRWS-S2, which cause interdecadal variation of TP-RWS, have independent changes along with the related atmospheric diabatic heating in different regions over the TP. Therefore, the interdecadal TP-RWS can be regarded as a result of the joint contribution of Q1 over northwestern and southeastern TP by different dynamical mechanisms.
Next, we calculate correlation maps between the two sub-terms of RWS and multiple meteorological elements on the interdecadal scale. As shown in Figure 7, the contribution of TPRWS-S1 to TP-RWS mainly occurs over the Pamir Plateau, which is characterized by both strong divergence and anomalous absolute vorticity. In addition, significant negative snow albedo and increased surface sensible heat flux are observed along the northwestern TP. Since the albedo of snow cover is significantly greater than that of other underlying surfaces (e.g., soil, forest, grass, and water), the albedo decreases when the snow melts, resulting in more solar radiation absorbed by the ground and the net radiation increases. The processes enhance surface sensible heat flux and lead to an increased Q1 over northwestern TP in the middle and lower troposphere. Therefore, the main contribution component of TP-RWS in northwestern TP is TPRWS-S1, which is caused by interdecadal variations in snow cover. In addition, we find that the snow albedo associated with the TPRWS-S1 shows a spatial east–west dipole-like pattern over the TP. This feature has also been observed in the study of the plateau snow cover [51,52]. In contrast, the main effect of TPRWS-S2 on TP-RWS is manifested in southeastern TP (Figure 8) due to the strong absolute vorticity advection caused by deep convection. A strong divergence is accompanied by the meridional northward flow in southeastern TP. This process excites disturbance in vorticity field, which is conducive to the RWS-S2 formation at the upper troposphere. Thus, the interdecadal TP-RWS variations during boreal summer are a synergistic result of the snow cover related to the vortex stretching term in northwestern TP and the deep convection related to the absolute vorticity advection term in southeastern TP.
In summary, the interdecadal variation in TP-RWS is closely related to atmospheric diabatic heating over northwestern and southeastern TP. The interdecadal variations in snow cover over the TP result in divergence and absolute vorticity anomalies by affecting atmospheric heating from TP surface to the middle troposphere, and then contribute to the TP-RWS by vortex stretching term. On the other hand, due to latent heat release of deep convection in southeastern TP, the TP-RWS can be formed and maintained through absolute vorticity advection caused by large-scale divergent flow in the middle and upper troposphere. Therefore, although the TP-RWS manifests as a whole, the causes of its interdecadal variations are not the same in northwestern and southeastern TP.

3.3. Impacts of the Interdecadal TP-RWS on East Asia Circulation Pattern

The interdecadal TP-RWS in JJA have a significant impact on the downstream atmospheric circulation and precipitation. From the correlation maps between TP-RWS and the land precipitation (Figure 9), an enhanced RWS corresponds to more JJA rainfall over the TP, especially in the southeastern and northwestern TP. These two regions are consistent with the atmospheric diabatic heating areas in the above section. For East Asia, the TP-RWS interdecadal variation corresponds to a clear tripole rainfall pattern. When the intensity of TP-RWS is relatively strong, the regions from the Huang-huai River Basin to the southern Korean Peninsula and the southern part of the Japan Island are accompanied by moisture anomalies, while the South China and North China are usually dry. By comparing different reanalysis results of TP-RWS and precipitation datasets, we find that there are significant relationships between the interdecadal TP-RWS and the precipitation in the Huang-huai River Basin. All the results show that the JJA rainfall in the north of the Yangtze River increases, while the precipitation in South China is suppressed.
In order to reveal the causes of the close relationship between TP-RWS and precipitation in East Asia, the Asia–Pacific atmospheric circulation anomaly associated with the TP-RWS is further discussed and analyzed in this study. As shown in Figure 10, significant negative geopotential height anomalies are observed at the middle and low troposphere over northwestern TP, Huang-huai River Basin, and the southern part of Japan, while positive geopotential heights appear over the southeastern TP and the northwestern Pacific Ocean. The stream function field at 850 hPa in the southern TP and East Asia is dominated by anomalous cyclonic circulation, and the centers are located in eastern India and Bangladesh, the Indochina Peninsula, and the Huang-huai River Basin. The prevailing southerly and easterly winds in the northwestern Pacific Ocean and the Huang-huai River Basin are attributed to the anomalous cyclonic circulation at the lower troposphere in East Asia, which lead to the water vapor convergence and upward movement at the middle and lower troposphere. The above circulation pattern provides favorable water vapor transmission and dynamic conditions for the occurrence of precipitation in these regions, which increase the precipitation in the Huang-huai River Basin, South Korea, and Japan.
We further discuss the spatial distribution of the relationship between interdecadal TP-RWS and related wave-activity flux. A prominent characteristic is that the TP-RWS triggers a zonal wave train along the northwestern TP to the North Pacific (Figure 11a). The geopotential height in northwestern TP, eastern TP, East Asia, and the northwestern Pacific Ocean correspond to negative, positive, negative, and positive wave train anomalies, respectively. As shown in Figure 11b, strengthening TP-RWS is accompanied by an anomalous wave activity flux originating over the northwestern TP and propagating eastward along the westerly jet stream to the East Asia and northwestern Pacific. This anomalous wave flux also has a tendency to spread southward but to a lesser extent. Moreover, we investigate the vertical structure to further explore the teleconnection pattern associated with interdecadal TP-RWS. A significant zonal wave train can be seen from the TP to the northwestern Pacific, and the strongest wave flux is located over the western TP, accompanied by a Rossby wave spreading downstream to East Asia and the North Pacific. In addition, the TP-RWS teleconnection pattern exhibits an equivalent barotropic structure at the vertical profile. It is worth noting that the anomalous wave activity excites from the TP has obvious characteristics of propagating from the upper troposphere to the lower troposphere over East Asia. Accompanied by the low pressure over the Huang-huai River Basin to Japan Island, the TPRWS-excited teleconnection is conducive to the strengthening ascent movement at the middle and lower troposphere.
Previous studies have shown that the Atlantic multidecadal oscillation (AMO) can modulate the intensity of the East Asian summer monsoon by exciting teleconnection wave train [53,54,55,56]. The interannual variation in deep convection in the southeastern TP is also closely associated with the AMO [57,58]. In order to distinguish the effects of TP-RWS and AMO on East Asia, we calculate the partial correlation between interdecadal TP-RWS and the atmospheric circulation without AMO series in the Northern Hemisphere (Figure 12). Consistent with Figure 11, the zonal wave train excited by interdecadal TP-RWS propagating from northwestern TP to East Asia is still clear and the corresponding circulation intensity over East Asia and Northwest Pacific is significantly strengthened. Therefore, it is reasonable to believe that the TP-RWS during 1900 to 2010 can stimulate an equivalent barotropic zonal wave train that travels eastward along the westerly jet to the northwest Pacific and exhibits “low-high-low-high” geopotential height anomalies at the vertical profile. Furthermore, the pattern is conducive to the upward movement and precipitation over the Huang-huai River Basin.

4. Conclusions

Using the ERA-20C monthly reanalysis datasets in summer (June–July–August) from 1900 to 2010 and a variety of global precipitation data, our manuscript studies the multidecadal variations in Rossby wave source over the Tibetan Plateau, the corresponding energy transmission, and its impact on atmospheric circulation pattern over East Asia. The conclusions are summarized as follows:
(1)
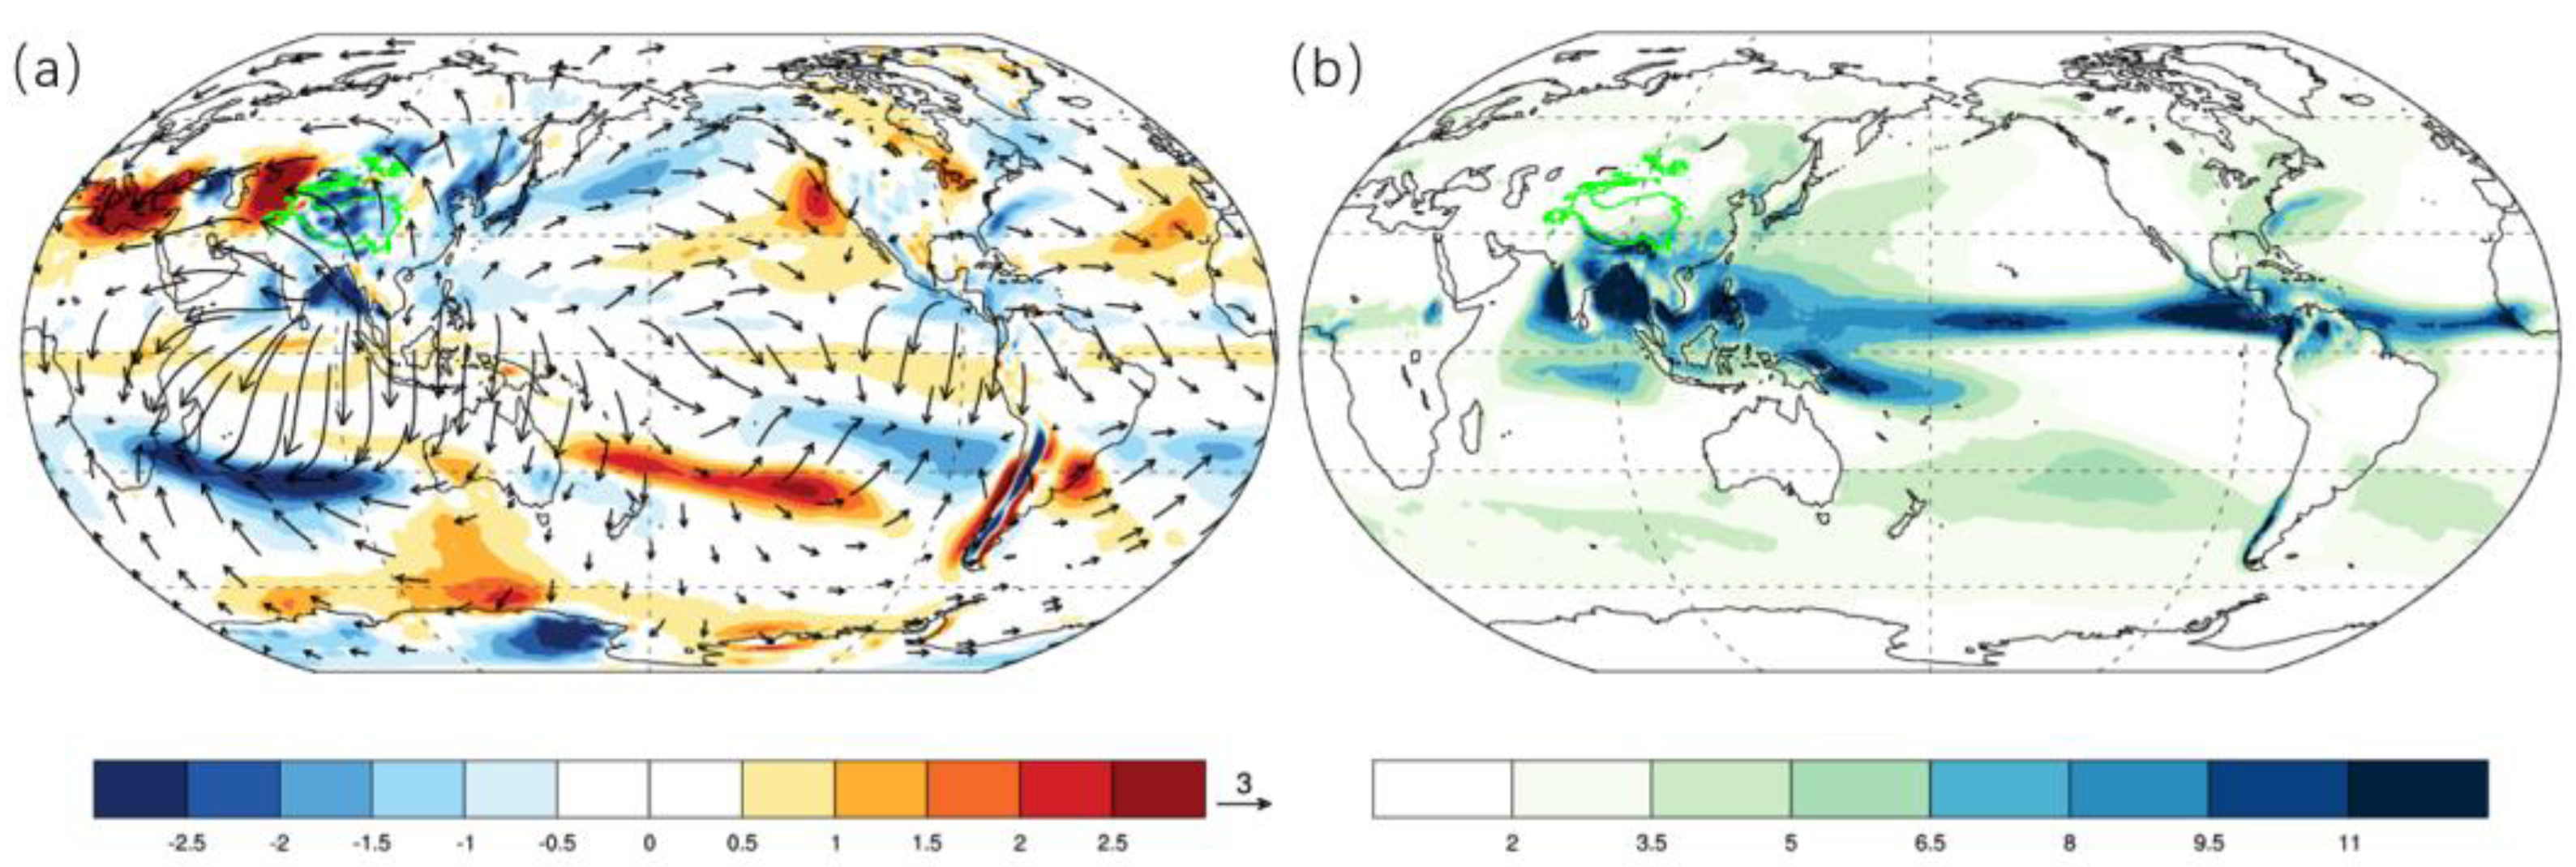
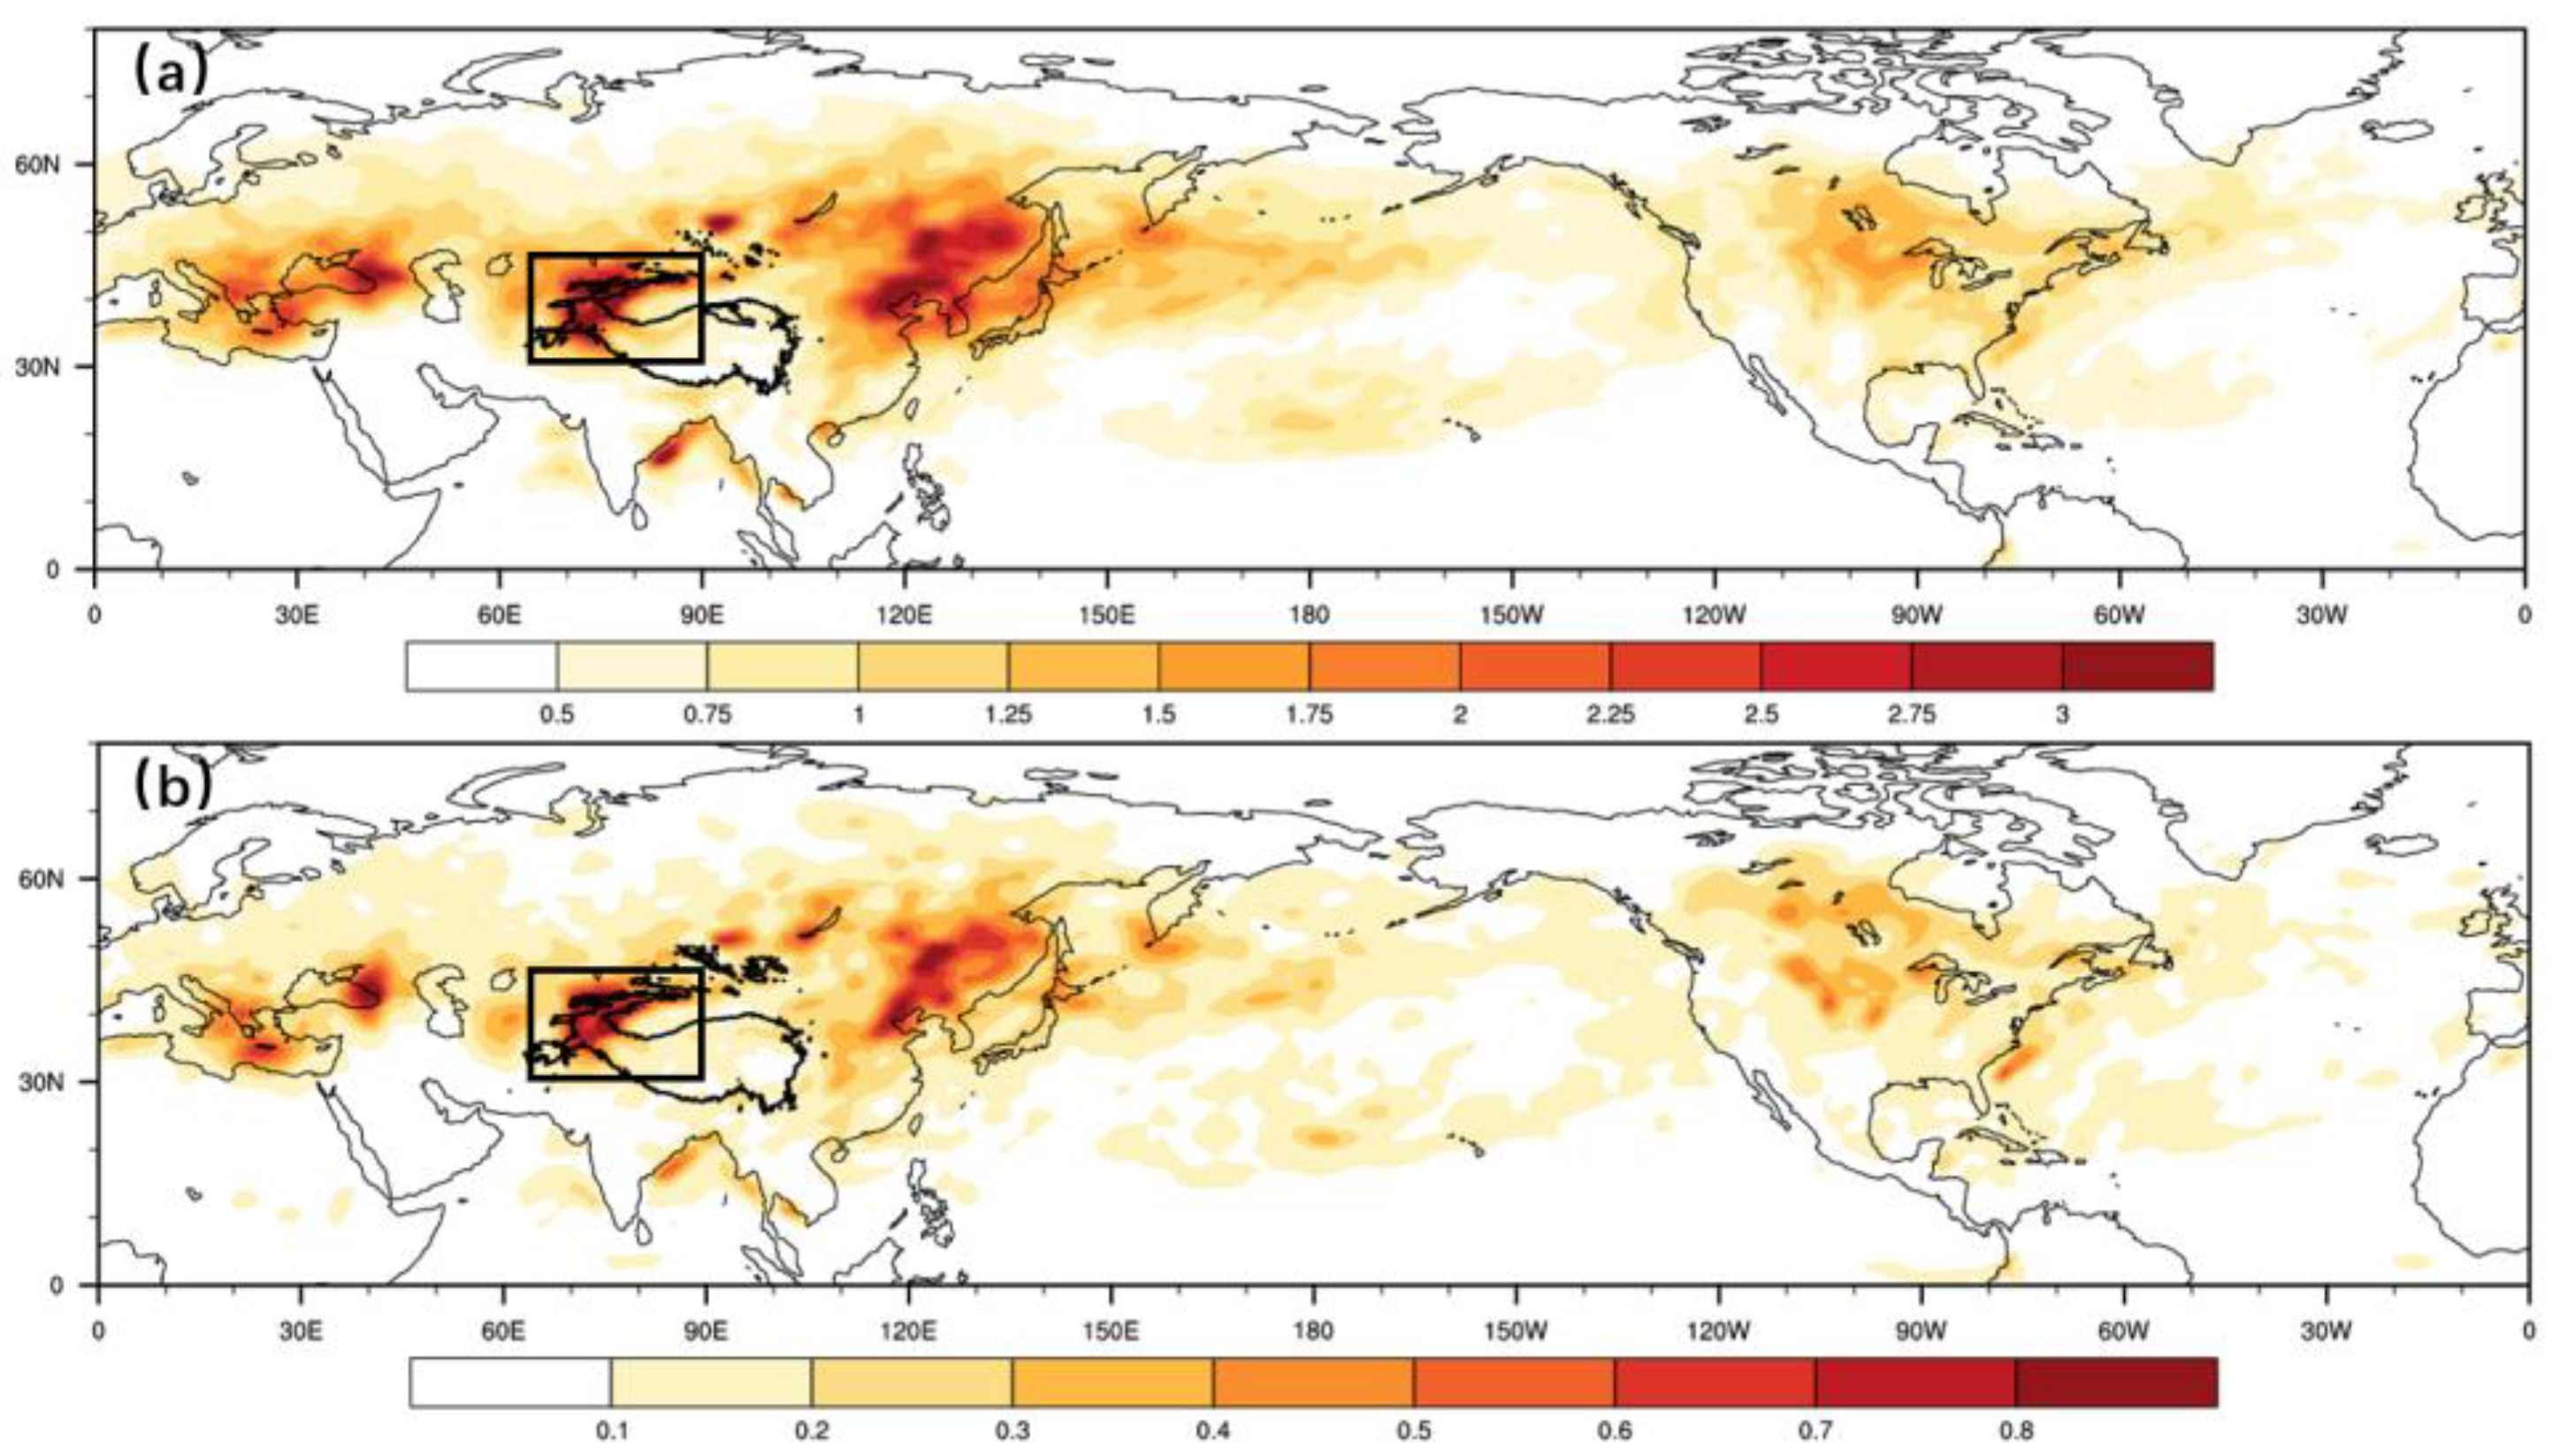
There is a strong negative RWS over the TP during boreal summer. In the recent 110 years, the RWS variability has shown great regional differences in the NH midlatitudes. The regions with large interannual and interdecadal variability occur over the northwestern TP, the northeast of China to the Korean Peninsula, and areas near the Mediterranean Sea along the westerly jet, among which the variability over the TP is the largest.
(2)
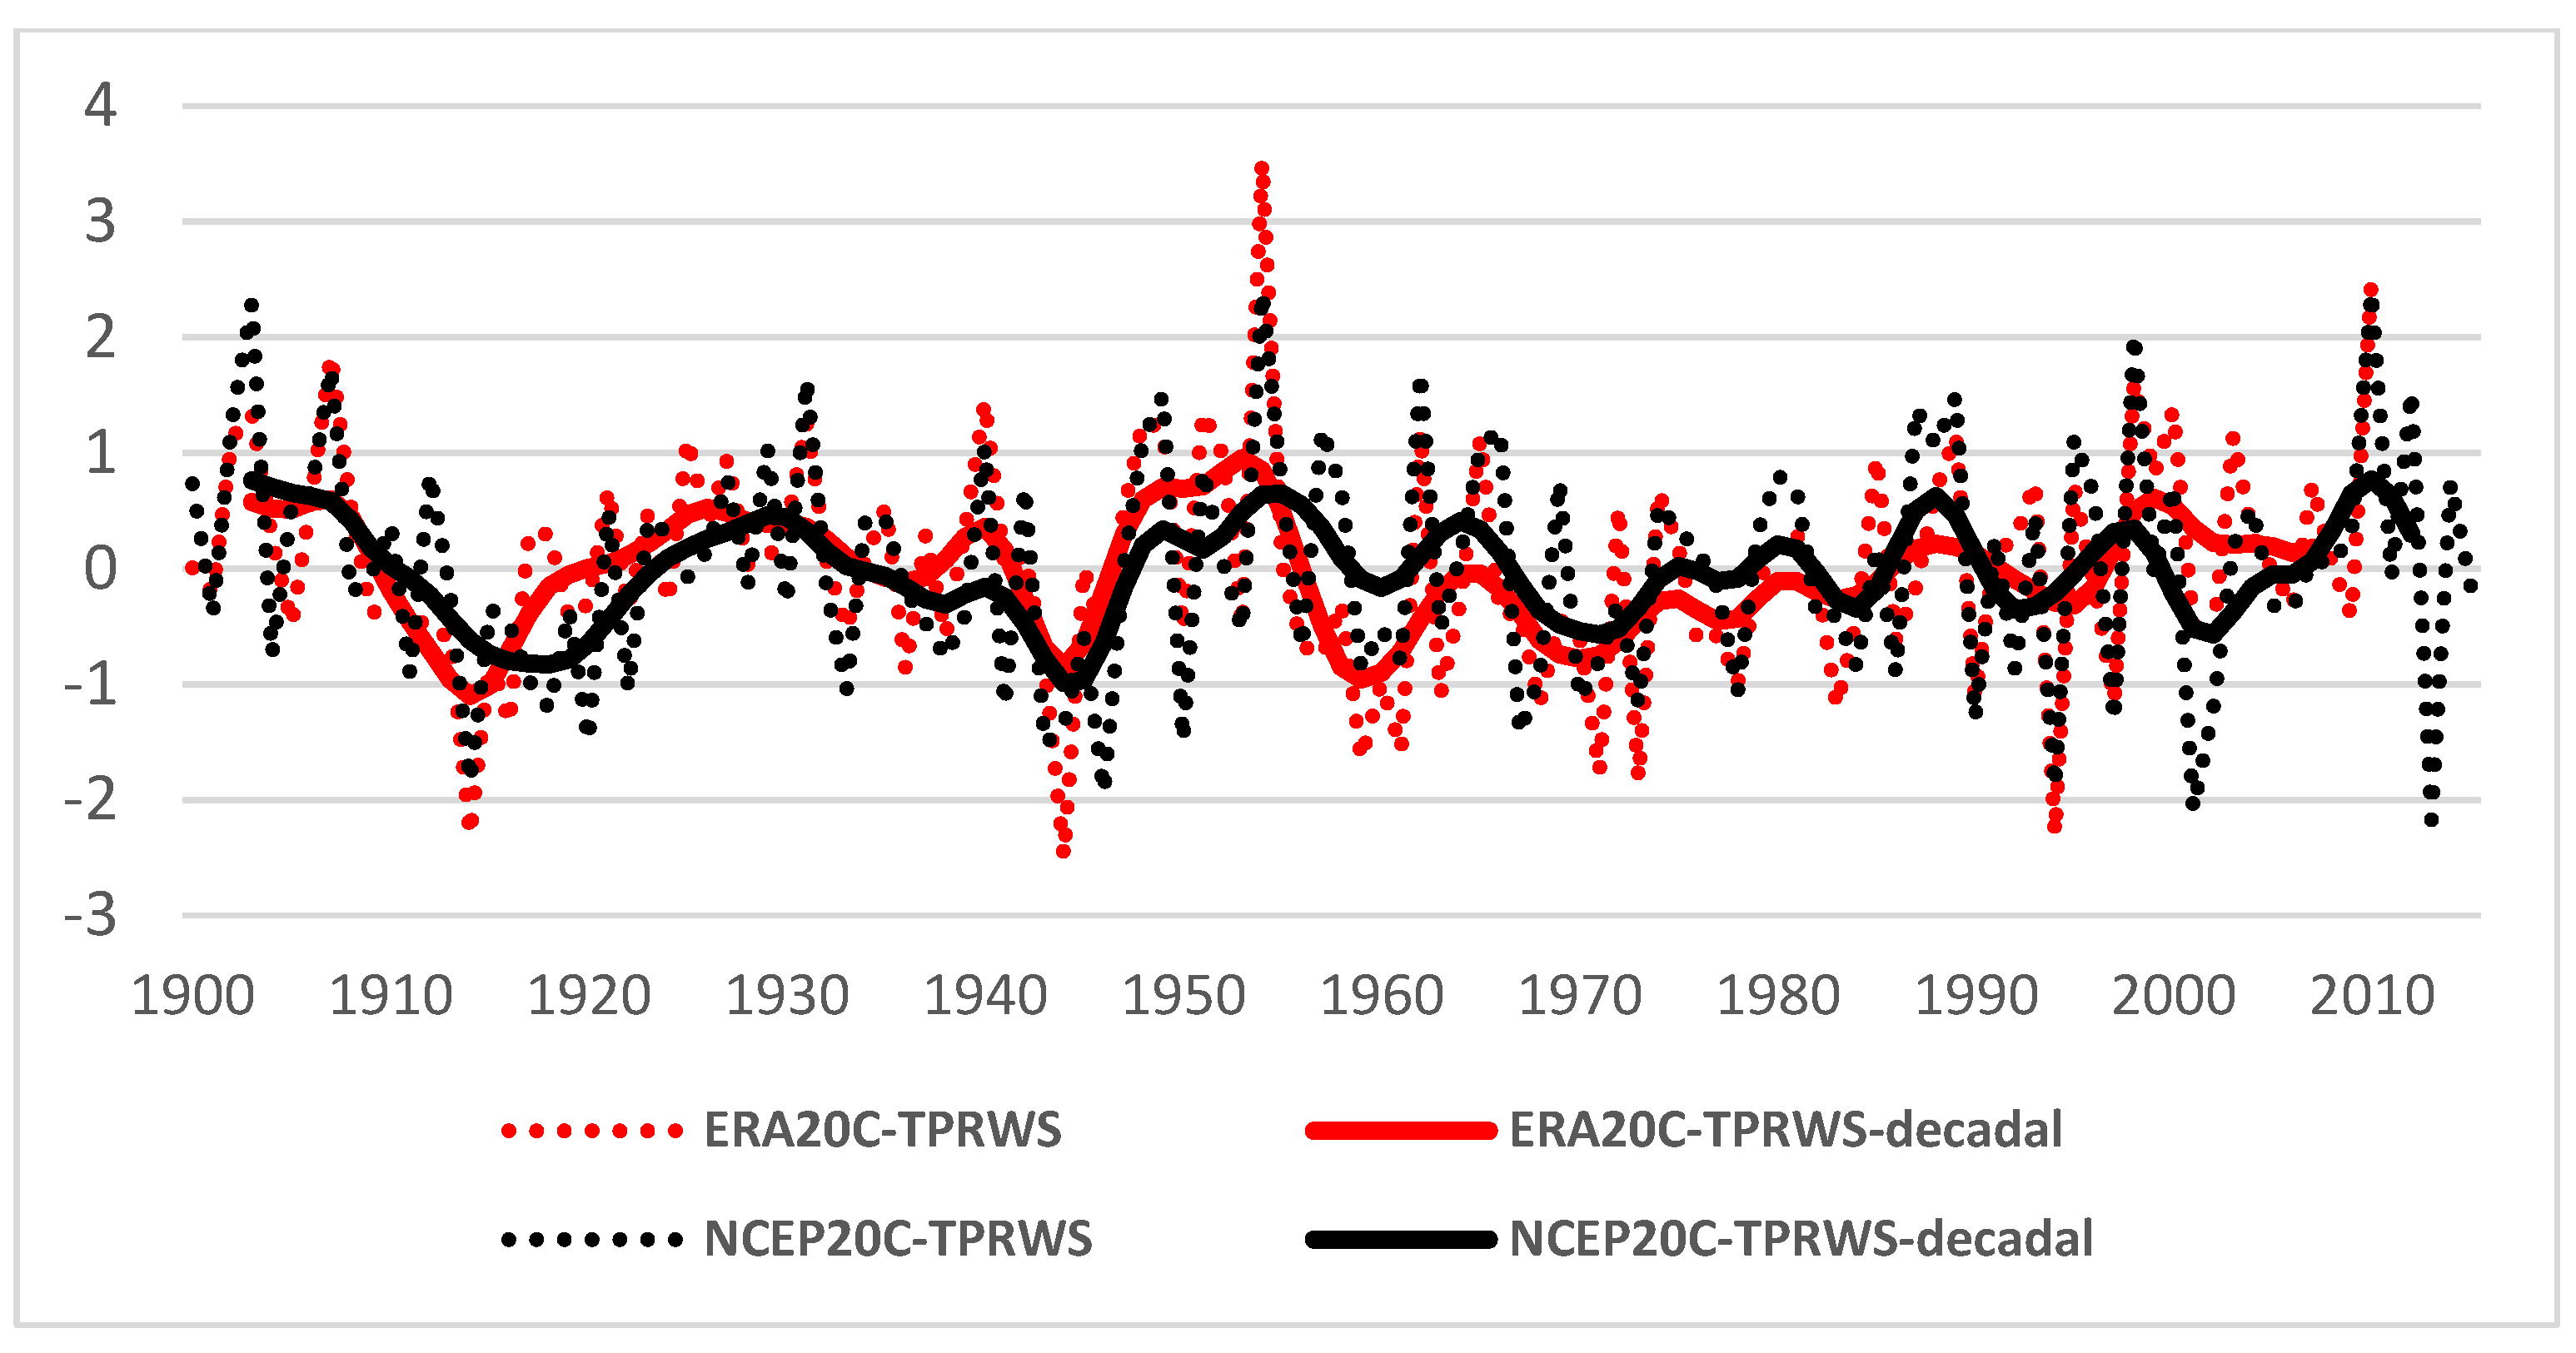
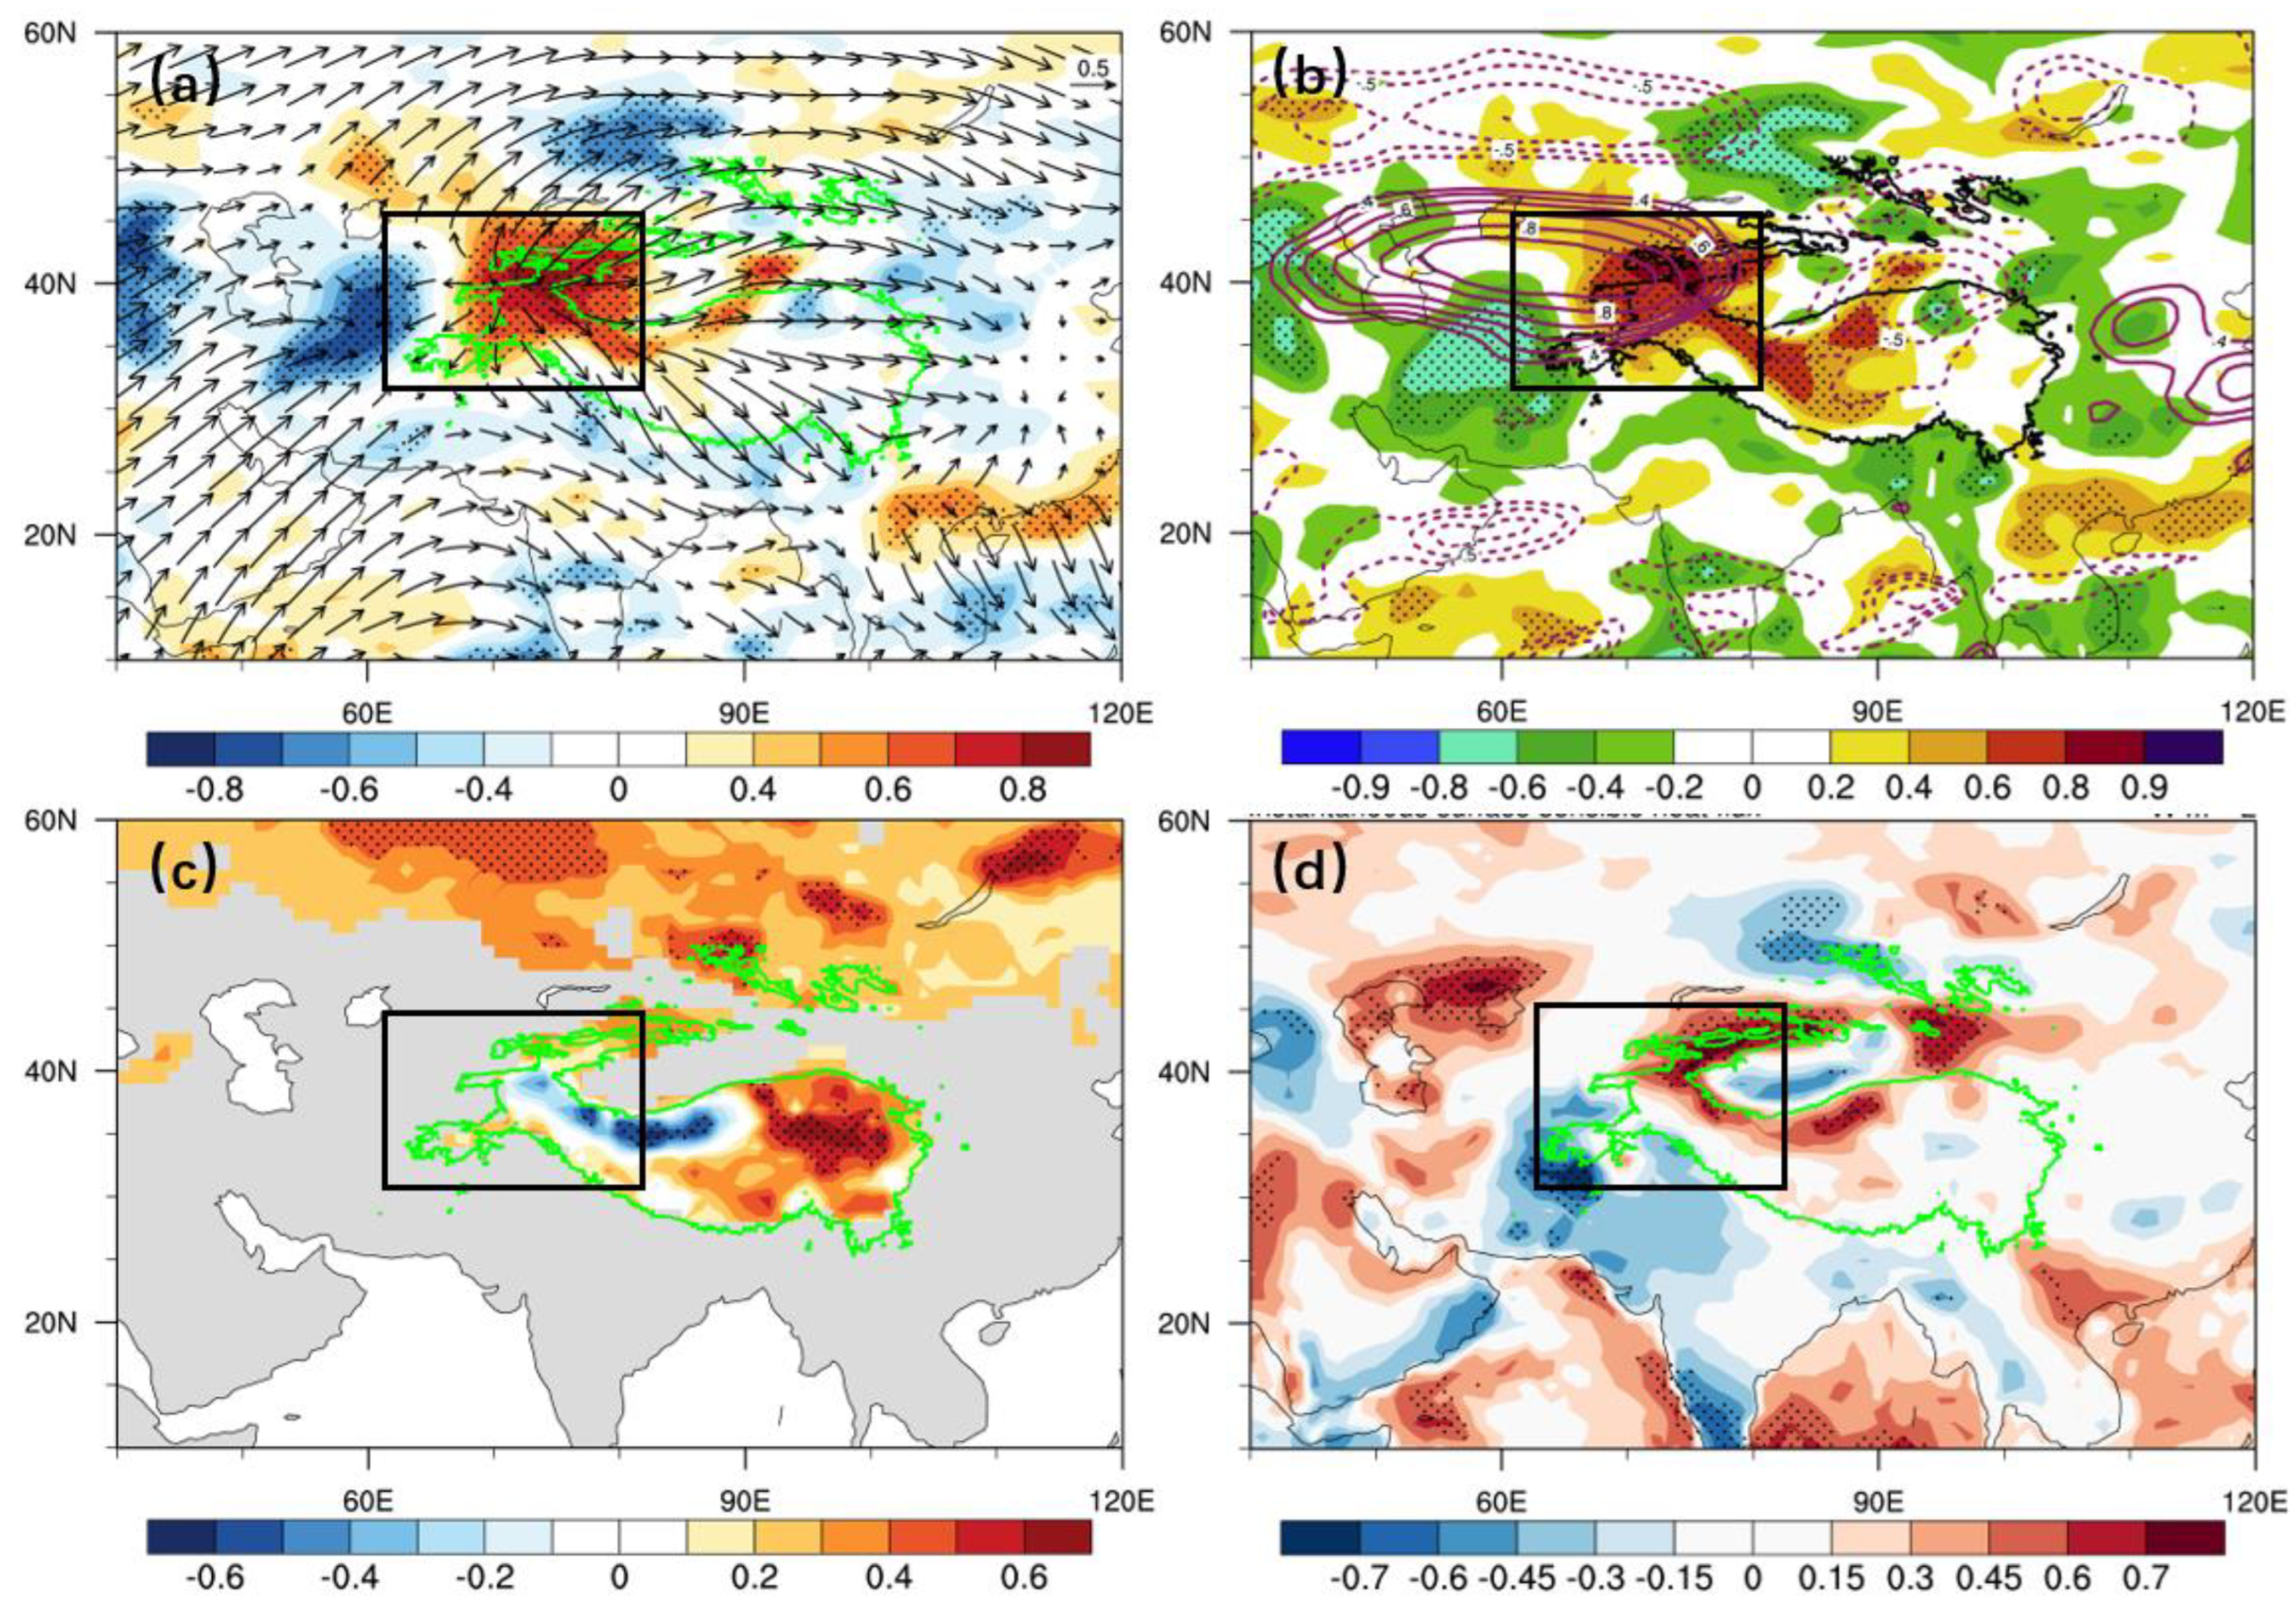
The TP-RWS during 1900 to 2010 is characterized by multidecadal variations. From the perspective of intensity changes, it showed continuous strong periods during the early 20th century, the 1920s to 1940s, the 1950s to 1970s, and after 2000. Correspondingly, the temporal series turned into weak periods during the 1910s to 1920s, 1940s to 1950s, and from 1970s to the end of the 20th century. When the interdecadal TP-RWS intensifies, it is accompanied by strong divergence flow at the upper troposphere.
(3)
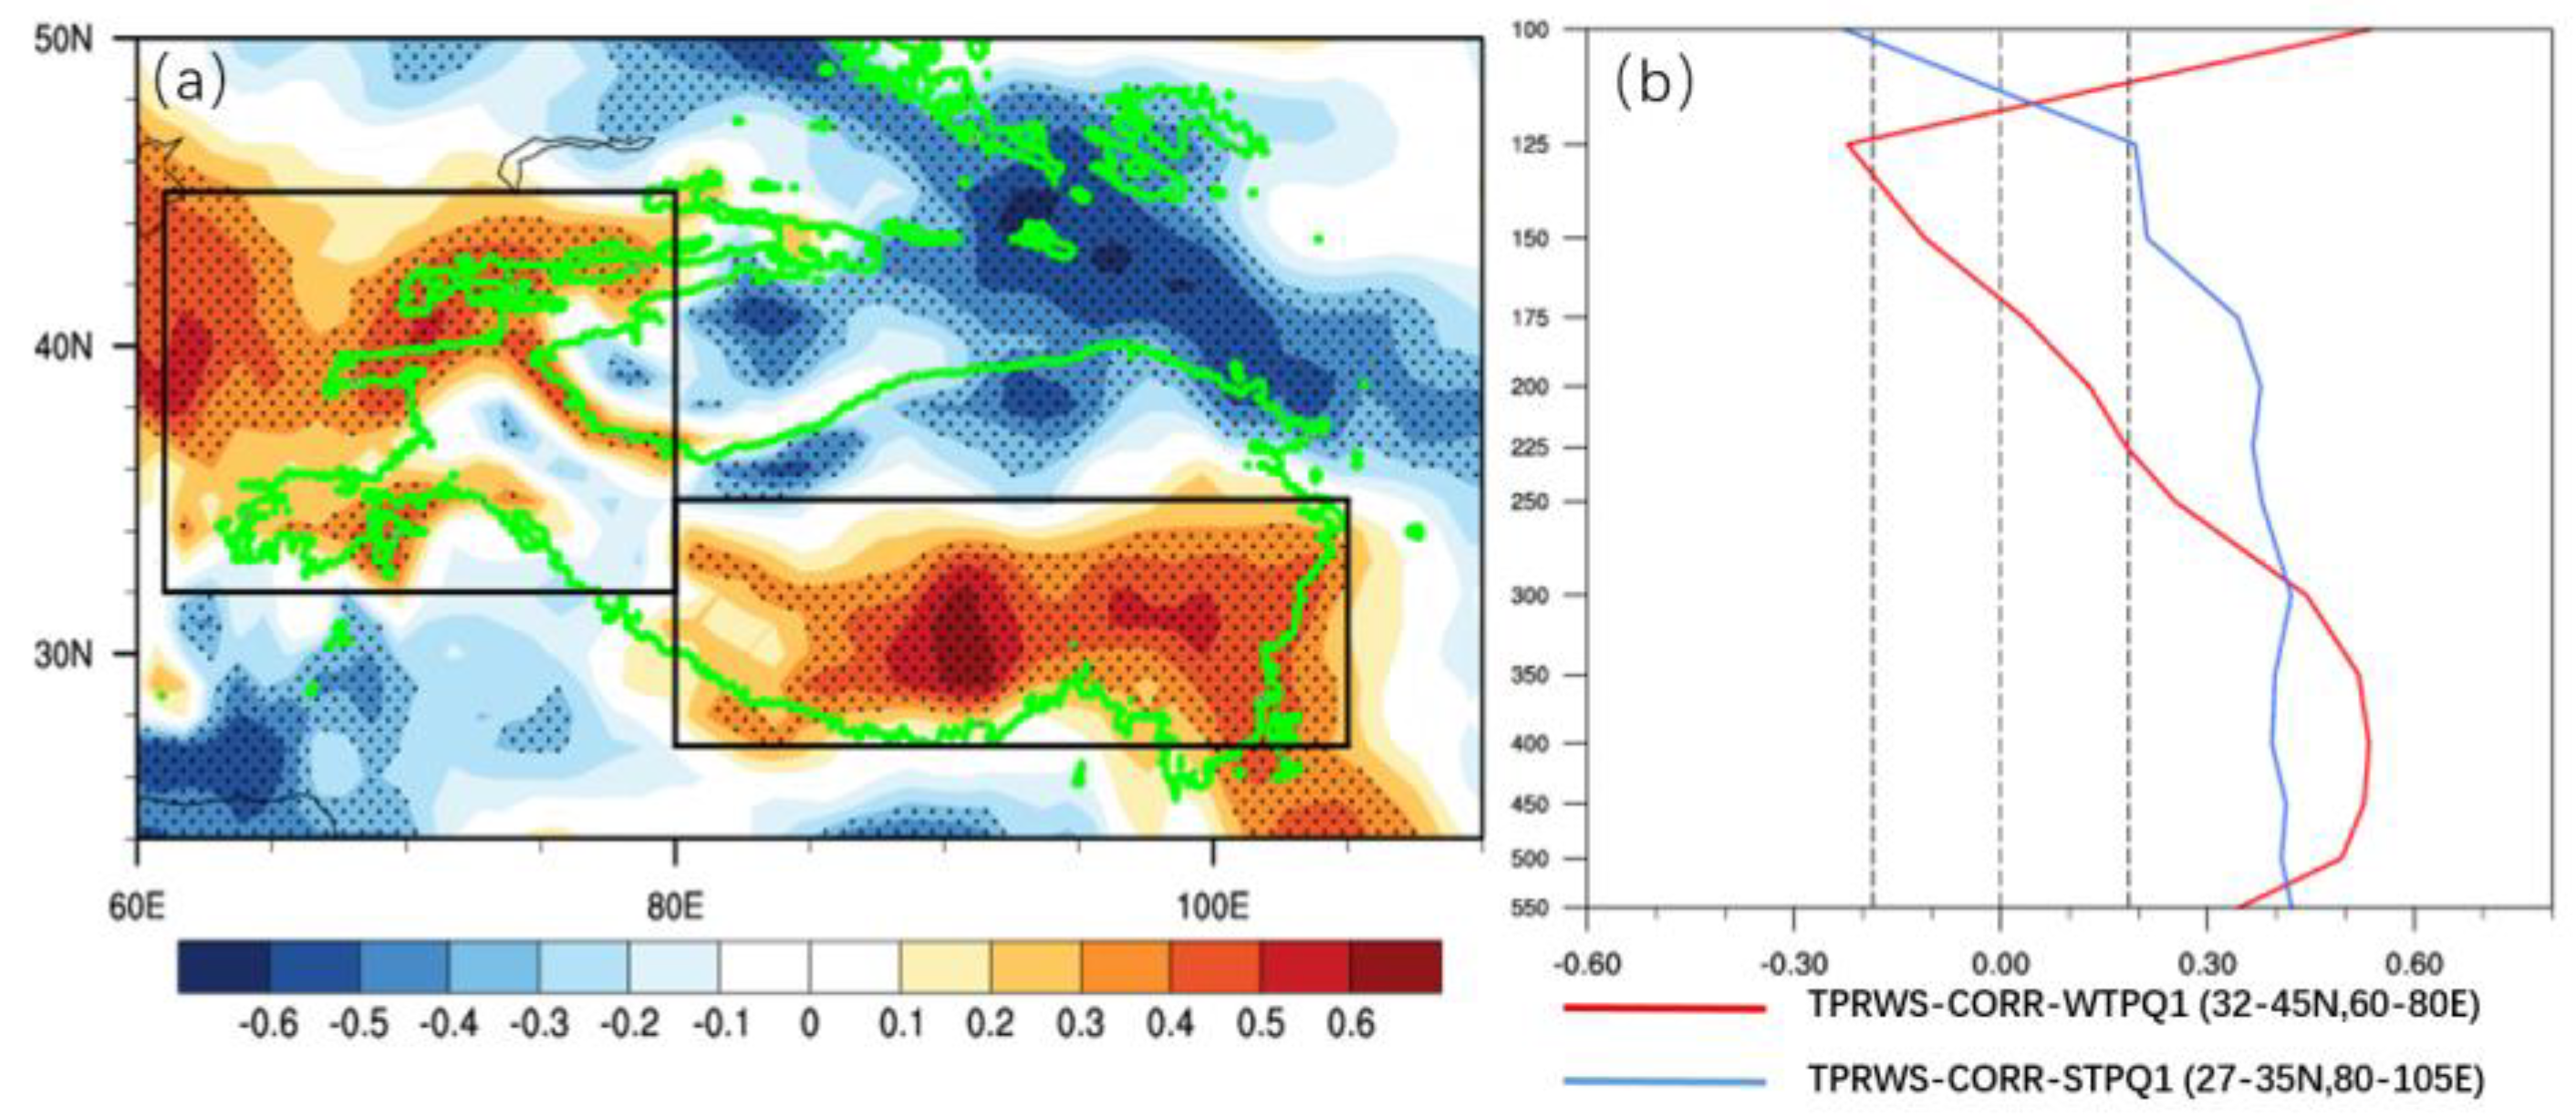
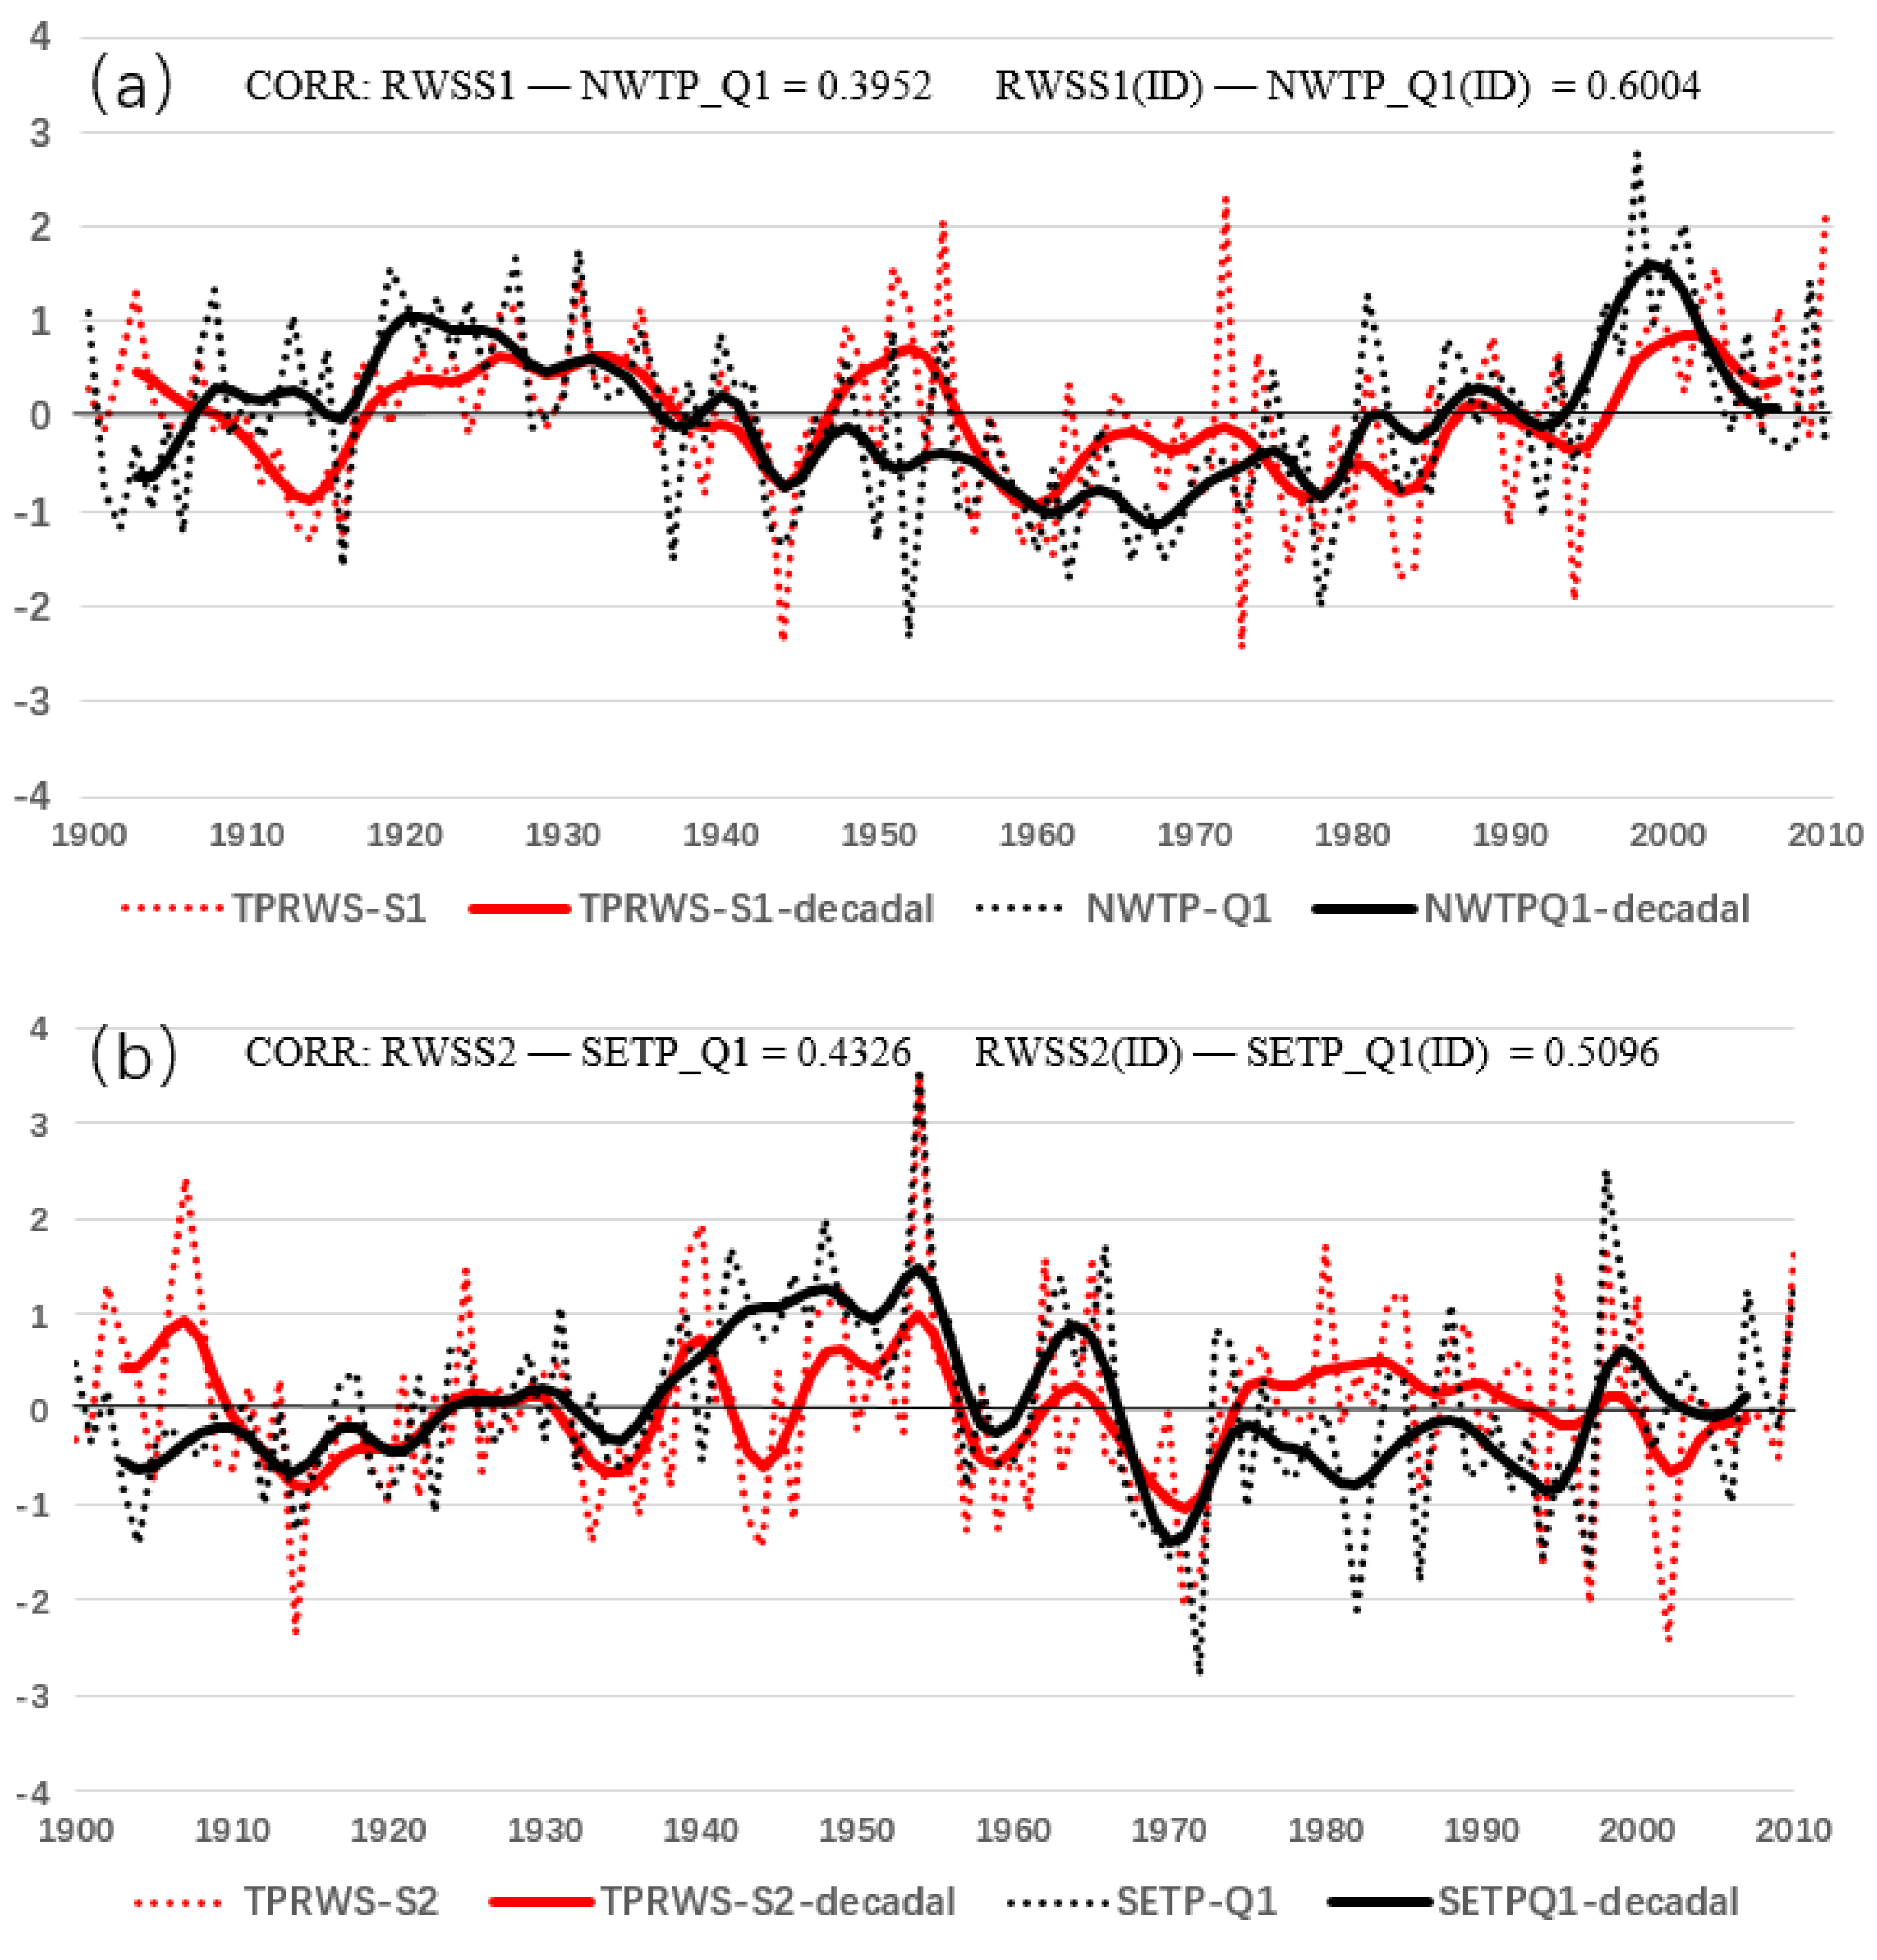
The two sub-items TPRWS-S1 and TPRWS-S2, which constitute the TPRWS have independent interdecadal variations. Meanwhile, similar interdecadal temporal variations exist between TPRWS-S1 and northwestern TP-Q1 and between TPRWS-S2 and southeastern TP-Q1. The interdecadal variations in snow cover over the TP cause the divergence and absolute vorticity anomalies by affecting atmospheric heating from TP surface to the middle troposphere, and then contribute to the TP-RWS. On the other hand, due to latent heat release of deep convection in southeastern TP, the TP-RWS can be formed through absolute vorticity advection caused by large-scale divergent flow in the middle and upper troposphere. Therefore, although the TP-RWS manifests as a whole, the causes of its interdecadal variations are not the same in northwestern and southeastern TP.
(4)
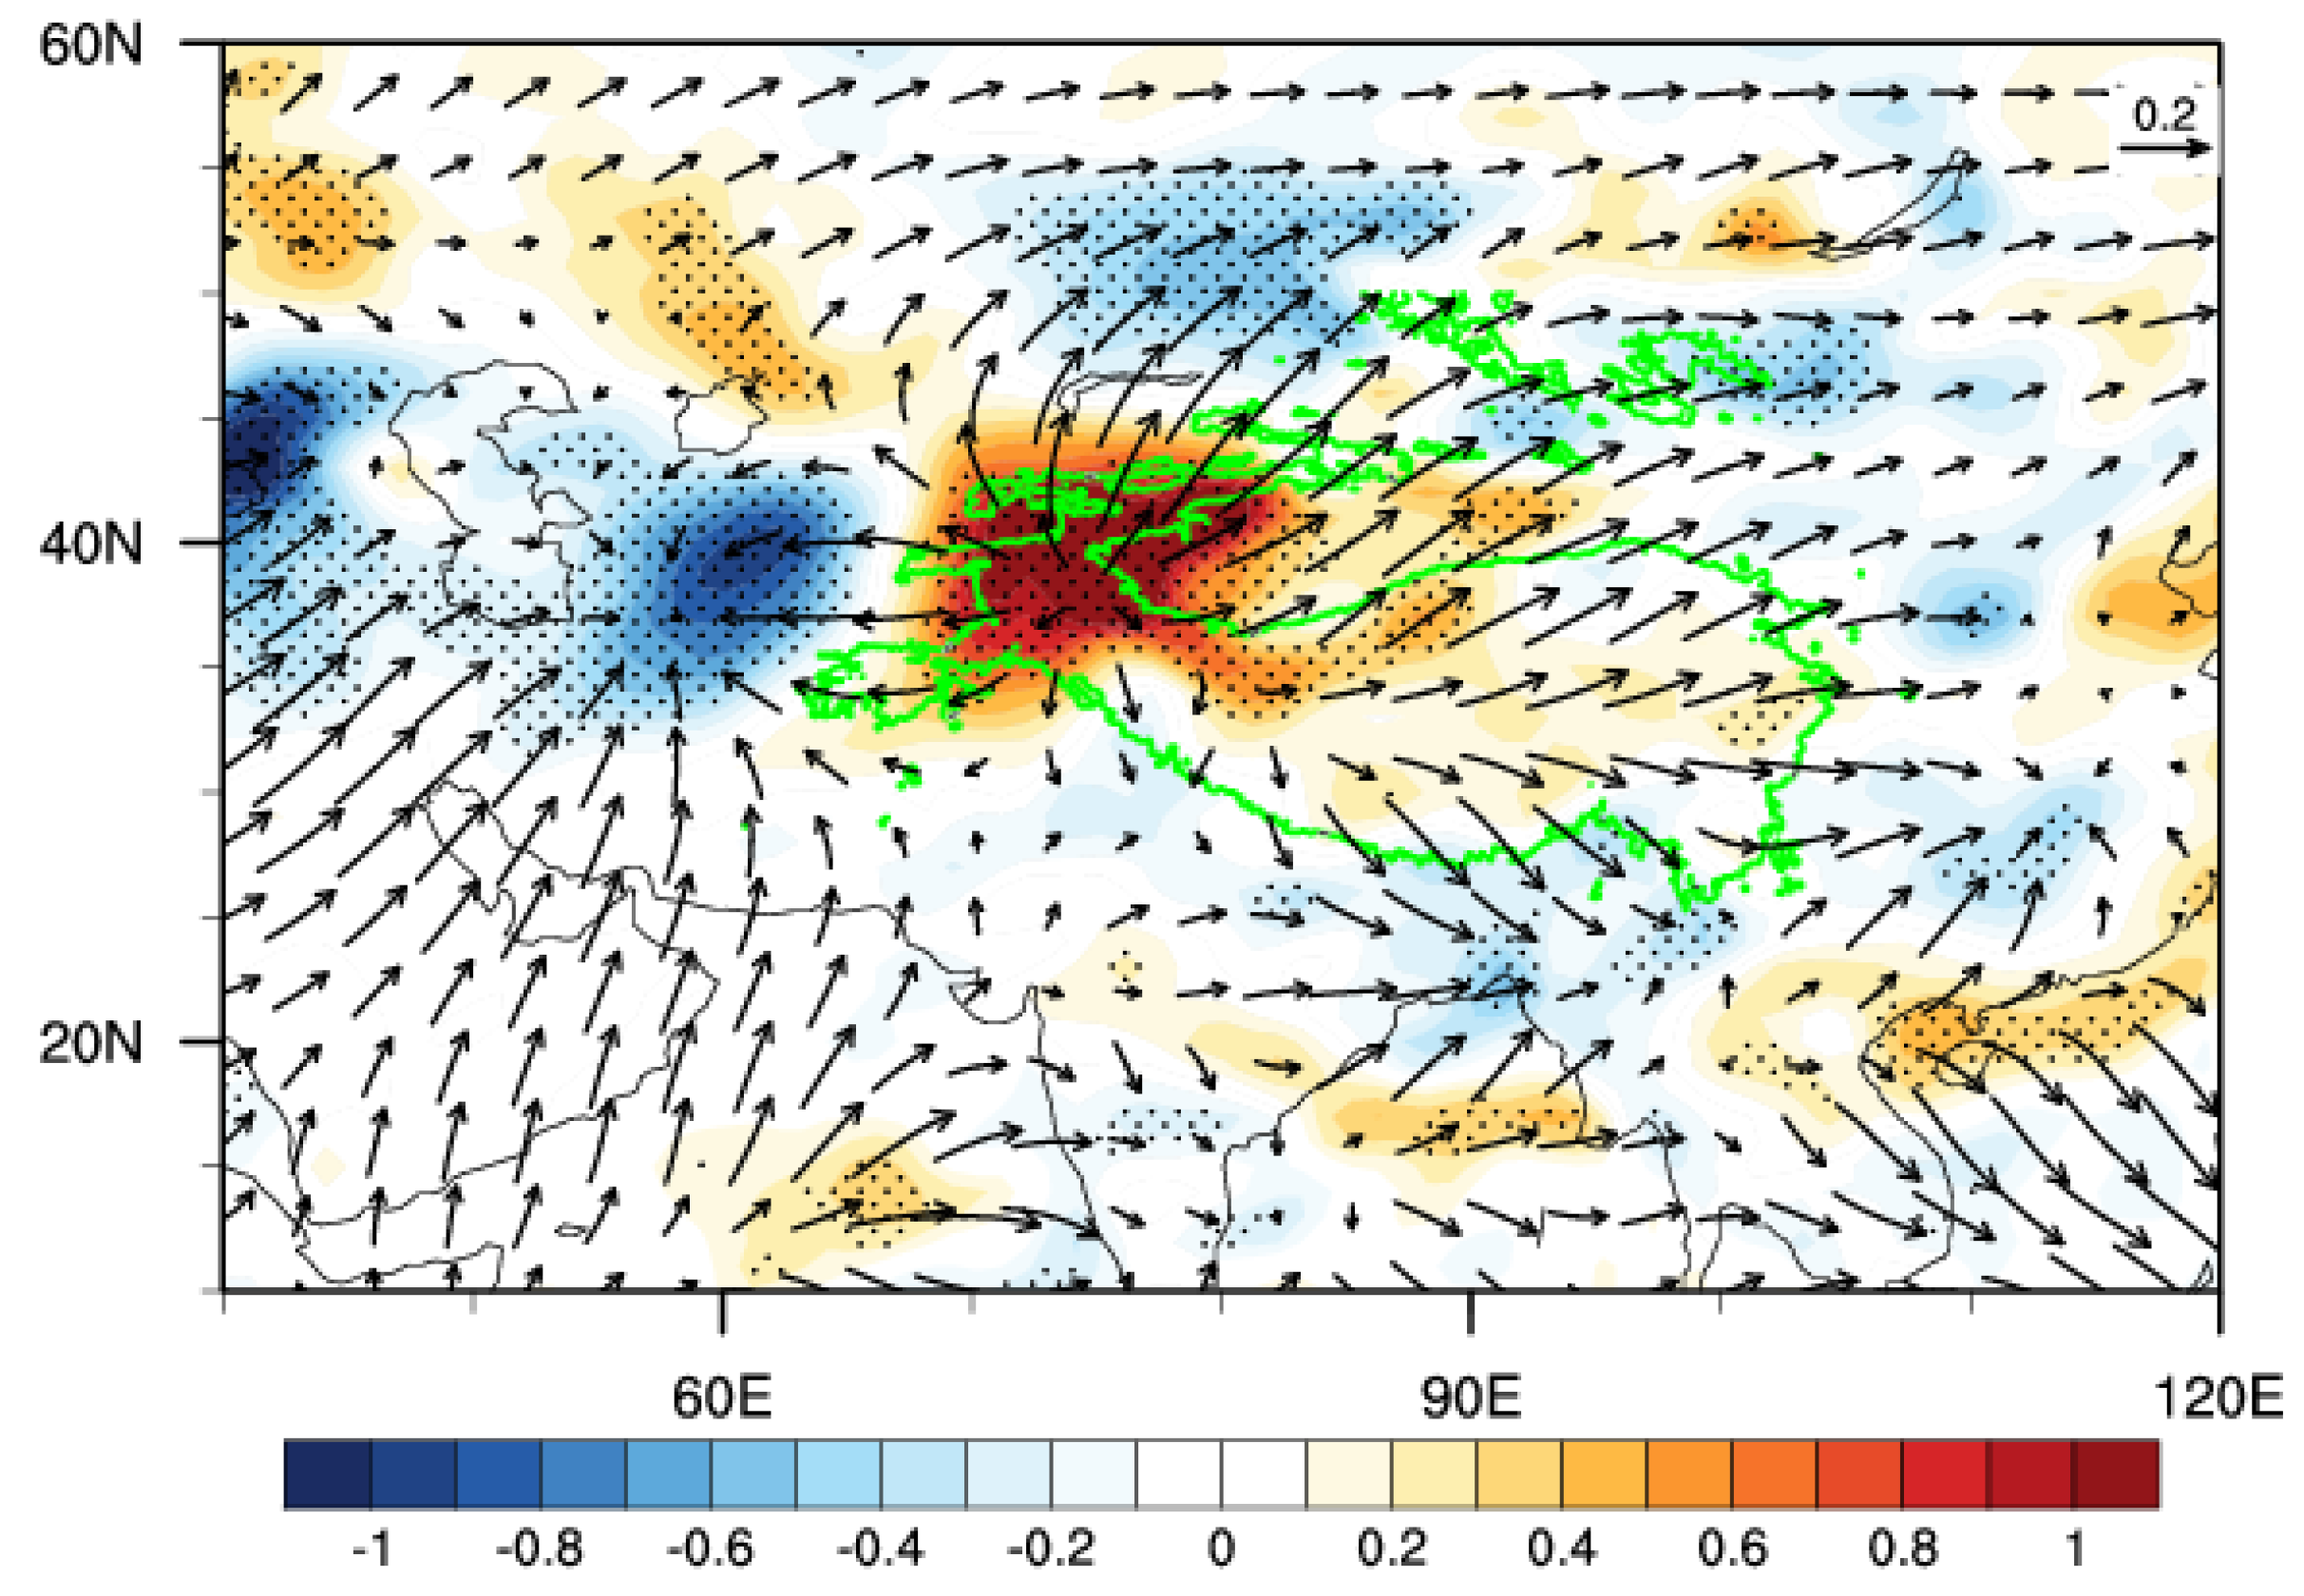
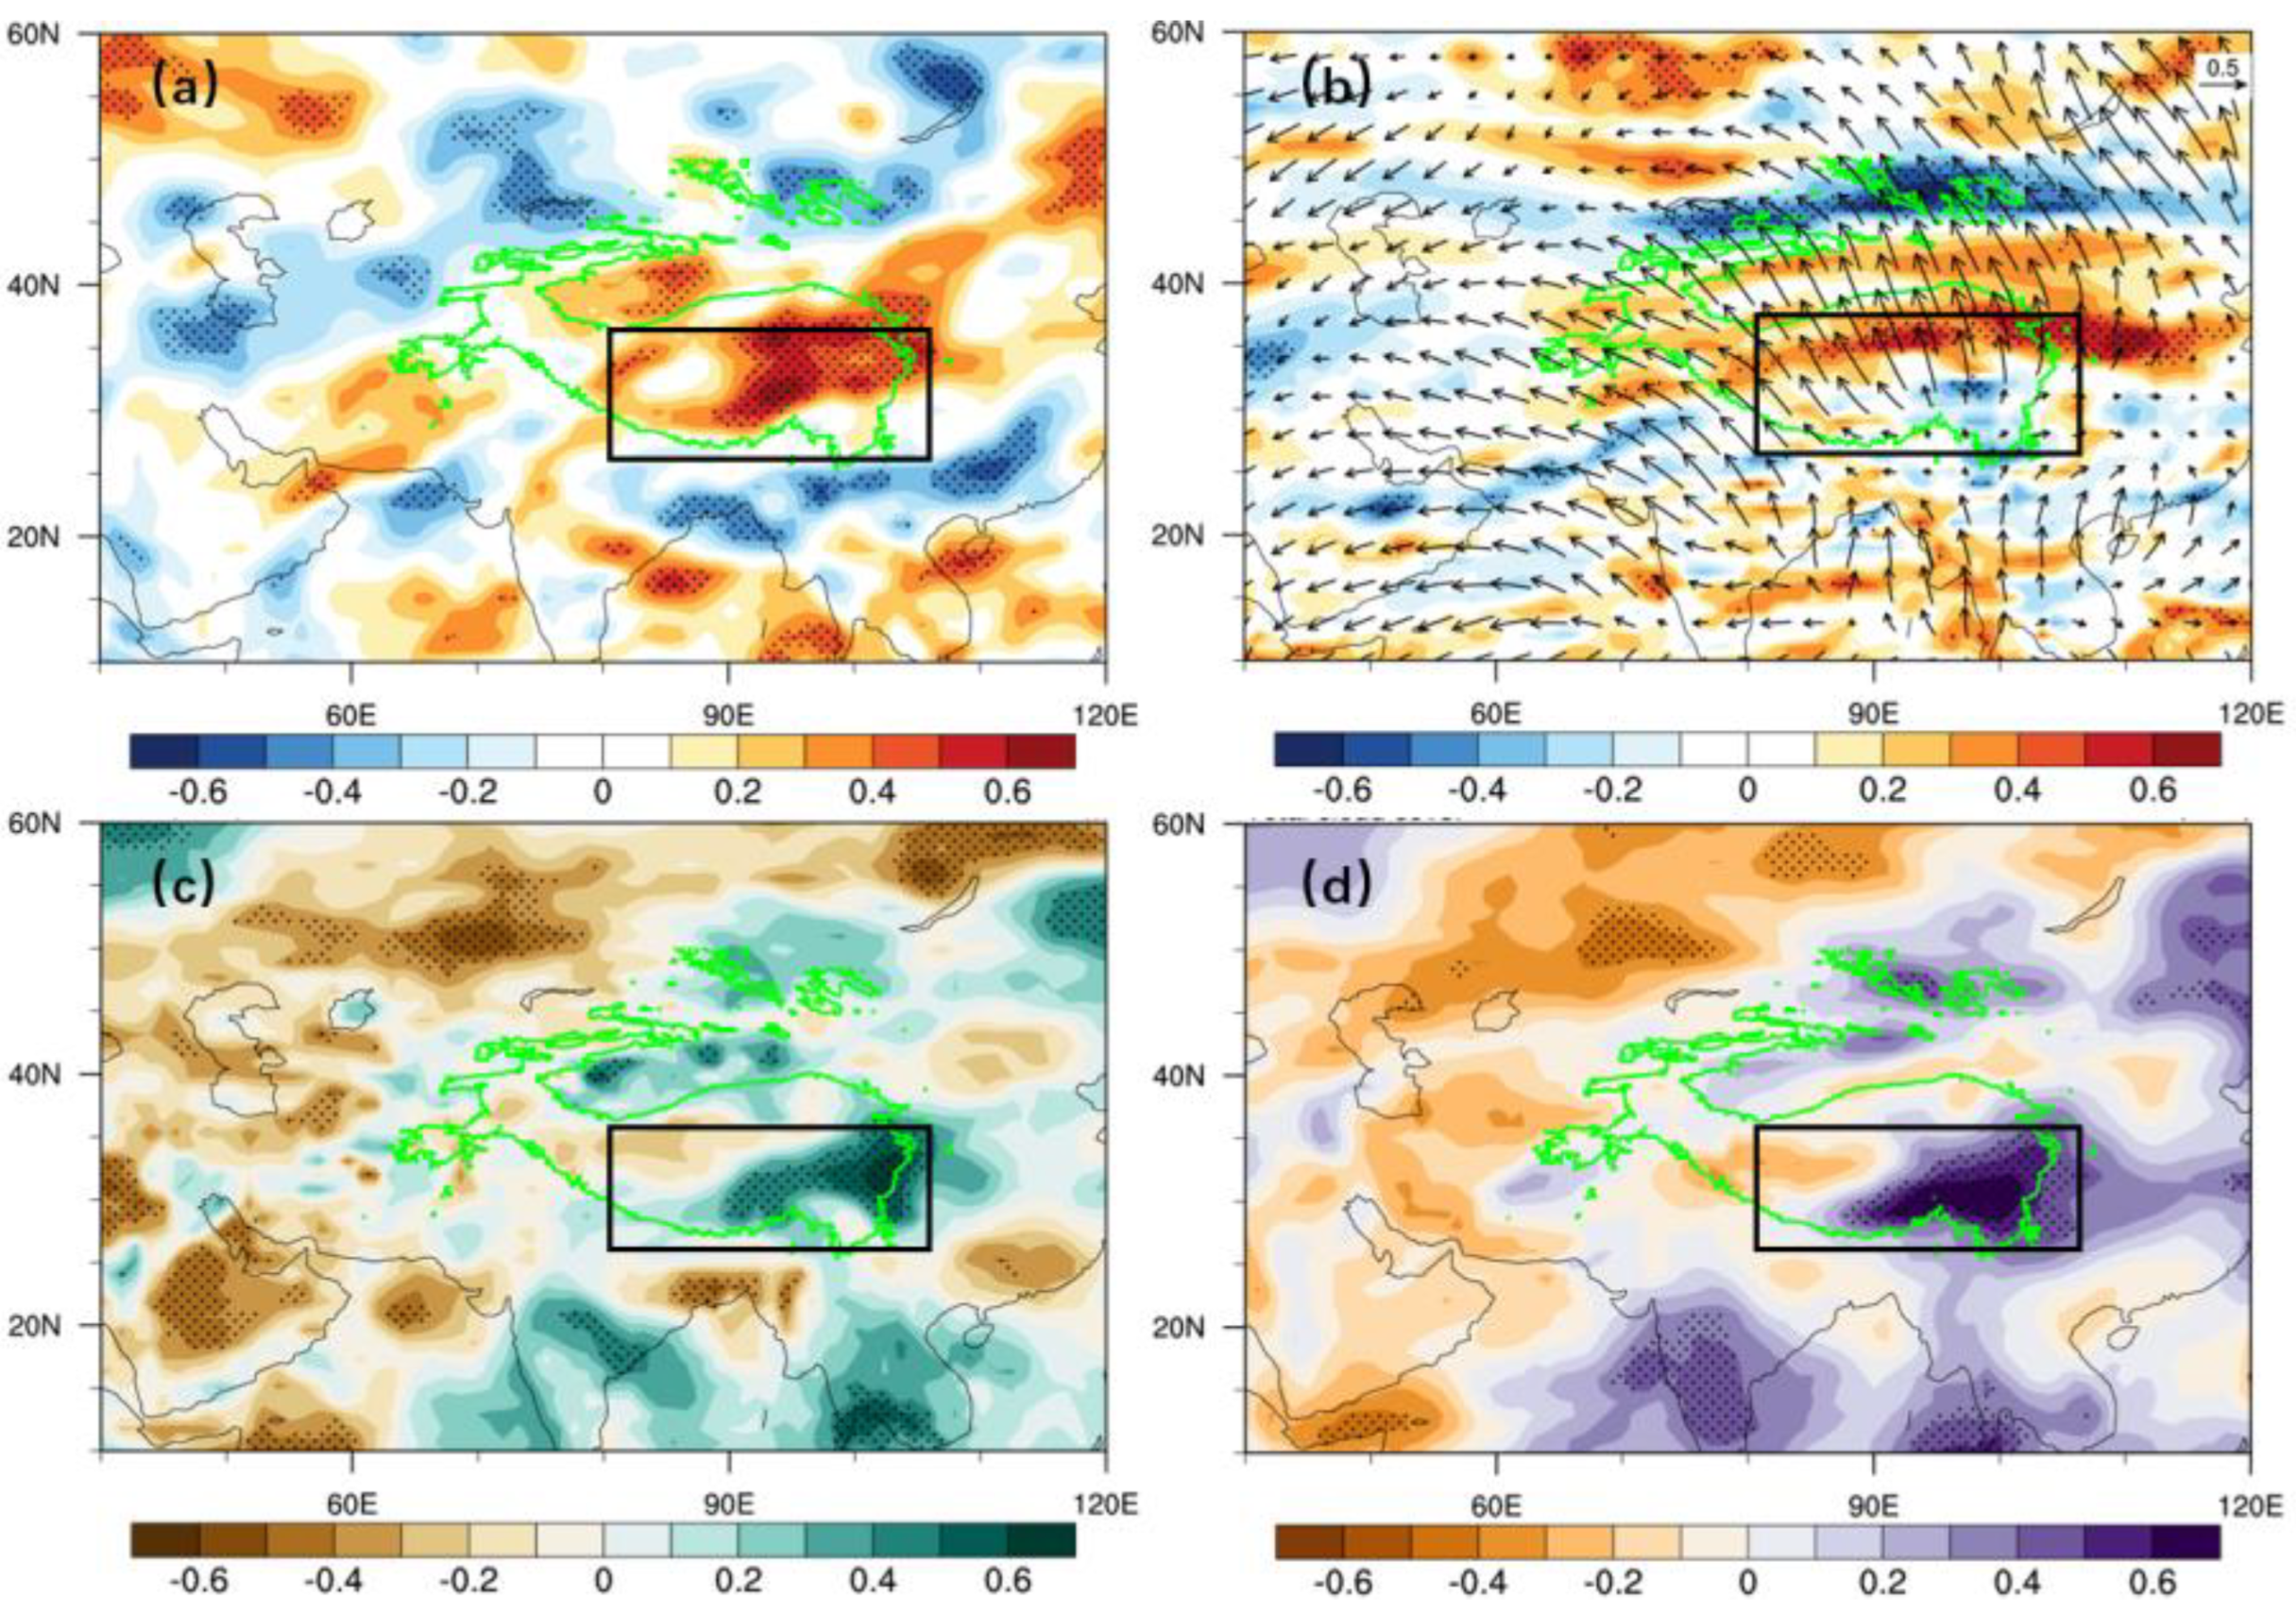
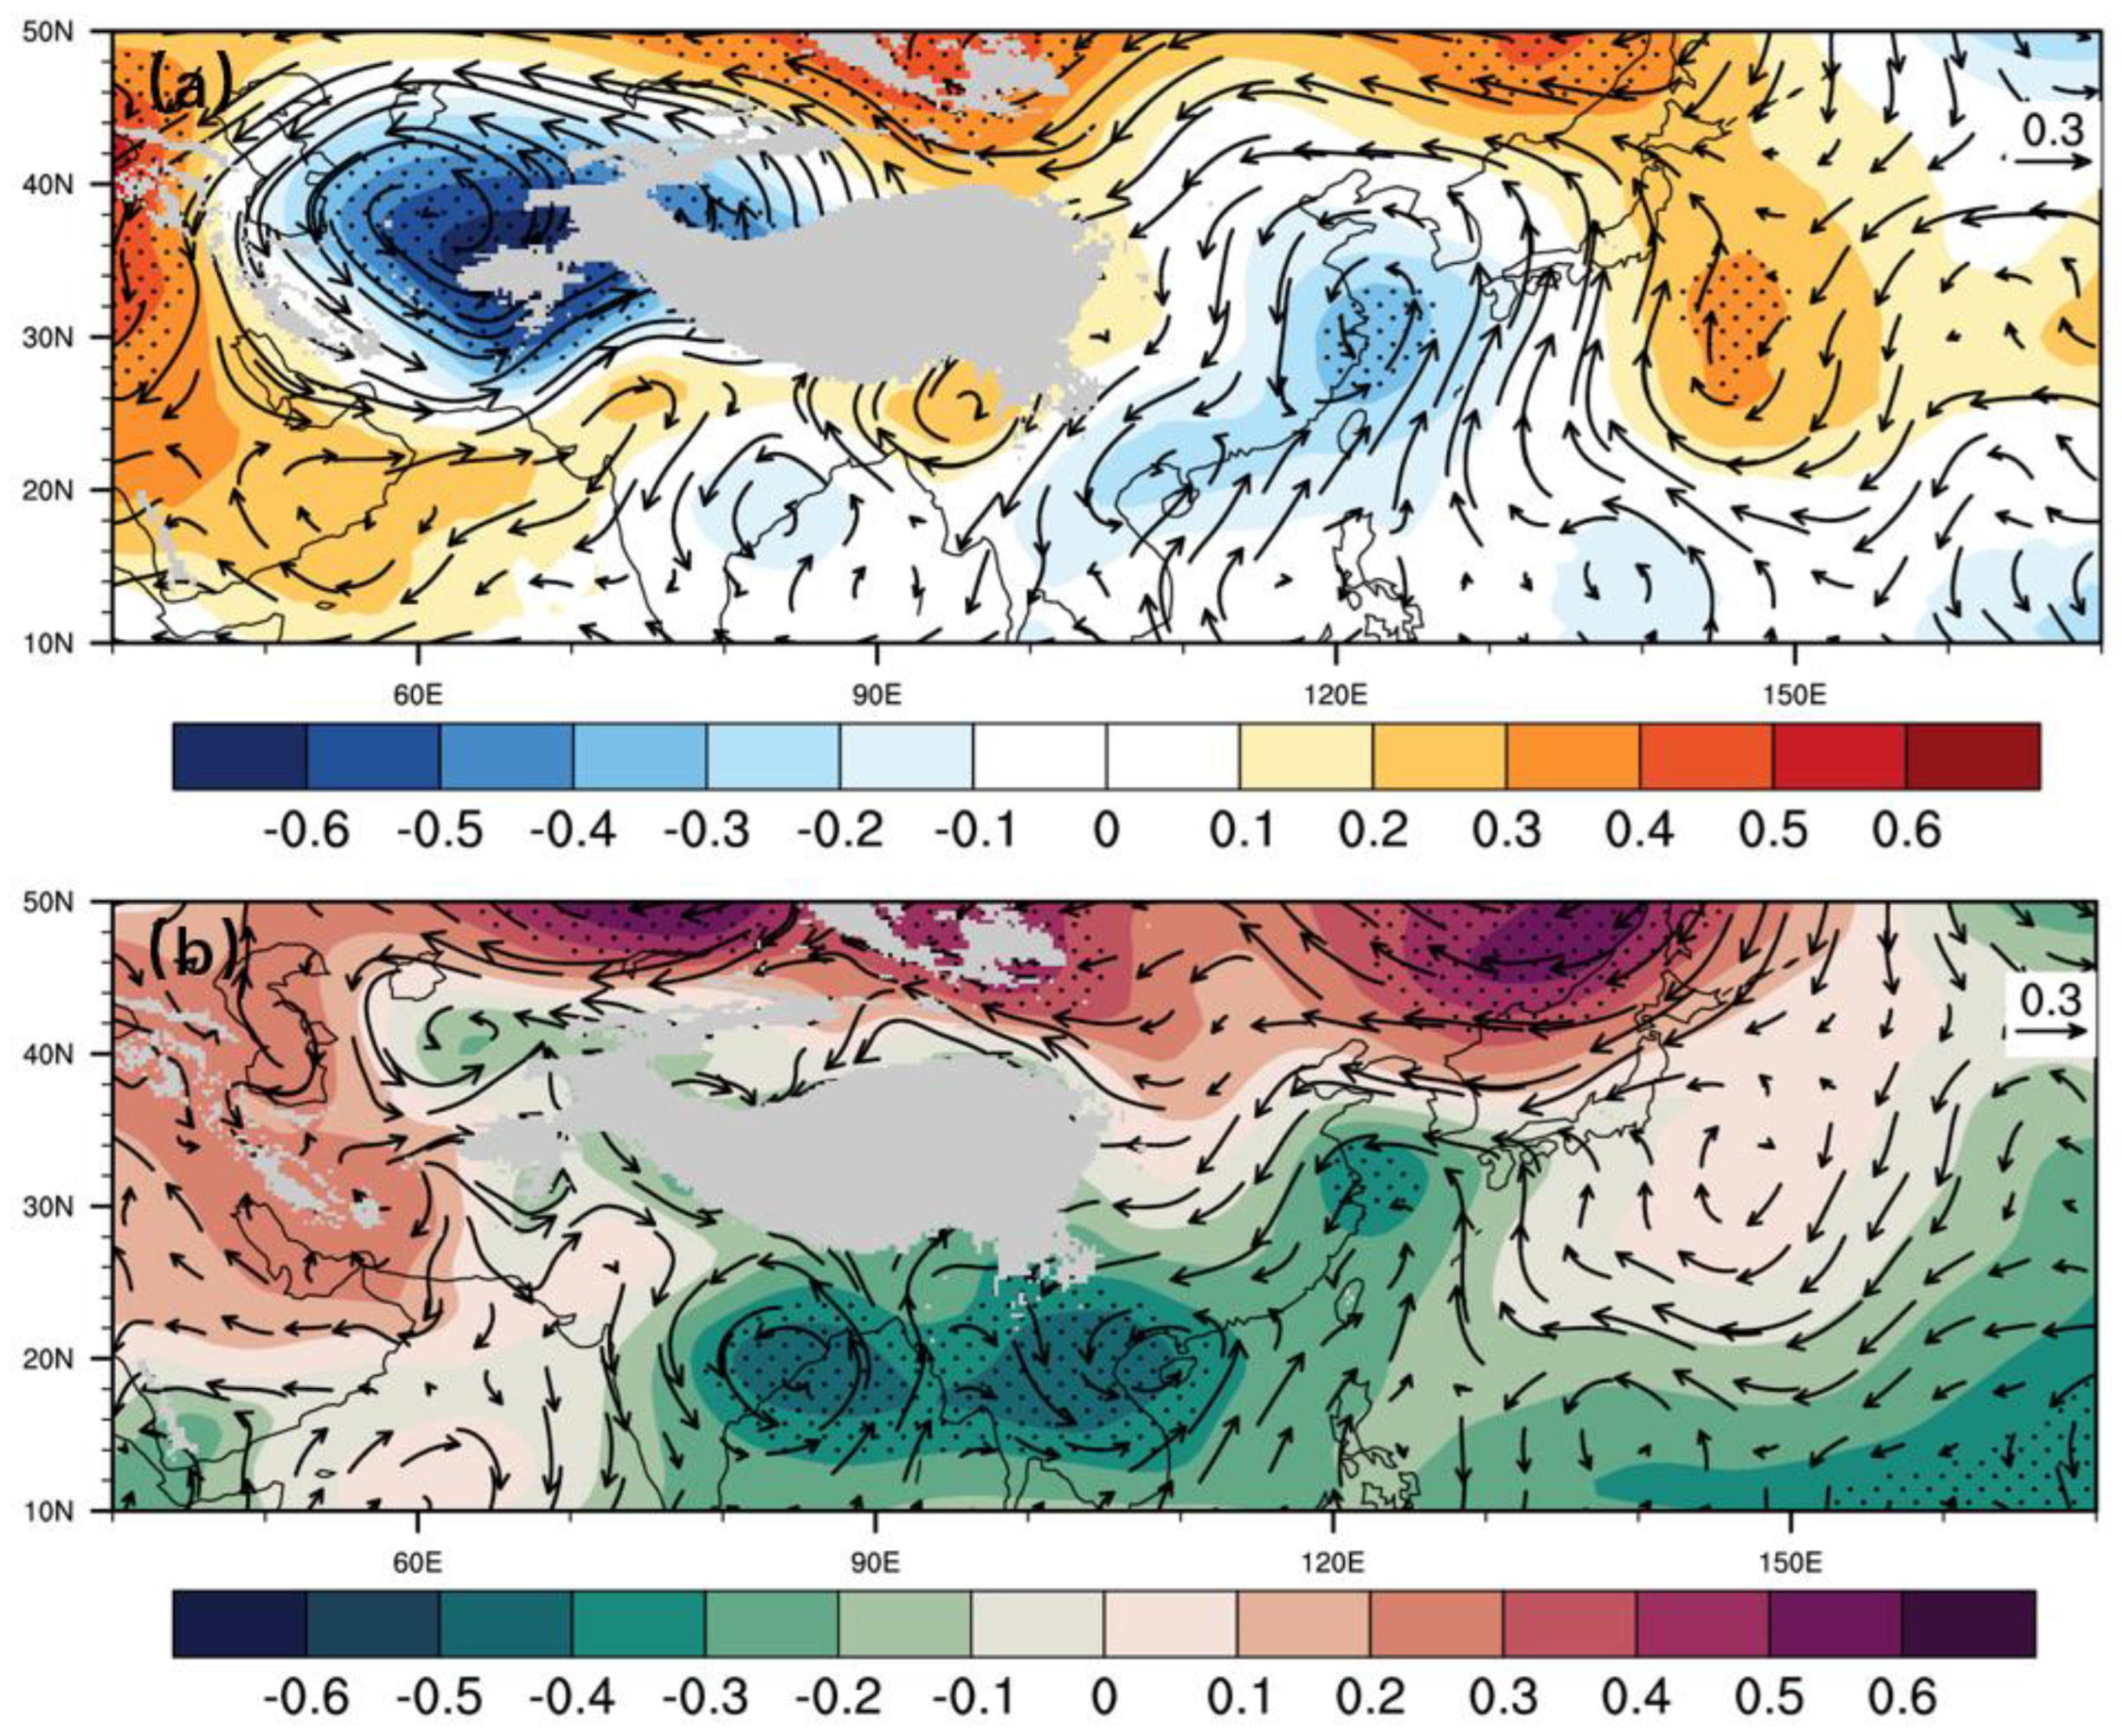
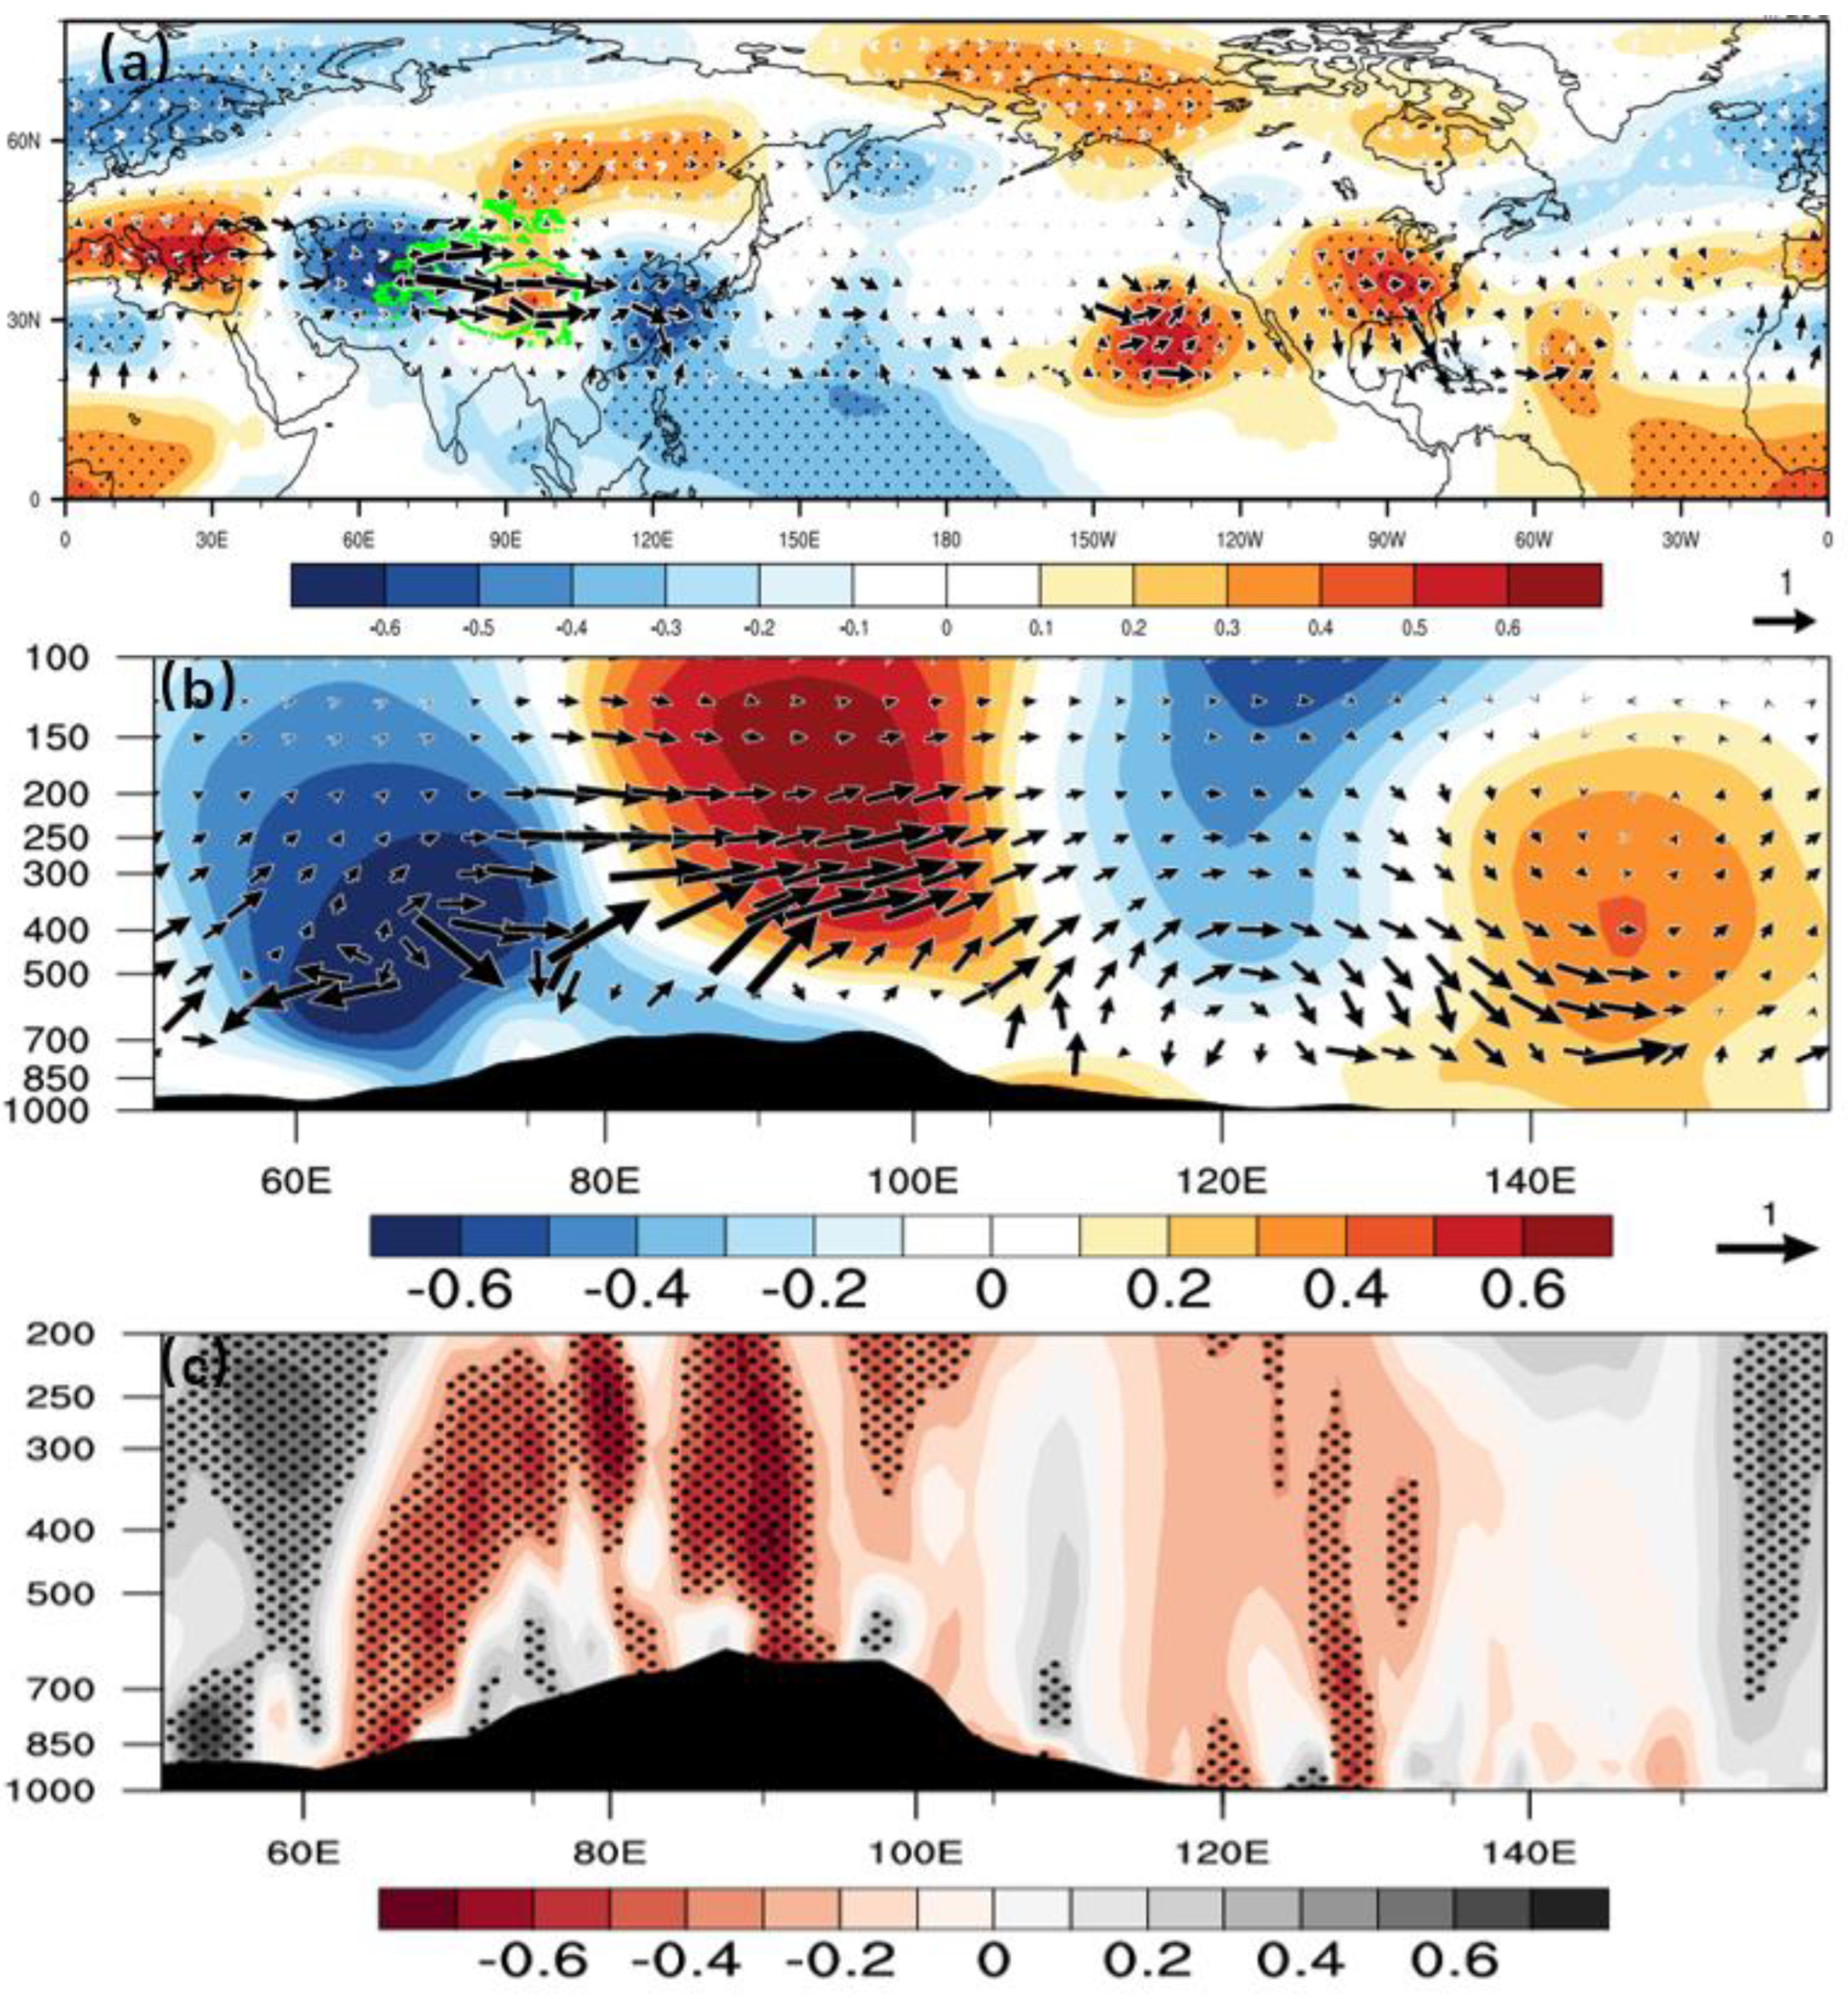
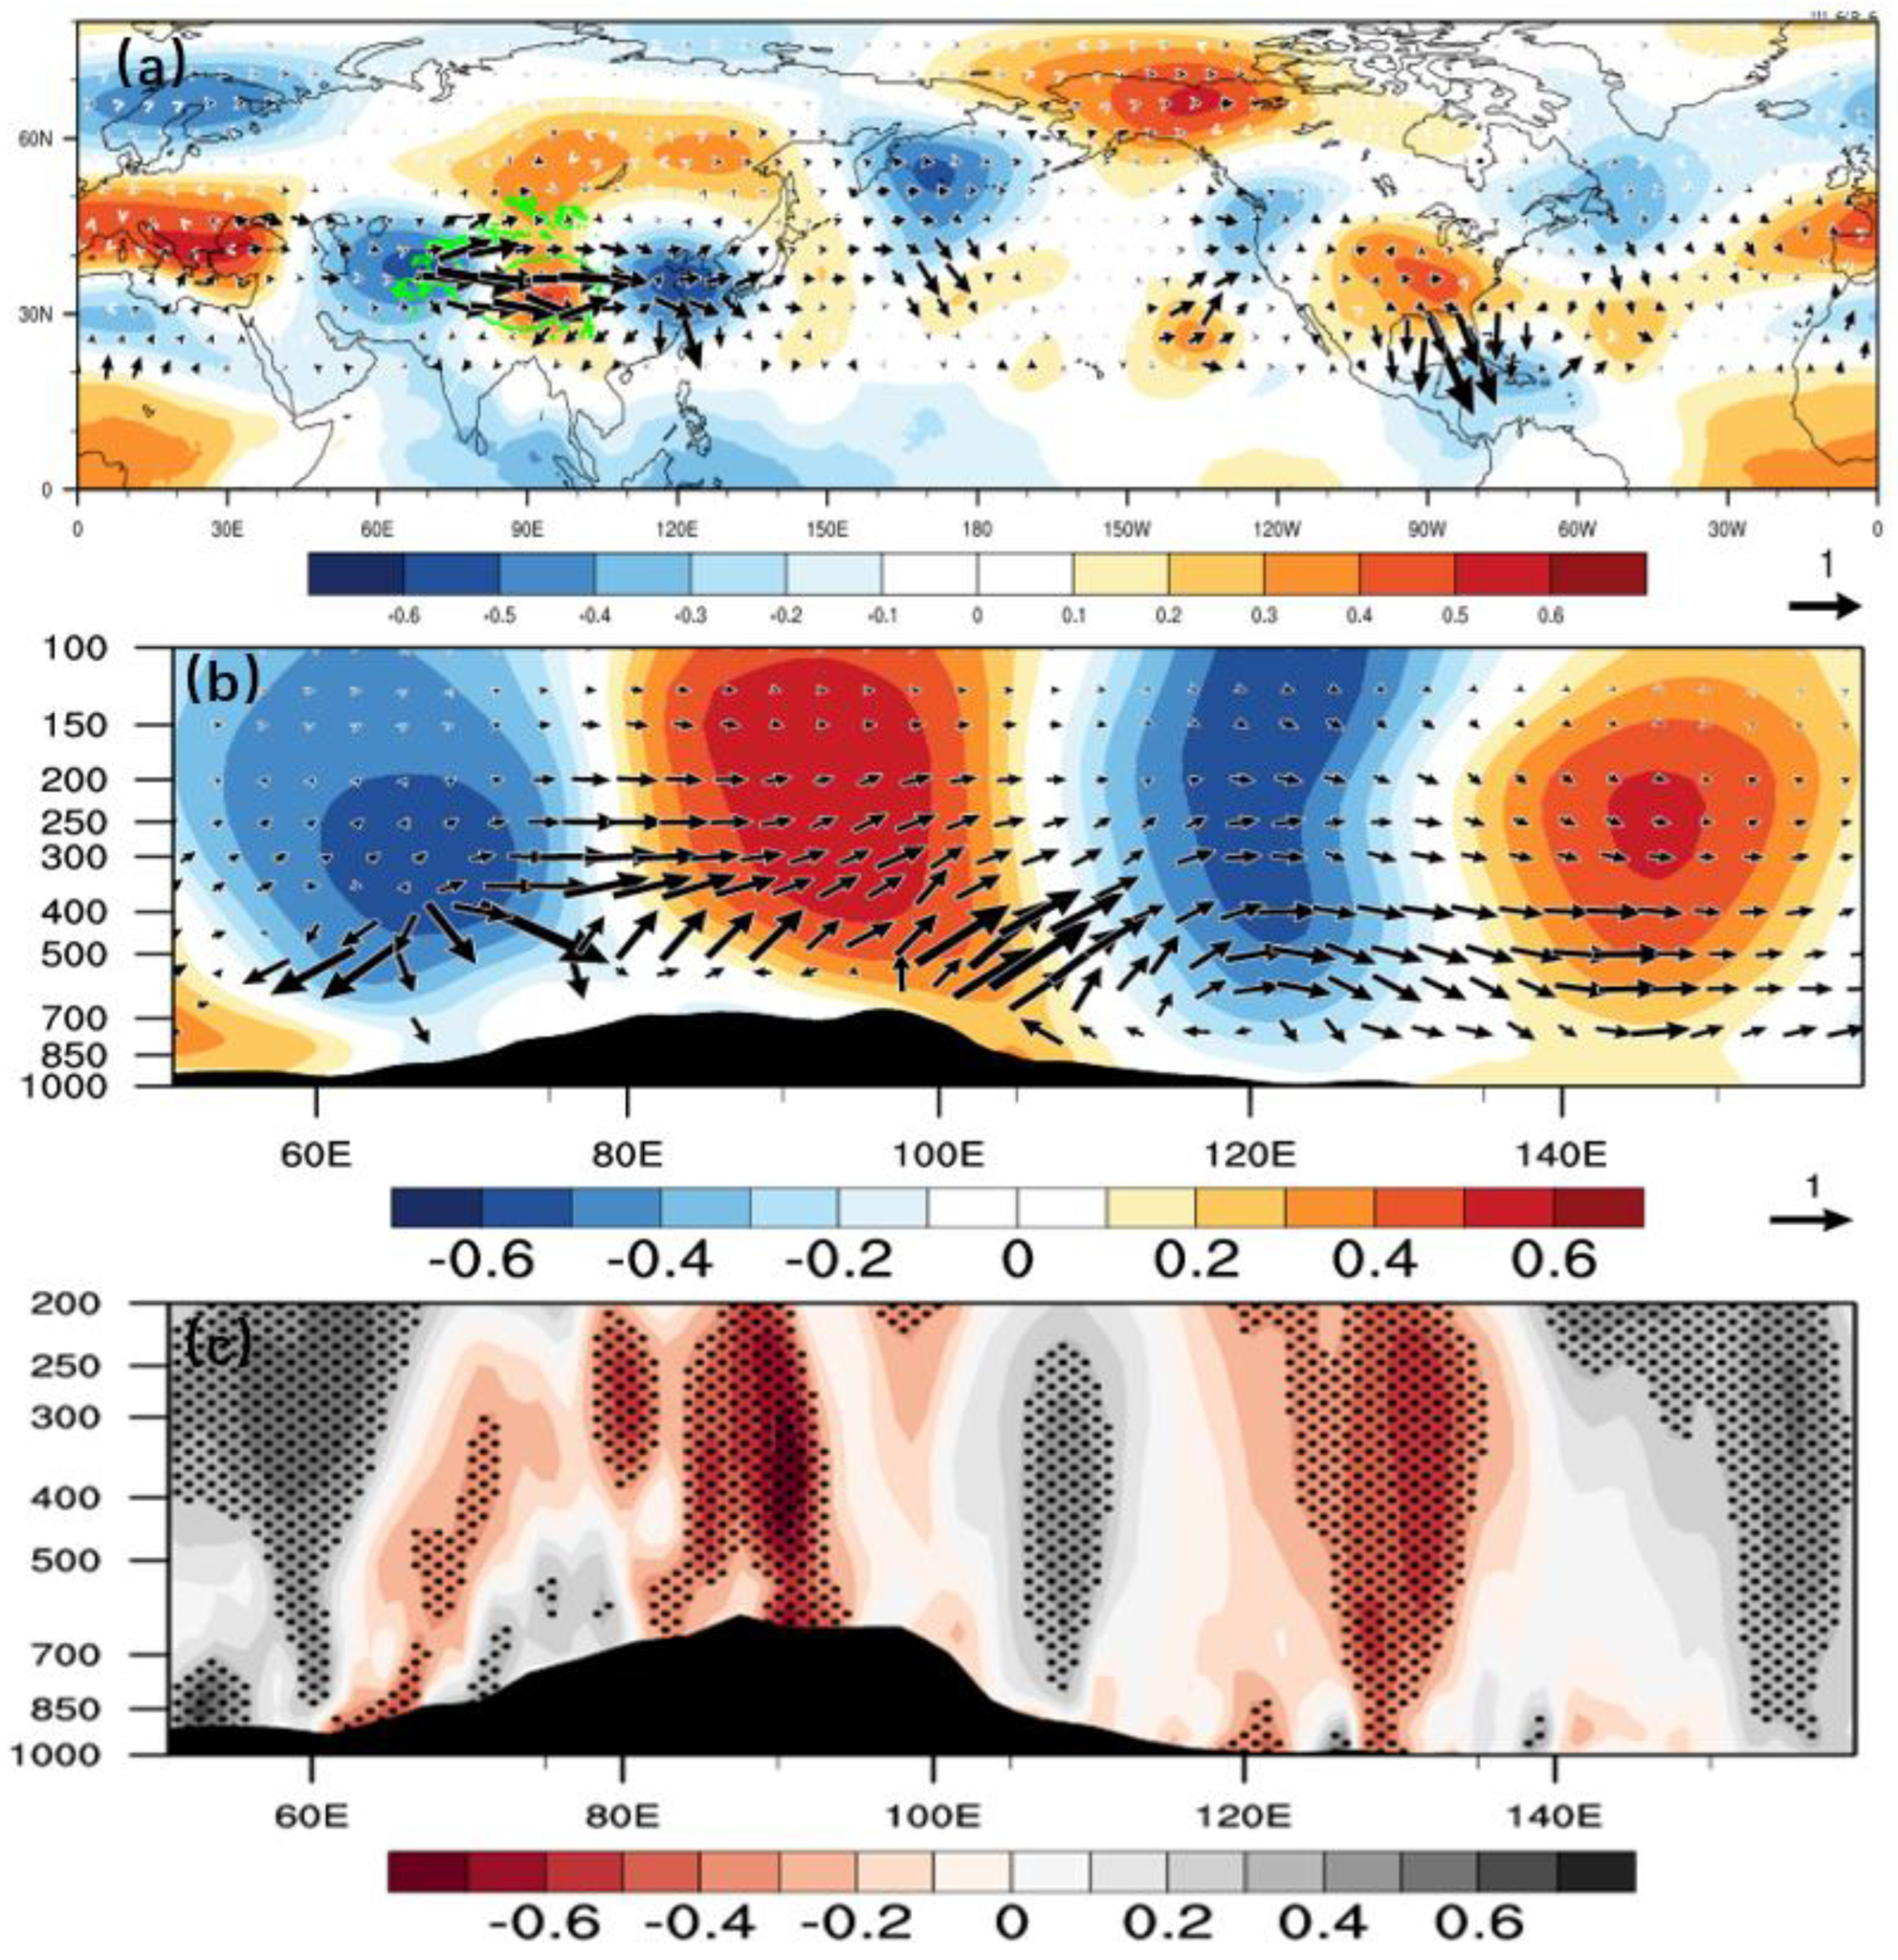
The interdecadal TP-RWS has a great climate effect on the atmospheric circulation and precipitation pattern in Huang-huai River Basin, South Korea, and Japan Island. The enhanced TP-RWS can excite an anomalous wave active flux originating from the northwestern TP and propagating eastward along the westerly jet to East Asia and the Northwest Pacific. The TP-RWS teleconnection exhibits an alternatively positive and negative pattern of geopotential height anomalies from the northwestern TP to the North Pacific, which has an equivalent barotropic structure at vertical profile. Under the guidance of the anomalous cyclonic circulation in East Asia, the prevailing southerly and easterly winds over the West Pacific and Huang-huai River Basin are conducive to the water vapor convergence and precipitation anomaly.

5. Discussion

By calculating the components of RWS equation and the three-dimensional T-N wave flux, we analyze the causes of TP-RWS and discuss the influence of TP-RWS on the precipitation and atmospheric circulation pattern in East Asia on an interdecadal timescale. The above conclusions are of great significance for further understanding the variabilities and maintenance mechanisms of Rossby wave sources in the NH summer. Considering that the linear detrending may not fully remove the influence of external forcing, the variations in TP-RWS are also modulated by a variety of external forcing factors. While the tropical cumulus convection and heavy rainfall also play a role in the formation of the steady vortex source and the RWS energy propagation during boreal summer. How the interdecadal variations in sea surface temperature in the three oceans will affect the TP-RWS and how the corresponding physical mechanism is are questions worth studying. We will use numerical models to further explore this issue in future work. Due to the limited space, this paper does not elaborate too much.

Author Contributions

Formal analysis, X.S. and Y.D.; data curation, X.S. and Q.L.; writing—original draft preparation, X.S.; writing—review and editing, X.S., Y.D., Q.L. and Y.S.; supervision, Y.D. and Y.S. All authors have read and agreed to the published version of the manuscript.

Funding

This work was funded by the Strategic Priority Research Program of the Chinese Academy of Sciences (XDA20100304), the Second Tibetan Plateau Scientific Expedition and Research Program of China (2019QZKK0208), the National Key Research and Development Program of China (2022YFE0136000), the National Natural Science Foundation of China (U2242207, 41965005, 41790471), the Natural Science Foundation of Anhui Province of China (2208085UQ08), and the Innovative Development Special Project of China Meteorological Administration (CXFZ2022J039).

Institutional Review Board Statement

Not applicable.

Informed Consent Statement

Not applicable.

Data Availability Statement

The ERA-20C data can be downloaded from the website https://www.ecmwf.int/en/forecasts/datasets/reanalysis-datasets/era-20c (accessed on 1 January 2022). The NCEP-20C data can be downloaded from the website https://www.psl.noaa.gov/data/gridded/data.20thC_ReanV3.html (accessed on 1 January 2022).

Conflicts of Interest

The authors declare no conflict of interest.

References

  1. Rossby, C.G. Relation between variations in the intensity of the zonal circulation of the atmosphere and the displacements of the semi-permanent centers of action. J. Mar. Res. 1939, 2, 38–55. [Google Scholar] [CrossRef]
  2. Shimizu, M.H.; Cavalcanti, I. Variability patterns of Rossby wave source. Clim. Dyn. 2011, 37, 441–454. [Google Scholar] [CrossRef]
  3. Hoskins, B.J.; Karoly, D.J. The steady linear response of a spherical atmosphere to thermal and orographical forcing. J. Atmos. Sci. 1981, 38, 1179–1196. [Google Scholar] [CrossRef]
  4. Sardeshmukh, P.D.; Hoskins, B.J. The generation of global rotational flow by steady idealized tropical divergence. J. Atmos. Sci. 1988, 45, 1228–1251. [Google Scholar] [CrossRef]
  5. Geng, Q.; Chen, S. Vorticity Source by Stationary Divergent Wind and Energy Propagation of Stationary Waves. Chin. J. Atmos. Sci. 1996, 20, 298–305. [Google Scholar]
  6. James, I.N. Introduction to Circulating Atmospheres; Cambridge University Press: Cambridge, UK, 1994. [Google Scholar]
  7. Ye, D.Z.; Zhu, B.Z. Some Basic Problems of Atmospheric Circulation; Science Press: Beijing, China, 1958. [Google Scholar]
  8. Sardeshmukh, P.D.; Hoskins, B.J. Vorticity balances in the tropics during the 1982-83 El Niño-Southern Oscillation event. Quart. J. Roy. Meteor. Soc. 1985, 111, 261–278. [Google Scholar] [CrossRef]
  9. Lu, R.Y.; Baek-Jo, K.I.M. The Climatological Rossby Wave Source over the STCZs in the Summer Northern Hemisphere. J. Meteorol. Soc. Japan. Ser. II 2004, 82, 2, 657–669. [Google Scholar] [CrossRef] [Green Version]
  10. Plumb, R.A. On The three-dimensional propagation of stationary waves. J. Atmos. Sci 1985, 42, 217–229. [Google Scholar] [CrossRef]
  11. Yeh, T.C. On energy dispersion in the atmosphere. J. Atmos. Sci. 2010, 6, 1–16. [Google Scholar] [CrossRef]
  12. Tao, S.Y.; Wei, J.; Liang, F.; Zhang, X.L. Analysis of High Impact Weather Induced by the Downstream Effect of Rossby Waves. Meteor Mon. 2010, 36, 81–93. [Google Scholar]
  13. Xu, J.P.; Wang, W.; Cai, X.J.; Xu, Z.L.; Xu, J.X. A comparison of the Rossby wave activities and circulation features of the drought in winter-spring of 2011 and in summer of 2013 over mid-lower reaches of the Yangtze river basin. J. Trop. Meteorol. 2017, 33, 992–999. [Google Scholar]
  14. Wang, X.W.; Li, Y.; Zhou, B. An Applied Research About Spread Effects of Rossby Wave in Medium Range Forecast on Heavy Rain During Meiyu Flood Period. Meteor. Mon. 2012, 38, 1070–1077. [Google Scholar]
  15. Sun, X.; Ding, Q.; Wang, S.Y.S.; Topál, D.; Li, Q.; Castro, C.; Teng, H.; Luo, R.; Ding, Y. Enhanced jet stream waviness induced by suppressed tropical Pacific convection during boreal summer. Nat. Commun. 2022, 13, 1288. [Google Scholar] [CrossRef] [PubMed]
  16. Li, M.; Guan, Z.; Mei, S. Interannual and Interdecadal Variations of Summer Rainfall Duration over the Middle and Lower Reaches of the Yangtze River in Association with Anomalous Circulation and Rossby Wave Activities. Chin. J. Atmos. Sci. 2016, 40, 1199–1214. [Google Scholar]
  17. Yang, N.; Jin, R.; Xiao, T.; Sun, X. Propagation of Rossby Wave Along Asian Subtropical Westerly Jet in Summer and Its Impact on Anomaly of Precipitation in China. Meteor. Mon. 2020, 46, 1–14. [Google Scholar]
  18. Duan, A.M.; Li, F.; Wang, M.R.; Wu, G. Persistent weakening trend in the spring sensible heat source over the Tibetan Plateau and its impact on the Asian summer monsoon. J. Clim. 2011, 24, 5671–5682. [Google Scholar] [CrossRef] [Green Version]
  19. Wu, G.X.; Liu, Y.M.; He, B.; Bao, Q.; Duan, A.; Jin, F.F. Thermal controls on the Asian summer monsoon. Sci. Rep. 2012, 2, 404. [Google Scholar] [CrossRef] [PubMed] [Green Version]
  20. Xu, X.D.; Lu, C.G.; Ding, Y.H.; Shi, X.; Guo, Y.; Zhu, W. What is the relationship between China summer precipitation and the change of apparent heat source over the Tibetan Plateau? Atmos. Sci. Lett. 2013, 14. [Google Scholar] [CrossRef]
  21. Lu, M.M.; Yang, S.; Li, Z.N.; He, B.; He, S.; Wang, Z. Possible effect of the Tibetan Plateau on the ‘upstream’ climate over West Asia, North Africa, South Europe and the North Atlantic. Clim. Dyn. 2018, 51, 1485–1498. [Google Scholar] [CrossRef] [Green Version]
  22. Wu, G.X.; He, B.; Liu, Y.M.; Bao, Q.; Ren, R. Location and variation of the summertime upper-troposphere temperature maximum over South Asia. Clim. Dyn. 2015, 45, 2757–2774. [Google Scholar] [CrossRef] [Green Version]
  23. Sun, R.Z.; Duan, A.M.; Chen, L.L.; Li, Y.; Xie, Z.; Zhao, Y. Interannual variability of the North Pacific mixed layer associated with the spring Tibetan Plateau thermal forcing. J. Clim. 2019, 32, 3109–3130. [Google Scholar] [CrossRef]
  24. Dong, L.; Xu, X.; Zhao, T.; Ren, H. Linkage between moisture transport over the Yangtze River Basin and a critical area of the Tibetan Plateau during the Meiyu. Clim. Dyn. 2019, 53, 2643–2662. [Google Scholar] [CrossRef]
  25. Duan, A.; Wang, M.; Lei, Y.; Cui, Y. Trends in summer rainfall over China associated with the Tibetan Plateau sensible heat source during 1980–2008. J. Clim. 2013, 26, 261–275. [Google Scholar] [CrossRef] [Green Version]
  26. Duan, A.; Wu, G. Role of the Tibetan Plateau thermal forcing in the summer climate patterns over subtropical Asia. Clim. Dyn. 2005, 24, 793–807. [Google Scholar] [CrossRef]
  27. Liu, Y.; Lu, M.; Yang, H.; Duan, A.; He, B.; Yang, S.; Wu, G. Land–atmosphere–ocean coupling associated with the Tibetan Plateau and its climate impacts. Nat. Sci. Rev. 2020, 7, 534–552. [Google Scholar] [CrossRef] [PubMed] [Green Version]
  28. Song, L.; Wu, R.; An, L. Diferent sources of 10- to 30-day intraseasonal variations of autumn snow over western and eastern Tibetan Plateau. Geophy. Res. Lett. 2019, 46, 9118–9125. [Google Scholar] [CrossRef]
  29. Zhao, P.; Zhou, Z.; Liu, J. Variability of Tibetan spring snow and its associations with the hemispheric extratropical circulation and East Asian summer monsoon rainfall: An observational investigation. J. Clim. 2007, 20, 3942–3955. [Google Scholar] [CrossRef]
  30. Wu, R.; Zhao, P.; Liu, G. Change in the contribution of spring snow cover and remote oceans to summer air temperature anomaly over Northeast China around 1990. J. Geophy. Res. Atmos. 2014, 119, 663–676. [Google Scholar] [CrossRef]
  31. Si, D.; Ding, Y. Decadal change in the correlation pattern between the Tibetan Plateau winter snow and the East Asian summer precipitation during 1979–2011. J. Clim. 2013, 26, 7622–7634. [Google Scholar] [CrossRef]
  32. Zhou, X.J.; Zhao, P.; Chen, J.; Chen, L.; Li, W. Impacts of thermodynamic processes over the Tibetan Plateau on the Northern Hemispheric climate. Sci. China Ser. D Earth Sci. 2009, 52, 1679–1693. [Google Scholar] [CrossRef]
  33. Wu, B.; Lin, J.; Zhou, T. Interdecadal circumglobal teleconnection pattern during boreal summer. Atmos. Sci. Lett. 2016, 17, 446–452. [Google Scholar] [CrossRef]
  34. Li, Q.Q.; Zhao, M.C.; Yang, S.; Shen, X.; Dong, L.; Liu, Z. A zonally-oriented teleconnection pattern induced by heating of the western Tibetan Plateau in boreal summer. Clim. Dyn. 2021, 57, 2823–2842. [Google Scholar] [CrossRef]
  35. Poli, P.; Hersbach, H.; Dee, D.P.; Berrisford, P.; Simmons, A.J.; Vitart, F.; Laloyaux, P.; Tan, D.G.; Peubey, C.; Thépaut, J.N.; et al. ERA-20C: An Atmospheric Reanalysis of the Twentieth Century. J. Clim. 2016, 29, 4083–4097. [Google Scholar] [CrossRef]
  36. Compo, G.P.; Whitaker, J.S.; Sardeshmukh, P.D.; Matsui, N.; Allan, R.J.; Yin, X.; Gleason, B.E.; Vose, R.S.; Rutledge, G.; Bessemoulin, P.; et al. The Twentieth Century Reanalysis Project. Q. J. R. Meteorol. Soc. 2011, 137, 1–28. [Google Scholar] [CrossRef] [Green Version]
  37. Xu, G.Q.; Zhu, Q.G. Source or Sink Features of Atmospheric Low Frequency Oscillation over the Tibetan Plateau. Trans Atmos Sci. 2002, 3, 358–365. [Google Scholar]
  38. Yanai, M.; Li, C.F.; Song, Z.S. Seasonal heating of the Tibetan Plateau and its effects on the evolution of the Asian summer monsoon. J. Meteor. Soc. Jpn. 1992, 70, 319–350. [Google Scholar] [CrossRef] [Green Version]
  39. Takaya, K.; Nakamura, H. A formulation of a wave-activity flux for stationary Rossby waves on a zonally varying basic flow. Geophys. Res. Lett. 1997, 24, 2985–2988. [Google Scholar] [CrossRef]
  40. Takaya, K.; Nakamura, H. A formulation of a phase-independent wave-activity flux for stationary and migratory quasigeostrophic eddies on a zonally varying basic flow. J. Atmos. Sci. 2001, 58, 608–627. [Google Scholar] [CrossRef]
  41. Shi, C.H.; Jin, X.; Liu, R.Q. The differences in characteristics and applicability among three types of Rossby wave activity flux in atmospheric dynamics. Trans. Atmos. Sci. 2017, 40, 850–855. [Google Scholar]
  42. Moon, J.Y.; Ha, K.J. Association between tropical convection and boreal wintertime extratropical circulation in 1982/83 and 1988/89. Adv. Atmos. Sci. 2003, 20, 593–603. [Google Scholar] [CrossRef]
  43. Sun, X.T.; Ding, Y.H.; Li, Q.Q. Interdecadal Variation of the Atmospheric Heat Source over the Tibetan Plateau and Surrounding Asian Monsoon Region: Impact on the Northern Hemisphere Summer Circulation. J. Meteor. Res. 2021, 35, 1–20. [Google Scholar] [CrossRef]
  44. Webster., P.J. The Large-Scale Structure of the Tropical Atmosphere, Large-Scale Dynamical Processes in the Atmosphere; Hoskins, B.J., Pearce, E.P., Eds.; Academic Press: London, UK, 1983; pp. 235–273. [Google Scholar]
  45. Kato, K. Seasonal transition of the lower-level circulation systems around the Baiu front in China in 1979 and its relation to the northern summer monsoon. J. Meteor. Soc. Jpn. 1989, 67, 249–265. [Google Scholar] [CrossRef] [Green Version]
  46. Ose, T. Seasonal change of Asian summer monsoon circulation and its heat source. J. Meteor. Soc. Jpn. 1998, 76, 1045–1063. [Google Scholar] [CrossRef] [Green Version]
  47. Yao, T.; Bolch, T.; Chen, D.; Gao, J.; Immerzeel, W.; Piao, S.; Su, F.; Thompson, L.; Wada, Y.; Wang, L.; et al. The imbalance of the Asian water tower. Nat. Rev. Earth Environ. 2022, 3, 618–632. [Google Scholar] [CrossRef]
  48. Zhang, Z.; Sun, X.; Yang, X.Q. Understanding the interdecadal variability of East Asian summer monsoon precipitation: Joint influence of three oceanic signals. J. Clim. 2018, 31, 5485–5506. [Google Scholar] [CrossRef]
  49. Cane, M. A moist model monsoon. Nature 2010, 463, 163–164. [Google Scholar] [CrossRef] [PubMed]
  50. Wu, G.; Duanm, A.; Lium, Y.; Mao, J.; Ren, R.; Bao, Q.; He, B.; Liu, B.; Hu, W. Tibetan Plateau climate dynamics: Recent research progress and outlook. Natl. Sci. Rev. 2014, 2, 100–116. [Google Scholar] [CrossRef] [Green Version]
  51. Zhao, H.; Moore, G.W.K. On the relationship between Tibetan snow cover, the Tibetan plateau monsoon and the Indian summer monsoon, Geophys. Res. Lett. 2004, 31, L14204. [Google Scholar] [CrossRef]
  52. Zhang, C.; Guo, Y.; Wen, Z. Interdecadal change in the effect of Tibetan Plateau snow cover on spring precipitation over Eastern China around the early 1990s. Clim Dyn. 2022, 58, 2807–2824. [Google Scholar] [CrossRef]
  53. Sutton, R.T.; Hodson, D.L.R. Atlantic Ocean forcing of North American and European summer climate. Science 2005, 309, 115–118. [Google Scholar] [CrossRef] [PubMed] [Green Version]
  54. Knight, J.R.; Folland, C.K.; Scaife, A.A. Climate impacts of the Atlantic multidecadal oscillation. Geophys. Res. Lett. 2006, 33, L17706. [Google Scholar] [CrossRef] [Green Version]
  55. Wang, Y.; Li, S.; Luo, D. Seasonal response of Asian monsoonal climate to the Atlantic multidecadal oscillation. J. Geophys. Res. 2009, 114, D02112. [Google Scholar] [CrossRef]
  56. Miao, J.; Jiang, D. Multidecadal variations in the East Asian winter monsoon and their relationship with the Atlantic Multidecadal Oscillation since 1850. J. Clim. 2021, 34, 7525–7539. [Google Scholar] [CrossRef]
  57. Zhang, P.; Duan, A.; Hu, J. Combined effect of the tropical Indian Ocean and tropical North Atlantic sea surface temperature anomaly on the Tibetan Plateau precipitation anomaly in late summer. J. Clim. 2022, 35, 3899–3918. [Google Scholar] [CrossRef]
  58. Wang, L.; Yu, J.-Y.; Paek, H. Enhanced biennial variability in the Pacific due to Atlantic capacitor effect. Nat. Commun. 2017, 8, 1–7. [Google Scholar] [CrossRef] [PubMed] [Green Version]
Figure 1. Distribution of global (a) Rossby wave source (shading; unit: 10−10 s−2) and divergent wind component (vectors; unit: m·s−1), and (b) precipitation (unit: mm·day−1) in June−August of 1900−2010. The green contours in (a,b) represent the 2.5km topography height of the Tibetan Plateau.
Atmosphere 14 00541 g001
Figure 2. Spatial distribution of the RWS variance (unit: 10−10 s−4) during boreal summer of 1900–2010 (a) on an interannual timescale and (b) on an interdecadal timescale (black box indicates the key area of the RWS variance 65–90° E, 30–45° N).
Atmosphere 14 00541 g002
Figure 3. The standardized time series of Rossby wave source over the TP (*−1; dotted lines) and its 10−year low−pass filtering value (solid lines) in summer of 1900−2010. The red and black lines are results from the ERA−20C and NCEP−20C reanalysis datasets, respectively. The RWS*−1 represents the intensity of negative Rossby wave source over the TP.
Atmosphere 14 00541 g003
Figure 4. Regression coefficients between interdecadal TP−RWS series (the same as Figure 3) and the RWS (shading) and divergent wind component (vectors; unit: m·s−1) derived from ERA−20C during 1900−2010. The cross−hatched areas indicate coefficients above the 95% confidence level.
Atmosphere 14 00541 g004
Figure 5. (a) Spatial correlations between interdecadal TP−RWS series (the same as Figure 3) and the atmospheric heat source (Q1) derived from ERA−20C during 1900−2010. (b) Vertical profile of correlation coefficients between the TP−RWS and the Q1 over northwestern TP (red solid line) and the Q1 over southeastern TP (blue solid line). The cross−hatched areas indicate coefficients above the 95% confidence level. The black rectangles in (a) denote the northwestern and southeastern TP.
Atmosphere 14 00541 g005
Figure 6. The standardized interannual and interdecadal time series of TP−RWS components (*−1; red lines) and the Q1 over the northwestern and southeastern TP (black lines) in summer of 1900−2010. (a) The vortex stretching term RWS−S1 and the northwestern TP−Q1 (60–80° E, 32–45° N), (b) the absolute vorticity advection term RWS−S2 and the southeastern TP-Q1 (80–105° E, 27–35° N).
Atmosphere 14 00541 g006
Figure 7. The correlation coefficients between interdecadal TPRWS−S1 series (the same as Figure 6a) and (a) the RWS (shading) and divergent wind component (vectors), (b) the divergence (shading) and absolute vorticity (contours) at 200 hPa, (c) snow albedo, (d) surface sensible heat flux derived from ERA−20C during 1900−2010. The cross-hatched areas indicate coefficients above the 95% confidence level. The black rectangles represent the northwestern TP.
Atmosphere 14 00541 g007
Figure 8. The correlation coefficients between interdecadal TPRWS−S2 series (the same as Figure 6b) and (a) the RWS, (b) divergent wind component (vectors) and absolute vorticity gradient (shading) at 200 hPa, (c) precipitation, (d) total cloud cover derived from ERA−20C during 1900−2010. The cross-hatched areas indicate coefficients above the 95% confidence level. The black rectangles represent the southeastern TP.
Atmosphere 14 00541 g008
Figure 9. The correlation coefficients between interdecadal TP−RWS (same as Figure 3) and global terrestrial precipitation. The interdecadal TP−RWS in (a,c) and (b,d) are from ERA−20CR and NCEP−20C, respectively. The precipitation data in (a,b) and (c,d) are from CRU_ts4 and GPCC, respectively. The cross−hatched areas indicate coefficients above the 95% confidence level. Black boxes indicate the key areas of interdecadal precipitation.
Atmosphere 14 00541 g009
Figure 10. The correlation coefficients between interdecadal TP-RWS (same as Figure 3) and (a) geopotential height (shading) and water vapor transport flux (vectors) at 600 hPa, (b) stream function (shading) and horizontal wind field (vectors) at 850 hPa from 1900 to 2010. The cross−hatched areas indicate coefficients above the 95% confidence level.
Atmosphere 14 00541 g010
Figure 11. (a) The correlation coefficients between interdecadal TP−RWS (same as Figure 3) and the geopotential height (shading) and T−N wave flux (vectors) at 200 hPa. Vertical profiles of correlation coefficients between interdecadal TP-RWS and (b) the geopotential height and T−N wave flux, (c) the vertical velocity averaged along 28−45° N from 1900 to 2010. The cross-hatched areas indicate coefficients above the 95% confidence level.
Atmosphere 14 00541 g011
Figure 12. (a) Partial correlation coefficients between interdecadal TP−RWS (same as Figure 3) and the geopotential height (shading) and T−N wave flux (vectors) at 200 hPa (remove interdecadal AMO). Vertical profiles of partial correlation coefficients between interdecadal TP−RWS and (b) the geopotential height and T−N wave flux, (c) the vertical velocity averaged along 28−45° N from 1900 to 2010. The cross−hatched areas indicate coefficients above the 95% confidence level.
Atmosphere 14 00541 g012
Disclaimer/Publisher’s Note: The statements, opinions and data contained in all publications are solely those of the individual author(s) and contributor(s) and not of MDPI and/or the editor(s). MDPI and/or the editor(s) disclaim responsibility for any injury to people or property resulting from any ideas, methods, instructions or products referred to in the content.

