Article

Study on the Speciation of VOCs at Oil Refining Plant Fenceline through Active Sampling

1
Environmental Research Complex, National Institute of Environmental Research, Hwangyeong-ro 42, Seo-gu, Incheon 22689, Republic of Korea
2
Department of Health Science, Korea University, Anam-ro 145, Seongbuk-gu, Seoul 02841, Republic of Korea
*
Author to whom correspondence should be addressed.
These authors contributed equally to this work.
Atmosphere 2023, 14(3), 485; https://doi.org/10.3390/atmos14030485
Submission received: 31 January 2023 / Revised: 18 February 2023 / Accepted: 27 February 2023 / Published: 28 February 2023
(This article belongs to the Special Issue Characteristics and Formation of Secondary Organic Aerosols)

Abstract

:
The petroleum refining industry emits various volatile organic compounds (VOCs), including high-volatility benzene, which can have a significant impact on the local community. To address this issue, the US Environmental Protection Agency (EPA) has implemented a fenceline monitoring system to ensure that benzene concentrations at the fenceline do not exceed 9 μg/m3. However, there are various types of VOCs, and some with high potential atmospheric oxidation (POCP) values, that may cause secondary air pollution. This study found that both study sites exceeded the action level of benzene (9 μg/m3), and the locations where the level was exceeded were close to the crude distillation unit (CDU) (max concentration 34.07 μg/m3). Additionally, a significant amount of xylene with a high POCP was also released. The xylene emission rate of study site A was 27.71%, and the xylene emission rate of study site B was 46.75%. Therefore, it is necessary to reduce both high-volatility benzene and high-POCP xylene. In various industries that use organic solvents, it is important to prioritize VOCs for continuous measurement and analysis and to establish reduction strategies.

1. Introduction

Effective management of VOCs in the air requires the establishment of an emission source inventory and the development of corresponding emission factors or periodic measurements. However, the development of emission factors is still underway, and measurements are rarely performed.
Studies are being conducted globally, including by the US Environmental Protection Agency and the EU’s CORINAIR (Coordination of Information on the Environment), but ensuring the accuracy and reliability of the results remains challenging [1].
VOCs (volatile organic compounds) is a collective term for numerous compounds with very diverse sources. VOCs refer to carbon compounds, excluding carbon monoxide, nitrogen oxides, carbonyls, metal carbonyls, and carbamates, which are involved in photochemical reactions in the air [2].
Many policies are being implemented globally to reduce VOCs. In the US, the Clean Air Act (CAA) was revised in 1977, and it began to limit the emissions of large-scale sources that emit over 100 tons of VOCs annually. In 1990, the CAA was revised to further regulate and strengthen the regulation of mobile sources of pollution and to categorize regions into five levels to reduce ozone nonattainment regions [3]. In addition, the state government requires the submission of a ‘State Implementation Plan’ based on VOC reduction measures to ensure compliance with federal air quality standards for at least 10 years [4].
As a result, states and local governments are establishing state and local regulations based on federal laws, considering local pollution characteristics. In conclusion, the United States is gradually strengthening VOC regulations and expanding their scope, with both federal and state governments setting consistent VOC reduction targets.
In the EU, efforts have been made to reduce the overall VOC emissions throughout Europe by passing the EU law on VOC emission control from storage, shipment, and sales facilities in 1994. Furthermore, separate VOC management plans are being operated at the national level to reduce VOC emissions from each facility [5].
In the Republic of Korea, the Chemical Substance Management Act currently requires the establishment of emission reduction plans. There are 415 target substances for emission reduction, divided into groups 1, 2, and 3, and most of the substances under investigation for emission are VOCs [6].
However, VOCs emitted from the workplace are not measured and analyzed and are regulated as total VOCs under the domestic air environment preservation law. At the same time, in the emission reduction plan of the Chemical Substance Management Law, they are submitted as individual chemical substances, causing disparity between the two regulations.
VOCs and NOx in the air act as precursors to the formation of ozone, oxidants (aldehydes, ketones), etc., due to ultraviolet and photochemical reactions.
Therefore, NOx is mainly reduced through acid deposition policies in most countries, and the reduction plan for photochemical products such as ozone is focused on reducing VOCs. However, it is known that the choice of pollution to reduce depends on the objective, and reducing VOCs should be promoted concurrently with policies for reducing NOx [7].
There are various types of VOCs. The extent to which they participate in photochemical reactions in the air and cause ozone pollution is referred to as photochemical ozone creation potential (POCP). The extent of photochemical reactivity in the air is generally expressed as POCP using ethylene as a reference material (POCP = 100). 1,2,4-Trimethylbenzene and acrolein have the highest POCP values of 120, and, generally, alkenes and aromatic hydrocarbons have high POCP values [8].
On the other hand, hydrocarbon gases such as methane and chlorofluorocarbons have low POCP values, meaning they cause less photochemical smog than alkenes and aromatic hydrocarbons. Unlike other VOCs, benzaldehyde reduces nitrogen oxides in the air by participating in reactions that generate peroxybenzoyl nitrate, thus inhibiting ozone formation and having a POCP value of −35. Methane and hydrocarbon gases such as chlorofluorocarbons also have low POCP values [9].
VOCs have various characteristics, and there is a large difference in their ability to cause secondary pollution. Therefore, it is important to analyze the VOCs emitted from each facility by analyzing which substances are present [10].
This is because not all VOCs can be reduced, so prioritizing is important. Therefore, it is necessary to identify the chemicals with high emission rates and those that affect ozone generation by industry and to establish reduction measures [11].
The petroleum refining industry generates many VOCs. Substances such as benzene are highly toxic and carcinogenic. There is also a study that shows that residents living near industrial complexes where many petroleum refineries are located have a high cancer rate [12].
Therefore, in this study, we chose the oil refining industry, which is expected to emit a large amount of VOCs due to the use of large amounts of organic solvents and the large-scale facilities involved, and measured VOCs at the fenceline. Through this, we aim to identify the VOCs that need to be reduced first and to study their importance.

2. Materials and Methods

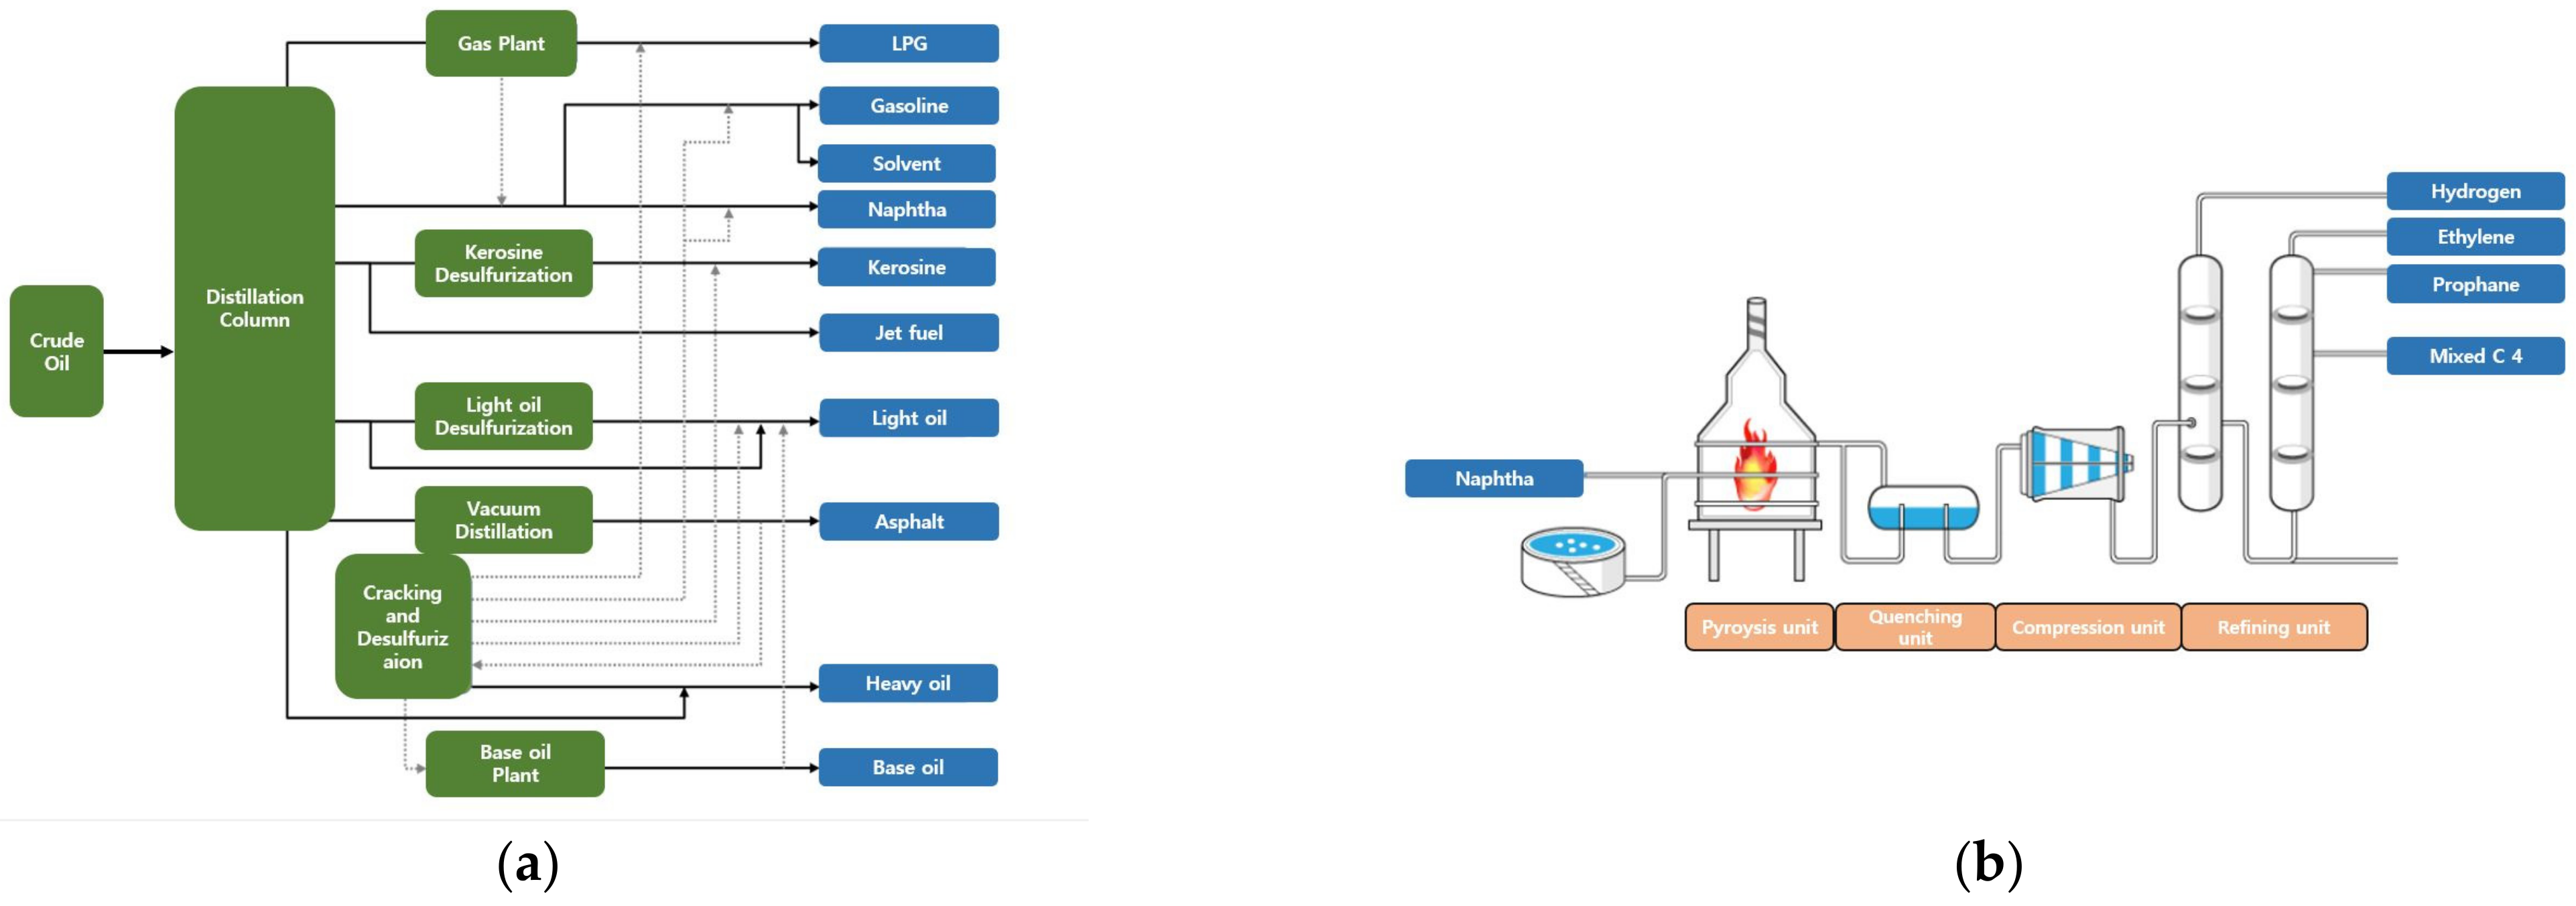
2.1. Understanding the Petroleum Refining Process

The petroleum refining process involves separating crude oil into intermediate products based on boiling point differences and then using further separation processes or catalysts to convert the intermediate products into petroleum chemical products, which can be easily used in transportation fuels and general consumer goods. Typically, petroleum refining and petroleum chemical processes are operated together. This is because crude oil is used as a raw material to produce high-processing products, such as synthetic fibers and synthetic resins, and also because it produces light and heavy hydrocarbon products, which can be used as basic fuels [13].
The oil refining process is divided into the CDU (atmospheric distillation unit), HDS (hydrodesulfurization unit), SRU (sulfur recovery), RFCC (residue fluid catalytic cracking unit), VDU (vacuum distillation unit), and HCR (hydrocracking unit) processes. Each process produces various products, from LPG to gasoline, naphtha, kerosene, and heavy oil.
The oil chemical process is divided into the BTX process, which produces benzene, toluene, and xylene; the olefin process, which produces olefin hydrocarbons; and the polymer production process, which produces polymers such as polypropylene (Figure 1) [14].

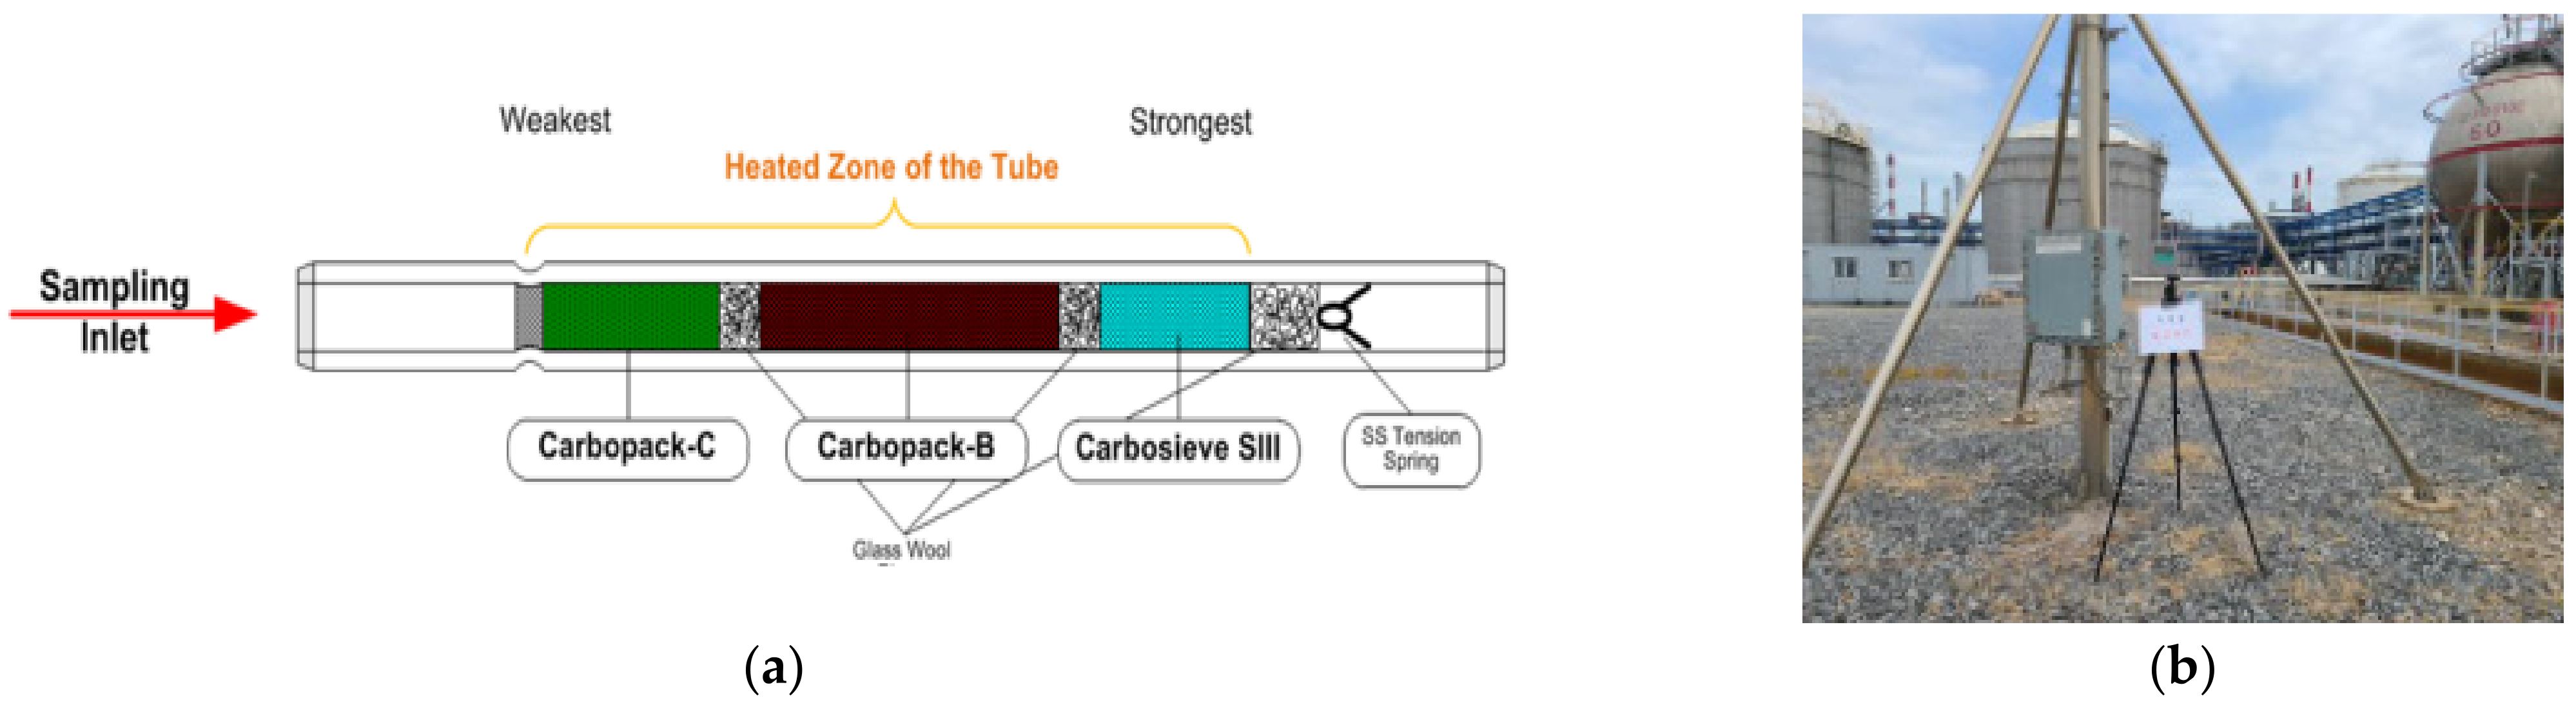
2.2. Sample Collection Method

In this study, we applied an active technique from 1 of the 6 techniques utilized in the EPA’s fenceline monitoring guidelines.
The monitoring method for the target facility was sampled using the passive method according to EPA Method 325A (Volatile organic compounds from fugitive and area sources—Sampler deployment and VOC sample collection). The EPA presents 6 methods for sample collection (Table 1).
The sample collection sorbent trap was loaded with Carbopack C + Carbopack B + Carbosieve SIII in accordance with the EPA Method TO-17 guidelines for sorbent selection, using Carbotrap 300 (1/4 in. × 3 1/2 in., Sigma). The monitoring height was fixed so that the diffusive sampling cap (diffusive sampling cap) of the manual expansion tube could be located 1.5~3 m from the ground by using a pillar or a secure structure (Figure 2) [15].

2.3. Analyzing Target Chemicals

In the direct measurement, a sample suction pump was used to collect 6 L of sample for 60 min with a flow rate of 100 mL/min, twice in the morning and three times in the afternoon for a total of five samplings. The analysis material was the research target, including 57 ozone precursors and 88 HAPs (hazardous air pollutants) that can be analyzed using EPA Methods TO-14 and TO-17 and GC analysis. m-Xylene and p-Xylene, two substances that cannot be separated from each other in GC analysis, were considered one item. The composition and concentration of 87 substances were evaluated at the worksite. The 87 substances are as follows (Table 2 and Table 3):

2.4. Analysis Method

The collected sample from the solid sorbent trap was analyzed using a gas chromatography/mass spectrometer (GC/MS) (Table 4). This method involves charging a certain amount of sorbent material into the trap, thermal desorption of the sample, cryogenic trapping of the desorbed sample, and thermal desorption once again. The separated sample was then analyzed using a high-resolution column for gas chromatography (GC) and measured with a mass spectrometer (MS) (Table 5).

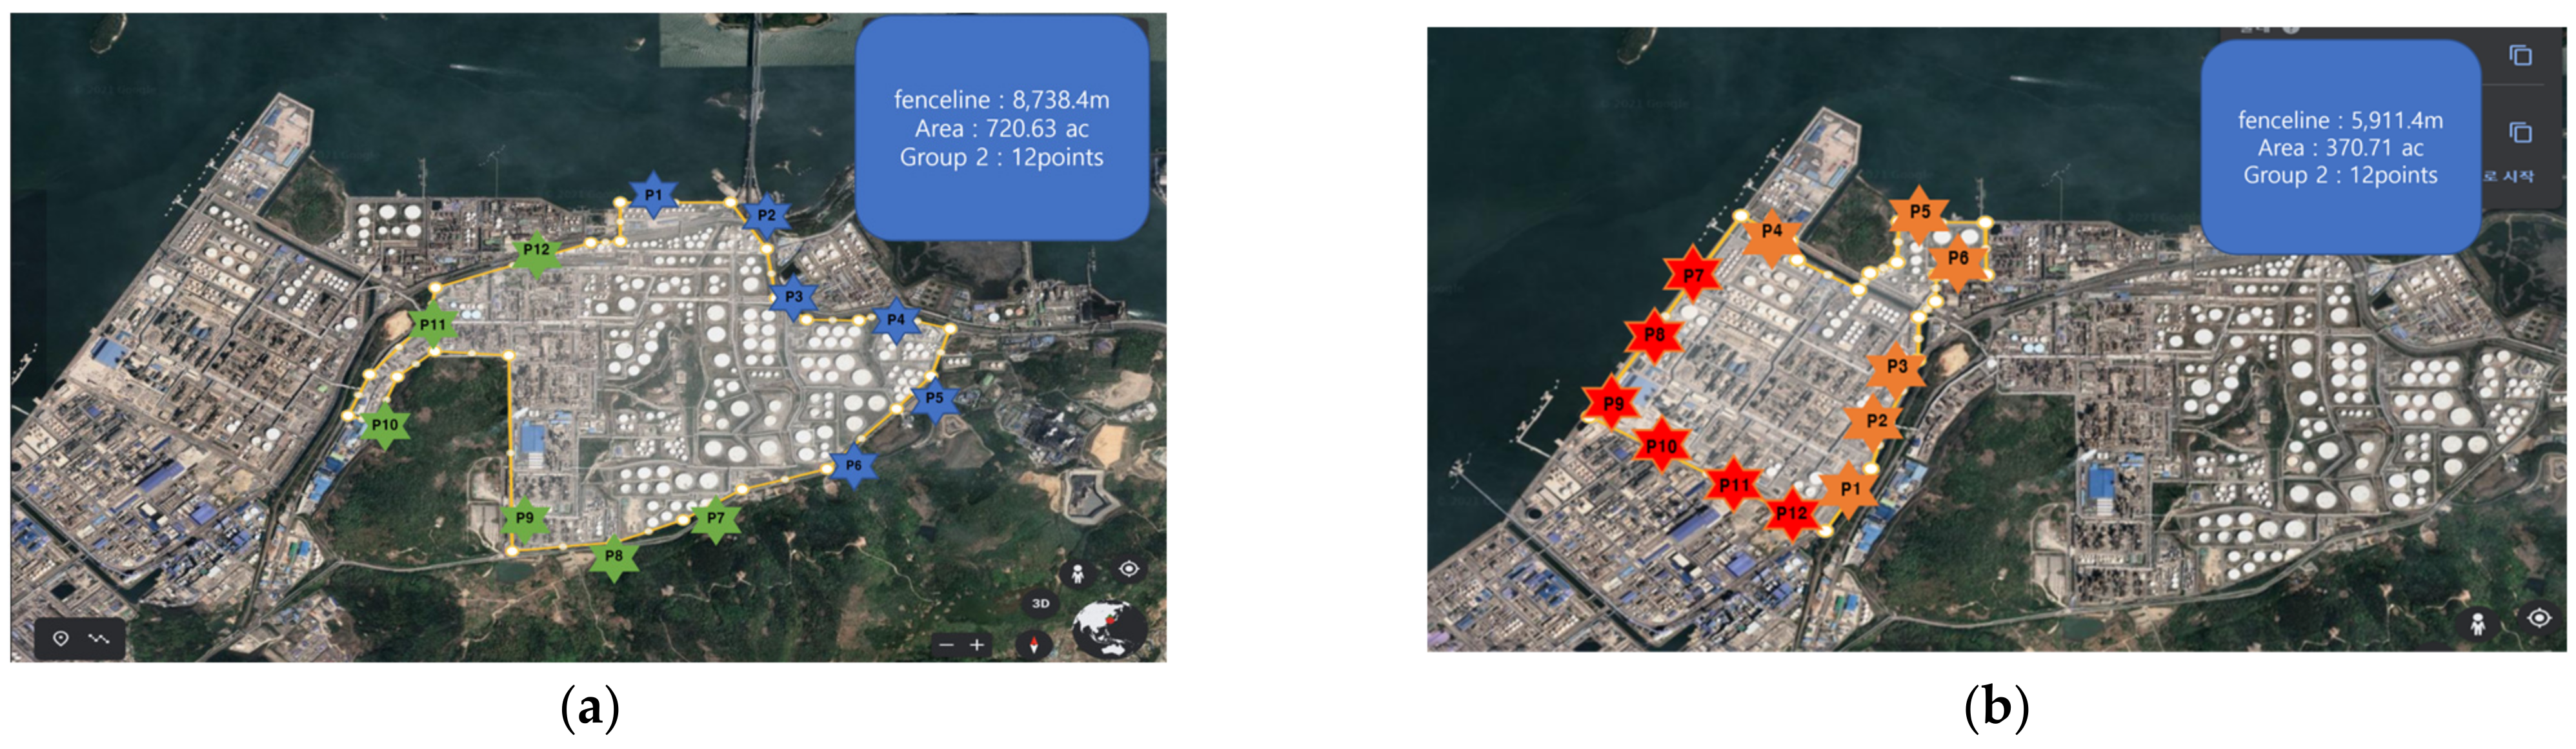
2.5. Sampling Installation Location

The 12 measurement points were selected based on the EPA fenceline monitoring guidelines, following the worksite size. According to the guidelines, there should be 12 points if the total area of the worksite is between 1 and 750 acres, 18 points for 750 to 1500 acres, and 24 points for over 1500 acres (Figure 3) [16].
Additionally, the nearby processes were divided by each measurement point, and the expected materials to be emitted were differentiated as follows (Table 6 and Table 7).

3. Results

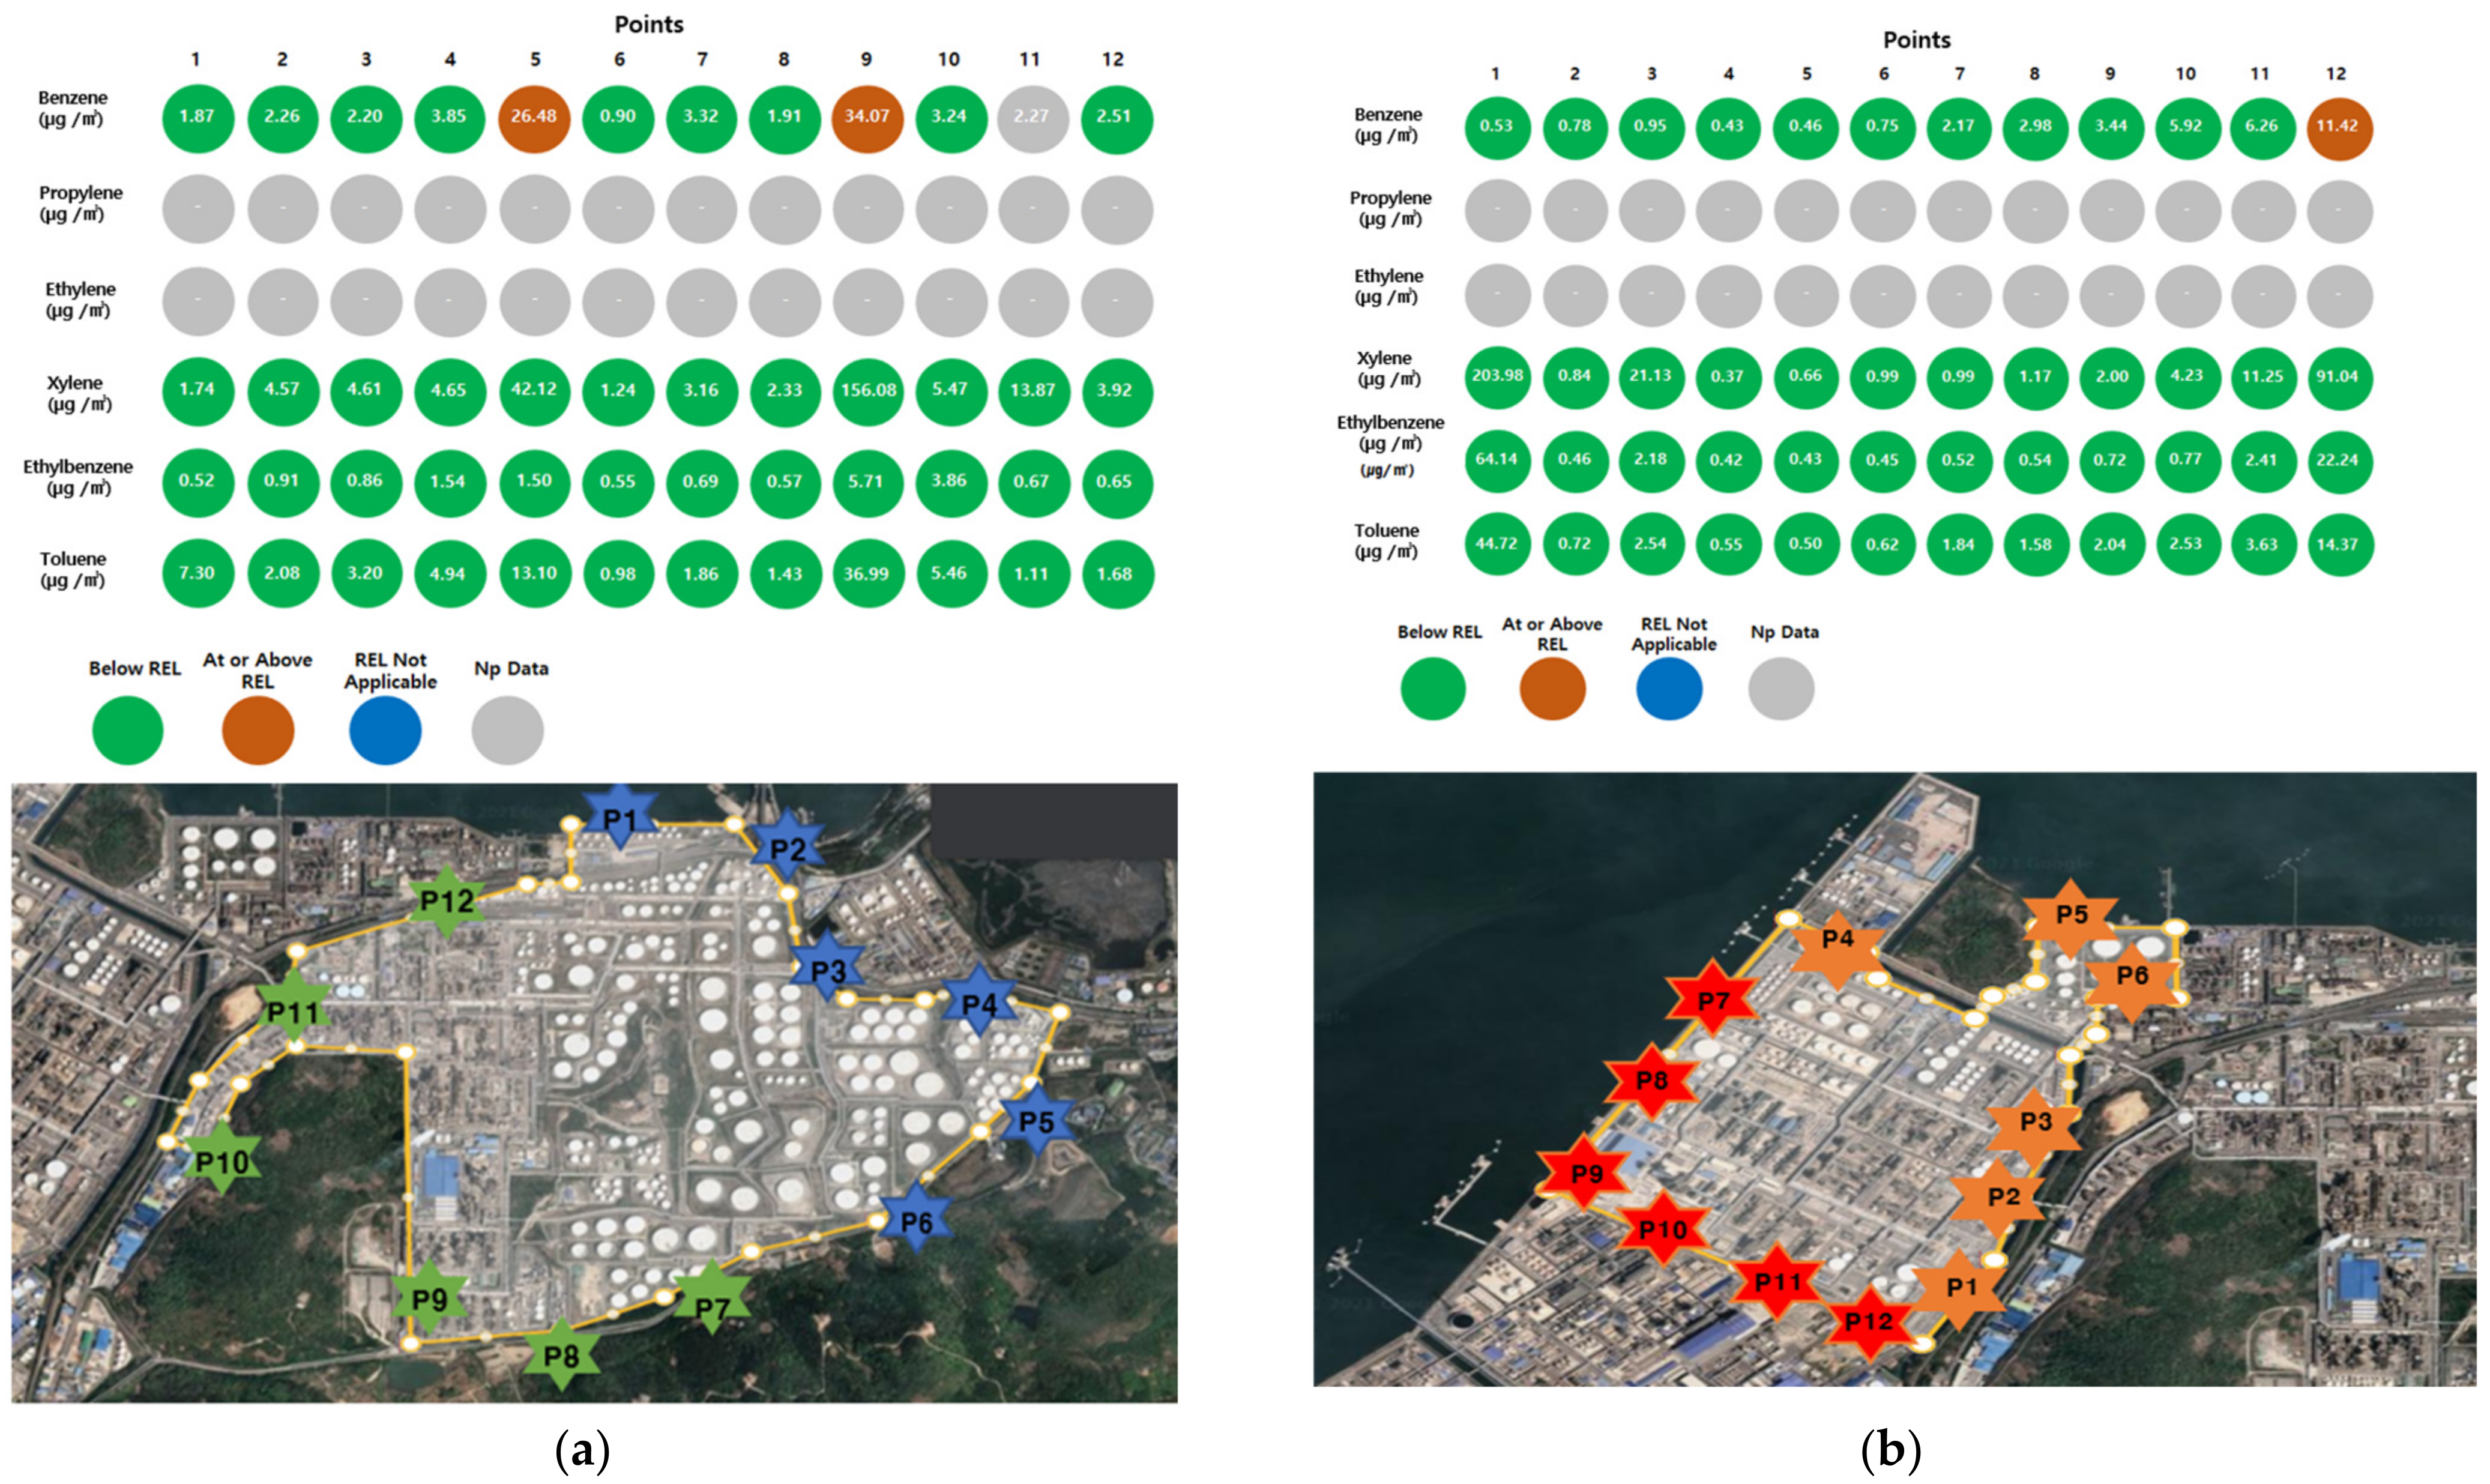
3.1. Results of VOC Measurements by Measurement Point

3.1.1. Research Target Site A

(1)
CDS/HDS Process:
The measurement point is point 12. It was expected that a large amount of C5~C9+ by-products would occur. The analysis showed that isopentane accounted for 17%, n-butane accounted for 12%, and propane accounted for 10%.
(2)
PP (Polypropylene) Process:
The measurement point is point 11. This is a process of producing polypropylene by introducing ethylene propylene as a raw material. It was expected that ethylene and propylene would occur in large quantities, but the actual analysis results showed that paraxylene accounted for 53%. A remarkable finding is that this point is adjacent to the xylene storage tank of research target facility B. This appears to be due to the influence of wind causing an interference phenomenon in the xylene storage tank area.
(3)
RFCC (Residue Fluidized Catalytic Cracking) Process:
The measurement point is similar to point 9 but was excluded from the analysis as it was not an adjacent point. However, this measurement was compared with the characteristics of point 9. Paraxylene accounted for 47% and was followed by toluene at 11% and benzene at 10%. Relatively, the detection results showed that the ARO process’s linear hydrocarbons were detected in large quantities, compared to the RFCC process’s waste materials of C5~C9+.
(4)
ARO (Aromatic Hydrocarbon) Process:
The measurement points were points 7 and 9, using naphtha as a raw material to produce benzene, paraxylene, propane, butane, and linear products (benzene, toluene, paraxylene, ethylbenzene, etc.). The results showed that paraxylene accounted for 35%, benzene accounted for 14%, and toluene accounted for 11%, as expected, and a large amount of linear hydrocarbons were generated. In particular, point 9 showed an average benzene concentration of 34.07 μg/m3, which was more than three times higher than that of the adjacent points (the concentration of adjacent points was between 1 and 10 μg/m3).
(5)
Waste Treatment Process:
It was expected that VOCs from other nearby processes, rather than VOCs from the waste treatment facility, would be detected. The analysis results showed that isopentane accounted for 29%, n-butane accounted for 22%, and propane accounted for 18%. The actual points are at locations 1 and 2, which are adjacent to the CDS/HDS process.
(6)
Crude Oil Storage Tank:
This is a tank for storing crude oil. The overall results were similar to those of the CDS/HDS process, with the analysis results showing that isopentane accounted for 45%, n-butane accounted for 16%, and propane accounted for 14%.
(7)
Product Storage Tank:
This is a storage tank for storing products, including gasoline and diesel, as well as oil derivatives and aliphatic compounds such as toluene, benzene, and xylene. Similar to the crude oil storage tank, isopentane accounted for 31% and n-butane accounted for 16%, with the difference being that xylene accounted for 14% in third place. Additionally, benzene and toluene had higher ratios, with 10% and 7%, respectively, compared to the crude oil storage tank region.
(8)
Utility Area:
The utility area is where various utilities are gathered, corresponding to measurement point 10. A notable point is that styrene accounted for 40% of the ratio. This appears to result from the influence of the styrene manufacturing process located in nearby operations. Afterward, propene accounted for 25% of the ratio, with isopentane accounting for 9%.

3.1.2. Research Target Site B

(1)
VGOFCC (Vacuum Gas Oil Fluidized Catalytic Cracking Unit) Process:
The VGOFCC process produces high-value-added products such as gasoline and asphalt from cheap raw materials, corresponding to measurement points 9 to 11. It is expected to generate C5~C9+ by-products. The actual analysis results showed that propene accounted for 23%, benzene accounted for 15%, paraxylene accounted for 12%, and toluene accounted for 8% of the ratio.
(2)
VRHCR (Vacuum Residue Hydrocracker), SRU (Sulfur Recovery Unit) Process:
The measurement point is point 1. This is an area where the SRU stripping process has been added to a process similar to VGOFCC. In particular, paraxylene showed the highest ratio and concentration, with 57%. It was followed by ethylbenzene with a ratio of 21% and toluene with a ratio of 14%.
(3)
HCR, VDU Process:
This is a continuous refining process, corresponding to points 2 and 3. Paraxylene was also detected at a rate of 24% at the relevant points. Propanol and 1-butene followed with rates of 19% and 9%, respectively.
(4)
MFC (Mixed Feed Cracker) Process:
The MFC process produces compounds with benzene rings using naphtha. It produces various chemicals such as olefin, paraffin, and BTX. Propane showed a rate of 29%, benzene showed a rate of 13%, and toluene showed a rate of 8%.
(5)
Water Treatment Process:
This process corresponds to point 12 and is a process for waste treatment. Hydrogen sulfide, carbon dioxide, etc., may occur. Paraxylene was detected at 37%, propane at 32%, and ethylbenzene at 10%.
(6)
Crude Oil and Product Storage Tank:
This tank functions as a storage tank zone for storing crude oil and various products, such as naphtha, gasoline, diesel, kerosene, and BTX products. It corresponds to measurement points 4 to 6. Propane was detected in the highest amount at 16%, followed by 1-butene at 11% and toluene at 8%. Benzene and styrene were also detected in small amounts at 6%.

3.2. Emission Status of Materials with High POCP

3.2.1. Research Target Site A

The results from identifying 10 VOCs with high ozone generation capacity were also analyzed [17]. As a result, the most frequently occurring materials at research target facility A were xylene, n-butane, and propane. In particular, the proportion of isopentane occurring in the overall facility was high (Table 8).

3.2.2. Research Target Site B

In research target site B, xylene accounted for almost half of the ratio at 46%. Propane at 19% and ethylbenzene at 15% accounted for the majority of the remaining ratio (Table 9).
The main objective of fenceline monitoring in the manufacturing of basic chemical materials in the petroleum industry is to monitor the emission concentration of benzene. In the United States, the monitoring of benzene and other flammable substances is conducted to reduce and regulate emissions if they exceed the regulatory concentration. This is particularly because a large amount of benzene, a flammable substance, is generated during the BTX process.
EPA Methods 325A and 325B, guidelines for fenceline monitoring measurement and analysis, specify benzene as the target chemical. Fenceline monitoring must ensure that the average annual sampling results of benzene are below the action level of 9 μg/m3. If the action level is exceeded, the business operator must analyze the cause and take appropriate corrective actions [18].
The second objective of monitoring is to identify the composition of high-POCP materials. Of the 10 highly reactive materials with a high POCP, the regulated materials in fenceline monitoring vary by each state. However, it is necessary to confirm whether the materials exceed the substance-specific REL (Reference Exposure Level) standard set by the California EPA and to announce the results publicly [19].
The REL value is a number published to indicate that it will not have an impact after considering the health effects that appear in people in the local community and the level of air quality, and is updated by the California Environmental Protection Agency. Above all, the California Office of Environmental Health Hazard Assessment (OEHHA) manages the REL concentration divided into three stages (acute 1-h exposure, 8-h exposure, chronic exposure) and manages fenceline monitoring based on the acute 1-h standard [20].
Especially in the case of real-time monitoring, it provides an instant visual of whether the material-specific REL value meets the standard concentration. If it is below the standard REL concentration, it is designated as MDL (Minimum Detection Level). If it is above the standard REL concentration, it is indicated as ‘At or Above REL’ as a warning level. If a substance exceeds the REL concentration, measurements are increased and reported every two months, 24 times a year. If the substance is discharged above the benchmark concentration of benzene, additional measurements are mandated [21].
In addition, reduction plans must be established. The REL concentrations of ozone-generating VOCs with high reactivity are as follows. In the absence of REL, TLV or PEL values may also be applied (Table 10).
The two target sites were analyzed to determine if emissions were maintained below the action level and REL of benzene regulated by fenceline monitoring of POCP materials.
The mean value of each measurement taken at five points through active sampling was applied. The EPA provides real-time analysis of the site and the results. As a result, both target sites A and B exceeded the action level of benzene, and the affected areas are all located near the CDU manufacturing process (Figure 4).

4. Discussion

In this study, VOCs emitted from the fenceline of an oil refining site were collected using active sampling, and 88 types of VOCs were studied to determine which types were heavily emitted. In the United States, the emission of benzene from oil refineries led to the introduction of the fenceline monitoring system in 2018, with the law regulating the concentration at the fenceline to be maintained at less than 9 μg/m3 [22].
Many countries, including the Republic of Korea, are aware that VOCs must be reduced, and as a result, global regulation of VOCs is becoming increasingly stringent.
However, there are many types of VOCs, some with high ignitability, such as benzene, and others that cause secondary pollution in the air, such as ethylene and propylene, which can create photochemical smog. Regulating total VOCs without considering these characteristics of VOCs can pose problems.
In industries such as oil refining, high-emitting VOCs such as benzene, toluene, and xylene, as well as ethylene and propylene, are produced, leading to a high concentration of POCP or high-ignitability VOCs. Furthermore, the industry is not represented by small-scale factories, leading to a large amount of emissions.
Therefore, it is important to prioritize and observe VOCs based on the characteristics of the industry among various VOCs.
According to the research results, points exceeding the action level of benzene (9 μg/m3) were found in both research target sites. It can be understood that measures for reduction must be established in the CDU process, which is the main process in the petroleum refining industry. Because benzene is highly carcinogenic, some studies have shown that residents living near petroleum refineries have a high cancer rate. EPA requires that reduction plans and countermeasures be submitted if the benzene concentration exceeds the action level of 9 μg/m3.
Additionally, through selecting ten substances with high-ozone-generating performance among various VOCs and coordinating with fine dust measures (ethylene, ethene, xylene, ethylbenzene, toluene, butane, propene, isobutene, isopentene, ethane), the emission rates were compared. Xylene, a directional hydrocarbon, was found to be released in large amounts. At research target site A, xylene, n-butane, and propene were detected in that order, and at research target site B, xylene, propene, and ethylbenzene were detected in that order. Considering the POCP, the POCP of xylene is 95, while the POCP of propene and others is 40, so there is a need to reduce emissions by tracking the process of producing xylene.
As for the case of the Republic of Korea, the proximity to adjacent businesses cannot be ignored as the distance from surrounding businesses is approximately 5 m, separated by just one road.
In the case of research target site A, measurement point 11, despite operating the polypropylene production process, a high xylene ratio was detected due to the influence of adjacent facilities’ xylene. This may be due to the influence of nearby facilities or because the actual produced polypropylene and ethylene have short reaction times and low molecular weights, causing them not to be detected.
The limitation of this study lies in the one-time measurement. In the US fenceline system, passive sampling improves accuracy by measuring once every two weeks. This also allows for analyzing the impact of interference or direction from nearby businesses. This must be complemented by ongoing research and measurement.
One thing for certain is that VOCs have a wide range of dispersion and are highly volatile, spreading to nearby businesses due to wind direction, seasonal effects, and other factors. This shows the necessity of regulating industrial areas on a region-by-region basis through cooperation between industries in the area rather than simply regulating the petroleum refining industry like in the US.
Ultimately, continuous research, measurement, and analysis of VOCs emitted by industry need to be carried out. This will enable us to identify VOCs that require priority management in each industry, leading to necessary regulations involving continuous management of VOCs.

5. Conclusions

This research study investigated the different types of VOCs emitted and the emission rates in the petroleum refining industry. With the information presented in this study, companies can prioritize and understand the need for continuous monitoring.
All the studied research target facilities exceeded the benzene action level of 9 μg/m3, presenting rates that could be potentially hazardous and carcinogenic to the local community. This excess was observed in areas near the CDU process (target site A: 34.07 μg/m3; target site B: 11.42 μg/m3). Furthermore, when comparing the 10 substances that can cause secondary pollution in the air with a high POCP, research site A showed a high rate in the order of xylene (27.71%), isopentane (26.7%), n-butane (19.23%), and propene (12.33%). Research site B showed a high rate in the order of xylene (46.75%), propene (19.77%), ethylbenzene (15.06%), and toluene (11.95%). This shows that xylene is commonly emitted in large quantity. Although xylene is less toxic than benzene, it has a higher POCP than benzene.
This highlights the need for petroleum refining companies to concentrate on reducing overall benzene concentrations and specifically manage processes, such as the BTX process, where xylene is produced.
Along with the worldwide reduction in total VOCs, it is necessary to identify and prioritize the VOCs that need to be reduced through specific industry analysis and measurement.

Author Contributions

Conceptualization, H.E.L. and J.-H.K.; formal analysis, H.E.L.; investigation, J.-H.K.; data curation, S.J.Y.; writing—original draft preparation, H.E.L.; writing—review and editing, J.-H.K.; supervision, S.J.Y.; project administration, S.J.Y. All authors have read and agreed to the published version of the manuscript.

Funding

This research received no external funding.

Institutional Review Board Statement

Not applicable.

Informed Consent Statement

Not applicable.

Acknowledgments

This research was supported by a grant from the National Institute of 404 Environment Research (NIER), funded by the Ministry of Environment (MOE) of the Republic of 405 Korea (NIER-2021-01-01-124). A study on advanced technologies to monitor PM precursors using optical remote sensing.

Conflicts of Interest

The authors declare no conflict of interest.

References

  1. Coordination of Information on the Environment (CORINE) Homepage. Available online: https://ipbes.net/policy-support/tools-instruments/coordination-information-environment-corine-land-cover?page=1 (accessed on 26 February 2023).
  2. Srivastava, A.; Majumdar, D. Monitoring and reporting VOCs in ambient air. Air Qual. Monit. Assess. Manag. 2011, 1. Available online: https://www.semanticscholar.org/paper/Monitoring-and-Reporting-VOCs-in-Ambient-Air-Srivastava-Mazumdar/6d044d1e1c9cb70ef18d3a54725d4ffc4976f7de (accessed on 26 February 2023).
  3. Helms, G.T.; Vitas, J.B.; Nikbakht, P.A. Regulatory options under the US Clean Air Act: The federal view. Water Air Soil Pollut. 1993, 67, 207–216. [Google Scholar] [CrossRef]
  4. Reitze, J.; Arnold, W. Air Quality Protection Using State Implementation Plans-Thirty-Seven Years of Increasing Complexity. Vill. Envtl. LJ 2004, 15, 209. [Google Scholar]
  5. Liebscher, H. Economic solutions for compliance to the new European VOC Directive. Prog. Org. Coat. 2000, 40, 75–83. [Google Scholar] [CrossRef]
  6. Im, J.; Kim, B.; Kim, H.; Lee, M.; Jeon, D.; Ryu, J.; Yun, D.; Jang, Y.; Lee, C. A study on the characteristics of hazardous pollutant emissions in korea from 2007 to 2016. Int. J. Environ. Res. 2020, 14, 335–346. [Google Scholar] [CrossRef]
  7. Hong, Y.D.; Lee, S.U.; Han, J.S.; Lee, S.J.; Kim, S.D.; Kim, Y.S. A study on the reduction of photochemical ozone concentration using OZIPR in Seoul area. J. Environ. Impact Assess. 2005, 14, 117–126. [Google Scholar]
  8. Andersson-Sköld, Y.; Holmberg, L. Photochemical ozone creation potentials (POCP) and replacement of solvents in Europe. Atmos. Environ. 2000, 34, 3159–3169. [Google Scholar] [CrossRef]
  9. Jenkin, M.E.; Derwent, R.G.; Wallington, T.J. Photochemical ozone creation potentials for volatile organic compounds: Rationalization and estimation. Atmos. Environ. 2017, 163, 128–137. [Google Scholar] [CrossRef]
  10. Jones, D.S.J.; Peter, P.P. (Eds.) Handbook of Petroleum Processing; Springer Science & Business Media: Berlin/Heidelberg, Germany, 2006. [Google Scholar]
  11. Song, J.-H. Optimization of Operating Conditions for Cold Recovery Processes of Naphtha Cracking Center. Master’s Thesis, Korea Advanced Institute of Science and Technologh, College of engineering, Daejeon, Republic of Korea, 17 February 1999. [Google Scholar]
  12. DeWees, J.M. Refinery fenceline monitoring & method 325A/B. In National Air Toxics Monitoring and Data Analysis Workshop. Research Triangle Park, NC; EPA: Boston, MA, USA, 2015; Volume 28. [Google Scholar]
  13. Huang, C.; Shan, W.; Xiao, H. Recent advances in passive air sampling of volatile organic compounds. Aerosol Air Qual. Res. 2018, 18, 602–622. [Google Scholar] [CrossRef]
  14. Saunders, S.M.; Jenkin, M.E.; Derwent, R.G.; Pilling, M.J. Protocol for the development of the Master Chemical Mechanism, MCM v3 (Part A): Tropospheric degradation of non-aromatic volatile organic compounds. Atmos. Chem. Phys. 2003, 3, 161–180. [Google Scholar] [CrossRef] [Green Version]
  15. Kim, M.-G.; Lee, J.Y.; Kim, J.H.; Lee, H.E.; Cho, S.H.; Yu, J.U.; Kang, C.W.; Moon, K.W. Study of Chemical Substances Emitted during Paint Manufacturing through VOC Speciation. Atmosphere 2022, 13, 1245. [Google Scholar] [CrossRef]
  16. Sanchez, N.P.; Saffari, A.; Barczyk, S.; Coleman, B.K.; Naufal, Z.; Rabideau, C.; Pacsi, A.P. Results of three years of ambient air monitoring near a petroleum refinery in Richmond, California, USA. Atmosphere 2019, 10, 385. [Google Scholar] [CrossRef] [Green Version]
  17. Collins, J.F.; Alexeeff, G.V.; Lewis, D.C.; Dodge, D.E.; Marty, M.A.; Parker, T.R.; Budroe, J.D.; Lam, R.H.F.; Lipsett, M.J.; Fowles, J.R.; et al. Development of acute inhalation reference exposure levels (RELs) to protect the public from predictable excursions of airborne toxicants. J. Appl. Toxicol. Int. J. 2004, 24, 155–166. [Google Scholar] [CrossRef] [PubMed]
  18. Olive, B.; Gamiles, D.; Wicking-Baird, M. Open Path UV as an Alternative Method to Meet Benzene Fence-Line Monitoring Provisions. In Proceedings of the AQM 2019-Air Quality Measurement Methods and Technology Conference 2019, Durham, CA, USA, 1–4 April 2019. [Google Scholar]
  19. Healy, R.M.; Bennett, J.; Wang, J.M.; Karellas, N.S.; Wong, C.; Todd, A.; Sofowote, U.; Su, Y.; Di Federico, L.; Munoz, A.; et al. Evaluation of a passive sampling method for long-term continuous monitoring of volatile organic compounds in urban environments. Environ. Sci. Technol. 2018, 52, 10580–10589. [Google Scholar] [CrossRef] [PubMed]
  20. Wu, Z.; Huiqing, L.; Wang, X.; Zhang, Z. Emulsification and improved oil recovery with viscosity reducer during steam injection process for heavy oil. J. Ind. Eng. Chem. 2018, 61, 348–355. [Google Scholar] [CrossRef]
  21. Marquès, M.; Domingo, J.L.; Nadal, M.; Schuhmacher, M. Health risks for the population living near petrochemical industrial complexes. 2. Adverse health outcomes other than cancer. Sci. Total Environ. 2020, 730, 139122. [Google Scholar] [CrossRef] [PubMed]
  22. Ahmadi, Y.; Mohammadi, M.; Sedighi, M. Introduction to Chemical Enhanced Oil Recovery; Gulf Professional Publishing: Houston, TX, USA, 2022; pp. 1–32. [Google Scholar]
Figure 1. Petroleum refining and petrochemical processes: (a) petroleum refining process; (b) petrochemical process.
Atmosphere 14 00485 g001
Figure 2. Fenceline monitoring: (a) adsorbent tube configuration; (b) example of sampler installation.
Atmosphere 14 00485 g002
Figure 3. Location information of research target worksites A and B: (a) research target worksite A; (b) research target worksite B.
Atmosphere 14 00485 g003
Figure 4. Exceedance of REL and action level for research target sites A and B: (a) research target site A; (b) research target site B.
Atmosphere 14 00485 g004
Table 1. Six EPA fenceline monitoring methods.
Monitoring MethodContentsPros and Cons
Passive Diffusive Tube Monitoring NetworkDirect measurement method that absorbs the target pollutants into the tube monitor(Advantages) Optimal in terms of low setup and maintenance costs
(Disadvantages) Time resolution is low during sample movement, and there is a possibility of sample contamination
Active Monitoring Station NetworksDirect measurement method similar to manual diffusion tubes, using air intake through a pump(Advantages) Faster collection speed due to pump use, improved time resolution.
(Disadvantages) Can be used in various environments but generates high costs
Ultraviolet Differential Optical Absorption Spectroscopy (UV-DOAS)Open-path technology that detects pollutants in an open path using continuous light beams(Advantages) Can obtain real-time data with a low detection threshold
(Disadvantages) Susceptible to interference from visible emissions, such as dust or smoke
Open-Path Fourier Transform Infrared Spectroscopy (OP-FTIR)Similar to UV-DOAS but uses infrared instead of UV, which is subject to spectral interference from carbon monoxide (CO), carbon dioxide (CO2), and water vapor(Advantages) Can simultaneously monitor all of the compounds of interest
(Disadvantages) Benzene has a high detection threshold, making FTIR not suitable for detecting benzene compared to other substances
Differential Absorption Lidar Monitoring (DIAL)Uses two light wavelengths that are strongly absorbed by one target pollutant and weakly absorbed by the same pollutant, which are emitted as pulses along the path(Advantages) Used for specific short-term studies and to measure the emissions of oil and other petroleum chemicals
(Disadvantages) Requires highly skilled personnel
Solar Occultation Flux (SOF) MonitoringOpen-path technique that uses the sun as a light source, as well as UV or FTIR detectors(Advantages) Provides better spatial resolution than other open-path methods and is less expensive than DIAL systems.
(Disadvantages) Can be more susceptible to weather because the sun is used as a light source
Table 2. PAM-57 components.
NOChemicalCas NONOChemicalCas NO
1Ethylene74-85-1303-Methylhexane589-34-4
2Acetylene74-86-2312,2,4-Trimethylpentane50-84-1
3Ethane74-84-032n-Heptane142-82-5
4Propylene115-07-133Methylcyclohexane108-87-2
5Propane74-98-6342,3,4-Trimethylpentane565-75-3
6Isobutane75-28-535Toluene108-88-3
71-Butene106-98-9362-Methylheptane592-27-8
8n-Butane106-97-8373-Methylheptane589-81-1
9trans-2-Butene624-64-638n-Octane111-65-9
10cis-2-Butene590-18-139Ethylbenzene100-41-4
11Isopentane78-78-440m-Xylene108-38-3
121-Pentene109-67-141p-Xylene106-42-3
13n-Pentane109-66-042Styrene100-42-5
14Isoprene78-79-5043o-Xylene95-47-6
15trans-2-Pentene646-04-844n-Nonane111-84-2
16cis-2-Pentene627-20-345Isopropylbenzene98-82-8
172,2-Dimethylbutane75-83-246n-Propylbenzene103-65-1
18Cyclopentane287-92-347m-Ethyltoluene620-14-4
192,3-Dimethylbutane79-29-848p-Ethyltoluene622-96-8
202-Methylpentane107-83-5491,3,5-Trimethylbenzene108-67-8
213-Methylpentane96-14-050o-Ethyltoluene611-14-3
221-Hexene592-41-6511,2,4-Trimethylbenzene95-63-6
23n-Hexane110-54-352n-Decane124-18-5
24Methylcyclopentane96-37-7531,2,3-Trimethylbenzene526-73-8
252,4-Dimethylpentane108-08-754m-Diethylbenzene141-93-5
26Benzene71-43-255p-Diethylbenzene105-05-5
27Cyclohexane110-82-756n-Undecane1120-21-4
282-Methylhexane591-76-457n-Dodecane112-40-3
292,3-Dimethylpentane565-59-3---
Table 3. TO-14 43 components.
NOChemicalCas NONOChemicalCas NO
1Ethylene74-85-1303-Methylhexane589-34-4
1Dichlorodifluoromethane75-71-812cis-1,2-Dichloroethylene156-59-2
2Chloromethane74-87-313Chloroform67-66-3
3Vinyl chloride75-01-4141,2-Dichloroethane107-06-2
41,3-Butadiene106-99-0151,1,1-Trichloroethane71-55-6
5Bromomethane74-83-916Carbon tetrachloride56-23-5
6Chloroethane75-00-3171,2-Dichloropropane78-87-5
7Acrylonitrile107-13-118Trichloroethylene79-01-6
81,1-Dichloroethene75-35-419cis-1,3-Dichloropropene10061-01-5
9Methylene chloride75-09-220trans-1,3-Dichloropropene10061-02-6
103-Chloropropene107-05-1211,1,2-Trichloroethane79-00-5
111,1-Dichloroethane75-34-3221,2-Dibromoethane106-93-4
Table 4. Sample analysis conditions (GC/MSD).
CategoryConditions
Analysis equipmentQP-2020 plus (Shimadzu)
ColumnDB-1 (60 m × 250 μm 0.25 μm)
HP-PLOT (50 m × 320 μm, 0.32 μm)
Carrier gasHe, 1.0 mL/min, constant flow
Split/splitlessSplitless, split on after 1 min (30:1)
Oven temperature40 °C, hold 2 min
5.0 ℃/min to 150 °C, hold 5 min
5.0 ℃/min to 250 °C, hold 10 min
Transfer line 230 °C
MS source temperature230 °C
Ionization modeEI mode (70 eV)
Scan mass range20 ~ 350 amu
Table 5. Sample analysis conditions (TD).
CategoryConditions
Analysis equipmentTD-20 (Shimadzu)
Primary desorption temp.300 °C
Desorb time10 min
Desorb flow50 mL/min
Cold trap holding time5 min
Cold trap low temp.−20 °C
Cold trap packingCarbopack + CS
Valve and line temp.180 °C
Table 6. Nearby processes and expected VOC emissions at measurement points in research target facility A.
ProcessRaw MaterialsIntermediate ProductsFinal ProductsMeasurement Points
CDU, HDS Process Crude oil By-products of C5~C9+LPG, gasoline, diesel, kerosene, etc.12
PP (1) ProcessEthylene, propyleneEthylene, propyleneEthylene, polypropylene, polyethylene, etc.11
RFCC ProcessCrude oil By-products of C5~C9+LPG, gasoline, diesel, kerosene, etc.9
ARO (2) ProcessNaphthaBenzenoid compounds with benzene ringsBenzene, paraxylene, propane, butane, linear products (benzene, toluene, paraxylene, ethylbenzene, etc.)7, 9
Waste Treatment ProcessHydrogen sulfide, carbon dioxide, etc.1, 2
Crude Oil Storage Tank Crude oil (methane, ethane, propane, butane, naphtha, diesel, kerosene, Bunker C oil, and various mixtures)3, 8
Product Storage TankNaphtha, gasoline, diesel, kerosene, linear hydrocarbons, etc.4, 5, 6
Utility Area -10
(1) Polypropylene; (2) aromatic hydrocarbons.
Table 7. Nearby processes and expected VOC emissions at measurement points in research target facility B.
ProcessRaw MaterialsIntermediate ProductsFinal ProductsMeasurement Points
CDU, HDS ProcessCrude oilBy-products of C5~C9+LPG, gasoline, diesel, kerosene, etc.12
VGOFCC (1) ProcessCrude oilBy-products of C5~C9+LPG, gasoline, diesel, kerosene, etc.9, 10, 11
VRHCR (2), SRU ProcessCrude oilBy-products of C5~C9+LPG, gasoline, diesel, kerosene, etc.1
HCR, VDU ProcessCrude oilBy-products of C5~C9+LPG, gasoline, diesel, kerosene, etc.2, 3
MFC (3) ProcessNaphthaBenzenoid compounds with benzene ringsOlefin, benzene, toluene, xylene, propane, ethane, etc.7, 8
Waste Treatment ProcessHydrogen sulfide, carbon dioxide, etc.12
Crude Oil Storage TankCrude oil (methane, ethane, propane, butane, naphtha, diesel, kerosene, Bunker C oil, and various mixtures)4
Product Storage TankNaphtha, gasoline, diesel, kerosene, linear hydrocarbons, etc.5, 6
(1) Vacuum gas oil fluidized catalytic cracking unit; (2) vacuum residue hydrocracker; (3) mixed feed cracker.
Table 8. Nearby processes and expected VOC emissions from measured points at research target site A.
ClassificationMeasured Value
(μg/m3)
Measured Value Emission Rate (%)
RankSubstancePOCP Value
1Propylene105UndetectedUndetected
2Ethylene100UndetectedUndetected
3m/p-Xylene9519.4327.71
4Ethylbenzene601.502.14
5Toluene556.689.52
6n-Butane4013.4819.23
7Propane408.6512.33
8Isobutane301.652.35
9Isopentane3018.7226.70
10Ethane10UndetectedUndetected
Table 9. Nearby processes and expected VOC emissions from measured points at research target site B.
ClassificationMeasured Value
(μg/m3)
Measured Value Emission Rate (%)
RankSubstancePOCP Value
1Propylene105UndetectedUndetected
2Ethylene100UndetectedUndetected
3m/p-Xylene9524.6546.75
4Ethylbenzene607.9415.06
5Toluene556.3011.95
6n-Butane401.653.12
7Propane4010.4319.77
8Isobutane300.781.47
9Isopentane300.991.87
10Ethane10UndetectedUndetected
Table 10. Comparison of REL values for high-reactivity substances.
Target SubstancePOCP ValueRELNotes
Benzene 15~35, estimate27 μg/m3Action level 9 μg/m3
Propylene1053000 μg/m3No data available
Ethylene100No data availableTLV 200 ppm (250 mg/m3)
Xylene9522,000 μg/m3
Ethylbenzene602000 μg/m3
Toluene555000 μg/m3
n-Butane40REL data unavailable
Propane40REL data unavailable
Isobutane30REL data unavailable
Isopentane30REL data unavailable
Ethane10REL data unavailable
Disclaimer/Publisher’s Note: The statements, opinions and data contained in all publications are solely those of the individual author(s) and contributor(s) and not of MDPI and/or the editor(s). MDPI and/or the editor(s) disclaim responsibility for any injury to people or property resulting from any ideas, methods, instructions or products referred to in the content.

