Article

Interlaboratory Study on Brake Particle Emissions Part II: Particle Number Emissions

by
Marcel Mathissen
1,
Theodoros Grigoratos
2,*,
Sebastian Gramstat
3,
Athanasios Mamakos
4,
RaviTeja Vedula
5,
Carlos Agudelo
6,
Jaroslaw Grochowicz
1 and
Barouch Giechaskiel
2,*
1
Ford-Werke GmbH, Süsterfeldstr. 200, 52072 Aachen, Germany
2
European Commission, Joint Research Centre (JRC), 21027 Ispra, Italy
3
Audi AG, 85045 Ingolstadt, Germany
4
Corning GmbH, 65189 Wiesbaden, Germany
5
Brakes India Private Limited, Padi, Chennai 600 050, India
6
Link Engineering Co., 43855 Plymouth Oaks Blvd., Plymouth, MI 48170, USA
*
Authors to whom correspondence should be addressed.
Atmosphere 2023, 14(3), 424; https://doi.org/10.3390/atmos14030424
Submission received: 21 December 2022 / Revised: 6 February 2023 / Accepted: 16 February 2023 / Published: 21 February 2023
(This article belongs to the Special Issue Brake Wear Particulate Matter and Mitigation Strategies)

Abstract

:
The Particle Measurement Programme (PMP) informal working group co-ordinated a global interlaboratory study (ILS) on brake wear particle emissions with the participation of 16 laboratories in 2021. Two articles present the results of the ILS: (I) particulate matter mass (PM) and (II) particle number (PN) emissions. The test matrix covered different brake systems, including ECE and NAO pad materials with grey cast iron discs and a drum brake. Regarding PN, the study measured the total particle number from approximately 10 nm to 2.5 µm (TPN). Some testing facilities measured solid particle number emissions (SPN) in parallel. The mean TPN concentrations ranged from 9.1 × 10⁸ #/km/brake to 1.1 × 10¹⁰ #/km/brake. TPN and SPN emission levels were comparable, except for one lab that measured very high volatile particle emissions for one brake system. The minimum and maximum SPN emissions for a given brake differed by a factor of 2.5 ± 0.5, comparable to data from exhaust SPN ILS measurements. This article provides an overview of lessons learned and subsequent measures incorporated in an upcoming global technical regulation to reduce measurement variability when sampling and measuring brake particle emissions for light-duty vehicles up to 3.5 t.

1. Introduction

Non-exhaust emissions refer to particle emissions released from friction brake wear [1], the interaction between the tyre and road interface [2], and the resuspension of road dust [3]. Tyre wear, road abrasion, and brake wear combined contributed 2.6–3.2% (PM2.5, PM10) to the total PM emissions in the EU27 in 2020 [4]. However, there is significant uncertainty regarding non-exhaust emission factors within emission inventories. For example, the European Environment Agency applies a PM10 EF for brake wear emissions from passenger cars of 7.35 mg/km per vehicle [5]. The EC’s Joint Research Centre summarised PM10 emission factors in the range of 1.0–8.0 mg/km per vehicle from the literature [6]. Similar levels have been reported also in other studies [7]. The Euro 7 pollutants regulation preparation used a fleet-based PM10 emission factor of 12 mg/km per vehicle for LDV up to 3.5 t to perform the accompanying impact assessment study [8]. All these studies followed different procedures and measurement approaches and are hardly comparable to each other.
Another problem is that dynamometer (source)-derived emission factors cannot be used directly as input in emission modelling. Some studies estimate that approximately 30–50% of the airborne PM is retained in the vehicle (wheels and vehicle body) [9]. More recent results from the present dynamometer study indicate PM10 emission factors in the range of 6–27 mg/km/vehicle depending on the type of brake, vehicle characteristics, and other parameters [10]. Assuming the above-mentioned 50% particle loss at the vehicle, the reported values are in a comparable range to emission factors previously reported. Part I of this study [10] discusses in more detail brake PM emissions.
Due to the potential health impact, the contribution of non-exhaust emissions to ambient particle concentrations is more relevant than total emissions. Brake and tyre wear PM10 emissions contribute approximately 4% to the total PM concentrations at background sites and 5–8% at traffic sites [11]. Some studies show that the relative contribution of non-exhaust to traffic-related PM concentrations at local hot spots may exceed 50% [12,13,14]. While exhaust emissions have decreased significantly in the last decades, non-exhaust emissions increased due to the increase in traffic volume and are now the main contributor to vehicle particle emissions.
Particle number (PN) emissions are dominated by particles with a mobility diameter smaller than 1 µm. Of particular interest are the so-called ultrafine particles (UFP) with diameters smaller than 0.1 µm. Epidemiological studies reveal that decreasing particle sizes may negatively affect human health, even if the evidence for the health effects of UFP is relatively scarce. Toxicological studies may lead to the understanding that UFP causes higher toxicity per mass unit than larger particles [15]. However, other studies indicate that particle surface area might be a more sensitive indicator for specific health conditions than UFP number counts [16].
The PN concentration includes two fractions: solid and volatile [17]. Historically, the solid particle number (SPN) concentration measurement of vehicle exhaust used a cut-off of 23 nm. However, recent studies showed a significant contribution of solid exhaust particles smaller than 23 nm, which led to a cut-off of 10 nm [18]. The measurement setup features a heated diluter (temperature range from 150 °C to 400 °C) in combination with an evaporation tube (ET, temperature range 300 °C to 400 °C) to remove the volatile fraction [19]. The measurement of SPN brake particle number emissions follows the same principle. Additionally, the role of volatile particles may become relevant for brake emissions in certain brake–vehicle combinations; therefore, total particle number (TPN) (i.e., solids and volatiles) is of interest here as well. The preparatory work for exhaust emission characterisations [20] and the brake emission determination have benefited from this progress, with a TPN metric included in the UN global technical regulation (GTR) on brake emissions. Again, the measurement considers particles of approximately 10 nm cut-off or higher.
Several parameters affect the PN concentration levels when testing a brake system for its emissions [21,22]. Mamakos et al. [23] highlighted the importance of an adequately preconditioned (bedded) friction couple to ensure a stable emission behaviour that is more representative of real-world applications. Other researchers have examined the role of brake inertia. Increased inertia leads to higher PN concentration levels due to the increase in friction temperature [22]. Regarding the role of the test protocol, previous studies indicate the test needs to exceed certain thresholds for vehicle speed and brake disc temperature to detect clear peaks of PN concentrations. Another study investigated the impact of different test protocols on PN emissions [24]. The authors confirmed for two cycles (WLTP-Brake and 3h-LACT) the presence of nanosized particles with a peak at 10 nm, which were also thermally stable at 350 °C. Volatile nanoparticles were also determined but only for the more demanding and severe 3h-LACT protocol [24].
Regarding PN emission factors (EF), a considerable range is reported in the literature, varying between 109 and 1013 #/km/vehicle [21,22,23,24,25,26]. The formation of a separate volatile nucleation mode in the 10–30 nm range after reaching and exceeding a temperature threshold (critical temperature) can also explain the significant variations [26,27,28,29]. It is important to note that the formation of such volatile particles depends on different aspects, especially the composition of the friction couples as well as the temperature measurement method, which necessitates tight control of the cooling method (air flow, vehicle parameters in the dyno, etc.) [30]. Furthermore, different processes can affect the PN concentrations and size distribution, such as nucleation, evaporation, condensation, deposition, and coagulation. The characterisation of PN emissions can be challenging due to the measurement complexities. Consequently, robust, repeatable, and reproducible test methods are required to determine reliable emission factors.
In this framework, the United Nations Working Party on Energy and Pollution (UN-GRPE) mandated the Particle Measurement Programme (PMP) informal working group to develop a commonly accepted methodology for sampling and measuring brake wear particle emissions from light-duty vehicles (LDV) up to 3.5 t. The PMP developed the first version of the method that included recommendations for measuring brake particle emissions [31]. In 2021, the PMP organised an interlaboratory study (ILS) to assess the proposed methodology. The objectives of the ILS include (a) verifying the feasibility and applicability of the defined specifications, (b) providing recommendations to the PMP on further improving the set of the defined specifications, (c) examining the repeatability and reproducibility of PM and PN emission measurements with the application of the specifications, and (d) proposing alternatives to improve the efficiency of some of the specifications proposed. Lastly, in 2021 the GRPE mandated the PMP group to develop a GTR governing the measurement of brake wear particle emissions from LDV up to 3.5 t using the outcomes of the ILS [32]. The upcoming EURO 7 regulation in Europe incorporates limits for tyre abrasion and brake particle emission to ensure the lowest possible level of vehicle emissions [8].
The current article presents the results of the SPN and TPN measurements obtained during the ILS. Additionally, it discusses lessons learned from the ILS and its incorporation into the GTR for sampling and measuring TPN and SPN emissions.

2. Materials and Methods

2.1. Tested Brakes

The interlaboratory study used four discs and one drum brake system. Table 1 lists the vehicle parameters and attributes for the five brakes tested. Br1Fa is the reference brake and Br1Fb is its non-asbestos organic friction pad (NAO) counterpart. Br2 and Br3 are standard disc brakes larger than the reference brake. The drum brake (Br4) mounts on the rear axle of a compact passenger car. Lastly, Br5La and Br5Lb represent a typical N1 vehicle category brake tested under different load conditions. Part I of this study provides more details about the brakes [10].

2.2. Testing Protocol

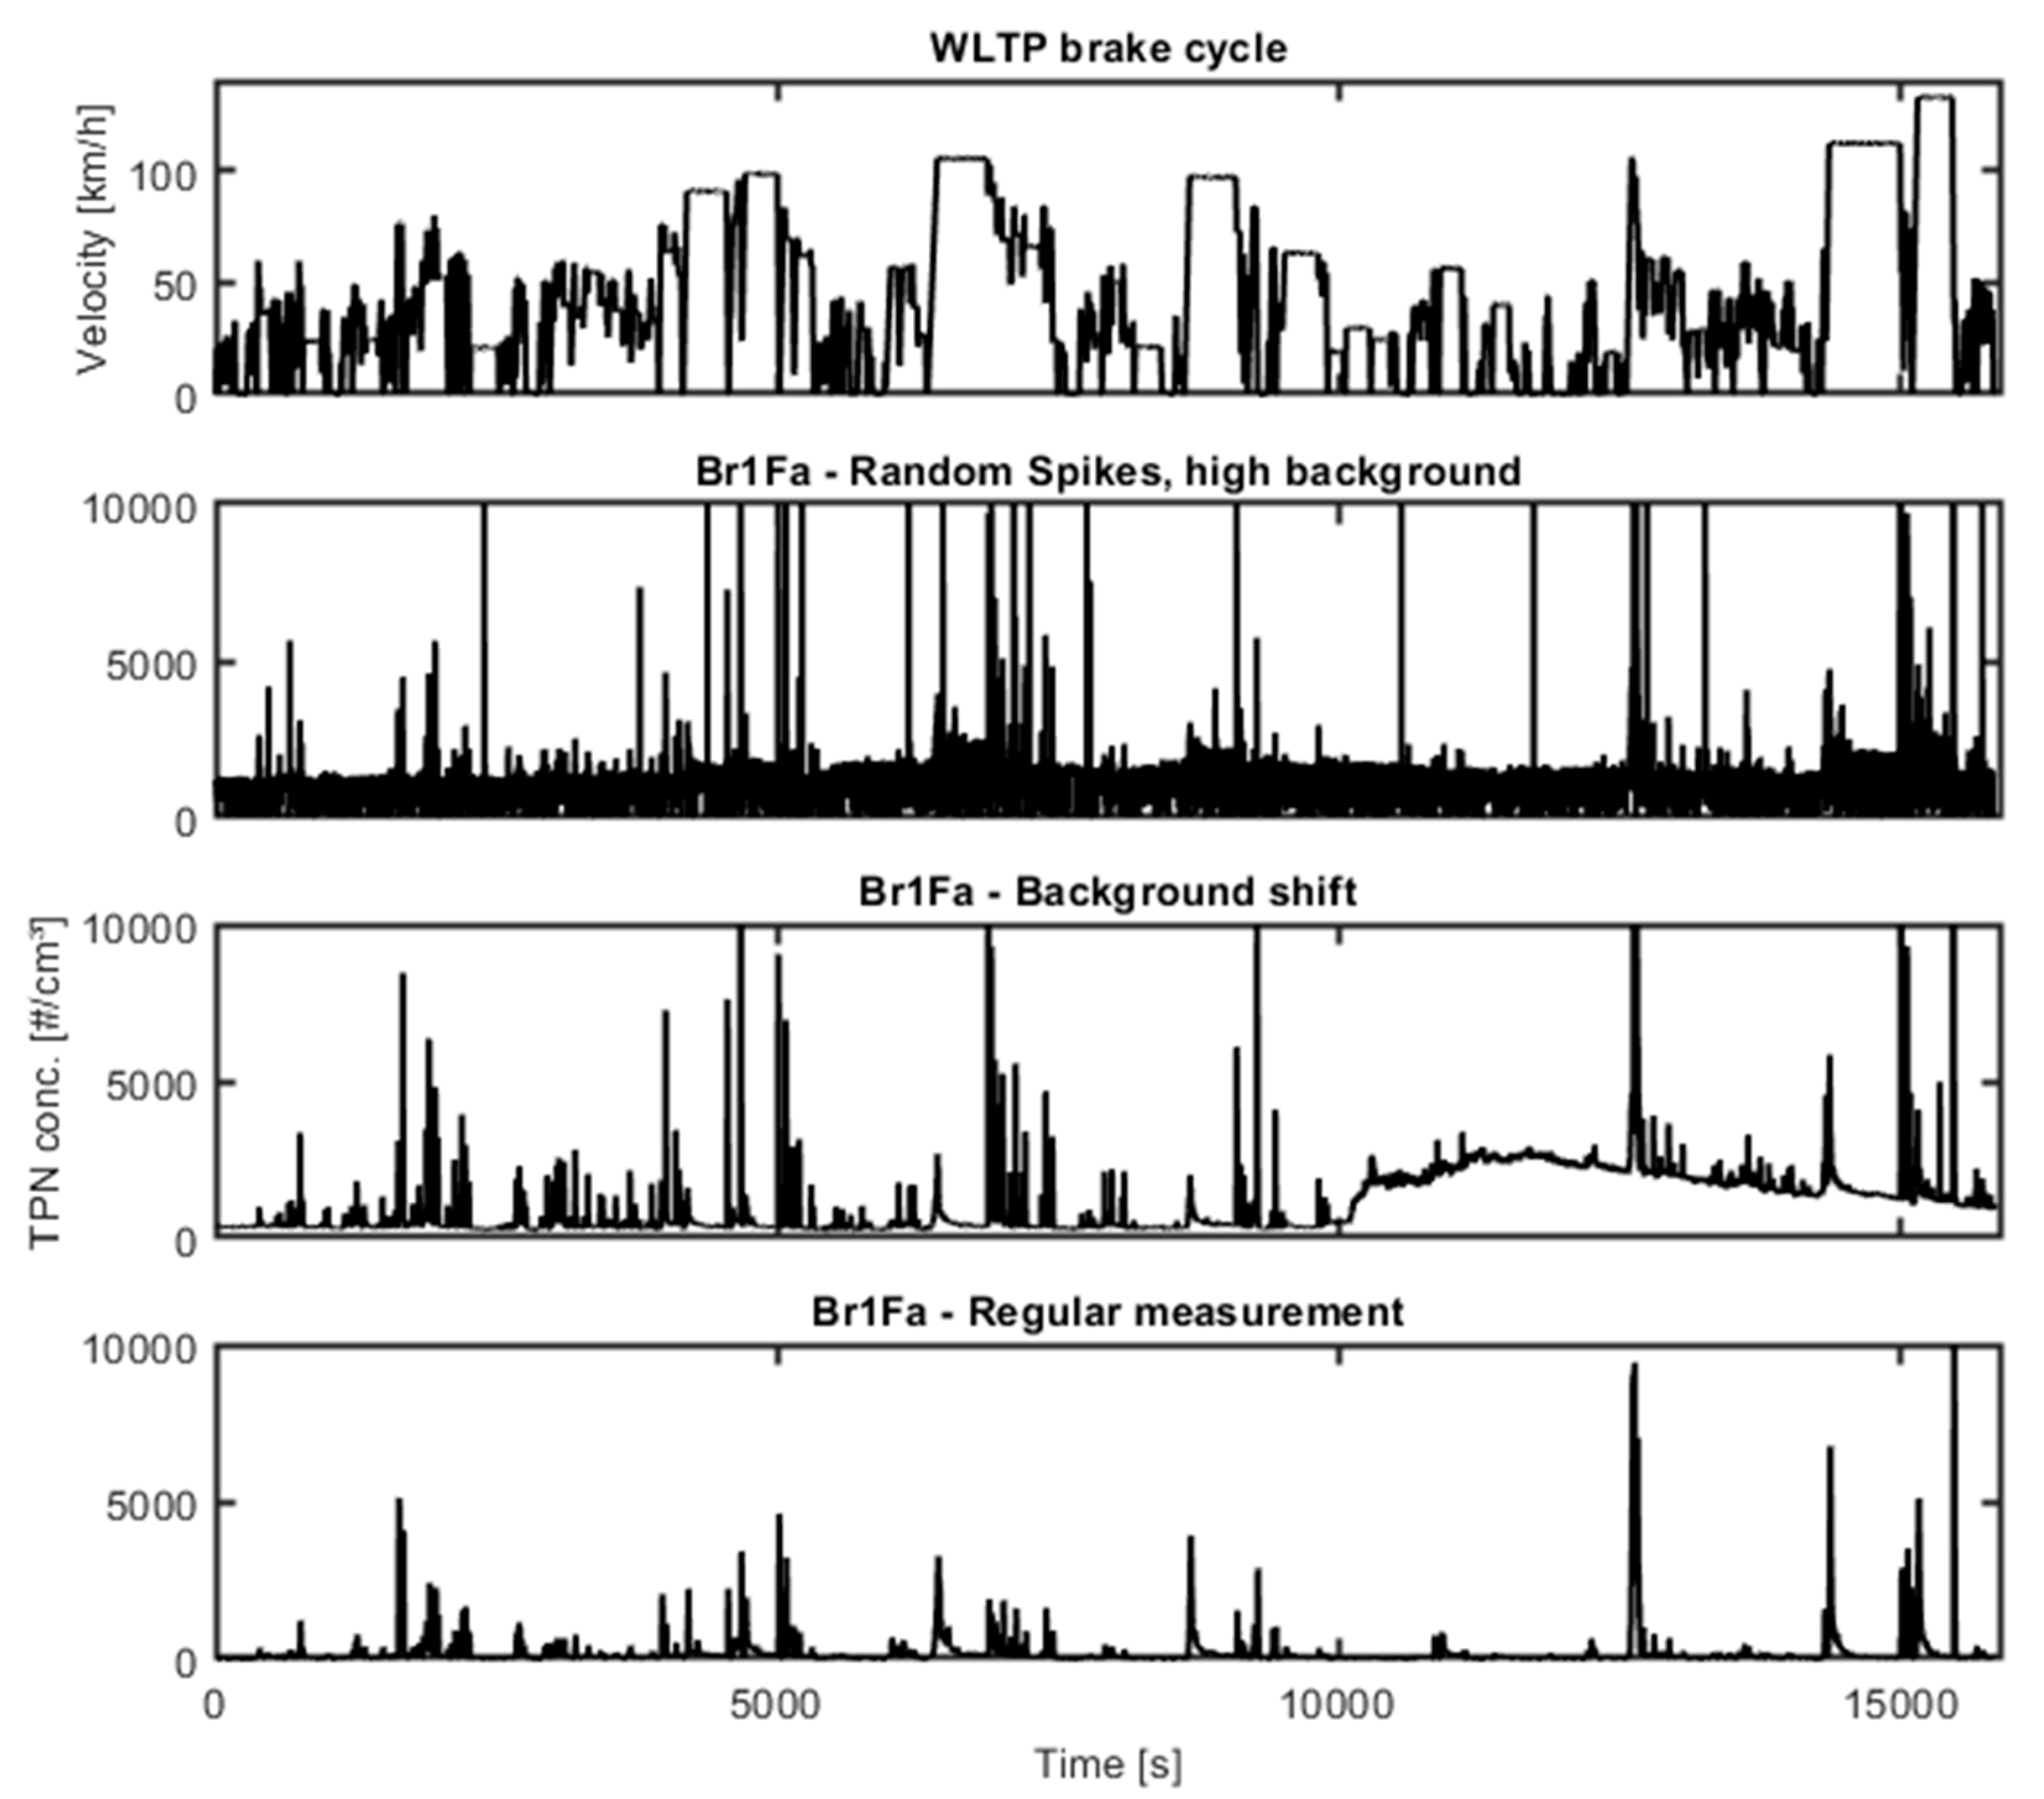
  • The test cycle during the ILS was the WLTP-Brake cycle. The WLTP-Brake cycle is derived from real-world driving behaviour and is structured into 10 trips with 303 stops and a total distance of 192 km. Mathissen et al. discussed the details of the test cycle [33].
  • The participating facilities followed a predefined test sequence using test systems that met a set of mandatory design and operational requirements. Reference Part I of this study for more details about the testing sequence [10], with the main elements given below:
    • Phase 1—cooling section: a section to adjust the cooling airflow to match predefined thermal regimes measured or predicted from proving ground test data [34]. It involves one or more repetitions of Trip #10 of the WLTP-Brake cycle.
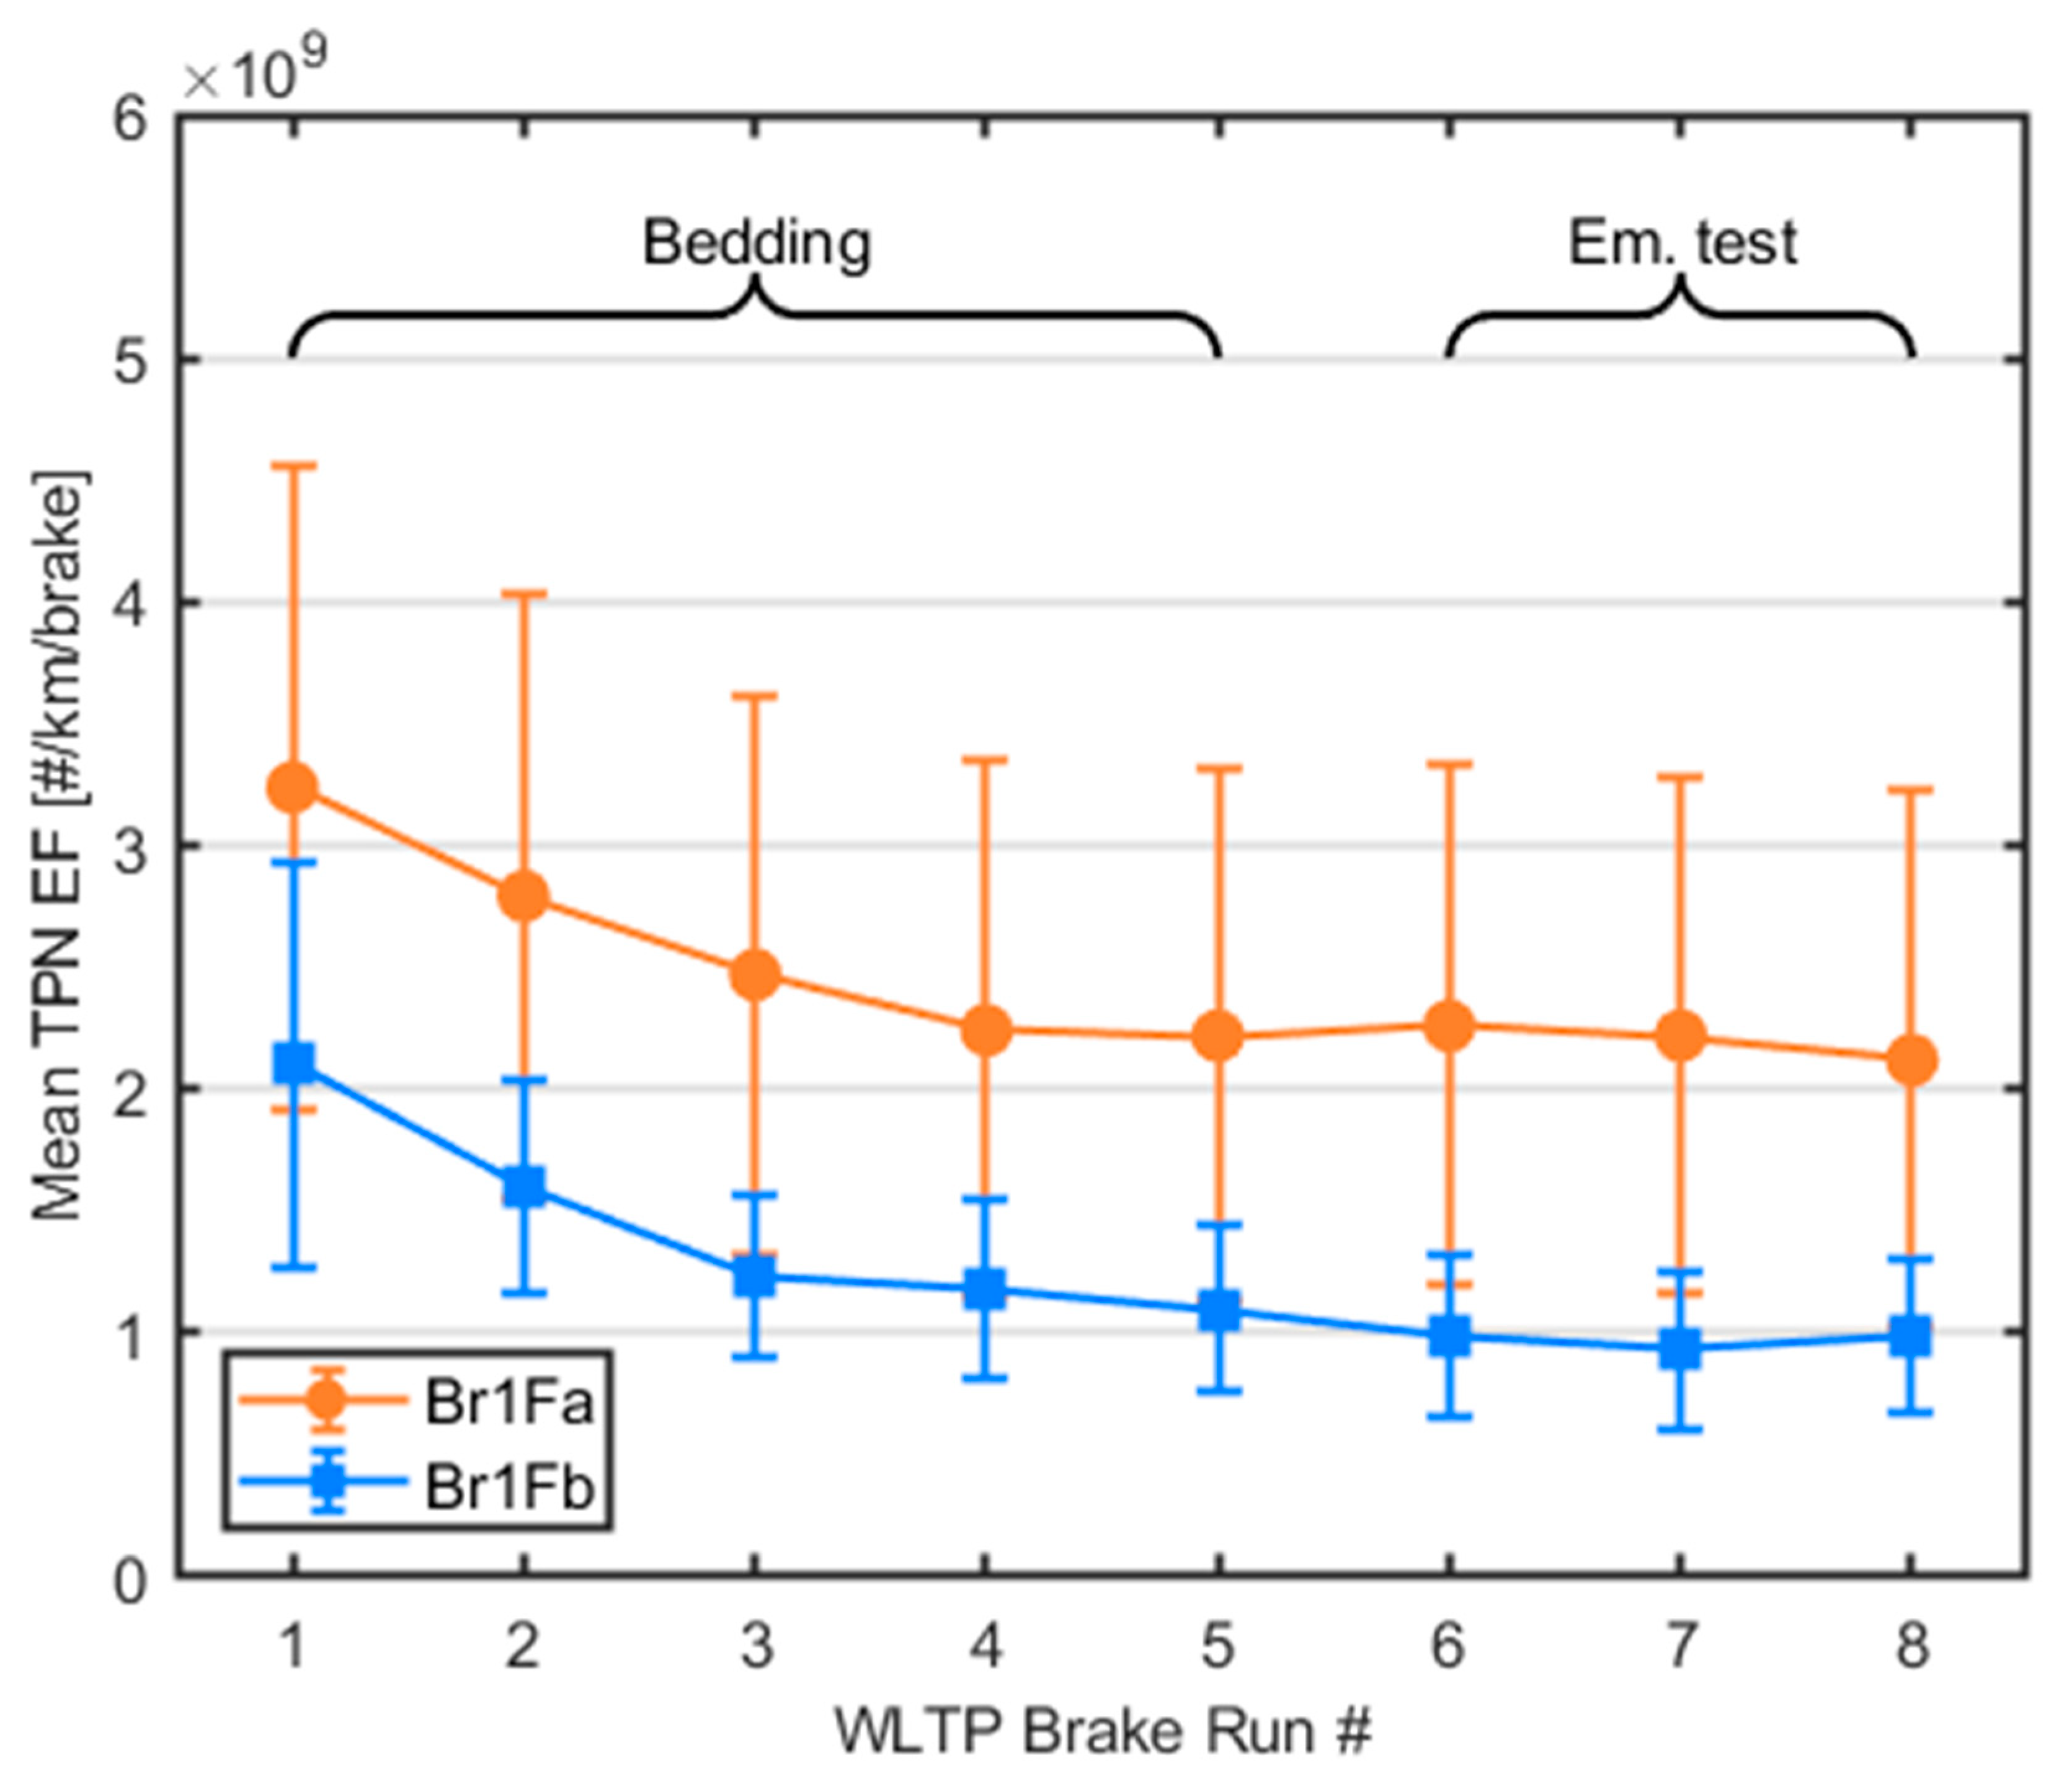
    • Phase 2—bedding section: a section to precondition the brakes and stabilise their emissions behaviour. The bedding section includes five repeats of the WLTP-Brake cycle without any warm-up stops.
    • Phase 3—emissions measurement section: a section to measure brake PM and PN emissions. The emissions measurement section includes three WLTP-Brake cycle repeats following the bedding section.

2.3. PN Measurement Specifications and Instrumentation

The total particle number (TPN) measurement was continuous during the bedding and the emissions test sections. The mandatory devices included a particle number counter (PNC) with a lower limit of 10 nm, a pre-classifier, and a diluter. In parallel to the TPN, a few labs measured solid PN (SPN) concentrations to study brake emissions’ volatile content. The following minimum specifications were defined for sampling, measuring, and calculating PN emissions. For more details regarding the PN setup refer to Grigoratos et al. [35]:
-
The protocol required the sampling plane to be at least five (inner) duct diameters downstream and at least two (inner) duct diameters upstream of the last flow disturbance.
-
A pre-classifier with a cut-off point between 2.5 and 10 μm was used to protect the PN system from contamination. The recommendation given to the labs was to use a pre-classifier with a cut-off point close to 2.5 μm.
-
A maximum residence time of 1.5 s was defined for the sampling line from the probe tip to the diluter to minimise coagulation. Similarly, a maximum length (L) to sample flow ratio (Q) of 60,000 s/m2 was defined to minimise diffusion losses.
-
When the testing facilities applied a flow splitter for connecting the diluter to the sampling probe (to measure TPN and SPN simultaneously), the recommendation was to keep the change in the flow angle to within 20° for each outlet. The particle concentration reduction factors (PCRFs) were determined with the flow splitter installed on the PN measurement system (operating at the same flows as during the measurements) for the labs that employed a y-splitter.
-
A diluter was used to ensure that the measured concentrations during testing would not exceed the certified linearity range of the PNC in single-count mode. The protocol [34] provided critical specifications for the diluter. The PCRF for the diluter at 15, 30, 50, and 100 nm at each operating condition was determined and reported. All testing facilities provided a calibration certificate for the diluter issued less than a year before conducting the tests.
-
Full-flow PNCs following the specifications of GTR 15 for 10 nm measurements were used [36]. These included a counting efficiency of 65% (±15%) at 10 nm and >90% at 15 nm and operation in single-count mode only. Most PNCs were calibrated in ISO 27,891 accredited laboratories using either emery oil or soot-like particles, as defined in GTR 15 [36]. As for the diluter, all test facilities provided a copy of the calibration certificate for the full-flow PNC.
-
The participating labs measured the sampling airflow of the PNC before each test using a flowmeter with a third-party calibration. The measured flows were reported at normal conditions and were required to be within 5% of the most recent PNC calibration certificate.
The labs were requested to measure (when available) SPN in parallel to the TPN. Both (TPN and SPN) followed the same technical provisions. Additionally, the thermal treatment of the sample using volatile particle remover (VPR) was according to the specifications described in GTR 15 [36]. More specifically, the system diluted the sample in one or more stages to achieve a PN concentration below the upper threshold of the single-particle count mode of the PNC and a gas temperature below the maximum allowed inlet temperature specified by the PNC manufacturer. It included an initial heated dilution stage that outputs a sample at a temperature of ≥150 °C and ≤350 °C ± 10 °C and diluted by a factor of at least 10.
The ILS evaluated the background PN at the system and test level. The measurement of the system-level background did not involve the brake assembly (i.e., the fixture was not mounted). While the brake enclosure of the brake dynamometer remained empty and all doors closed, the PNC recorded background emissions for three cooling airflow settings corresponding to 10%, 50%, and 90% of the maximum operational airflow. The measurement of the test-level background was before the bedding and after the emissions measurement test section. The disc or drum remained stationary during the test-level background without applying hydraulic pressure. The background of the second stage is reported in this paper as it is more relevant for comparisons with the emissions measurements.
Table 2 presents the main elements of the PN-related instrumentation selected by the testing facilities.

2.4. Test Matrix

Overall, 15 testing facilities completed tests with Br1Fa as shown in Table 3. Each test includes three PN measurements sampled during the last three WLTP-Brake cycles. Br1Fa gathered 41 data points for TPN and 12 for SPN measurements. The testing facilities completed multiple tests for Br1Fb (36 for TPN and 11 for SPN) and Br2 (36 for TPN and 9 for SPN). Fewer facilities tested the optional brakes. Br3 had six tests completed (Table 3) generating 18 data points for TPN and 5 for SPN. The drum brake was tested by 5 laboratories giving 12 data points for TPN and 6 for SPN. Lastly, four facilities tested both Br5 brakes (Br5La and Br5Lb); however, the measurements of SPN were not successful (10 and 11 TPN data points, respectively).

3. Results

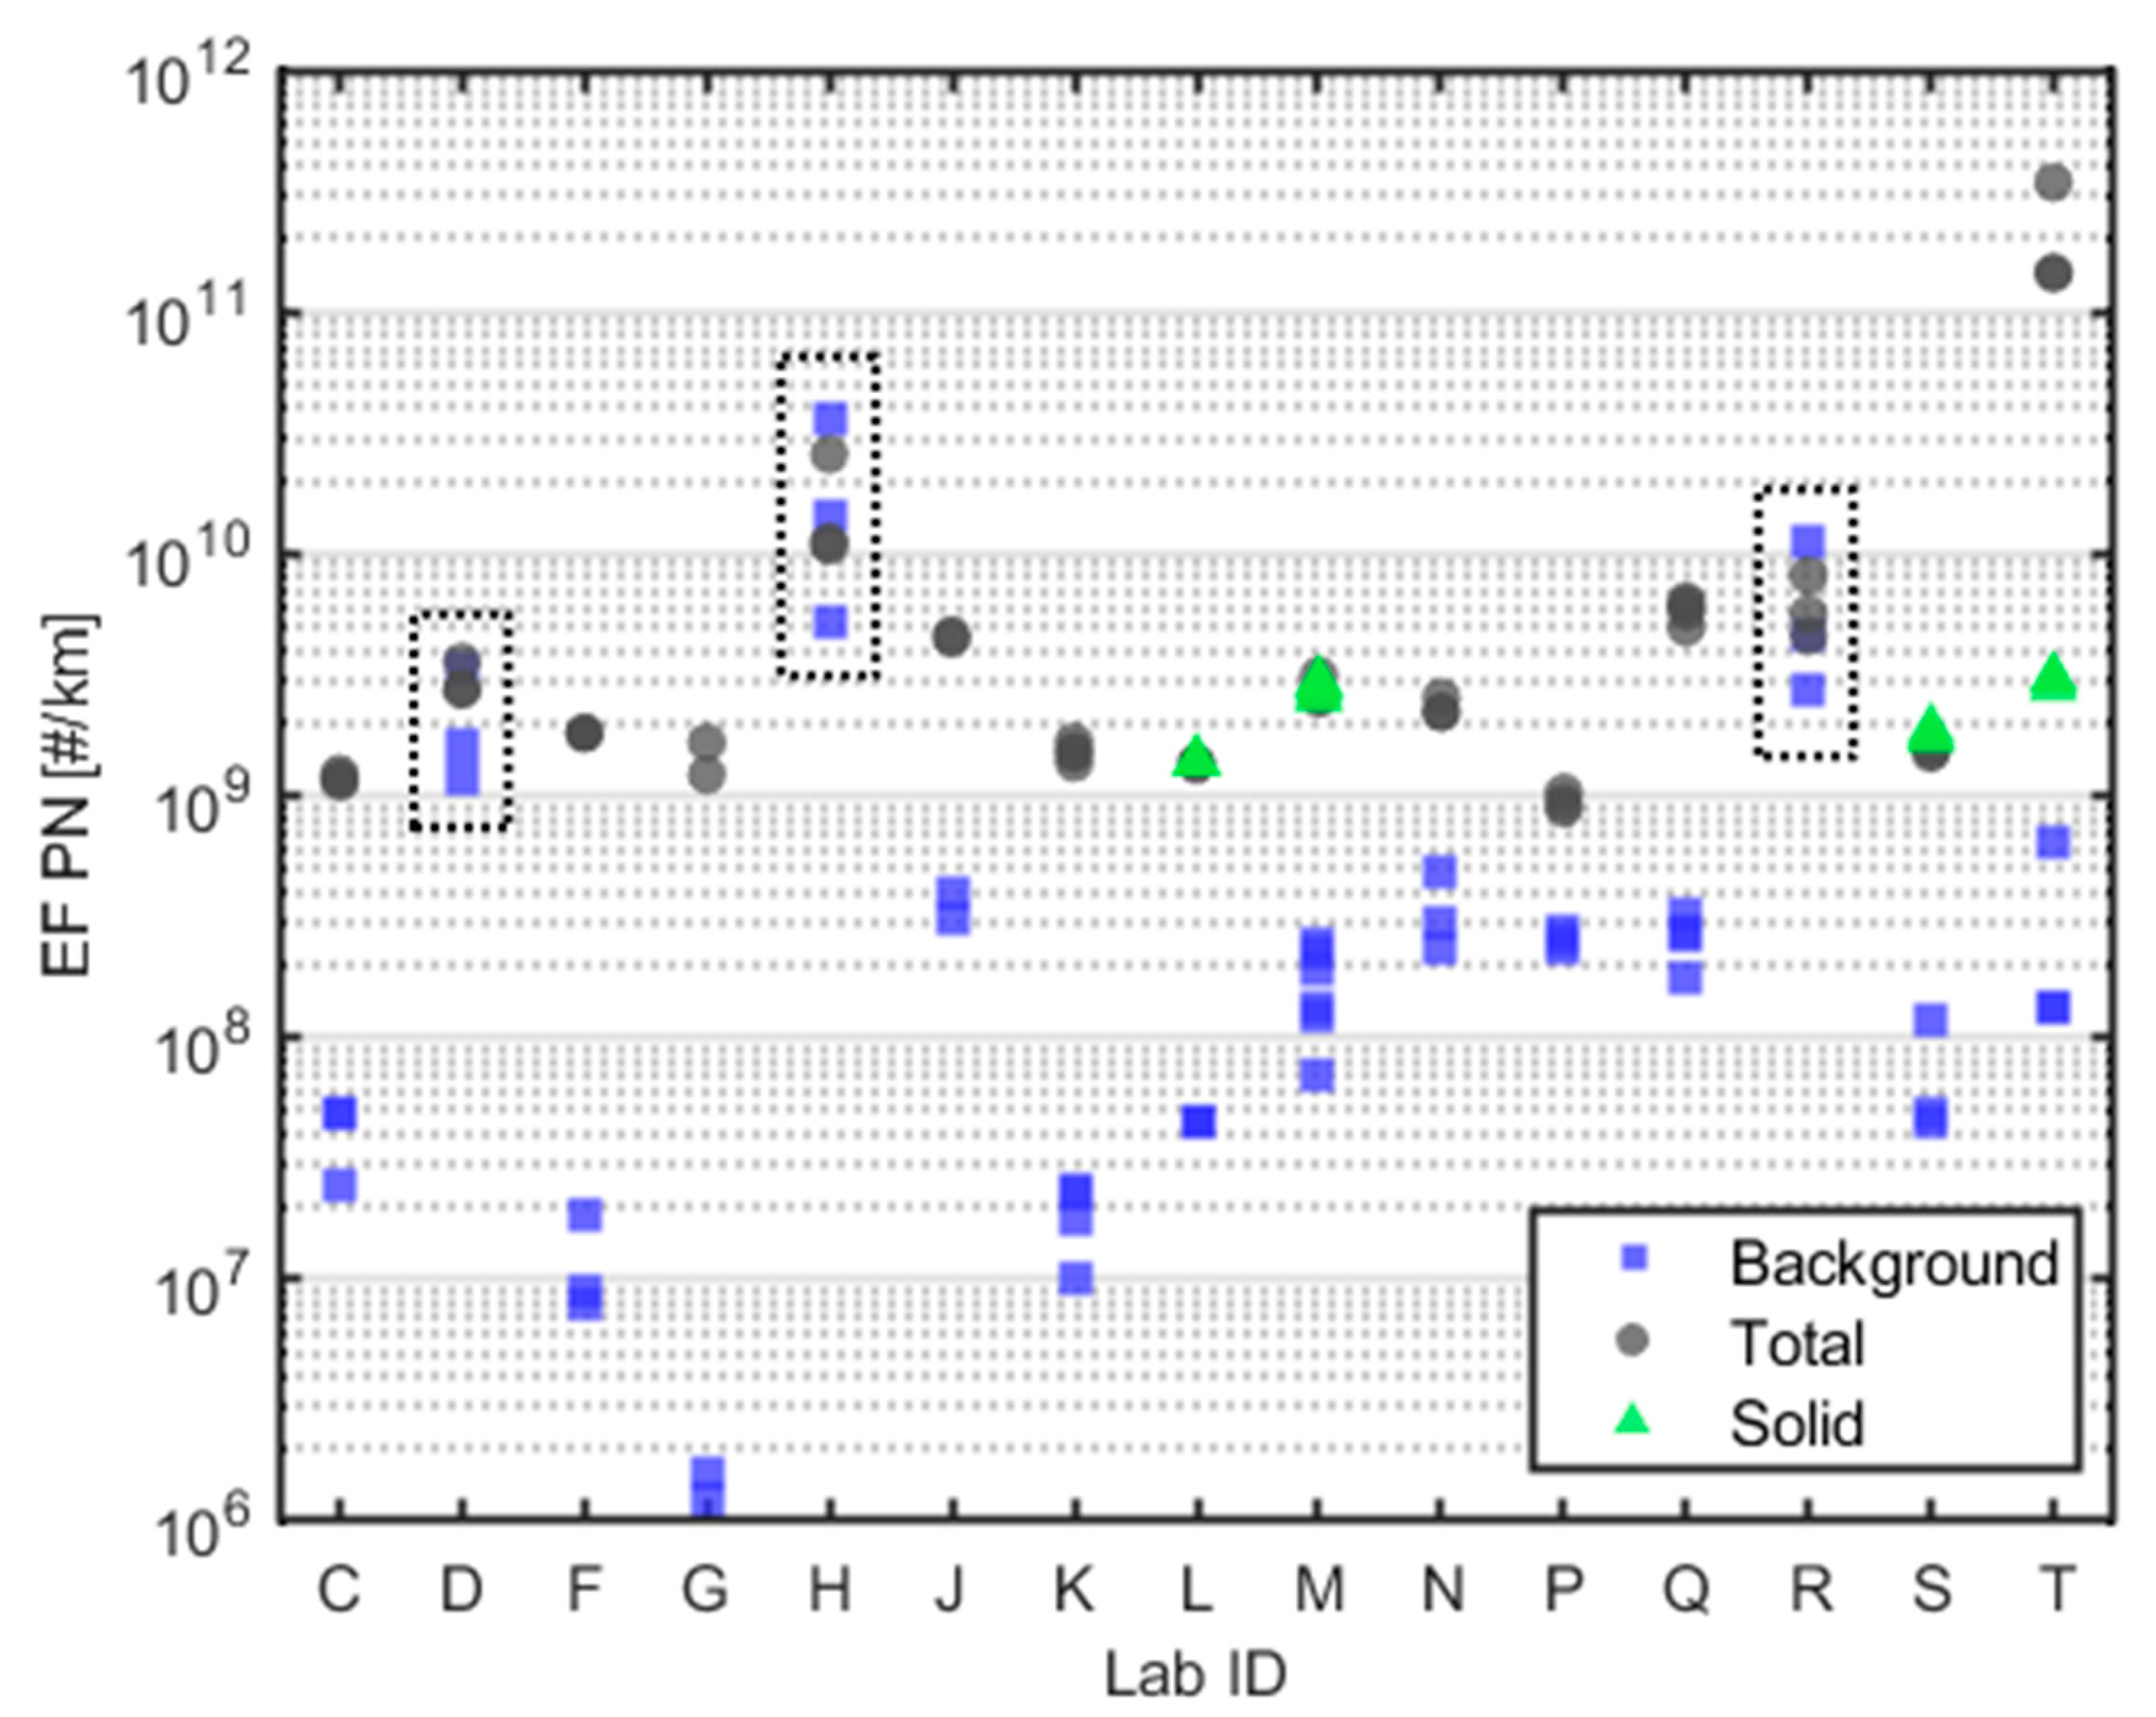
3.1. Test and Background Concentrations

Figure 1 summarises the PN emission factors in # per distance driven for Br1Fa from all testing facilities. Data for background, total, and solid PN are plotted.
To estimate the number of particles generated by the sliding friction between the brake assembly counterparts, the signal-to-noise ratio (SNR) needs to be sufficiently high. The emissions are not detected if the signal is smaller than or equal to the background concentration (“noise”) in the constant volume sampling (CVS) tunnel. On average, the background concentrations in the CVS tunnel were at least one order of magnitude below the measured emission level. However, as shown in Figure 1, 3 out of 16 labs reported PN background concentrations in the same order of magnitude as the actual emission levels.
The PNC signal from these three labs overlay with random noise, e.g., sharp and unexpected spikes (ca. 4 × 10⁴ #/cm³), which may indicate contamination or a faulty measurement system. Additionally, there were sudden changes in background levels as shown in Figure 2. In the case of the three labs, the background levels were similar to actual emission levels recorded during braking events (1 × 10³ − 2 × 10³ #/cm3). To avoid biasing the overall assessments, the results from these labs were excluded from any further data analysis.
Lab F’s measured particle background concentration was low and within the acceptable levels for considering the PN measurements valid (1.6 × 10⁶–2.7 × 10⁶ #/km/brake). However, Lab F measured TPN for Br4 at 1.0–3.0 × 10⁶ #/km/brake. Although the root cause is unclear, the measured values were unreasonably low also when compared to the background levels of the same lab when testing the other brakes. For this reason, Lab F’s measurements for Br4 have been considered outliers and have not been included in the subsequent analysis. The low PN values of Lab F for the drum brake are accompanied by deficient PM emission levels, as reported in Part I of this study [10].
The maximum averaged TPN concentrations in the CVS tunnel ranged between 4.3 × 101 and 1.8 × 10⁶ #/cm3. Four labs reported averaged concentrations above the range certified for the measurement equipment, indicating that the applied dilution factor was insufficient (if any). Using the measurement equipment outside the certified range may have affected the measurement accuracy during high particle concentration events for those labs. For most PNCs with a measurement range of up to 5 × 10⁴ #/cm3, a dilution factor of at least 300:1 might be necessary for TPN measurements (with nucleation mode). This dilution ratio may be too high to sample TPN during each one of the 303 braking events; however, it is required to correctly capture a few higher deceleration events that contribute the vast majority of TPN emissions. Based on the available data it seems that for SPN a dilution ratio of at least 10:1 is adequate to ensure meaningful measurements.

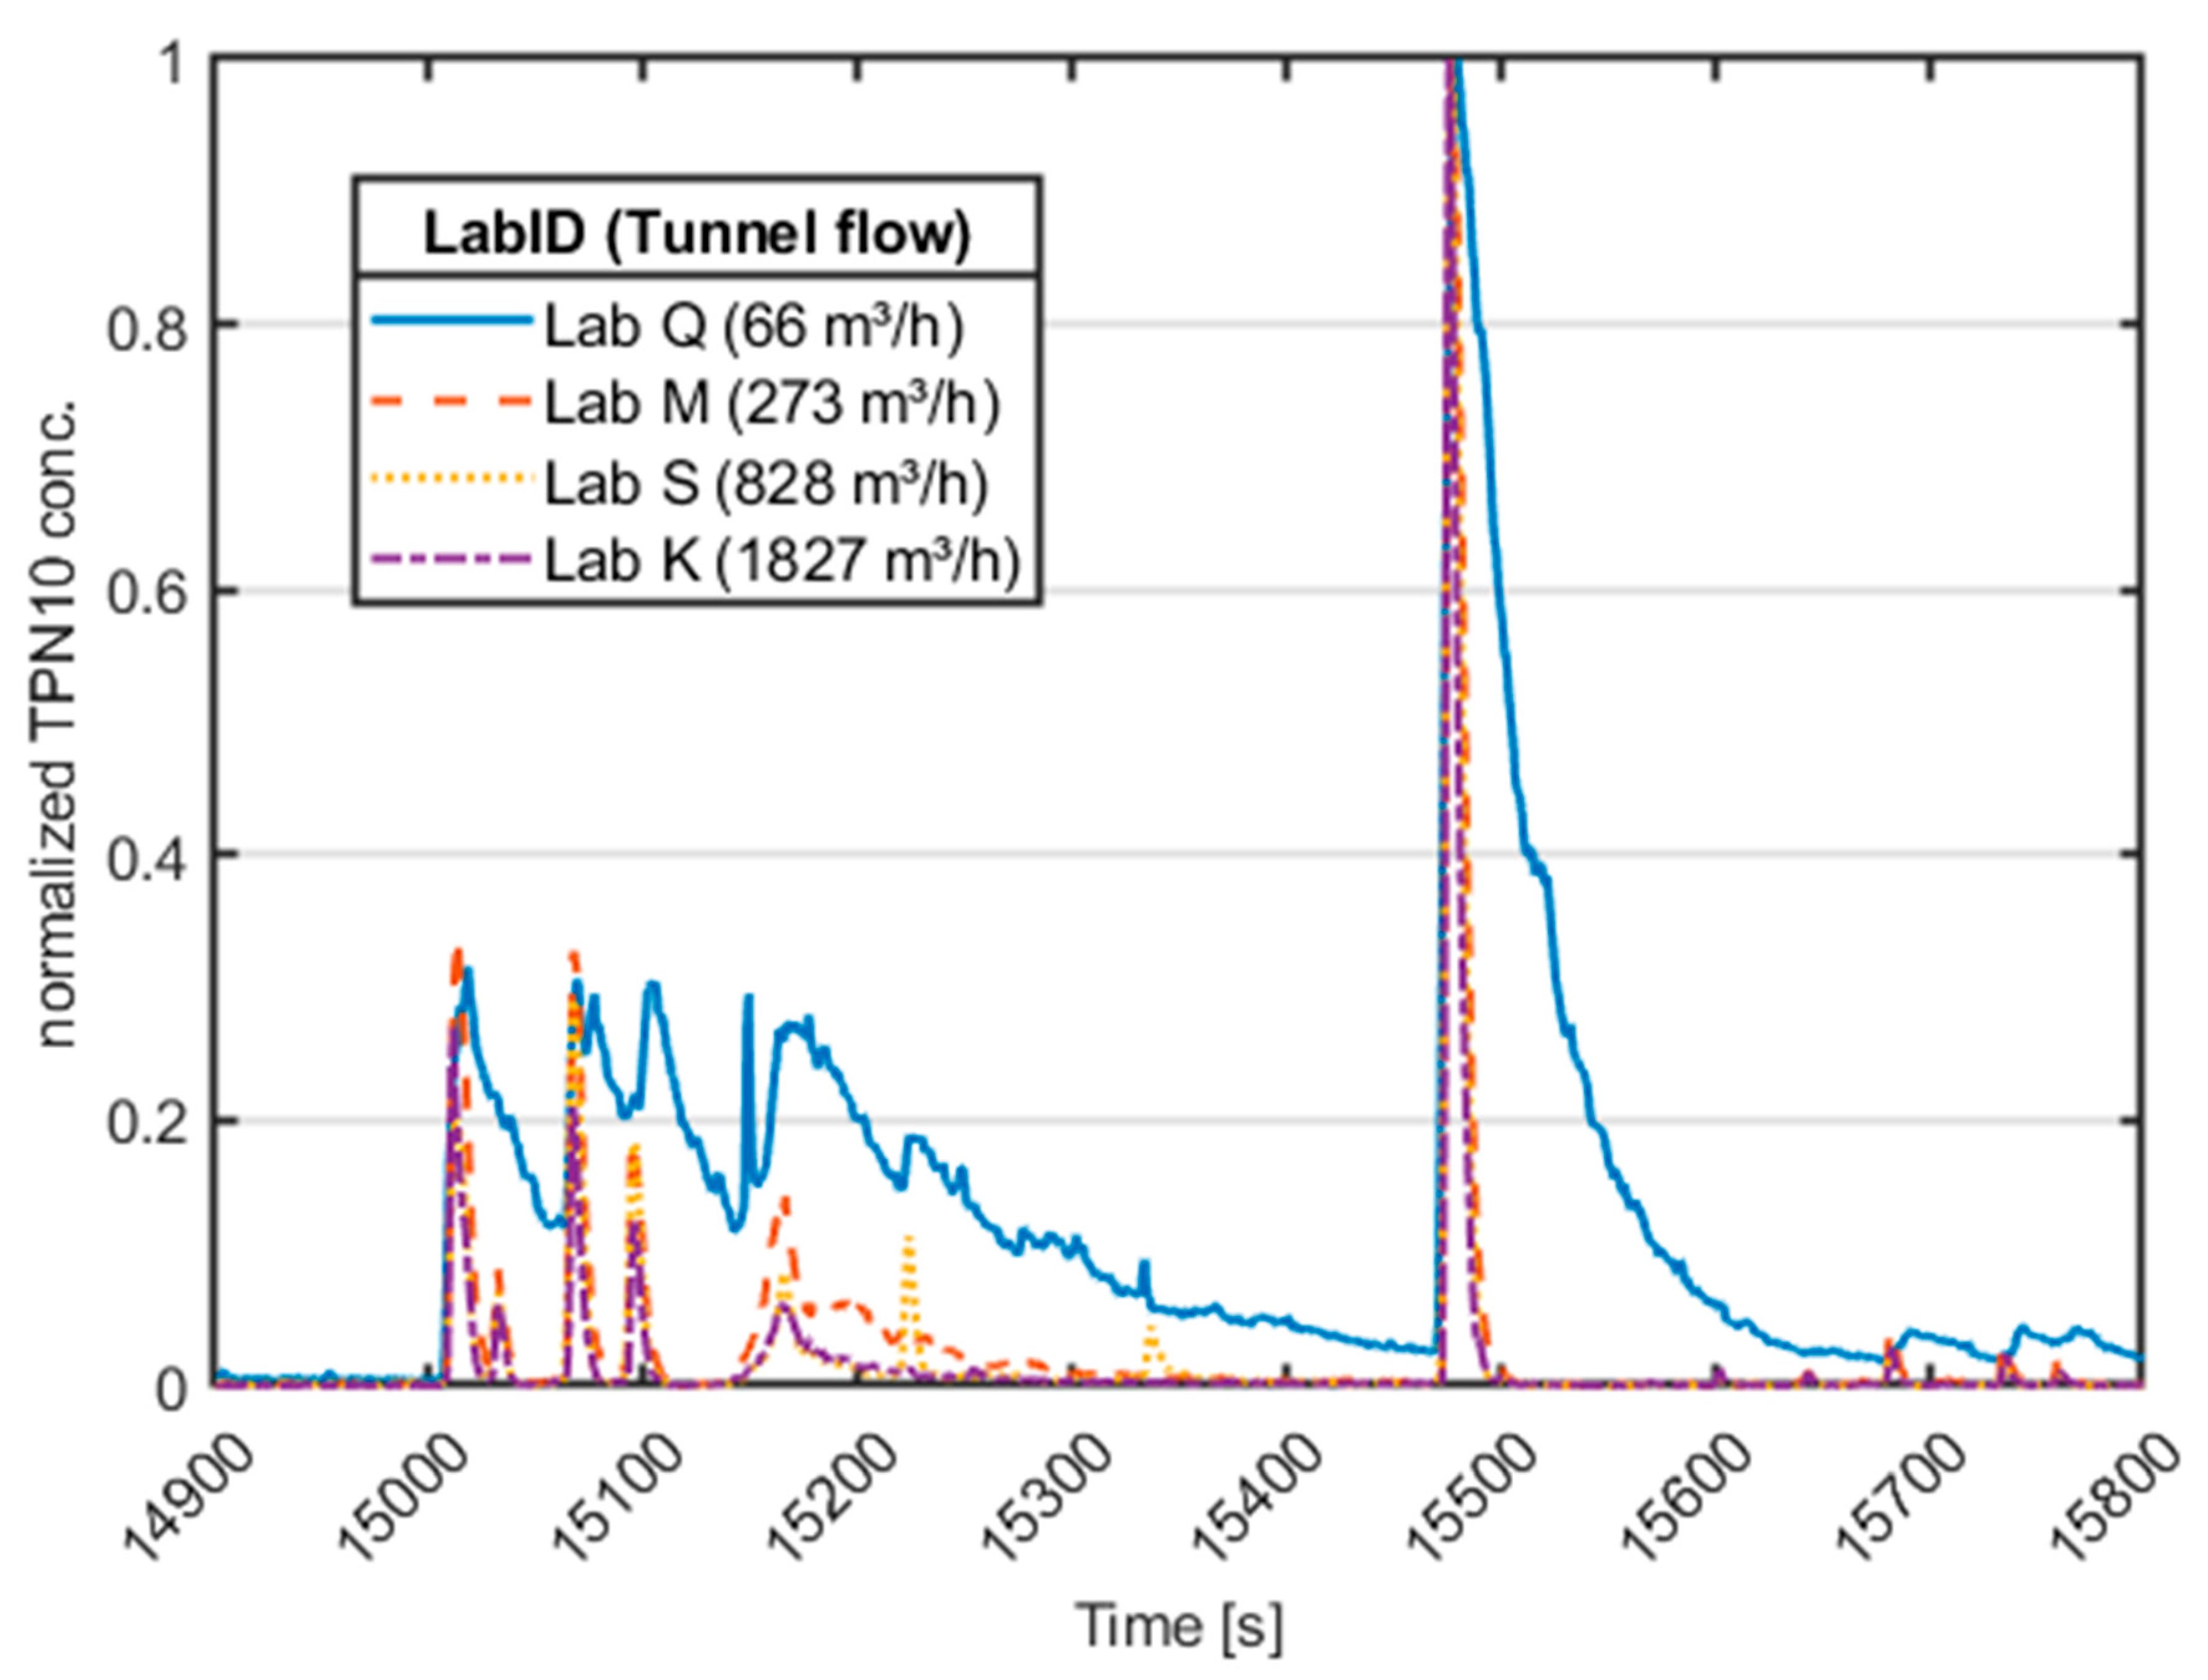
3.2. Tunnel Flow Rate

A constant flow transfers particles generated during the brake cycle to the measurement instruments. Here, constant flow relates to a fluid flow in the tunnel that remains within 5% of a set point throughout a test. The constant flow principle simplifies the calculations. The emissions are theoretically independent of the selected flow rate. In practice, particle losses in the tunnel and the enclosure (due to diffusional, inertial, and/or gravitational deposition) and agglomeration can lead to changes in PN concentrations as a function of operating flow rates. The design and size of the enclosure is also relevant as it can enhance air recirculation zones, which can further increase particle losses.
Figure 3 shows TPN concentrations for Br1Fa during Trip 10 of the WLTP Brake cycle for four testing facilities that applied significantly different tunnel airflow levels.
Lab Q applied 66 m³/h in the CVS tunnel, inducing long particle evacuation times (i.e., 2 min, as estimated by the decay curve in Figure 3). More importantly, the decay of particle concentration between individual brake events was much slower compared to all other labs. The dynamics in the response of the other three laboratories were very similar despite the nearly one order of magnitude difference in their applied flow rates (273 m3/h to 1827 m3/h). The emission behaviour in the results from lab Q is indicative of insufficient evacuation times and/or strong recirculation patterns. Accordingly, data from lab Q were excluded from the remaining analysis.

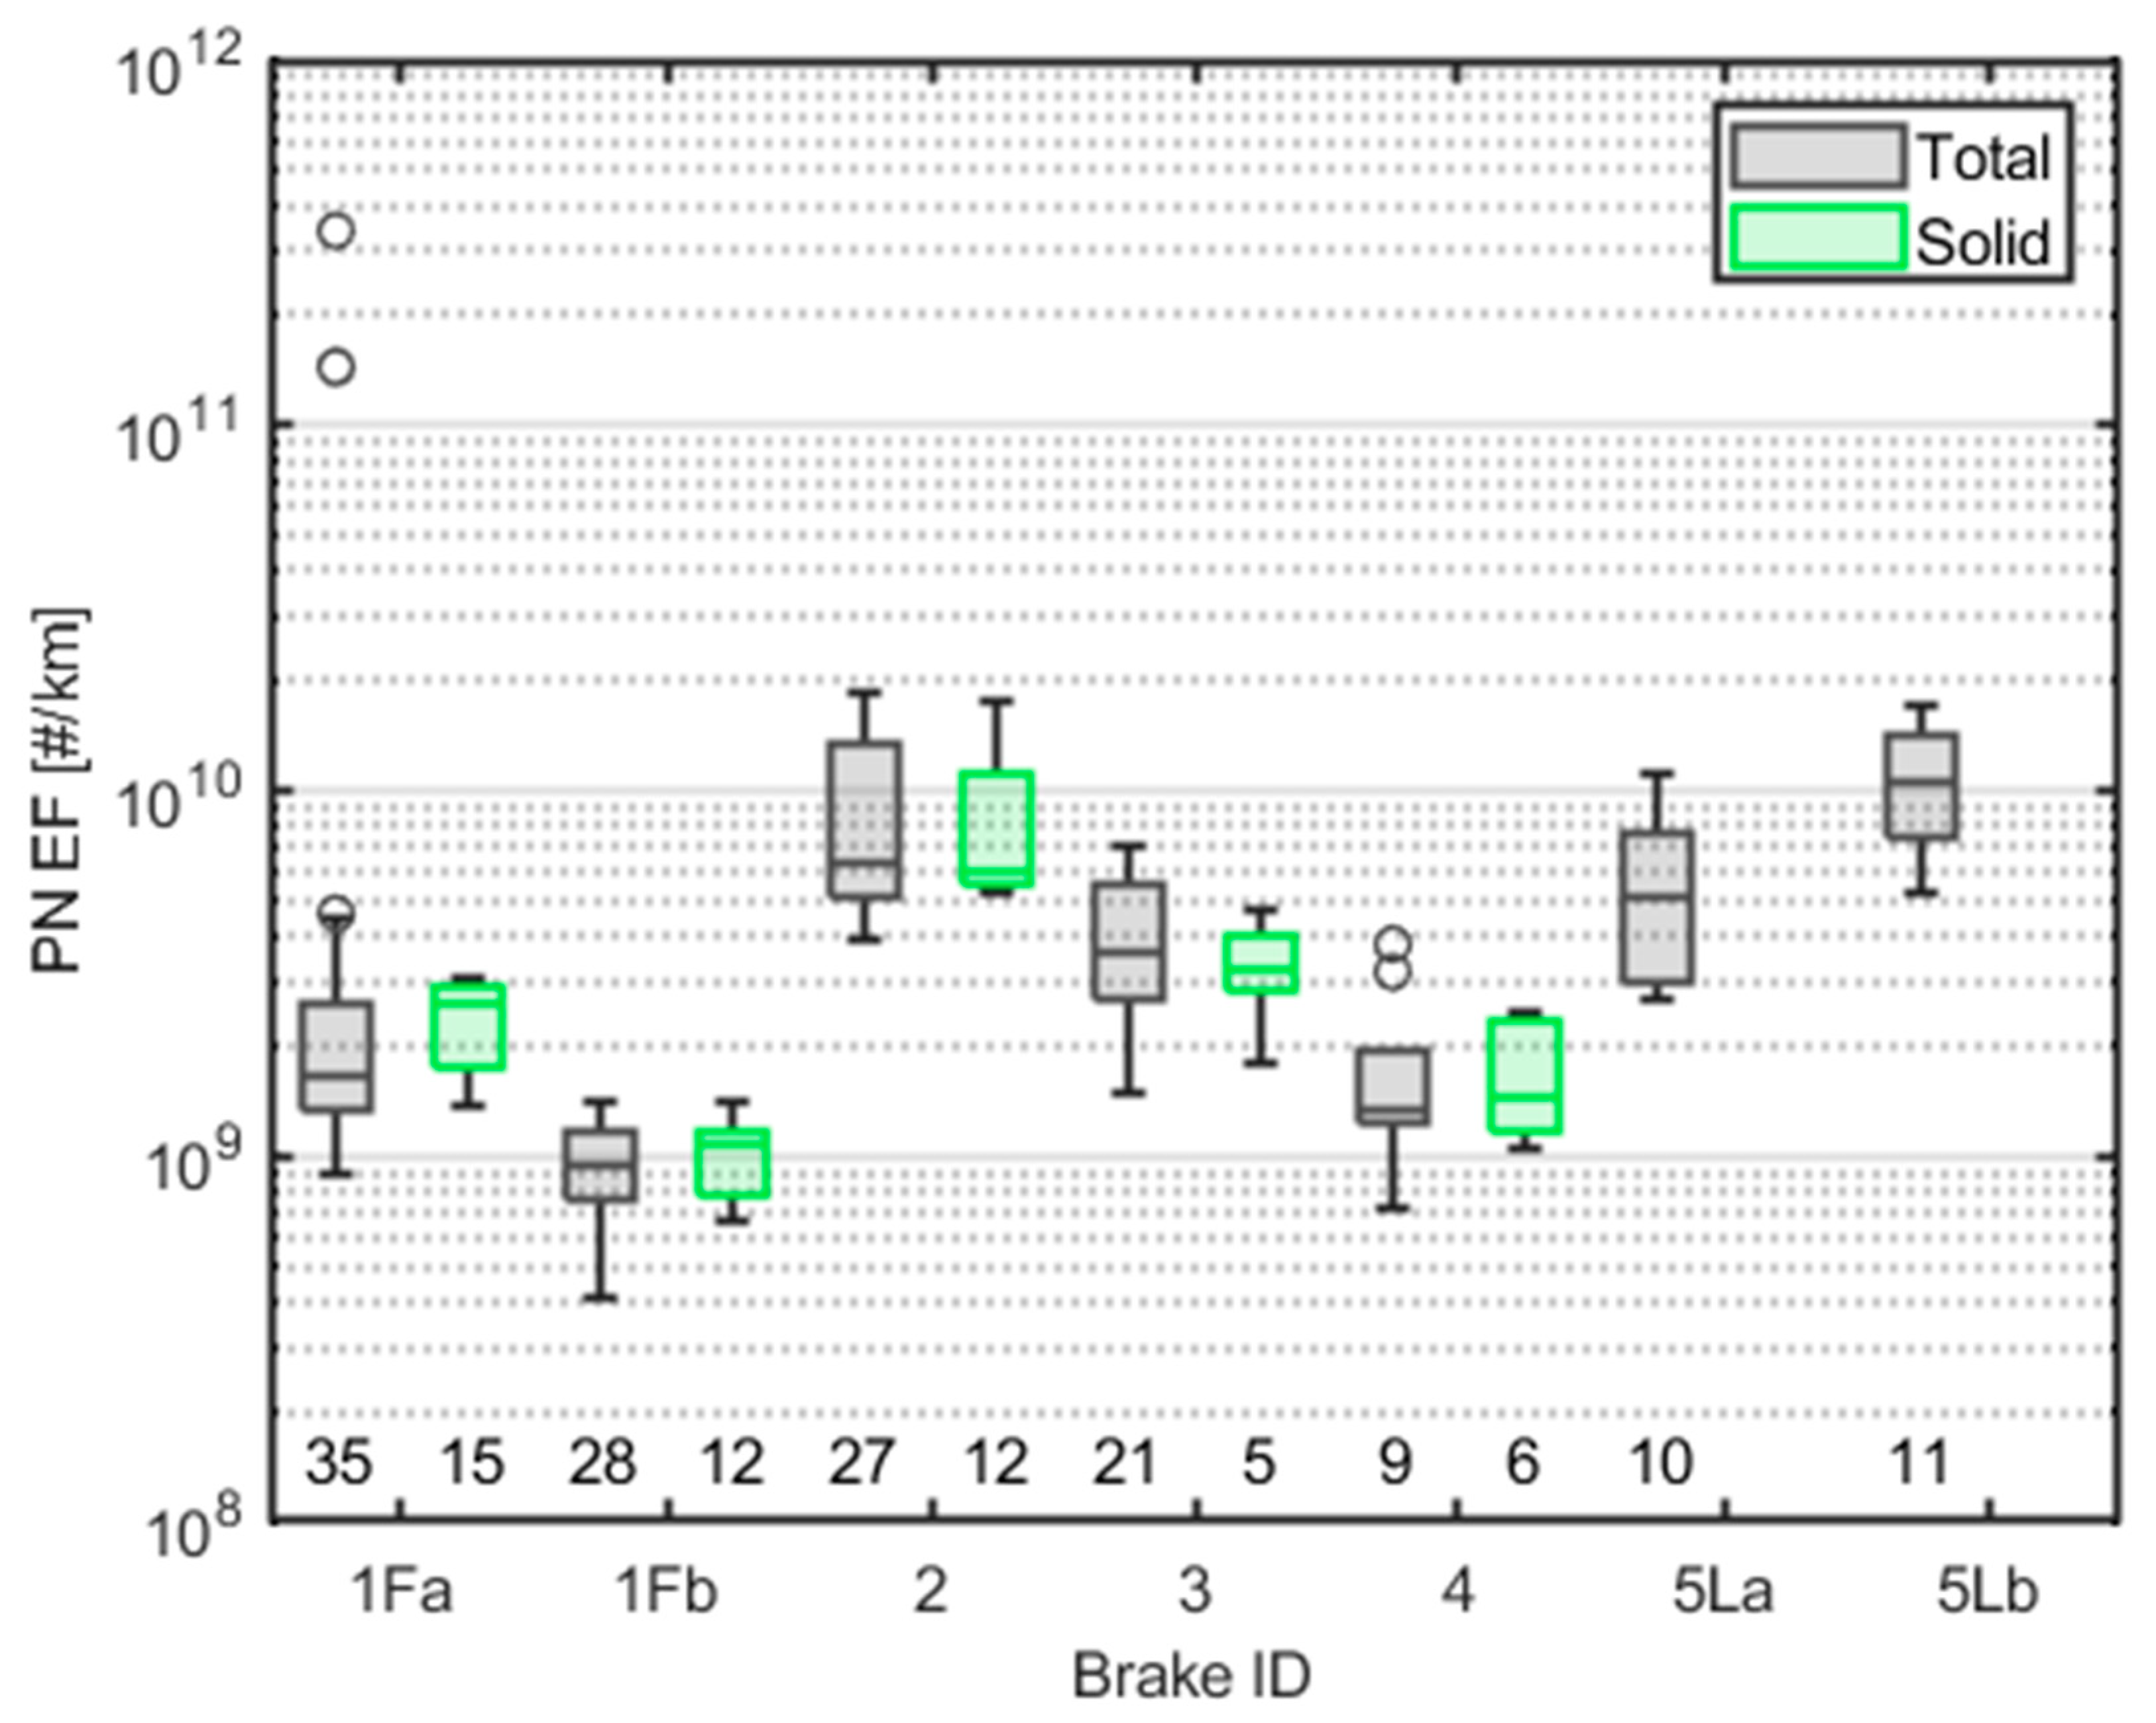
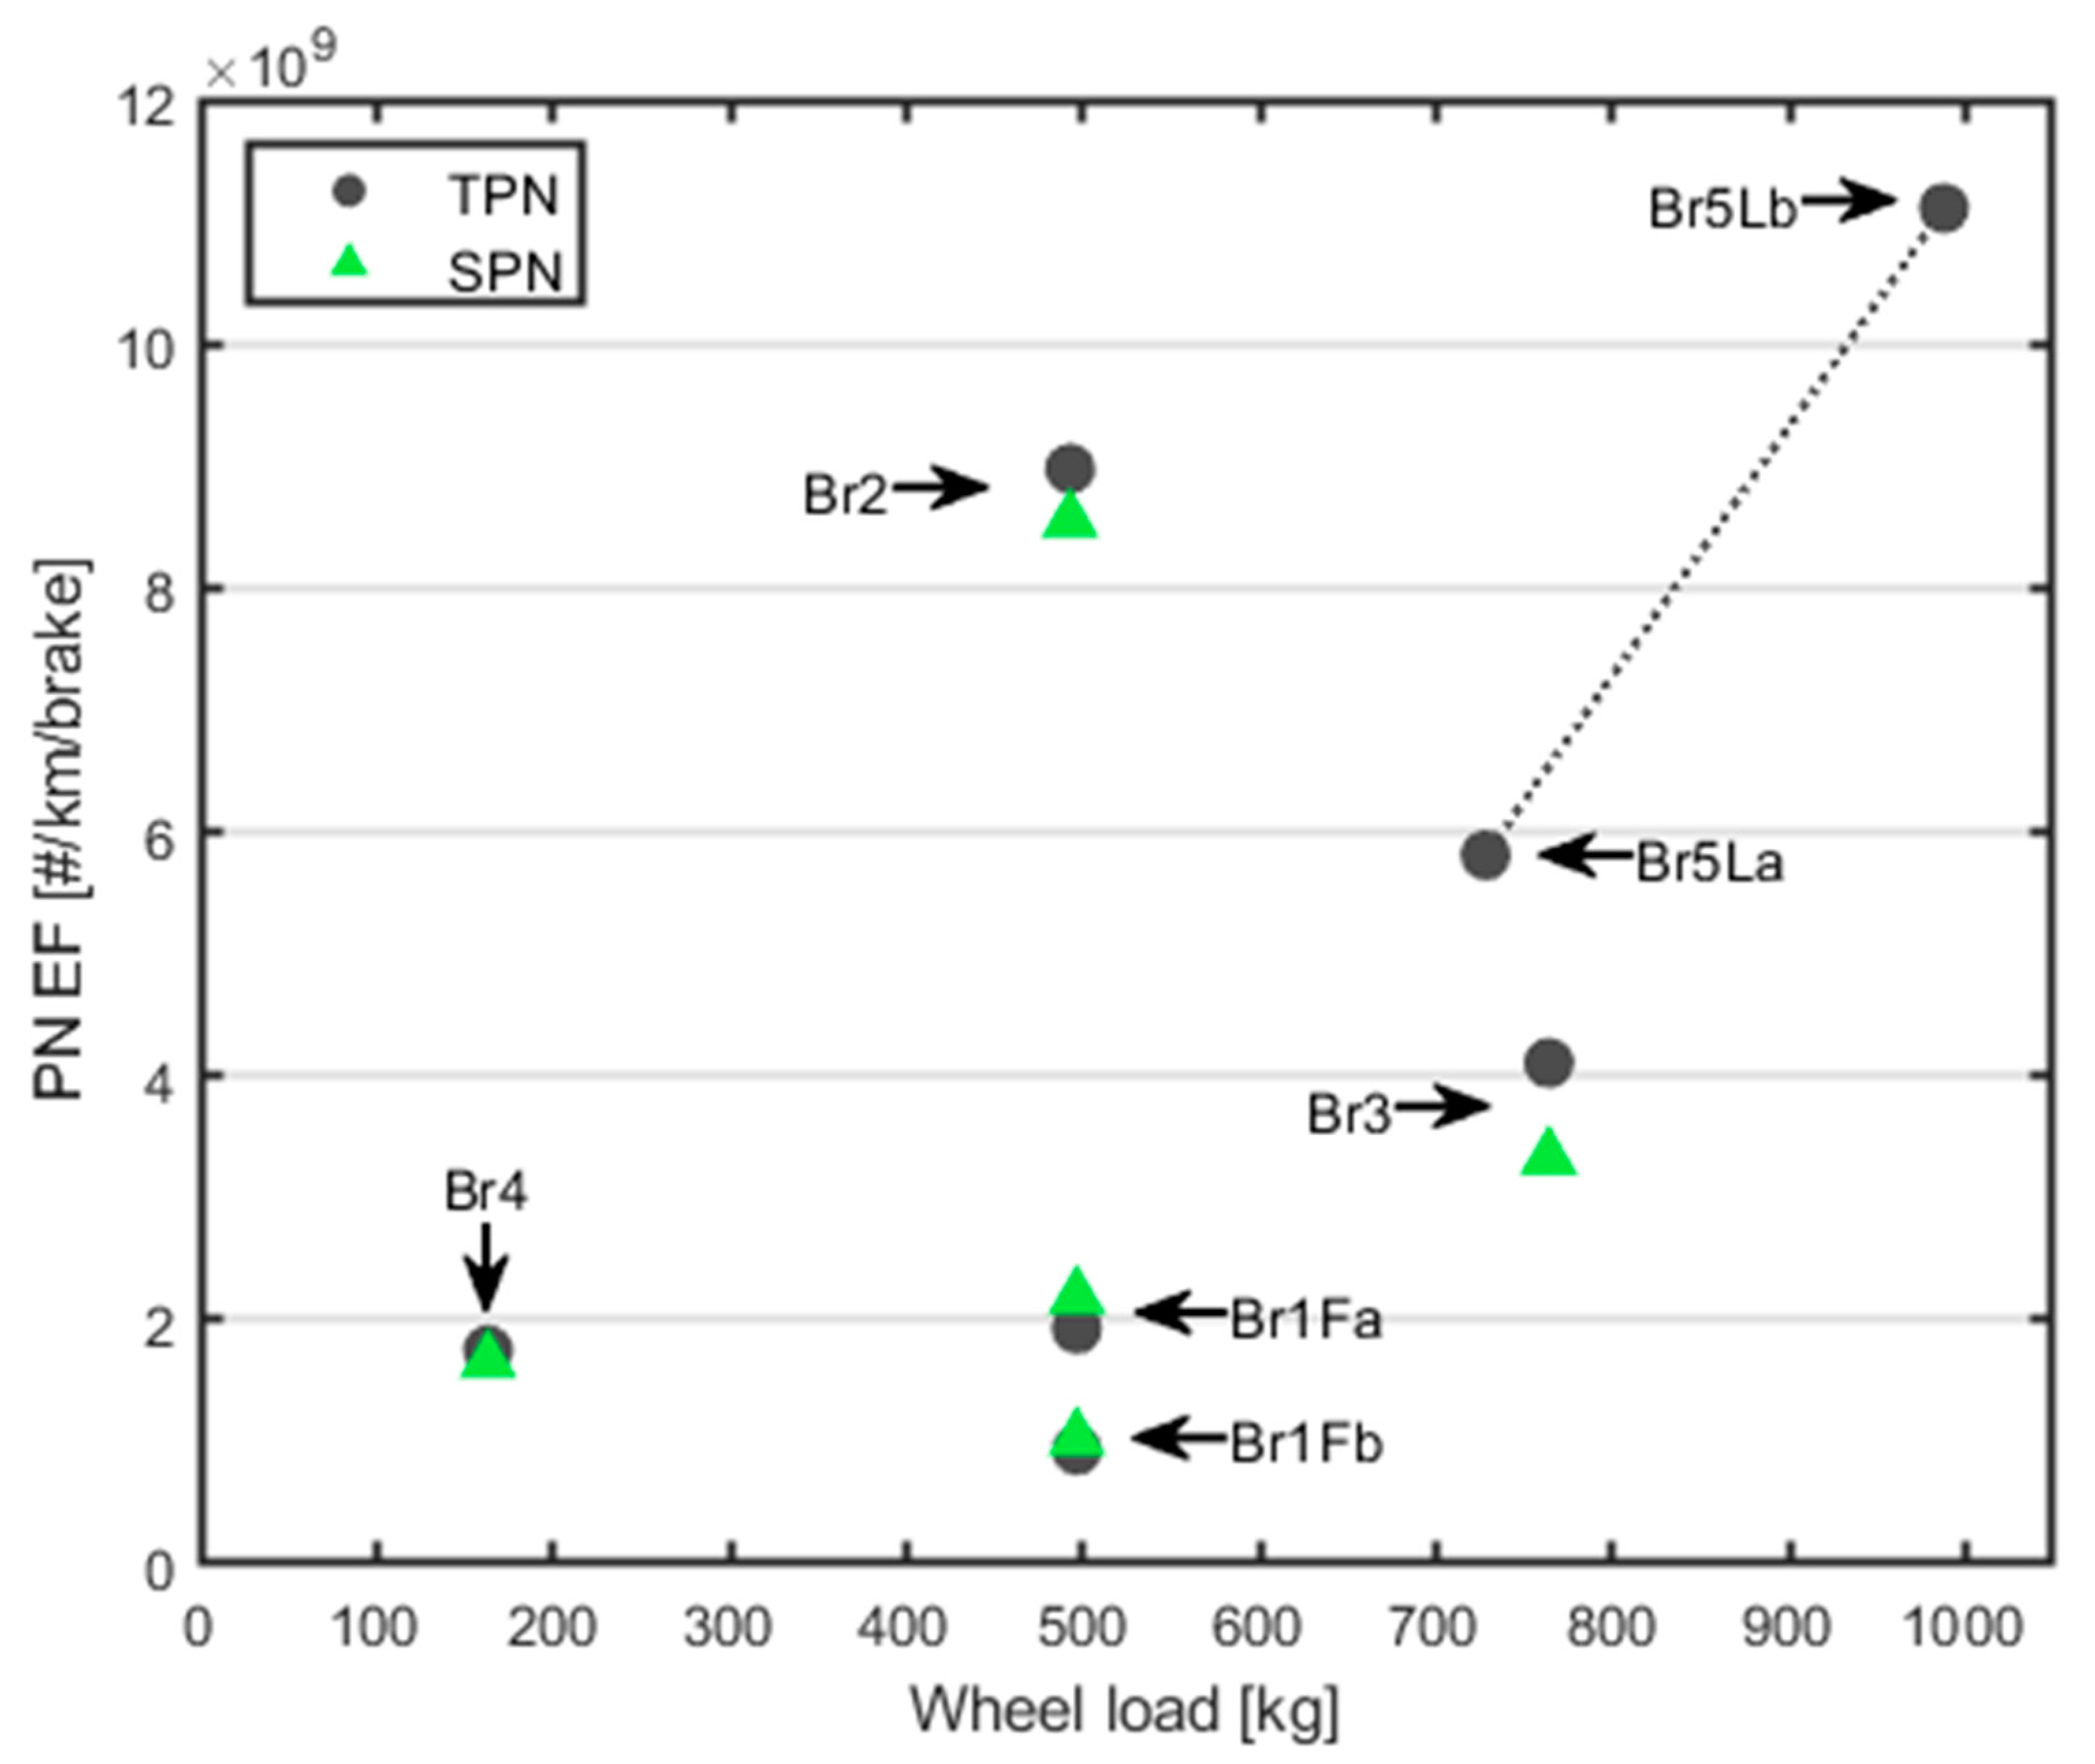
3.3. Total and Solid Particle Number Emissions

The estimated emission factor per brake for both total and solid particle number emissions from 141 measurements is shown in Figure 4. Labs D, H, and R were excluded due to the high PN background, whereas lab Q was excluded due to the low tunnel flow rate.
TPN and SPN emissions are on the same level for each brake tested, varying between 5 % and 19 %, as shown in Table 4. However, one lab measured TPN EFs for Br1Fa close to two orders of magnitude higher (2 × 10¹¹ #/km/brake) than the average TPN EF of all other labs for the same brake (1.9 × 10⁹ #/km/brake). This measurement was excluded from the Br1Fa TPN mean value in Table 4.
The mean TPN EF of the same disc with different friction materials, i.e., ECE (abrasive wear—Br1Fa) vs. NAO (adhesive wear—Br1Fb), was approximately 50% lower with Br1Fb. The SPN measurement exhibited a similar difference in this study—2.2 × 10⁹ #/km per brake vs. 1.0 × 10⁹ #/km per brake. Typically, NAO pads show a lower friction level than ECE pads. An upsizing of the brake corner (by the usage of larger discs and/or larger calliper pistons) is necessary for a similar brake performance both under normal driving conditions and at elevated temperatures. Larger discs (with larger effective radius) compensate for the loss of brake torque and help, with a larger thermal mass of the upsized disc, to better manage the thermal load on the other side.
This study used the same disc for both types of friction material to allow a direct comparison, with the NAO pad improving the emissions behaviour compared to an ECE pad.
Br1Fa and Br2 exhibited, on average, a difference of 5 to 1 in the TPN EF and the SPN EF. Both brakes were of ECE pads and grey cast iron discs (Br2 with two times heavier disc compared to Br1Fa) and the tests applied a similar wheel load to provide comparable friction energy dissipation by the brake system during the cycle. On the other hand, when comparing Br2 to Br3, Br3 had a kinetic energy about 57% higher (+955 kg test mass) than Br2, while the TPN EF was 46% lower. Again, the difference in the SPN EF was similar. These findings indicate that the kinetic energy and other factors are essential for determining the emissions behaviour of different brake systems. Some of these include the type, material, dimensions, thermal mass, and characteristics of the brake disc as well as the type, material, and friction surface of the friction material.
For a given brake system, PN emissions seem to increase with the wheel load (Figure 5–Br5La vs. Br5Lb). While the mass of the cargo van, and thus the testing wheel load, increased by 36%, the average TPN EF almost doubled (+91%), i.e., 5.8 × 10⁹ #/km/brake vs. 1.1 × 10¹⁰ #/km/brake. The emission levels are uncertain since they are based on the average TPN from only 12 measurements in four different labs. Although the wheel load seems to be the most important factor that defines PM emissions [10], TPN depends not only on the energy dissipation, but also on other factors, such as the release of semi-volatiles due to the temperature increase. Indeed, there is an increase in the TPN emission levels with the test load; however, as discussed, the wheel load alone cannot indicate the TPN for a brake test.
The average TPN EF of the rear drum brake (Br4) is slighter lower (−9%) and, thus, at a comparable emission level to that of the reference brake (Br1Fa). The drum brake TPN EF is comparably high, considering its low test mass and enclosed drum brake design. One possible explanation is that small particles may emit from the drum brake without significant losses. The PM data results show that the drum brake’s PM2.5 to PM10 emissions ratio is much higher than that of the disc brakes, indicating that the drum brake may retain larger particles to a lesser extent compared to smaller particles [10]. Notably, emission levels of 1.0–2.0 × 10⁹ #/km/brake are considered generally low; therefore, the differences might not be relevant.
The average ratio between maximum and minimum measured TPN EF from all labs is 4.4 ± 0.8, excluding outliers (Lab T for Br1Fa). The SPN ratio is approximately 40% smaller with a mean ratio of 2.5 ± 0.4. Considering only the subset of labs that measured both SPN and TPN in parallel, the TPN ratio is 2.3 ± 0.7. This ratio indicates that TPN and SPN max/min ratio is comparable if no volatiles occur. The SPN ratios agree with the min–max ratio from vehicle exhaust ILS studies (2.0–3.5) [37,38].
As mentioned, one lab measured very high TPN EFs for Br1Fa. As shown in Figure 6, TPN concentration increased about three orders of magnitude compared to SPN concentration during Trip 10. The increase in concentration occurred when the components (brake disc, brake pad, or both) reached a specific temperature, not necessarily as a direct effect of any particular brake event. The observation of a critical temperature at which PN emissions increase by orders of magnitude is well documented in the field and explained by the generation of volatile particles originating from the organic binder material in the pad through subsequent evaporation at local hot spots and condensation [39]. Lab T observed these volatile particles during all emission tests and the bedding at a maximum disc temperature of about 167–170 °C. It is unclear why no other lab observed volatile particle emissions even though they tested the same material (originating from the same production batch) under the same nominal test conditions. Still, even higher temperatures were noted, e.g., one of the labs reached disc temperatures of up to 209 °C without increasing PN emissions, as shown in Figure 7.
One possible explanation is the topical super-saturation ratios in the enclosure, which depend–among other factors – on the airflow profile. An alternative explanation relates to the accuracy of temperature measurement. Despite the well-established instructions for installing the temperature thermocouples, not all installations were identical amongst the different testing facilities; therefore, the reported temperatures are not directly comparable. More research is necessary to better understand the formation of such volatile particles.
Figure 8 shows the TPN run-in behaviour of two brake pad materials (ECE vs. NAO) using the same disc (grey cast iron). For both materials, there is a decrease in the emission level with each repeated cycle. While Br1Fa seems to reach stable PN emissions after the third run, Br1Fb reaches stabilisation after the fifth WLTP-Brake cycle run. However, it remains unclear if the emission level would further decrease with additional WLTP-Brake cycle runs. Comparing the TPN emission level from the first run to the mean emission level during runs 6–8, the PN levels are 32% (Br1Fa) and 54% (Br1Fb) lower. The only exception is Lab T, which observed volatile particles with material Br1Fa, where TPN emissions decreased by 90% (not shown here). Overall, the interlaboratory results indicate that five WLTPs are adequate preconditioning and provide a suitable bedding procedure for stabilising the brake system’s emissions behaviour.

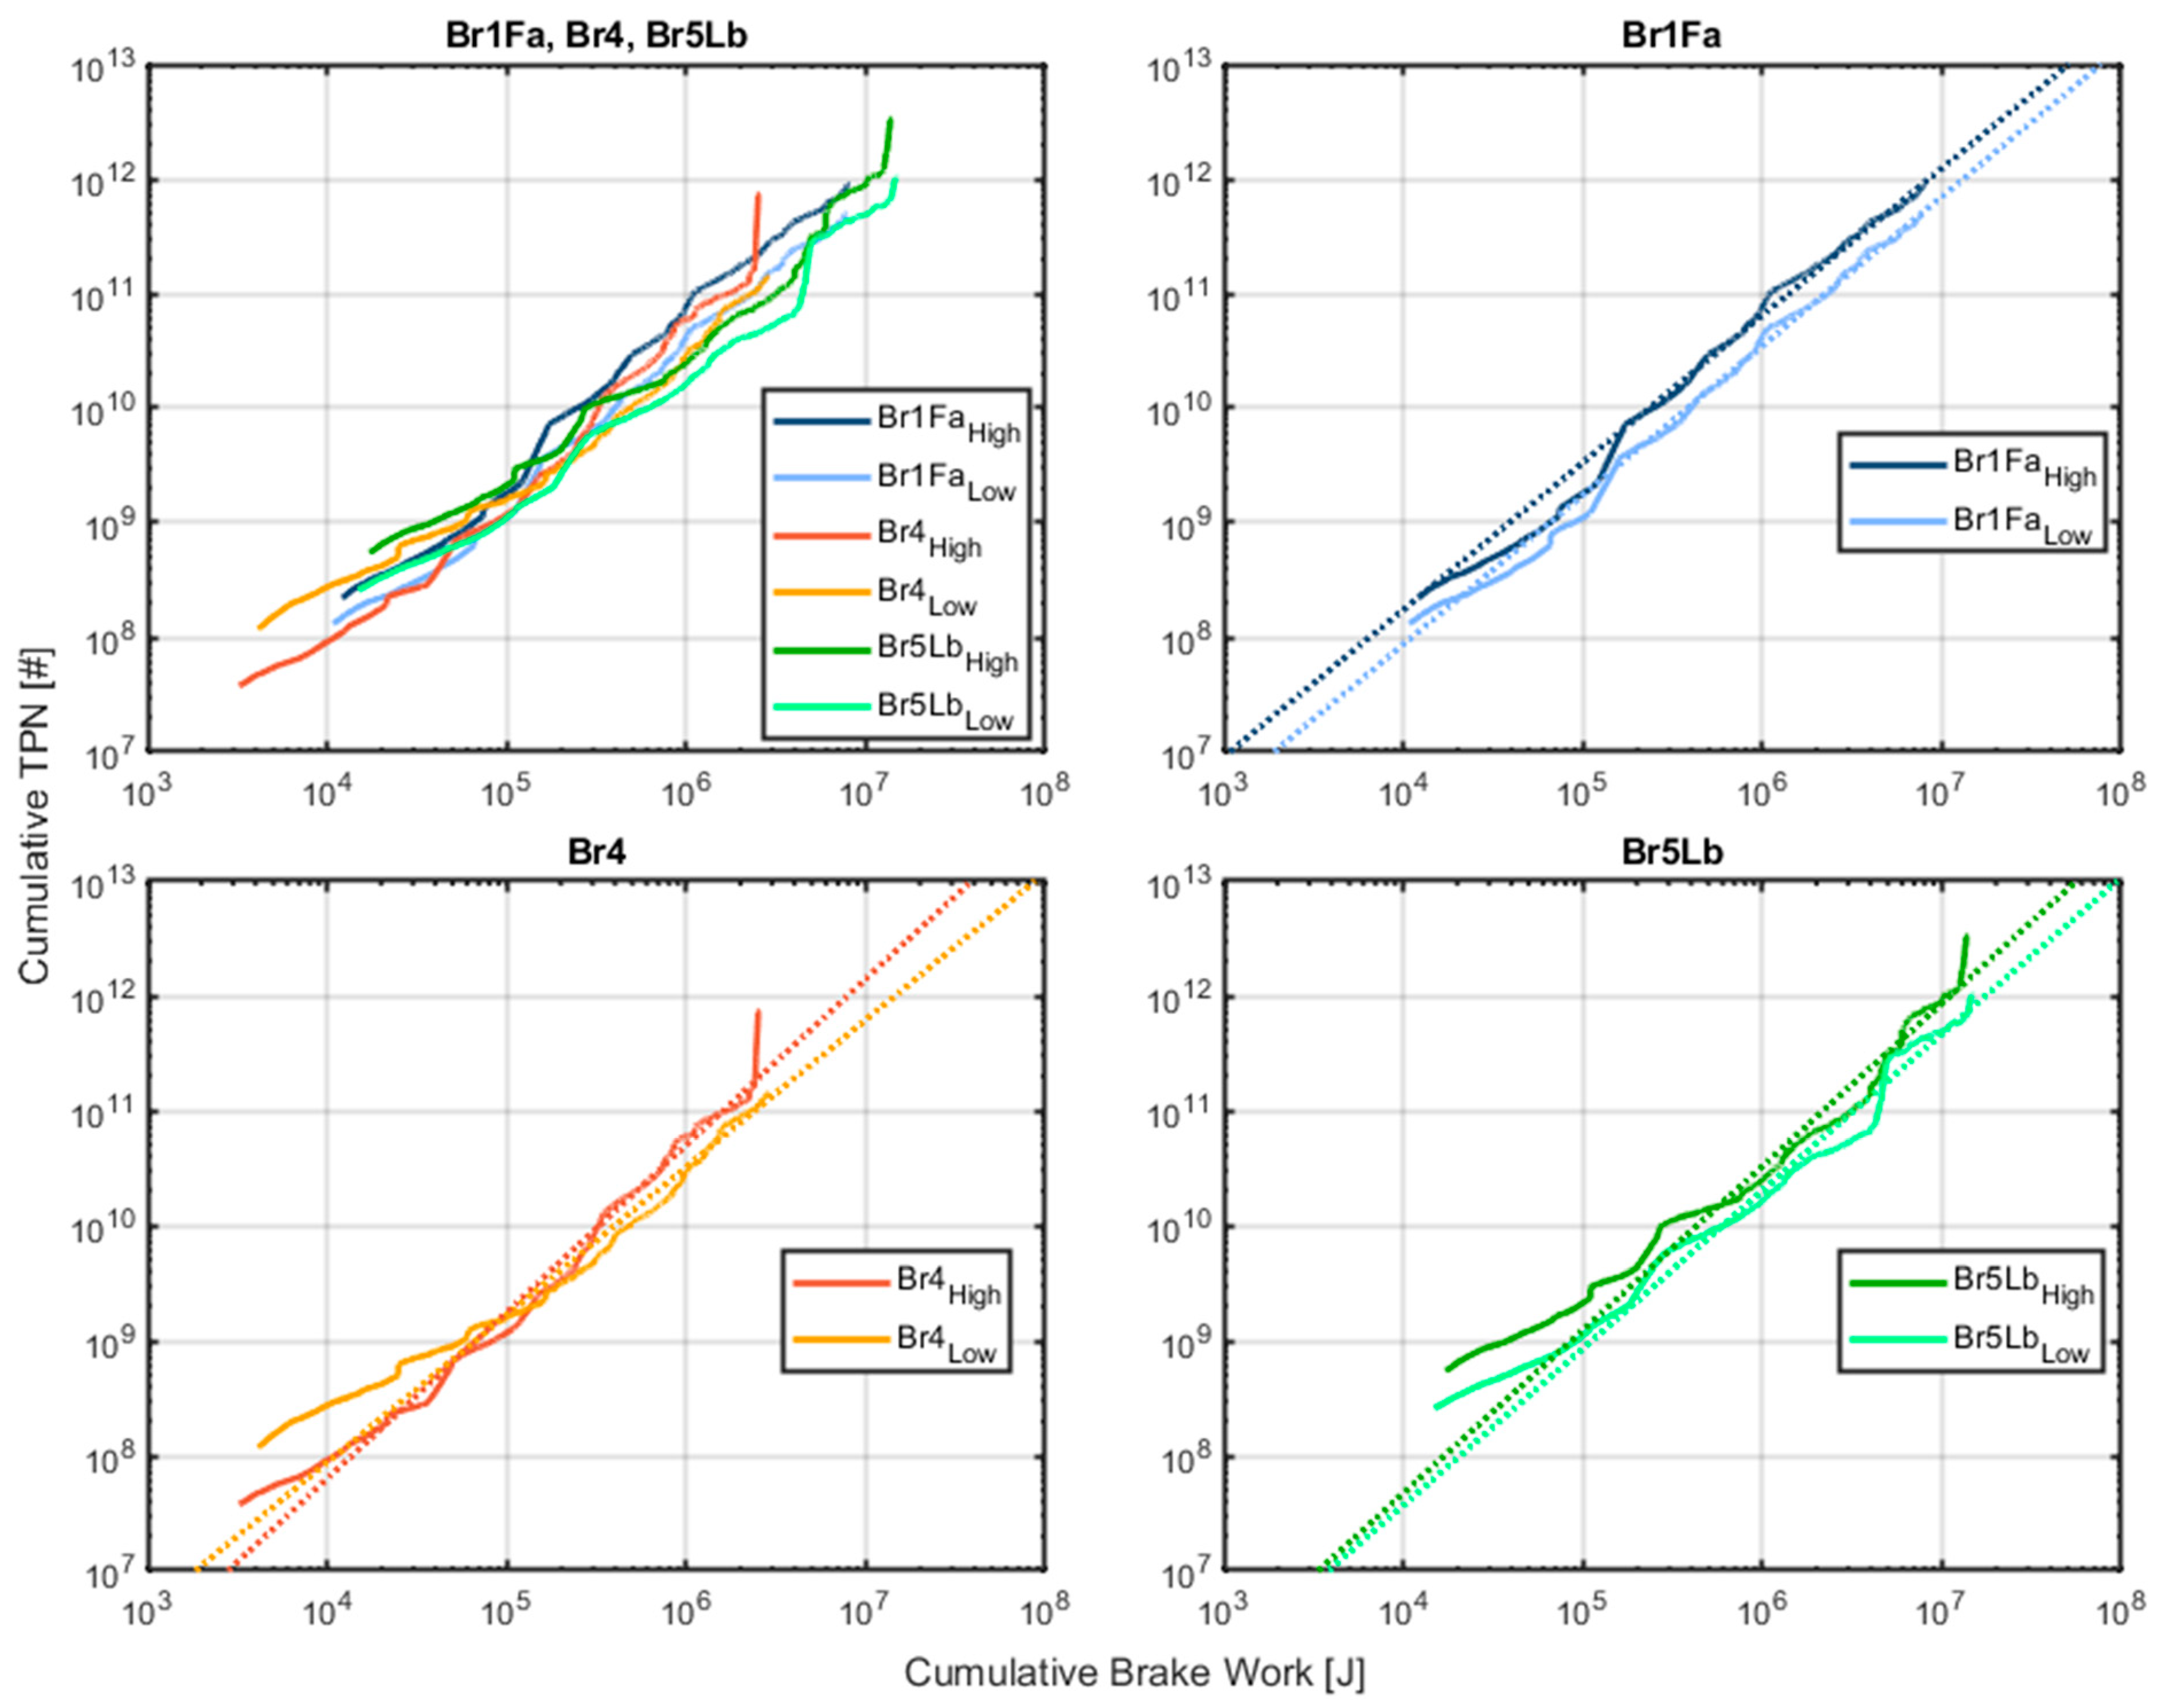
3.4. Particle Number as a Function of Friction Work

The dissipation of the vehicle’s kinetic energy during braking is the primary mechanism that triggers sliding friction at the contact between the friction material and its mating part (brake disc or drum), temperature increase, and brake wear, which causes the release of brake particles.
The trends illustrated in Figure 9 represent three pairs of test results from three different brakes (Br1Fa, BrF4, and Br5Lb). The three brakes represent the lowest, average, and highest inertia values during the ILS. The log–log graph shows the highest and lowest TPN results among labs C, F, G, J, K, L, M, N, S, and T, excluding the measurements with nucleation mode from Lab T. When assessing the results, the trend confirms that friction work predictably generates submicron particles. Some brakes and some labs exhibited a higher sensitivity to the kinetic energy for certain brake events, as shown near the end of the test (Trip 10), which includes several deceleration events at speeds above 100 km/h. These high-speed events dissipate more than five times the energy compared to the average speed of the entire WLTP-Brake cycle. Even though all the brakes exhibit similar slopes and shapes, the level differs, especially for test 1a, where the third repetition of the brake emissions section for Lab J generated about 80% more TPN than the first repeat on Lab N. Nevertheless, the difference in total kinetic energy was 3%.
Of interest from this ILS is the significant increase in TPN during Trip 10 on brake Br4 (R-squared factor of 0.45 using a power regression line) from Lab N and both tests for brake Br5Lb (R-squared factor of 0.79 for Lab M and 0.93 for Lab F using a power regression line).

4. Summary and Discussion

An interlaboratory study on LDV brake emissions involved 16 participating labs with five brake systems measuring mean TPN concentrations of 9.4 × 10⁸–1.1 × 10¹⁰ #/km/brake. Mean TPN and SPN emission levels were comparable, except for one lab that measured very high volatile particle emissions for one brake system. A critical brake temperature that is unique for each braking system is described as the most important metric for the occurrence of volatile particles. However, the exact mechanisms and conditions that may fully explain the occurrence of volatile particles are still missing. Thus, when measuring TPN brake emissions one should be aware that testing the same brake can result in very different emission levels. The current UN GTR includes a proposal for TPN measurement to narrow the knowledge gap—compared to exhaust volatile nucleation mode [15,32]. When more data become available, the stakeholders can improve their understanding of the phenomenon and its plausibility in real-world driving. The tightening of the testing protocol with stringent measures introduced in the GRPE-2023–4e aims to reduce the measurement variability; however, further measurements are required to reassess the variability.
Based on the observed levels of background PN, the PMP has decided to limit the PN background concentration to 20 #/cm3 to avoid compromising actual emission levels. This background level (20 #/cm3) corresponds to PN emission levels of 1.0 × 10⁸ #/km/brake at low tunnel flow rates (~250 m3/h) and 5 × 10⁸ #/km/brake for high tunnel flow rates (~1250 m3/h). Given that the proposed minimum allowed tunnel flow rate is 100 m3/h and the maximum is not expected to be higher than 1500 m3/h, these background PN concentrations are considered acceptable for measuring brake PN emissions, as they are one order of magnitude below the emissions measured in this study.
The mean TPN of Br1Fb is about 50% lower than its ECE counterpart. This proportional difference between ECE and NAO friction material matches the PM2.5 results reported in Part I. Sedan vehicle Br2 emitted more than the cargo van Br5La tested at standard conditions, and about 80% of the same cargo van Br5Lb tested at 90% payload conditions. Thus, a heavier vehicle does not necessarily induce a proportional increase in PN emissions. In addition, Br2 carried an average brake temperature of about half of the average temperature of Br5Lb. Thus, a hotter disc does not generate more PN emissions as long as it does not reach a critical temperature. Other factors directly applicable to these two brakes are the brake disc design, friction formulation (composition and size distribution), calliper design, or heat transfer characteristics. Apart from the geometrical features and the disc’s mass, the disc’s hardness and microstructure can have a noticeable effect on PN emissions [40]. Hence, it becomes imperative to investigate different factors of brake design and study their effects together as a system on PN emissions.
The proposed UN GTR regarding PN measurements includes the sampling probes’ placement, the tunnel’s sampling plane arrangement, and an isokinetic ratio between 0.6 and 1.5. The UN GTR includes other specifications, e.g., specifications on minimum nozzle sizes, the maximum length of transfer lines, restrictions on bends in sampling lines, and not-to-exceed residence times in sampling lines. Despite isokinetic sampling not being examined during the ILS and there being no solid conclusion on how it affected the repeatability and reproducibility of the measurement, it is expected that the newly added provisions related to the probe, nozzle, transfer lines, and residence time will help towards the direction of harmonising the overall measurement procedure for both TPN and SPN (see discussion in [35]). However, as explained previously, TPN measurement depends also on other parameters.
Testing facilities B, D, and R omitted a pre-classifier before the PNC. To this effect, the GRPE-2023-4e introduces a mandatory cyclonic separator (pre-classifier) with a 50% cut-off point between 2.5 µm and 10 µm and a minimum 80% penetration efficiency for particles of 1.5µm. However, high-efficiency filters in the tunnel and the PN systems are still of high importance to reduce small particle background PN. Requirements for high efficiency filters were introduced in the GTR. Further improvements focus on best practices and proper handling of the PN measurement equipment by introducing a PN system verification procedure.
The ILS showed that flow rate could impact the PN results. For this reason, the proposed UN GTR restricts the flow rates permitted, i.e., a minimum flow between 100–300 m³/h and a maximum flow of at least five times the minimum flow and at least 1000 m³/h higher than the minimum flow is foreseen. Furthermore, the UN GTR introduces stricter design specifications on the brake enclosure to harmonise the design of brake enclosures compared to the wide range of designs participating in the ILS. The proposed UN GTR mandates a symmetrical design including limits for the minimum and maximum dimensions. There are new requirements for airspeed uniformity to validate the setup and enhance the reproducibility amongst test facilities. These specifications shall ensure system comparability regarding cooling of the brake system and particle evacuation and transport.
Another important lesson learned relates to the use of the dilution system. As discussed in Table 3, almost half of the participating labs did not apply a dilution system despite the requirement. The lack of proper dilution generated concentrations above the certified range of the PN measurement system in four testing facilities. It is known from the exhaust measurements that a dilution factor of at least 1000:1 is necessary for TPN measurements with nucleation mode. Brake emission levels seem to be lower than exhaust; however, a dilution factor of 10:1 is deemed necessary for SPN measurements with typical PNCs with a range of up to 5 × 10⁴ #/cm3 to avoid the saturation of the instrument and invalidation of the measurements.
Lastly, the ILS confirmed that five WLTP cycles provide a bedding procedure that is appropriate and result in relatively stable emissions.

Author Contributions

Conceptualisation, investigation, and methodology, M.M., J.G., T.G., B.G., A.M., S.G., R.V. and C.A.; formal analysis, M.M, T.G, A.M. and C.A.; writing—original draft preparation, M.M., S.G. and C.A.; writing—review and editing, T.G., B.G. and R.V.; visualisation, M.M., T.G. and C.A.; project administration, T.G., and B.G. All authors have read and agreed to the published version of the manuscript.

Funding

This research received no external funding.

Institutional Review Board Statement

Not applicable.

Informed Consent Statement

Not applicable.

Data Availability Statement

Data not available due to confidentiality reasons.

Acknowledgments

The authors would like to thank AUDI AG, Bayerische Motoren Werke AG, Ford-Werke GmbH, Stellantis N.V., Continental AG, DRiV Inc., Brembo S.p.A, and Volkswagen AG for providing the testing brakes. The authors would like to thank M. Arndt (AVL List GmbH), K. Kolbeck and J. Von-Wild (Bayerische Motoren Werke AG), M. Federici (Brembo S.p.A.), M. Morbach and C. Kölsch (DRiV Inc.), G. Kanae Filler and D. Lugovyy (HORIBA Europe GmbH), A. Perez and J. Olive (Applus+ IDIADA), A. Sin and S. Balestra (ITT Inc.), H. Hagino (Japan Automobile Research Institute), A. Hortet (Link Engineering Co.), H. Chong (National Institute of Environmental Research, South Korea), P. Nyhof (TMD Friction Services GmbH), H. Niemann and H. Kaminski (TU DARMSTADT), D. Hesse and C. Hamatschek (TU ILMENAU), and P. Jouy (UTAC France) for their technical support during the ILS.

Conflicts of Interest

The authors declare no conflict of interest. The opinions expressed in the manuscript are those of the authors and may not in any circumstances be regarded as stating an official position of the European Commission. Mention of trade or commercial products does not constitute endorsement or recommendation by the authors or the European Commission.

References

  1. Grigoratos, T.; Martini, G. Brake Wear Particle Emissions: A Review. Environ. Sci. Pollut. Res. 2015, 22, 2491–2504. [Google Scholar] [CrossRef] [Green Version]
  2. Hesse, D.; Feißel, T.; Kunze, M.; Bachmann, E.; Bachmann, T.; Gramstat, S. Comparison of Methods for Sampling Particulate Emissions from Tires under Different Test Environments. Atmosphere 2022, 13, 1262. [Google Scholar] [CrossRef]
  3. Rienda, I.; Alves, C. Road dust resuspension: A review. Atmos. Res. 2021, 261, 105740. [Google Scholar] [CrossRef]
  4. National Emissions Reported to the Convention on Long-Range Transboundary Air Pollution (LRTAP Convention). Available online: https://www.eea.europa.eu/ds_resolveuid/f54753b5901e4a8591060bb4ba23c497 (accessed on 20 December 2022).
  5. EMEP/EEA Air Pollutant Emission Inventory Guidebook. 2019. Available online: https://www.eea.europa.eu/publications/emep-eea-guidebook-2019 (accessed on 20 December 2022).
  6. Grigoratos, T.; Martini, G. Non-Exhaust Traffic-Related Emissions—Brake and Tyre Wear PM: Literature Review, Publications Office. 2014. Available online: https://data.europa.eu/doi/10.2790/21481 (accessed on 20 December 2022).
  7. Chasapidis, L.; Grigoratos, T.; Zygogianni, A.; Tsakis, A.; Konstandopoulos, A.G. Study of Brake Wear Particle Emissions of a Minivan on a Chassis Dynamometer. Emiss. Control Sci. Technol. 2018, 4, 271–278. [Google Scholar] [CrossRef] [Green Version]
  8. Mellios, G.; Ntziachristos, L. Non-Exhaust Emissions: Evaporation & Brake Wear Control. 2021. Available online: https://circabc.europa.eu/sd/a/1c0efc15-8507-4797-9647-97c12d82fa28/AGVES-2021-04-08-EVAP_Non-Exh.pdf (accessed on 20 December 2022).
  9. Sanders, P.; Xu, N.; Dalka, T.; Maricq, M. Airborne Brake Wear Debris:  Size Distributions, Composition, and a Comparison of Dynamometer and Vehicle Tests. Environ. Sci. Technol. 2003, 37, 4060–4069. [Google Scholar] [CrossRef]
  10. Grigoratos, T.; Mathissen, M.; Mamakos, A.; Vedula, R.T.; Agudelo, C.; Gramstat, S.; Giechaskiel, B. Interlaboratory Study on Brake Particle Emissions—Part I: Particulate Matter Mass Emissions. Under Rev. Atmos. 2023, 14, 103. [Google Scholar]
  11. OECD. Non-Exhaust Particulate Emissions from Road Transport: An Ignored Environmental Policy Challenge; OECD Publishing: Paris, France, 2020. [CrossRef]
  12. Harrison, R.; Jones, A.; Gietl, J.; Yin, J.; Green, D. Estimation of the Contributions of Brake Dust, Tire Wear, and Resuspension to Non exhaust Traffic Particles Derived from Atmospheric Measurements. Environ. Sci. Technol. 2012, 46, 6523–6529. [Google Scholar] [CrossRef]
  13. Grange, S.K.; Fischer, A.; Zellweger, C.; Alastuey, A.; Querol, X.; Jaffrezo, J.-L.; Weber, S.; Uzu, G.; Hueglin, C. Switzerland’s PM10 and PM 2.5 Environmental Increments Show the Importance of Non-Exhaust Emissions. Atmos. Environ. X 2021, 12, 100145. [Google Scholar] [CrossRef]
  14. Piscitello, A.; Bianco, C.; Casasso, A.; Sethi, R. Non-Exhaust Traffic Emissions: Sources, Characterization, and Mitigation Measures. Sci. Total Environ. 2021, 766, 144440. [Google Scholar] [CrossRef]
  15. Li, N.; Georas, S.; Alexis, N.; Fritz, P.; Xia, T.; Williams, M.; Horner, E.; Nel, A. A work group report on ultrafine particles (American Academy of Allergy, Asthma & Immunology): Why ambient ultrafine and engineered nanoparticles should receive special attention for possible adverse health outcomes in human subjects. J. Allergy Clin. Immunol. 2016, 138, 386–396. [Google Scholar] [PubMed] [Green Version]
  16. Lin, S.; Ryan, I.; Paul, S.; Deng, X.; Zhang, W.; Luo, G.; Dong, G.-H.; Nair, A.; Yu, F. Particle surface area, ultrafine particle number concentration, and cardiovascular hospitalizations. Environ. Pollut. 2022, 310, 119795. [Google Scholar] [CrossRef]
  17. Lin, S.; Ryan, I.; Paul, S.; Deng, X.; Zhang, W.; Luo, G.; Dong, G.-H.; Nair, A.; Yu, F. Revisiting Total Particle Number Measurements for Vehicle Exhaust Regulations. Atmosphere 2022, 13, 155. [Google Scholar] [CrossRef]
  18. Lähde, T.; Giechaskiel, B.; Martini, G. Development of Measurement Methodology for Sub 23 nm Particle Number (PN) Measurements. SAE Int. J. Adv. Curr. Pract. Mobil. 2021, 3, 551–560. [Google Scholar] [CrossRef]
  19. Giechaskiel, B.; Melas, A.; Martini, G.; Dilara, P. Overview of Vehicle Exhaust Particle Number Regulations. Processes 2021, 9, 2216. [Google Scholar] [CrossRef]
  20. Lähde, T.; Giechaskiel, B.; Martini, G.; Woodburn, J.; Bielaczyc, P.; Schreiber, D.; Huber, M.; Dimopoulos Eggenschwiler, P.; Fittavolini, C.; Florio, S.; et al. Reproducibility of the 10-nm Solid Particle Number Methodology for Light-Duty Vehicles Exhaust Measurements. Atmosphere 2022, 13, 872. [Google Scholar] [CrossRef]
  21. Niemann, H.; Winner, H.; Asbach, C.; Kaminski, H.; Frentz, G.; Milczarek, R. Influence of Disc Temperature on Ultrafine, Fine, and Coarse Particle Emissions of Passenger Car Disc Brakes with Organic and Inorganic Pad Binder Materials. Atmosphere 2020, 11, 1060. [Google Scholar] [CrossRef]
  22. Gramstat, S.; Mertens, T.; Waninger, R.; Lugovyy, D. Impacts on Brake Particle Emission Testing. Atmosphere 2020, 11, 1132. [Google Scholar] [CrossRef]
  23. Mamakos, A.; Kolbeck, K.; Arndt, M.; Schröder, T.; Bernhard, M. Particle Emissions and Disc Temperature Profiles from a Commercial Brake System Tested on a Dynamometer under Real-World Cycles. Atmosphere 2021, 12, 377. [Google Scholar] [CrossRef]
  24. Mathissen, M.; Grigoratos, T.; Lahde, T.; Vogt, R. Brake Wear Particle Emissions of a Passenger Car Measured on a Chassis Dynamometer. Atmosphere 2019, 10, 556. [Google Scholar] [CrossRef] [Green Version]
  25. Farwick zum Hagen, F.H.; Mathissen, M.; Grabiec, T.; Hennicke, T.; Rettig, M.; Grochowicz, J.; Vogt, R.; Benter, T. On-Road Vehicle Measurements of Brake Wear Particle Emissions. Atmos. Environ. 2019, 217, 116943. [Google Scholar] [CrossRef]
  26. Farwick zum Hagen, F.H.; Mathissen, M.; Grabiec, T.; Hennicke, T.; Rettig, M.; Grochowicz, J.; Vogt, R.; Benter, T. Study of Brake Wear Particle Emissions: Impact of Braking and Cruising Conditions. Environ. Sci. Technol. 2019, 53, 5143–5150. [Google Scholar] [CrossRef]
  27. Alemani, M.; Nosko, O.; Metinoz, I.; Olofsson, U. A Study on Emission of Airborne Wear Particles from Car Brake Friction Pairs. SAE Int. J. Mater. Manf. 2015, 9, 147–157. [Google Scholar] [CrossRef]
  28. Kukutschová, J.; Moravec, P.; Tomášek, V.; Matějka, V.; Smolík, J.; Schwarz, J.; Seidlerová, J.; Šafářová, K.; Filip, P. On Airborne Nano/Micro-Sized Wear Particles Released from Low-Metallic Automotive Brakes. Environ. Pollut. 2011, 159, 998–1006. [Google Scholar] [CrossRef]
  29. Nosko, O.; Olofsson, U. Effective Density of Airborne Wear Particles from Car Brake Materials. J. Aerosol Sci. 2017, 107, 94–106. [Google Scholar] [CrossRef]
  30. Stanard, A.; DeFries, T.; Palacios, C.; Kishan, S. Brake and Tire Wear Emissions; ERG: Concord, MA, USA, 2021. [Google Scholar]
  31. PMP. PMP Brake Protocol—Testing Specifications. 2021. Available online: https://wiki.unece.org/display/trans/PMP+Web+Conference+15.07.2021 (accessed on 20 December 2022).
  32. GRPE-2023-4e. Proposal for a New UN GTR on Laboratory Measurement of Brake Emissions for Light-Duty Vehicles. Available online: https://unece.org/transport/documents/2022/10/working-documents/iwg-pmp-proposal-new-un-gtr-laboratory-measurement (accessed on 20 December 2022).
  33. Mathissen, M.; Grochowicz, J.; Schmidt, C.; Vogt, R.; Farwick zum Hagen, F.; Grabiec, T.; Steven, H.; Grigoratos, T. A novel real-world braking cycle for studying brake wear particle emissions. Wear 2018, 414, 219–226. [Google Scholar] [CrossRef]
  34. PMP. Web Conference 15.07.2021—Transport—Vehicle Regulations—UNECE Wiki. Available online: https://wiki.unece.org/display/trans/PMP+Web+Conference+15.07.2021 (accessed on 20 December 2022).
  35. Grigoratos, T.; Mamakos, A.; Arndt, M.; Lugovyy, D.; Anderson, R.; Hafenmayer, C.; Moisio, M.; Vanhanen, J.; Frazee, R.; Agudelo, C.; et al. Characterization of Particle Number Setups for Measuring Brake Particle Emissions and Comparison with Exhaust Setups. Atmosphere 2023, 14, 103. [Google Scholar] [CrossRef]
  36. United Nations Global. Technical Regulation No. 15: United Nations Global Technical Regulation on Worldwide Harmonised Light Vehicles Test Procedures (WLTP). 2021. Available online: https://unece.org/transport/standards/transport/vehicle-regulations-wp29/global-technical-regulations-gtrs (accessed on 20 December 2022).
  37. Giechaskiel, B.; Casadei, S.; Mazzini, M.; Sammarco, M.; Montabone, G.; Tonelli, R.; Deana, M.; Costi, G.; Di Tanno, F.; Prati, M.V.; et al. Inter-Laboratory Correlation Exercise with Portable Emissions Measurement Systems (PEMS) on Chassis Dynamometers. Appl. Sci. 2018, 8, 2275. [Google Scholar] [CrossRef] [Green Version]
  38. Giechaskiel, B.; Casadei, S.; Rossi, T.; Forloni, F.; Di Domenico, A. Measurements of the Emissions of a “Golden” Vehicle at Seven Laboratories with Portable Emission Measurement Systems (PEMS). Sustainability 2021, 13, 8762. [Google Scholar] [CrossRef]
  39. Vasiljevic, S.; Glišović, J.; Stojanovic, B.; Stojanovic, N.; Grujic, I. The analysis of the influential parameters that cause particles formation during the braking process: A review. Proc. Inst. Mech. Eng. Part J J. Eng. Tribol. 2022, 236, 31–48. [Google Scholar] [CrossRef]
  40. Seo, H.; Park, J.; Kim, Y.C.; Lee, J.J.; Jang, H. Effect of Disc Materials on Brake Emission during Moderate-temperature Braking. Tribol. Int. 2021, 163, 107185. [Google Scholar] [CrossRef]
Figure 1. Overview of PN emission data for Br1Fa. Test level background concentrations of labs D, H, and R are in the same order as emission levels and are excluded from further analysis.
Atmosphere 14 00424 g001
Figure 2. Example for the time-resolved PN emission data for Br1Fa from different labs. Noticeable problems include background concentration in the same order as emission concentrations, random concentration spikes, and shifts in background concentrations.
Atmosphere 14 00424 g002
Figure 3. Normalised TPN concentration for Br1Fa for different labs using a wide range of tunnel flow rates from 66 to 1827 m³/h.
Atmosphere 14 00424 g003
Figure 4. Overview of total and solid PN EF for different brake IDs from all labs (excluding Lab D, H, R, and Q). Boxplots indicate the median (lines in the box), upper and lower quartiles (box edges), and nonoutlier maximum/minimum. Note that the number of data points varies for each box and is underneath the corresponding boxplot for each brake.
Atmosphere 14 00424 g004
Figure 5. Overview of total and solid PN EF in dependence of the wheel load. The dashed line indicates the only repeated test with an identical brake system and variation in test mass.
Atmosphere 14 00424 g005
Figure 6. Top: velocity and disc temperature. Bottom: total and solid PN concentration during emission run 1 of Lab T for Br1Fa. The TPN emissions increased during high temperature/high speed stops at the end of WLTP Brake Trip 10.
Atmosphere 14 00424 g006
Figure 7. Overview of mean and maximum disc temperature for all emission tests. The filled circles highlight measurements with high TPN EF.
Atmosphere 14 00424 g007
Figure 8. Overview of mean TPN emission level for repeated testing of WLTP-Brake cycle for Br1Fa (ECE pad) and Br1Fb (NAO pad) from all labs. The first five runs of the WLTP-Brake cycle correspond to the bedding of the friction pair. Runs 6–8 are the actual emission measurements. The error bars represent the standard deviation from all labs for each run, excluding the volatile particle emission measurements at Lab T for Br1Fa.
Atmosphere 14 00424 g008
Figure 9. Log–log graph for the cumulative TPN as a function of cumulative brake work for six tests from three different brakes. Dashed lines indicate a power law regression of the data, using a 120 s sliding window (moving average). “High” refers to the highest TPN and “Low” refers to the lowest TPN values measured per brake.
Atmosphere 14 00424 g009
Table 1. Characteristics of tested brakes. WL/DM = wheel load/disc mass. ECE refers to European performance brake pads.
Brake IDAxleVeh. Test Mass/kgTest Inertia/
kg·m2
Tyre Rolling
Radius/mm
Friction MaterialWL/DM
Ratio
Comments
Br1FaFront160049.3315ECE88.1Reference brake
Br1FbFront160049.3315NAO88.1To compare emissions between NAO and ECE friction materials
Br2Front166850.8321ECE44.6Equivalent vehicle mass to Brake 1 but with 2× heavier disc
Br3Front2623112.1383ECE50.7SUV brake segment
Br4Rear125316.1314-44.7Drum brake
Br5LaFront250086.7345ECE90.1Cargo van brake segment
Br5LbFront3690117.6345ECE122.1Cargo van at 90% payload
Table 2. Main elements of the PN-related instrumentation used at the ILS by the testing facilities.
Pre-Classifier Cut-Off Point
(μm)
Nozzle-To-Diluter L/Q (s/m2)PN Flowsplit Angle
(°)
Dilution System AppliedParticle Number Counter (PNC)PNC’s Lower Cut-Off
CE at d (nm)
PNC’s Certified Max Concentration
Lab BNot applied*Not appliedNoTSI 37524 nm (50%) d1 × 105
Lab C2.538,399Not appliedYesTSI C10010 nm (73%) a5 × 104 b
Lab D10*Not appliedNoTSI 37507 nm (50%)5 × 10⁴
Lab F2.5118140YesTSI 37507 nm (50%)5 × 10⁴
Lab G2.2*20NoTSI 3790A7 nm (50%)5 × 10⁴
Lab H3.0*20NoTSI 37524 nm (50%) d1 × 105
Lab J2.5*<15NoTSI 3790A10 nm (69%) a1 × 105 b
Lab K2.5*Not appliedNoTSI 37507 nm (50%)1 × 10⁵
Lab L2.526,400Not appliedYes cAVL 488-1010 nm (75%) a3 × 104
Lab M2.54010Not appliedYesTSI 3790A10 nm (71%) a1 × 104 b
Lab N2.258,80020YesTSI 37507 nm (50%)5 × 10⁴
Lab P2.518,000Not appliedYes cTSI C10010 nm (65%)5 × 10⁴
Lab Q8.830,000Not appliedYesTSI 3790A10 nm (73%) a5 × 104 b
Lab RNot applied*Not appliedNoTSI C10023 nm (53%) a,d1 × 104 b
Lab S2.5 < X < 109600Not appliedYes cAVL 488-1010 nm (72%) a3 × 104 b
Lab T2.5957420Yes cAVL 488-1010 nm (75%) a3 × 104
* Testing facility did not use a dilution system; therefore, the parameter is not applicable. a Testing facility provided calibration at the cut-off sizes. Otherwise, the nominal cut-off size is reported. b Testing facility provided linearity calibration. Otherwise, only one point calibration. c Calibration certificate for diluter provided. d PNC is not compliant with the requirements.
Table 3. Final execution status of the ILS test matrix concerning PN measurements (√ = reported, X = did not report).
Lab/BrakeBr1FaBr1FbBr2Br3Br4Br5LaBr5Lb
TPNSPNTPNSPNTPNSPNTPNSPNTPNSPNTPNSPNTPNSPN
Lab BX X X X
Lab C
Lab D
Lab F
Lab G X
Lab H
Lab J
Lab K
Lab L
Lab MXXXXX
Lab N X
Lab P X X
Lab Q
Lab R X
Lab S
Lab T
Table 4. Mean TPN and SPN emission factor, excluding Lab T measurements for Br1Fa.
BrakeMean TPN10
(#/km/Brake)
Mean SPN10
(#/km/Brake)
Deviation
in %
Br1Fa1.93 × 1092.19 × 109+13
Br1Fb9.37 × 1081.03 × 109+10
Br28.97 × 1098.55 × 109−5
Br34.11 × 1093.33 × 109−19
Br41.76 × 1091.66 × 109−5
Br5La5.81 × 109N/AN/A
Br5Lb1.11 × 1010N/AN/A
Disclaimer/Publisher’s Note: The statements, opinions and data contained in all publications are solely those of the individual author(s) and contributor(s) and not of MDPI and/or the editor(s). MDPI and/or the editor(s) disclaim responsibility for any injury to people or property resulting from any ideas, methods, instructions or products referred to in the content.

