Article

Fine Particulate Matter Concentration and Early Deaths Related to Thermal Power Plants and National Industrial Complexes in South Korea

Environmental Assessment Group, Korea Environment Institute, Sejong 30147, Republic of Korea
*
Author to whom correspondence should be addressed.
Atmosphere 2023, 14(2), 344; https://doi.org/10.3390/atmos14020344
Submission received: 24 December 2022 / Revised: 2 February 2023 / Accepted: 7 February 2023 / Published: 9 February 2023

Abstract

:
Thermal power plants (TPPs) and national industrial complexes (NICs) are widely known as being among the major causes of changes in the concentrations of fine particulate matter (PM2.5). However, little is known about the changes in PM2.5 concentration caused by the operation of these facilities in South Korea and the health burden attributable to them, including early death. There were two purposes to this study. The first was to quantitatively evaluate the changes in PM2.5 concentration caused by TPPs and NICs in Korea. The second was to estimate the number of early deaths as a health burden attributable to such changes in PM2.5 concentration. The changes in PM2.5 concentration caused by the operation of TPPs and NICs were investigated within TPPs in 2013 and within NICs in 2015. The number of early deaths in 2015 caused by changes in PM2.5 concentration was estimated using the Environmental Benefits Mapping and Analysis Program (BenMAP). Nationwide, the annual average concentration of PM2.5 caused by the operation of TPPs and NICs was estimated to increase by 0.611 μg/m3 and 1.245 μg/m3, respectively, suggesting that NICs contributed about twice as much to this concentration as TPPs. The same trend was also observed regarding the number of early deaths, with TPPs and NICs accounting for 1017 and 2091 early deaths per year, respectively, indicating that the operation of NICs causes a health burden about twice as high as that caused by TPPs. However, the changes in PM2.5 concentration were found to be high near TPPs and NICs, while the health burden caused by exposure to PM2.5 varied according to the level of population distribution and mortality in each air (quality) control zone (ACZ) to which one is exposed. The findings of this study are expected to be utilized as reference data when setting goals to strengthen air quality management (AQM) in each ACZ in Korea.

1. Introduction

Thermal power plants and industrial complexes are very well known causes of PM2.5 generation. Several studies have been conducted to analyze the concentration of PM2.5 in the atmosphere contributed by air pollutant emissions from thermal power plants in Korea using the CMAQ (Community Multiscale Air Quality) model [1,2]. In addition, several studies have been conducted using the CMAQ or WRF–Chem (Weather Research and Forecasting model coupled with Chemistry) models to analyze the concentration of PM2.5 and health effects caused by emissions from thermal power plants in the Atlantic and Great Lakes regions of the United States, China, India, etc. [3,4]. However, few studies have been carried out regarding the effects of industrial complexes on PM2.5, and it is particularly difficult to find studies comparing them with thermal power plants. In addition, the health effects of PM2.5 related to these facilities have been evaluated in few studies.
The estimation and presentation of changes in mortality and morbidity caused by air pollution in quantitative terms is useful when setting national policies related to air pollution measures. The US Environmental Protection Agency (EPA) conducts a health risk assessment (HRA) in the process of setting national air quality standards every five years to consider the level of health risks [5]. In South Korea, the number of PM-attributable deaths was estimated through an HRA when establishing the second master plan for Seoul metropolitan air quality management (2015–2024), and a target goal was presented based on this [6]. In particular, PM10- and PM2.5-related health damage, which is represented by particulate air pollutants, is being used as a key factor in the analysis of the scale [7] and cause [7,8] of damage caused by air pollution worldwide. PM10 and PM2.5 have been used as reference air pollutants for policy making in previous studies regarding health damage from exposure to air pollution in South Korea [6,9,10].
The comparison of the health burden (HB) caused by various environmental risk factors can be helpful in establishing policies such as air pollution standards or in preventing and managing environmental pollution. In studies regarding HB caused by exposure to particulate matter (PM) in South Korea, PM10-attributable early deaths (a reduction of 200 [95% CI: 31–371] early deaths for the 0–64-year age group in 2015, if the WHO’s PM10 24 h average guidelines [50 μg/m3] were attained) [11], hospitalization in children (a reduction of 439 [95% CI: 216–666] asthma hospitalizations in Seoul, 2006, if the WHO’s PM10 24 h average guidelines (50 μg/m3) were attained) [12], and PM2.5-attributable early deaths (a reduction of 2895 [95% CI: 832–4840] early deaths for adults over 30 in Seoul, 2006, if the WHO’s PM2.5 annual guidelines [10 μg/m3] were attained) were examined [13]. In most of these studies, the number of early deaths or hospitalizations due to exposure to a PM concentration were estimated, but the only conclusions were that these numbers could be prevented by reducing the PM concentration. Results and policy implications related to the contribution level of PM-concentration improvement for each major emission source in South Korea were not presented.
In summary, the determination of the quantitative health burden along with changes in the concentration of each major pollution source related to PM can be helpful in the establishment of more effective and cost–beneficial policies for domestic air pollution–related measures. Therefore, in this study, we aimed to examine the changes in PM2.5 concentration caused by thermal power plants and national industrial complexes in South Korea and estimate the number of early deaths attributable to these changes, thereby suggesting implications for the establishment of policy directions for AQM in the future.

2. Materials and Methods

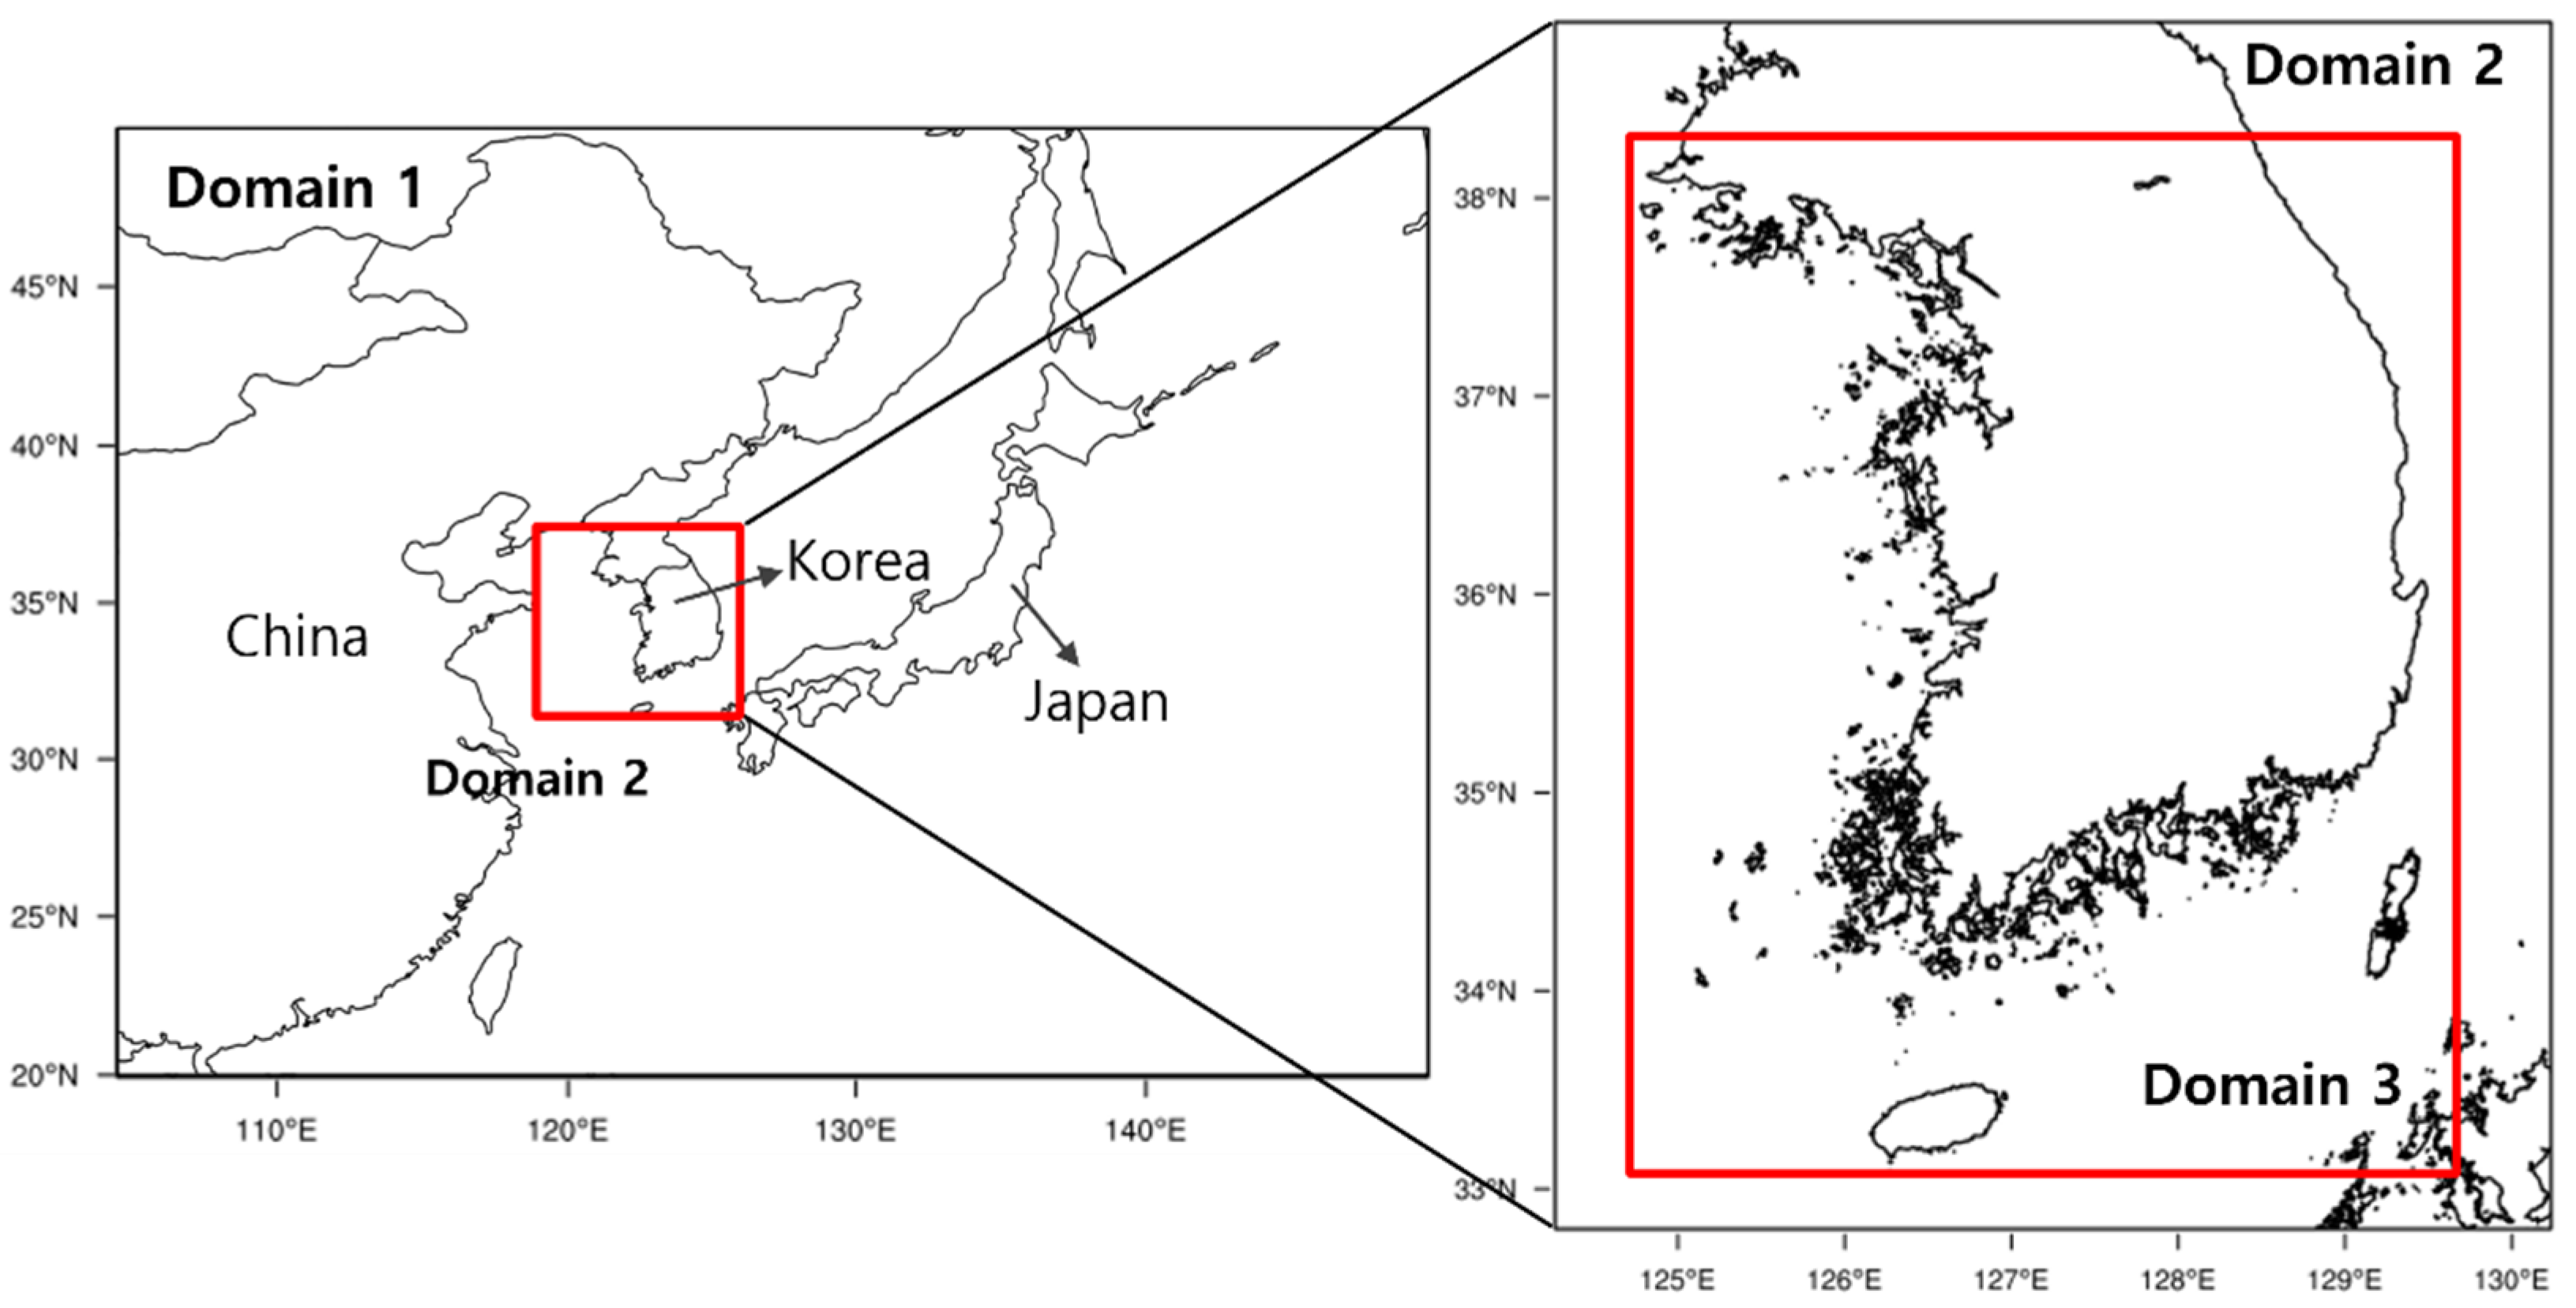
2.1. Air Quality (AQ) Simulation

To predict national concentration changes according to major PM2.5 pollution sources in Korea, the WRF (Weather Research and Forecasting model v3.6.1)–SMOKE (Sparse Matrix Operator Kernel Emissions v3.1)–CMAQ (Community Multiscale Air Quality model v4.7.1) modeling system was used. For the initial field in WRF model simulation, final operational global analysis (FNL) data with a horizontal resolution of 1° × 1° every six hours were used, which were provided by the National Centers for Environmental Prediction (NCEP). Meteorological data estimated from WRF model simulation were converted into meteorological data for AQ simulation using the Meteorology–Chemistry Interface Processor (MCIP). Chemical species were classified according to the AERO5 aerosol module and SAPRC-99 chemical mechanism to simulate AQ. In the modeling domains covered in this study, a nested grid technique was applied to the resolutions of 27 km, 9 km, and 3 km. The 27 km grid domain contained East Asia, while the 9 km and 3 km grid domains covered the whole of South Korea. For the emissions data used, the Clean Air Quality Policy Support System (CAPSS; National Emission Inventory), provided by the National Institute of Environmental Research (NIER) for the domestic emissions inventory, and CREATE (Comprehensive Regional Emissions Inventory for Atmospheric Transport Experiment) 2015 for the overseas emissions inventory were processed using SMOKE. Figure 1 shows the domains modeled, and Table 1 shows the WRF and CMAQ configuration used for simulations. Various configuration options are available for WRF and CMAQ, and a combination of options appropriately simulate the atmospheric conditions for each region to be modeled. In this study, modeling was performed by applying model options mainly used for the atmospheric simulation of Northeast Asia, including the target domain [14,15,16,17,18].

2.2. Estimation of the Number of Early Deaths

In this study, the entire area of South Korea was divided into 253 municipalities in which the changes in PM2.5 concentration due to the operation of TPPs in 2013 and NICs in 2015 were estimated. The number of early deaths by municipality was estimated based on the number of deaths and population in 2015. To estimate the number of early deaths, the US EPA method was used. In the US EPA method, the BenMAP is used to measure the health benefits of air quality improvement, and the number of early deaths related to the health benefits are estimated by applying the following equation [30,31]:
Early death count = [(RR − 1) ÷ RR] × Incidence × Population
where early death count means the number of PM2.5-attributable early deaths in a local community; incidence means the mortality rate in the community; and population means the number of people in the community. [(RR − 1) ÷ RR] means the PM2.5-attributable fraction of deaths in the community, assuming that all adults aged 30 and over in the community are exposed to PM2.5. Relative risk (RR) means the relative risk ratio of the exposure level (x1) compared to the reference level (x0) of PM2.5 in the local community. In this study, RR = exp (β1 × (x1) − x0)) was calculated, where x1 is the level of exposure to PM2.5 in a community where TPPs or NICs operate; x0 is the level in a community where such facilities do not operate; exp(β1) is a concentration–response function, indicating relations between the changes in the concentration of PM2.5 per unit of community and those in the number of deaths, accordingly. In this study, an RR of 1.006033 (95% confidence interval: 1.003929–1.008141) for all-cause mortality from long-term exposure to PM2.5 in adults aged 30 and over based on the meta-analysis of thirteen cohort studies published by the World Health Organization (WHO) was applied [32].
To estimate the number of early deaths due to changes in PM2.5 concentration, data regarding the annual changes in PM2.5 concentration by municipality, the annual mortality, and the year-round population were obtained and applied to the equation. Annual mortality was processed using data regarding the all-cause mortality of people aged 30 and over by municipality from the Population Trend Survey 2015 by Statistics Korea. Populations for each municipality were calculated for those aged 30 and over using data from the 2015 National Population Census by Statistics Korea. To estimate the changes in PM2.5 concentrations, we utilized the Brute Force Method (BFM). The method is processed by comparing a base simulation with a control case. In the base simulation, unchanged emissions were used, while in the control case, the emissions of the target source were removed from the base emissions [33].

3. Results

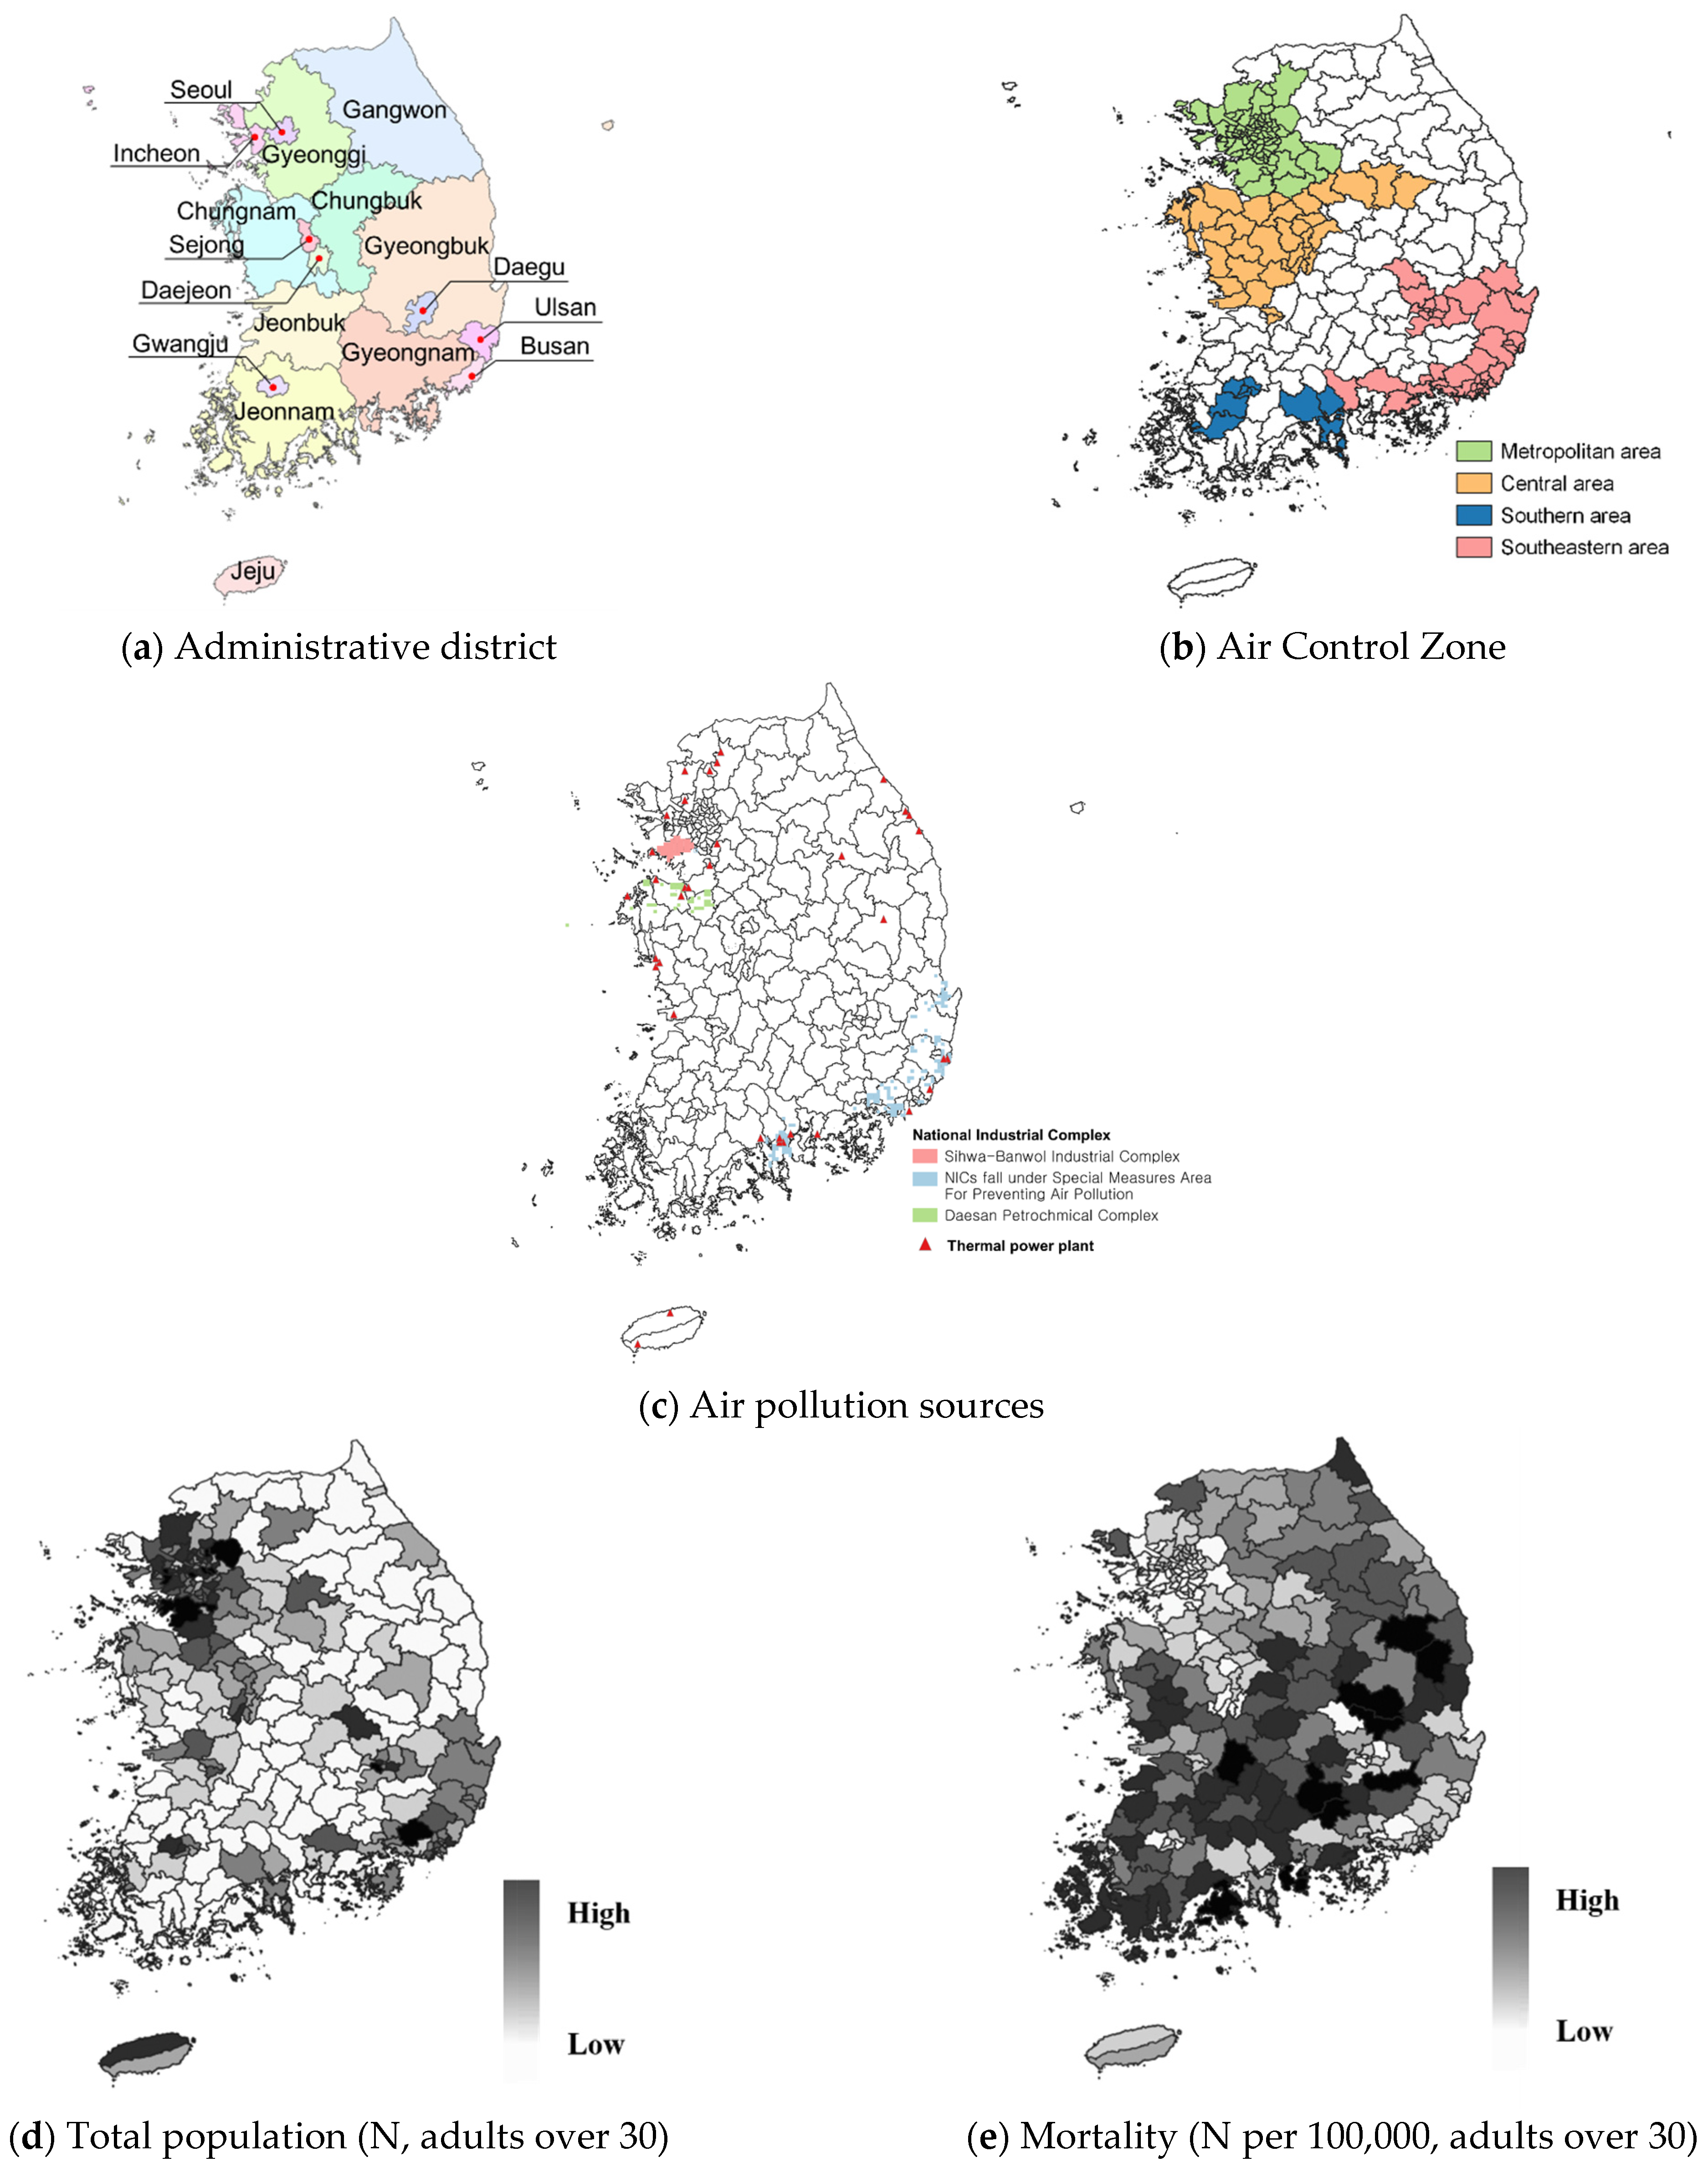
3.1. Distribution of Major Pollution Sources and the Exposed Population

As shown in Figure 2, under the Special Act on the Improvement of Air Control in Air Control Zones, which took effect in October 2021, air quality in Korea is specifically managed by utilizing four major regions (i.e., ACZs): the Seoul metropolitan region (SMR), and the central, southeast, and southern regions. The Act defines an ACZ as a region deemed to be seriously affected by air pollution, in which the air pollutants emitted are also deemed to seriously affect air pollution. Summarizing the air management policies for each ACZ, in the SMR, air pollution management measures related to daily life, such as the replacement of old diesel vehicles, are promoted; in the central region, emissions of pollutants including TPPs are managed; and in the southern and southeastern regions, pollutant emissions from large businesses are regulated. The location of TPPs and NICs in Figure 2 demonstrates some of the reasons for the establishment of the current ACZs.
As shown in Figure 2, it was found that the distribution of the population and mortality of adults over 30 in South Korea is concentrated in the SMR and southeastern region. In addition, the related mortality was found to be relatively low in the SMR and southeastern region, as the younger population is widely distributed. In consideration of such distributions of population and mortality, it can be expected that the number of early deaths in regions where TPPs and NICs are operated may be somewhat different from the trends regarding regional PM2.5 concentration change.

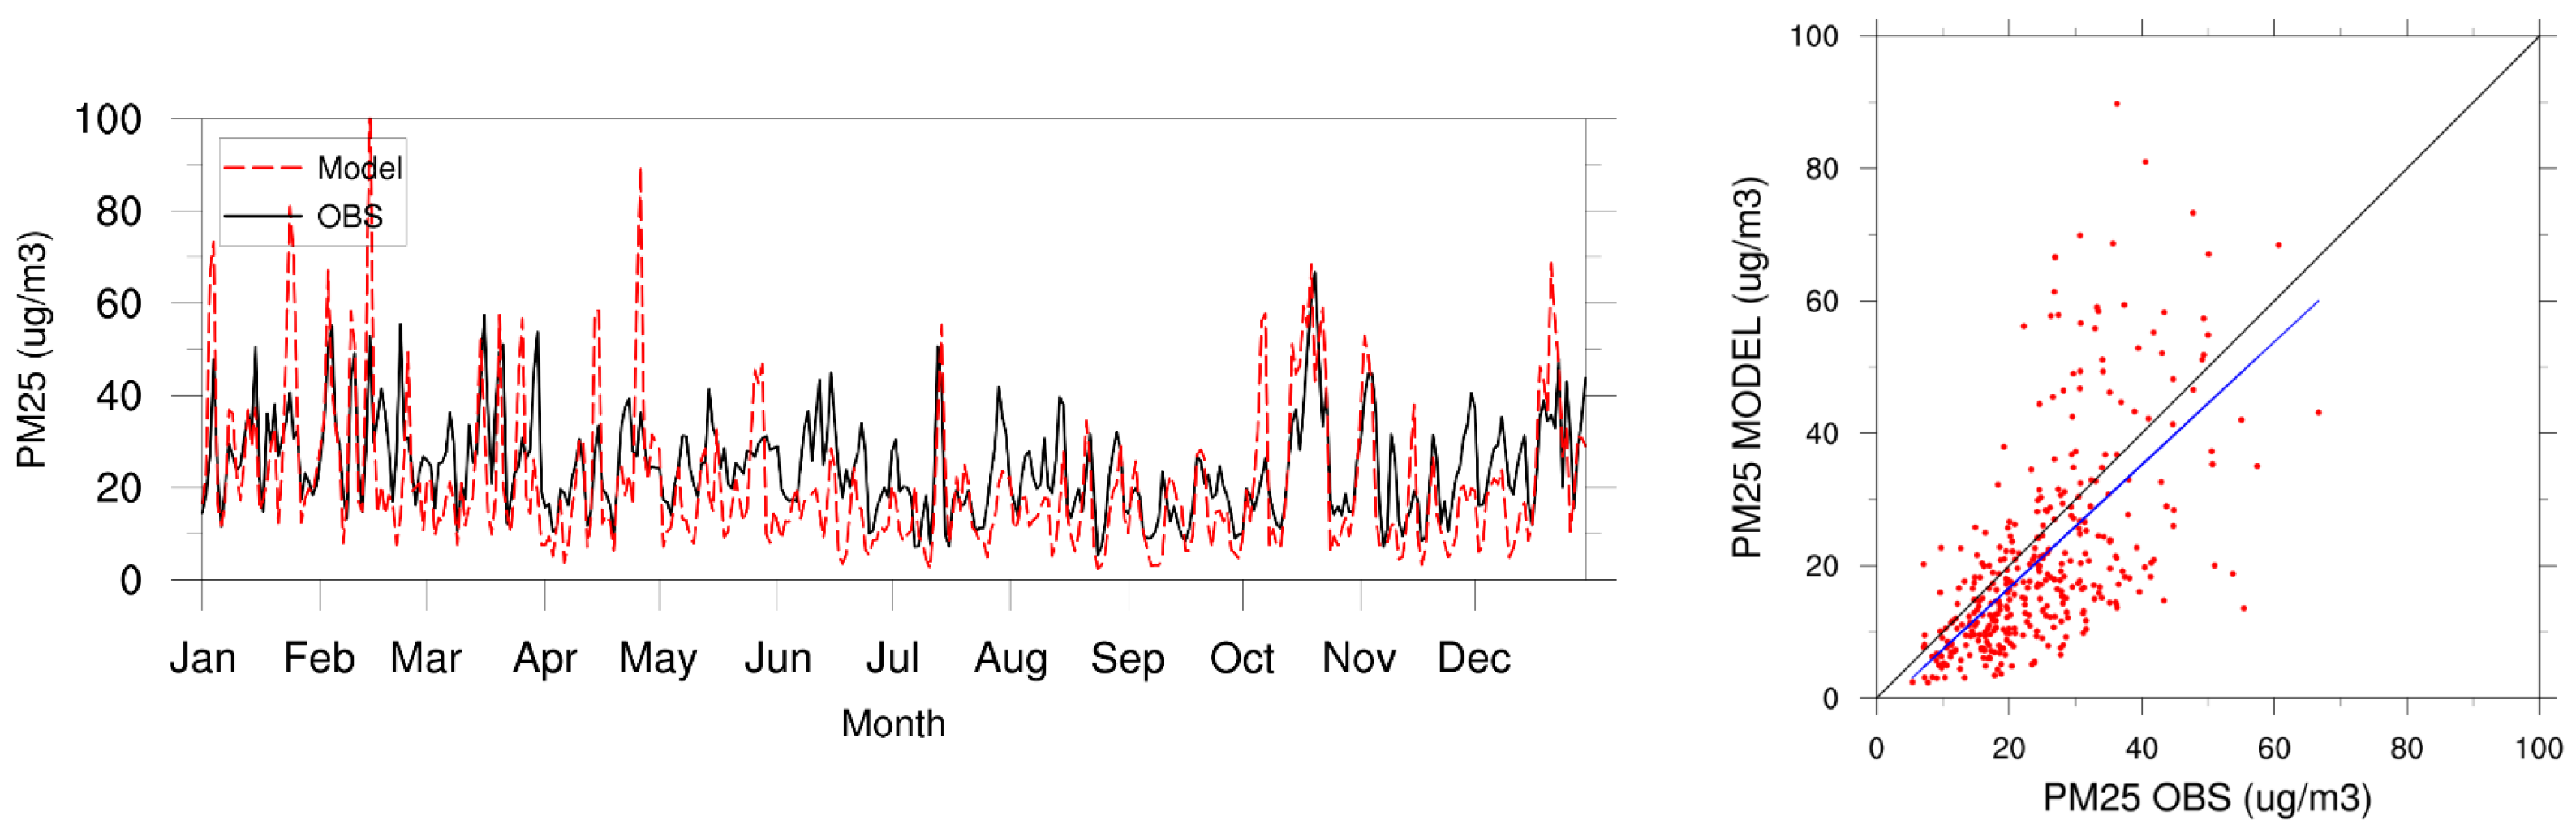
3.2. Air Quality Model Validation

To evaluate the performance of CMAQ modeling, simulated concentrations of PM2.5 and AQMS data observed from 95 stations nationwide were compared based on the RMSE, IOA, and R. Table 2 and Figure 3 show the comparison results. The R value was 0.5, which satisfied the evaluation criterion of the modeling performance of an R value of 0.4 or more, recommended by Emery et al. [34]. The IOA and RMSE were 0.68 and 16.64 μg/m3, respectively, indicating that the simulated results explain the observed data well.

3.3. Characteristics of Emissions from TPPs and NICs

As shown in Figure 2, a total of 72 TPPs are distributed nationwide, with about half, or 30, operating in Chungcheongnam-do (one of provinces in South Korea). In addition, there are a total of 175 liquefied natural gas (LNG) power plants nationwide, including 57 in Incheon and 49 in Gyeonggi-do (one of the provinces); more than half are concentrated in the SMR. The emissions from TPPs were 130,000 tons of NOx and 70,000 tons of SOx nationwide, accounting for 11% and 20% of the total national emissions, respectively. Looking at each municipality, both NOx and SOx emissions were concentrated in Chungcheongnam-do; approximately 60,000 tons of NOx and 35,000 tons of SOx were emitted, accounting for about half of the TPP emissions nationwide (Table 3).
As shown in Figure 2, NICs fall under the Special Countermeasure Area for Air Quality Protection (SCAAQP); major NICs include the Sihwa-Banwol Industrial Complex in Gyeonggi-do, the Daesan Petrochemical Complex in Chungcheongnam-do, and NICs in Ulsan Metropolitan City and Yeosu, Jeollanam-do. Emissions from NICs covered in this study were 190,000 tons of NOx, 160,000 tons of SOx, and 230,000 tons of VOCs, which accounted for 17%, 45%, and 23% of the nationwide emissions, respectively. Regarding the emissions by industrial complex covered, SCAAQP had the highest emission ratio; 150,000 tons of NOx, 120,000 tons of SOx, and 170,000 tons of VOCs were emitted, accounting for more than 70% of the emissions from NICs nationwide (Table 3).

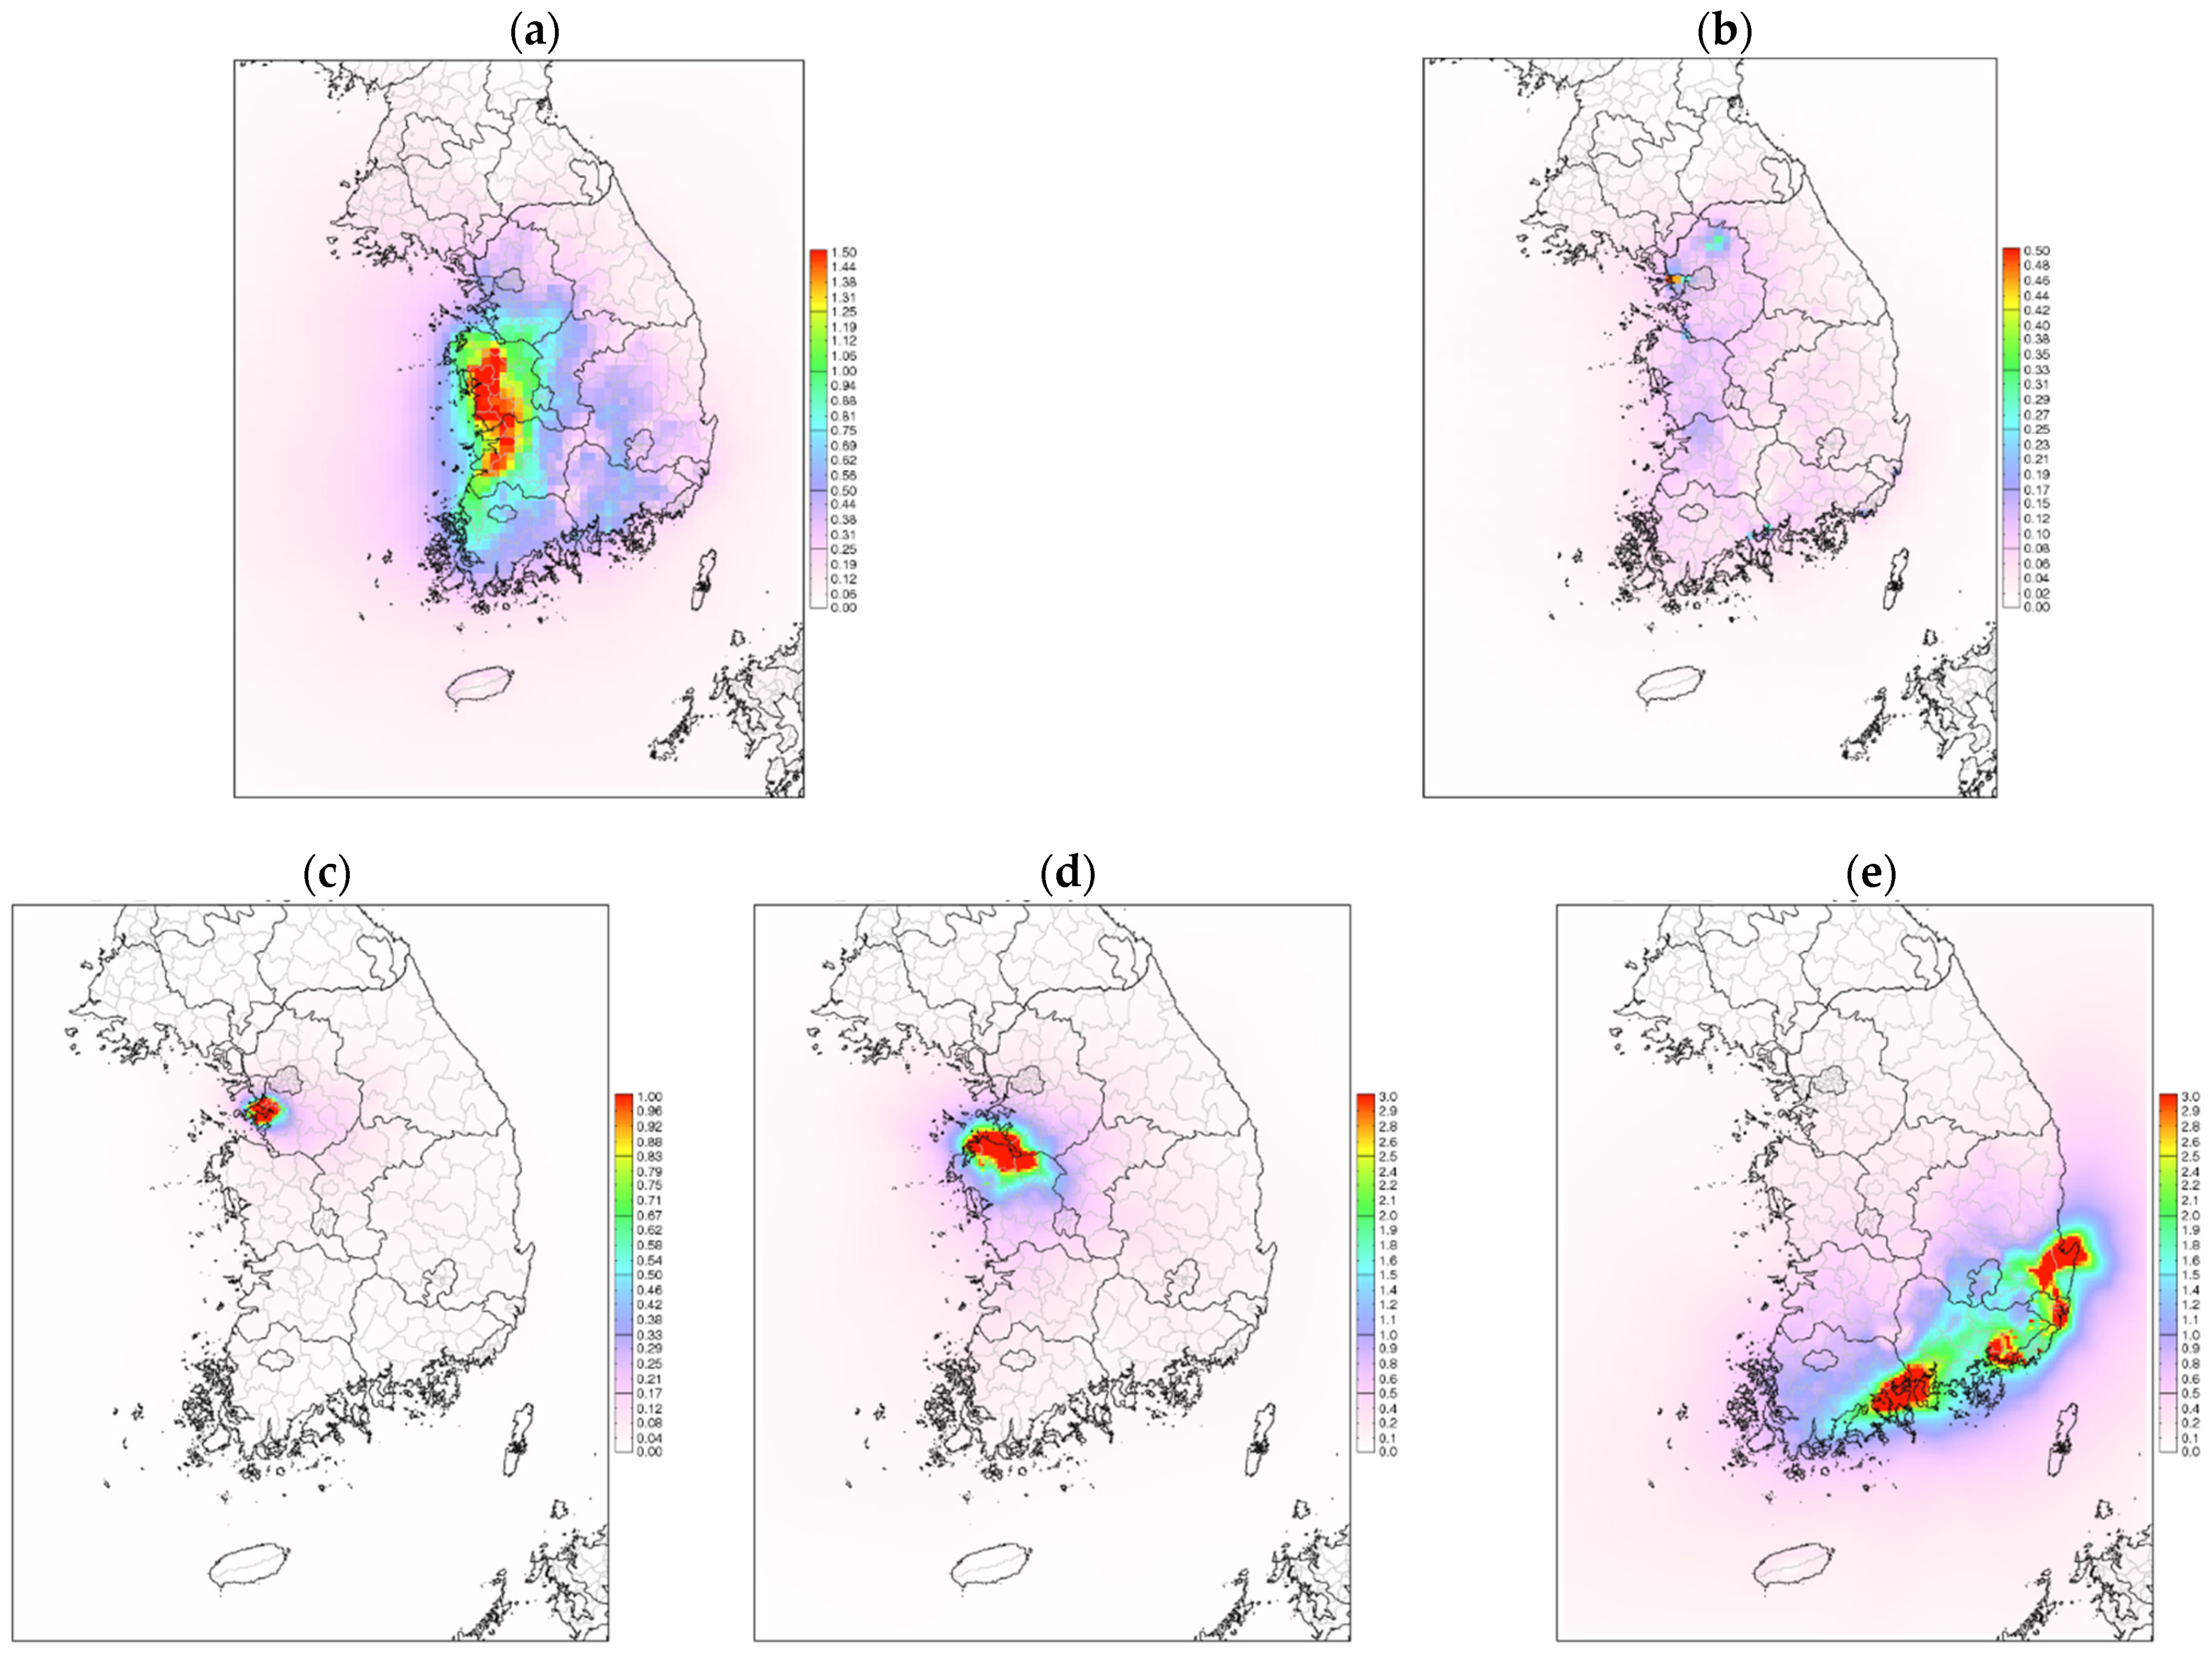
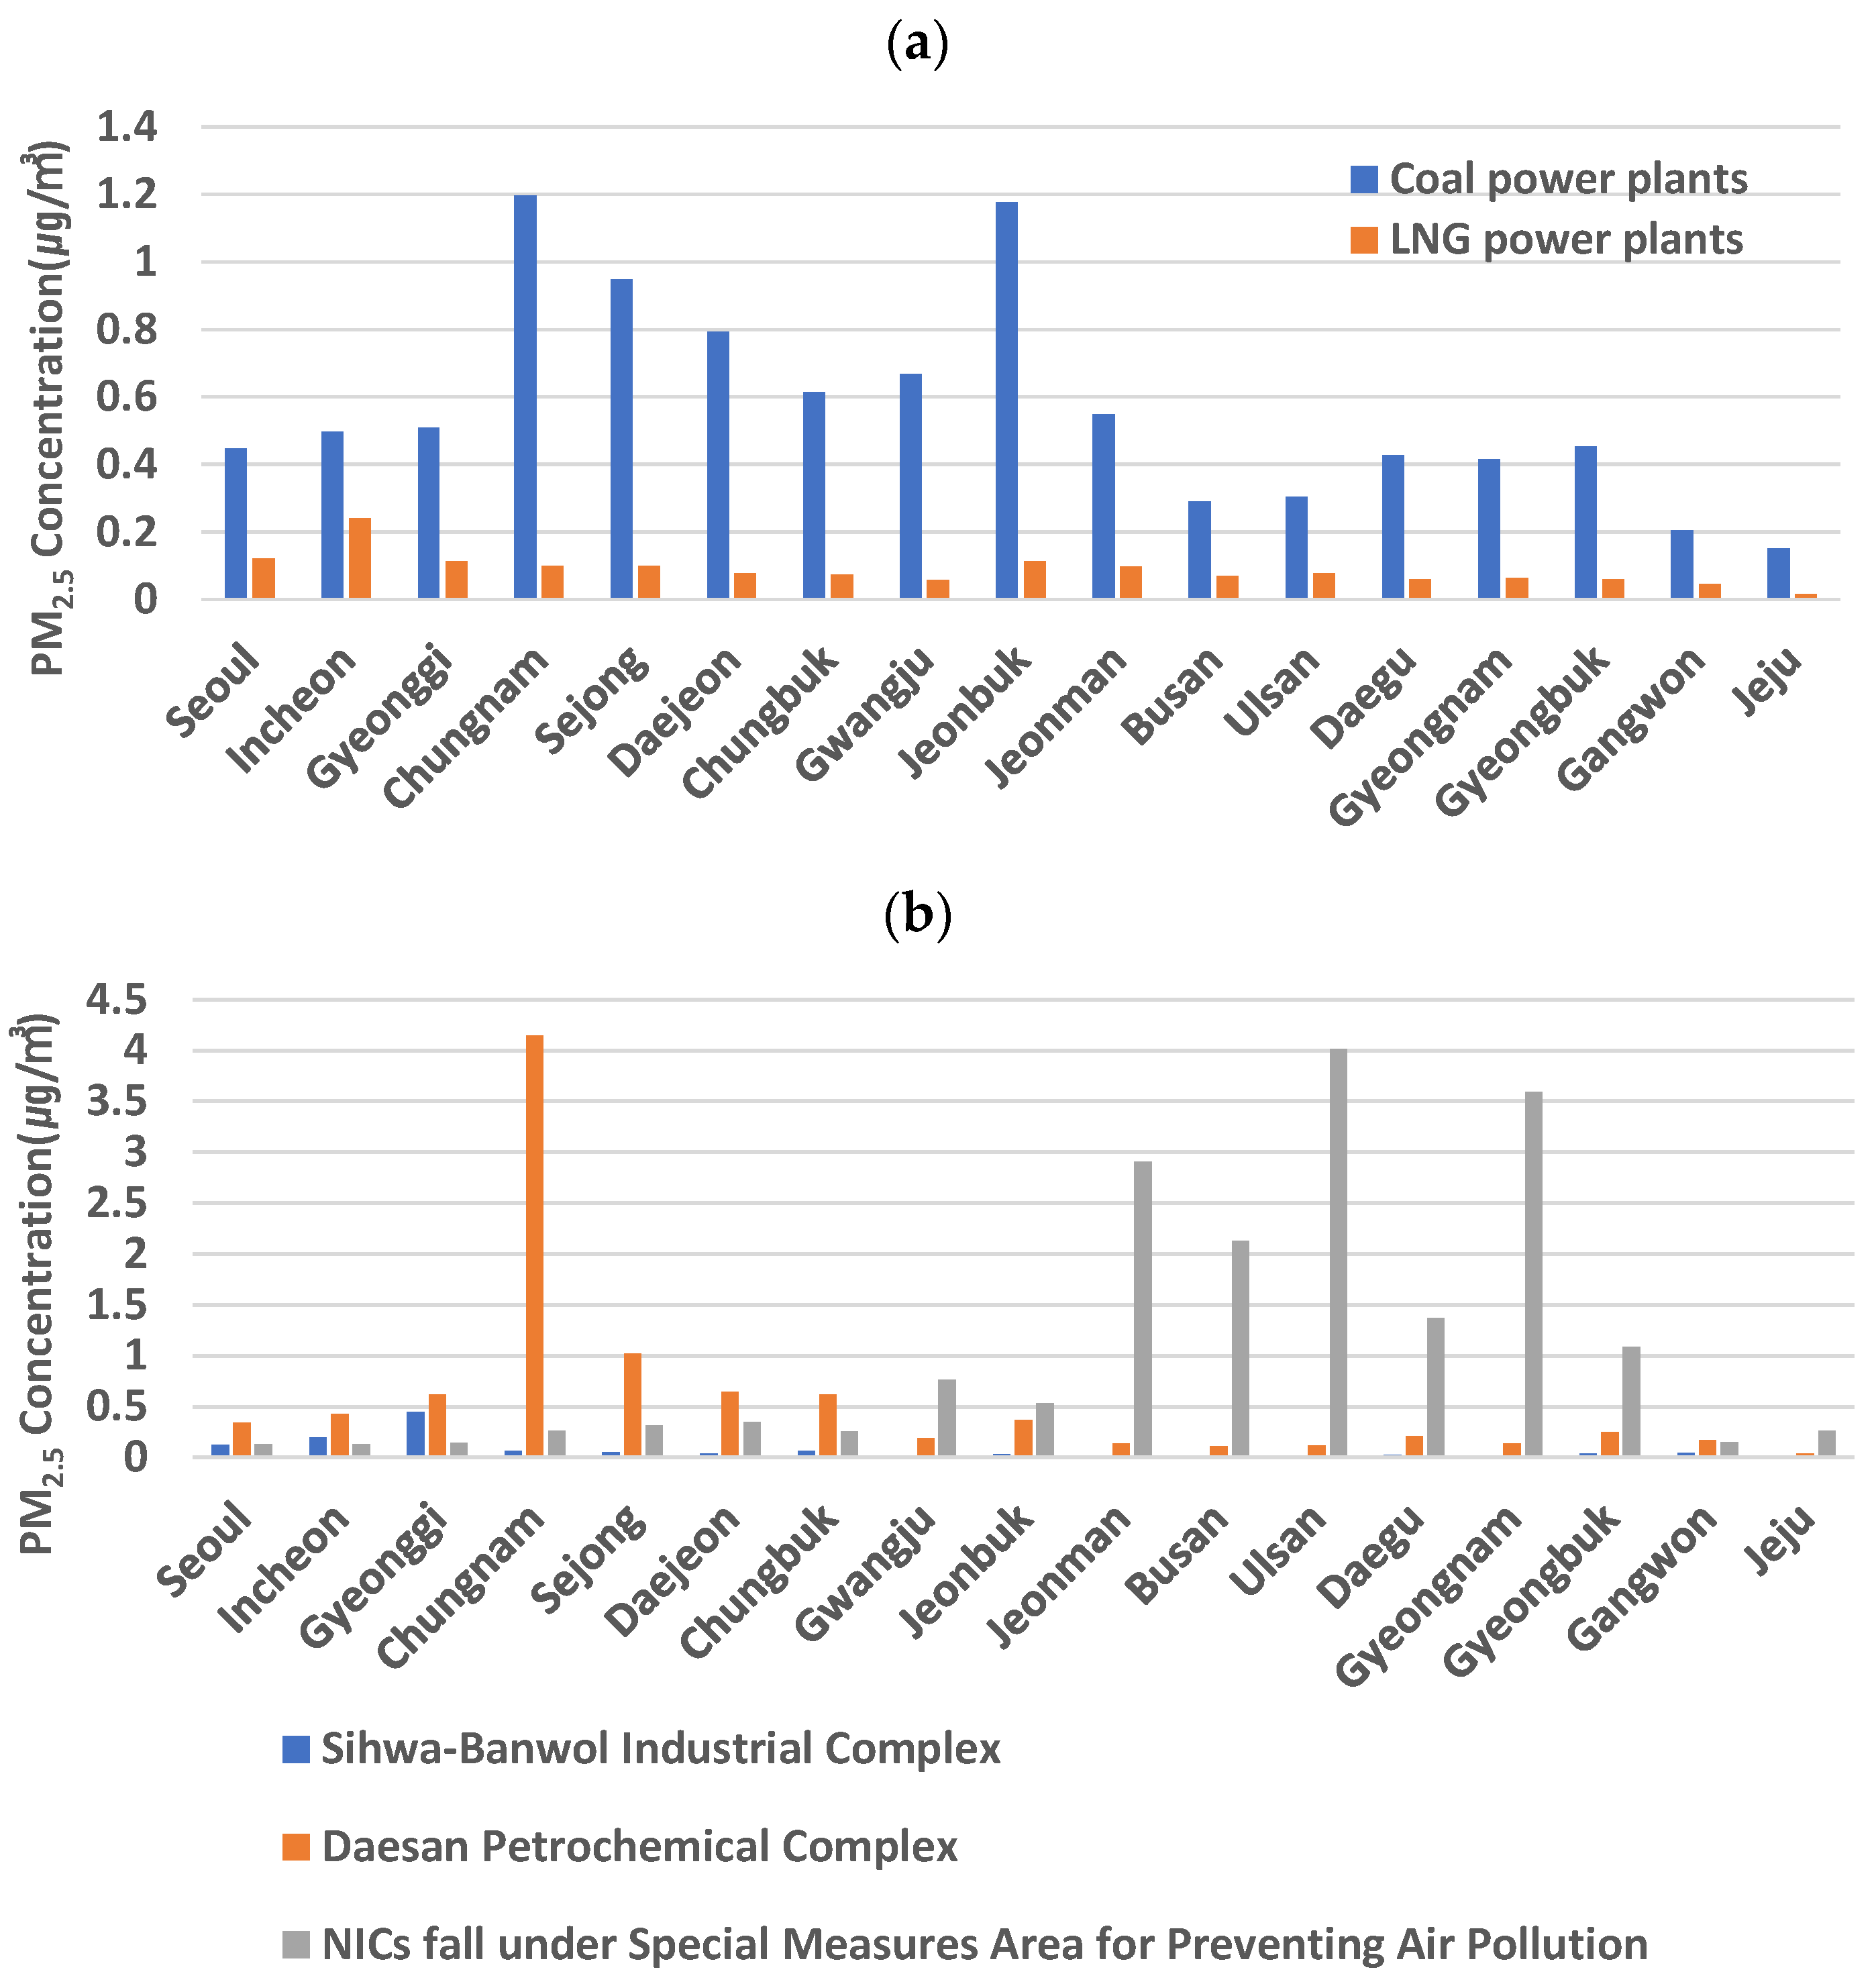
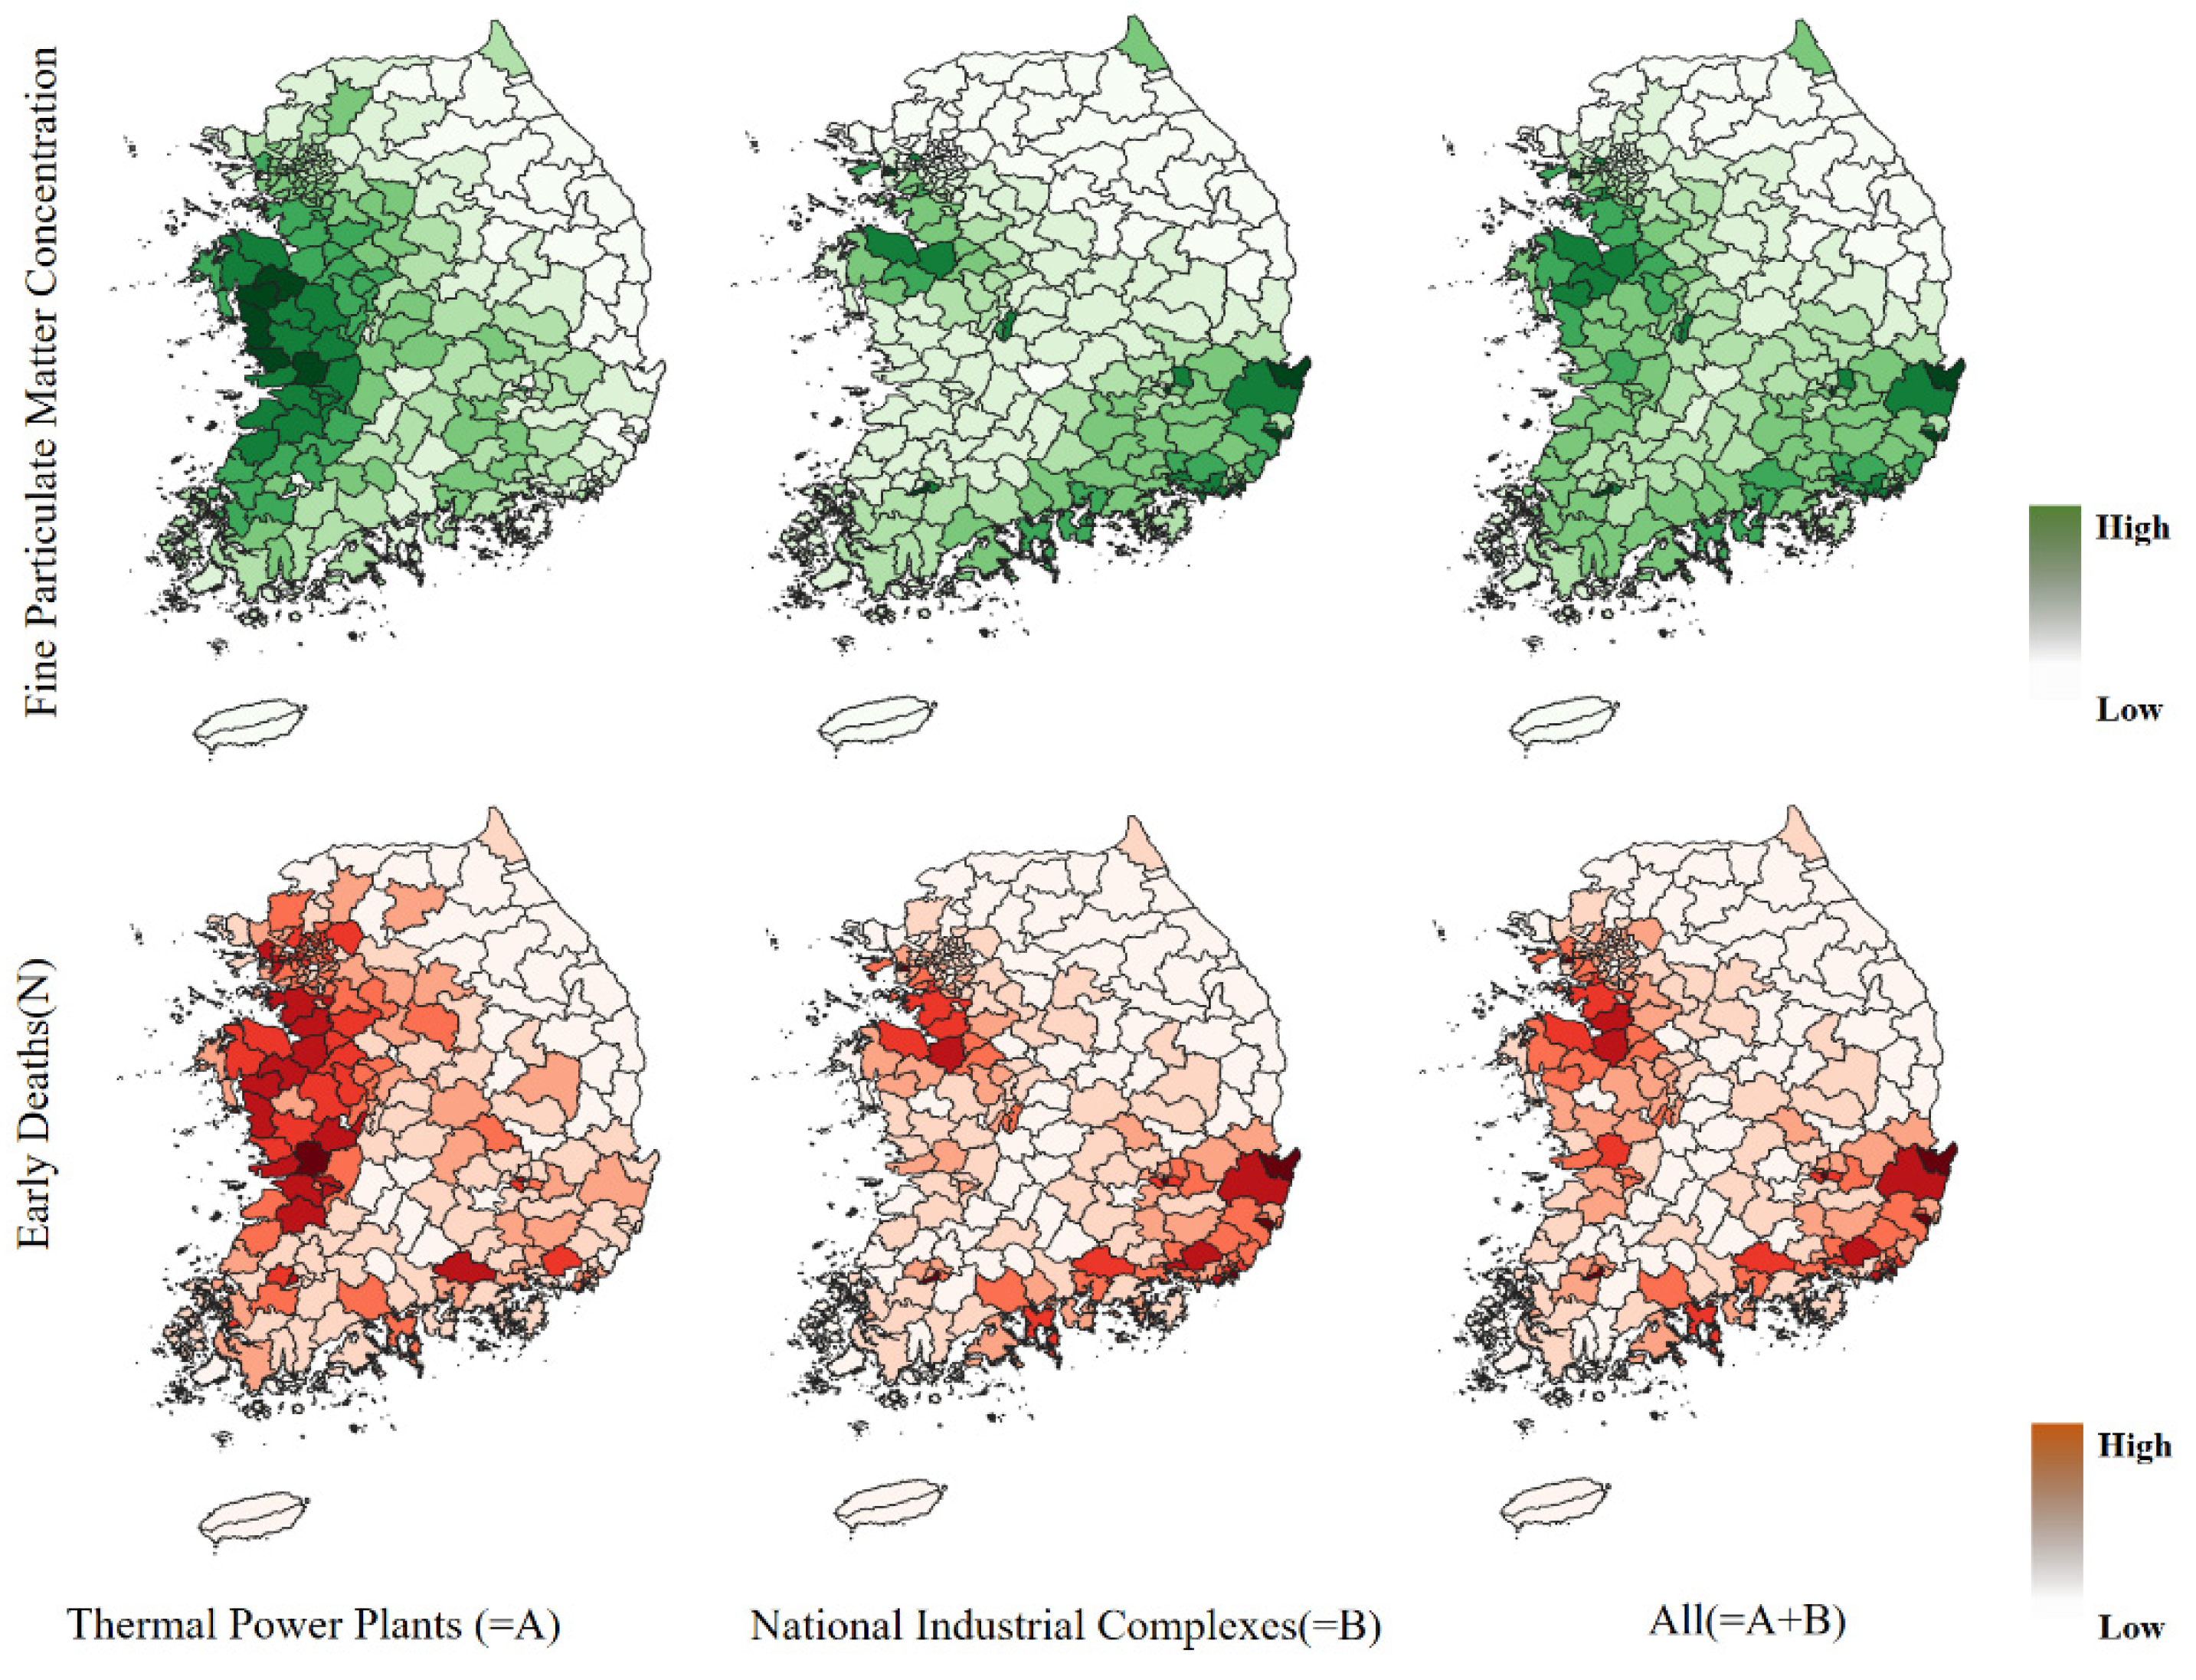
3.4. Changes in PM2.5 Concentration and Number of Early Deaths by Pollution Source

We calculated the contributions of domestic coal and LNG power plants to PM2.5 concentrations. Regarding domestic power plants, coal power plants contributed 0.51 μg/m3 and LNG plants contributed 0.10 μg/m3 to the annual mean PM2.5 concentrations. We found that the contribution of coal-fired power plants is equivalent to about 2% of the annual mean PM2.5 concentrations in South Korea (26 μg/m3) (Figure 4).
Additionally, we calculated the contributions of the selected major industrial complexes—the Sihwa-Banwol National Industrial Complex and the Daesan Petrochemical Complex—and the Special Measures for Atmospheric Conservation Zone to PM2.5 concentrations. The contributions of the Sihwa-Banwol National Industrial Complex, the Daesan Petrochemical Complex and the Special Measures for Atmospheric Conservation Zone to the annual mean PM2.5 concentrations were 0.09, 0.37, and 0.79 μg/m3, respectively. We found that the Special Measures for Atmospheric Conservation Zone contributes about 3% of the annual mean PM2.5 concentration in South Korea (Figure 4).
As a result of the analysis of the contribution of coal power plants to the PM2.5 concentration by local government, it was found that Chungcheongnam-do and Jeollabuk-do were most affected, with a contribution of about 1.2 μg/m3, followed by Sejong, with a contribution of 0.95 μg/m3. In the case of LNG power plants, the contributions of 0.24 μg/m3 in Incheon and 0.12 μg/m3 in Seoul were the highest. It can be seen that the main areas affected by coal power plants are Chungcheongnam-do and Jeollabuk-do, and the areas affected by LNG power plants are mainly in the metropolitan area, which show different patterns (Figure 5).
As a result of the analysis of the contribution of national industrial complexes to the PM2.5 concentration by local government, the Sihwa-Banwol Industrial Complex showed contributions of 0.45 μg/m3 in Gyeonggi-do and 0.2 μg/m3 in Incheon. The PM2.5 contributions near the Daesan Petrochemical Complex were high, in the order of 4.15 μg/m3 in Chungcheongnam-do, 1.02 μg/m3 in Sejong, 4.02 μg/m3 in Ulsan, and 3.59 μg/m3 in Gyeongsangnam-do in the NICs that fall under the Special Measures Area for Preventing Air Pollution (Figure 5).
Regarding the changes in PM2.5 concentration, the contributions of TPPs were found to be relatively high in the central region, while the contributions of NICs were relatively high in the northern parts of the central and southeast regions. This seems to have been affected not only by the location of such facilities, but also by the emission of causative substances that can contribute to PM2.5 concentration. The changes in PM2.5 concentration considering both TPPs and NICs were found to be higher in the coastal areas than inland, centered in the SMR and southeast region.
The number of early deaths attributable to changes in PM2.5 concentration was found to be partially adjusted by the size of population exposed to it and the mortality of that demographic group. The change in PM2.5 concentration related to TPPs was relatively high in the central region, but the number of early deaths due to this change was significantly higher in the SMR with a larger exposed population. The changes in PM2.5 concentration related to NICs were relatively high in the northern parts of the central and southeastern regions, but the number of early deaths due to these changes was higher in the SMR and the entire southeastern region, with a larger exposed population. The number of early deaths attributable to the change in PM2.5 concentration considering both TPPs and NICs was dependent on the change in PM2.5 concentration, but it was found to mainly be higher in the areas with a larger exposed population (Figure 6).
The nationwide change in PM2.5 concentration caused by the operation of TPPs was 0.611 μg/m3, while the change occurring in the SMR was 0.616 μg/m3, which was similar to the former. However, the total number of premature deaths attributable to changes in PM2.5 concentration was estimated to be 1017 nationwide, of which, 390, or 38.3% of the total, were in the SMR. The change in the central region (1.136 μg/m3) was more than twice that in the SMR, but the number of early deaths was estimated to be 238, which was relatively fewer than in the SMR (Table 4).
The nationwide change in PM2.5 concentration caused by the operation of NICs was 1.245 μg/m3, of which, the change in the southeastern region was 2.551 μg/m3, more than twice the former. Regarding the number of premature deaths attributable to the changes in PM2.5 concentration, a relatively small number was estimated in the southeast region compared to the degree of the concentration change, while a relatively large number was estimated in the SMR compared to the degree of the concentration change—the concentration change in the SMR was about one-third of that in the southeast area (Table 4).
The change in the concentration of PM2.5 nationwide caused by the operation of both TPPs and NICs was 1.856 μg/m3, and in the southeast region, the change was 2.971 μg/m3, which was about twice the national level. In the SMR, the concentration change was 1.440 μg/m3, which was lower than the national average, but the number of early deaths accounted for about 30% of the national average, which was similar to that in the southeast region (Table 4).
When compared by emission source, the nationwide change in PM2.5 concentration caused by the operation of NICs was 1.245 μg/m3, which was found to be about twice as large as the change of 0.611 μg/m3 that resulted from the operation of TPPs; the number of early deaths attributable to the operation of NICs and TPPs was 2091 and 1017, respectively, with the former being about twice that of the latter. On the other hand, in the SMR, the change in PM2.5 concentration due to the operation of TPPs was 0.616 μg/m3, which was found to be similar to that caused by the operation of NICs (which was 0.824 μg/m3), whereas in the southeast region, the concentration change caused by TPP operation was 0.420 μg/m3, which was found to be about one-sixth that of the change of 2.551 μg/m3 caused by NIC operation.

4. Discussion and Conclusions

4.1. Strengths of This Study

In previous studies, predictions of changes in PM2.5 concentration based on the emission of pollutants and estimations of the attributable number of early deaths were made without classifications of the emission source or region [11,12,13]. In this paper, South Korea’s PM2.5 concentration was predicted by classifying emission sources, and it was presented for each ACZ related to South Korea’s air quality policy. Based on this, the number of early deaths attributable to PM2.5 was estimated and suggested. It is expected that this estimation can provide more detailed data for the establishment of South Korea’s AQM policy in the future.
In this study, the PM 2.5 contribution concentration by emission source was estimated by modeling air quality to reflect the emission characteristics of TPPs and NICs, which are major domestic emission sources. In addition, modeling AQ with a high resolution of 3 km × 3 km enabled us to provide basic data including the contributions of PM2.5 concentration by municipality and ACZ, which can be used for the development of AQM policies.
Regarding TPPs, it is necessary to prioritize the management of pollutants that can affect the central region in relation to changes in PM2.5 concentrations. However, to further reduce the number of early deaths in terms of health benefits, more focus needs to be placed on the management of pollutants in the SMR. Regarding NICs, it is necessary to prioritize the management of emission sources that can affect the southeastern region in relation to the changes in PM2.5 concentrations, but if the number of early deaths is to be considered in terms of health benefits, the management of emission sources affecting the SMR should also be prioritized. Especially in the SMR, considering the number of early deaths in terms of health benefits, it is necessary to prioritize the management of pollutants from TPPs rather than from NICs. In the southeast region, considering the number of early deaths in terms of air quality improvement and health benefits, the management of emission sources must prioritize NICs over TPPs.

4.2. Limitations and Future Research Directions

4.2.1. Limitations of Considered Pollution Sources

In this study, PM2.5 concentrations caused by emissions from major NICs were estimated. Emissions from major NICs applied in this process accounted for about 85% of the total industrial sector emissions of 229,000 tons in terms of NOx (emissions from the manufacturing industry and industrial processes based on the CAPSS 2015); as such, the estimated PM2.5 contribution concentration only explained a part of the PM2.5 concentration contributed by all of the NICs. Therefore, to secure detailed data for AQM policy development, it will be necessary to predict changes in air quality, including additional major industrial complexes for each municipality or ACZ.
This study was conducted using data regarding NICs’ emissions in 2013 and TPPs’ emissions in 2015 (Table 3). In this study, it was more appropriate to use the 2015 data for both TPP and NIC emissions. However, the 2013 NIC emissions data were the latest data available at the time of this study, and it is estimated that there was no significant change in emissions between 2013 and 2015.
In South Korea, air pollutant emissions from small-scale factories as well as national industrial complexes are high, but emissions from small-scale factories have not been properly estimated. Recently, the Ministry of Environment in South Korea has been preparing a small-scale factory emission inventory. It is expected that the health impacts of industrial complexes will be high if emissions from small factories are included, and additional studies are planned in this regard.

4.2.2. Limitations on the Estimation of the Number of Early Deaths

The PM2.5-attributable number of early deaths estimated in this study has practical significance in that it was estimated based on changes in PM2.5 concentration for each major emission source and ACZ in South Korea. It may be used to prioritize AQM in the establishment of air management policies for each major emission source and ACZ. However, one should be very careful when using these numbers for the creation of actual policies. In general, the method for and results of estimating the number of early deaths suggested in this paper have two key limitations: methodological constraints and the interpretation of the results.
First, the limitations of the method used for the estimation of the number of early deaths are related to the representativeness of the concentration–response function (CFR) used as a calculation method. The CRF is expressed based on predicted values, including the relative risk (RR) and hazard ratio (HR) calculated through an epidemiological survey, and it is a key factor in estimating the number of early deaths. However, there is no domestic CRF standard for estimating the number of early deaths related to air pollution. In this study, the CRF proposed by the WHO was applied.
Just as the results of epidemiological studies generally vary depending on when, where, and for whom they are conducted, those of the CRF may also vary depending on the time, place, and demographic group exposed to air pollution [35]. For example, the concentration and chemical composition of air pollutants and the health care systems that can respond to the health effects caused by exposure to pollutants may vary with time and place. In addition, even at the same time and place of exposure, the degree of health effects caused by exposure to air pollutants may vary depending on who is exposed to them. A study by Kim et al. targeting South Korea reported that the association between ambient air particles and mortality in Seoul was gradually increasing [36].
In the past, many studies targeting South Korea were conducted using the CRF. Using the findings of such studies, attempts to estimate the number of early deaths and apply it to policies have caused confusion in the establishment of policies [10,37]. To estimate the health burden caused by exposure to air pollutants, including the number of early deaths, and utilize it in policy making, it is necessary to develop a CRF standard suitable for the current situation in South Korea.
Second, the interpretation of the estimated number of early deaths is linked to the epidemiological survey method involved in the calculation of CRF. The survey was conducted by largely classifying effects into short-term and long-term exposure effects according to the characteristics of exposure to air pollutants. Depending on the classification, the scale of the health effects may have been derived and presented differently.
Ha and Moon (2013) reported that CRF estimation might have uncertainty in the model design and estimation process of statistical analysis [37]. In particular, they pointed out that the CRF, which evaluates the acute health effects of short-term exposure using the log-linear regression model, cannot completely exclude other air pollutants and weather conditions and may vary depending on assumptions related to exposure lag days.
Regarding the characteristics of exposure to air pollution, Künzli et al. (2001) described the analysis method and meaning by classifying short-term and long-term exposures [38]. They proposed a log-linear regression model deriving RR and a Cox proportional hazards model deriving HR as representative analytical models for each exposure. On the other hand, the death-related effects attributable to air pollution were divided into acute effects triggering death by exposure to air pollution and chronic effects in the form of underlying frailty leading to death. Finally, while health effects from long-term exposure accounted for both acute and chronic effects, those from short-term exposure only accounted for acute effects; they found that there was about a 10-fold difference in absolute values of the CRF.
In South Korea, multiple studies have been conducted regarding short-term exposure using the CRF. To evaluate the health effects of long-term exposure to air pollution, long-term epidemiological surveys including cohort construction should be planned and conducted.

4.3. Conclusions

For PM2.5 concentration management, not only should substances generating PM2.5 and related pollution sources be managed, but also, the health burden caused by exposure to PM2.5 should be considered. The PM2.5 concentration in a specific area is determined by the location of facilities acting as pollution sources and emitted pollutants, but the priority of AQM by region or related facility may vary depending on other characteristics, including the size of demographic groups exposed to the PM2.5 concentration. However, in establishing an AQM policy focusing on PM2.5 in a community of a certain size or larger (usually a nation), it is considered that the usefulness of the findings regarding the causes contributing to the concentration and the degree of the health burden caused by exposure to the concentration may vary depending on how the spatial resolution of quantitative analyses, and related detailed data, are obtained and applied.
The analysis results presented in this study have significance in that they provide a basis for setting the direction of South Korea’s AQM policy. This study was only conducted at the level of confirming the main direction of the AQM policy for each ACZ currently established in South Korea through our analysis results. However, if the spatial resolution of quantitative analyses is increased in future studies and more detailed data regarding PM2.5 sources are applied, it is expected that these data will be used to set the direction of AQM policies for small communities within ACZs in South Korea.

Author Contributions

J.H. wrote the entire analysis and interpretation of this paper, as well as the main text. J.S. organized the data used in the paper and performed statistical analyses. N.M. played a role in setting the overall plan and direction of the paper. All authors have read and agreed to the published version of the manuscript.

Funding

This research received no external funding.

Institutional Review Board Statement

Not applicable.

Informed Consent Statement

Not applicable.

Data Availability Statement

Not applicable.

Acknowledgments

This paper was prepared based on the Korea Environment Institute (KEI) “Analysis System for Regional Environmental Status to Support Environmental Assessment” (GP2017-04, GP2019-06) and was part of the research results of “Development of Technology for Environmental Health Status Assessment by Environmental Hazard Factors Exposure (2022-010(R))”, a project conducted by the Korea Environmental Institute (KEI) in 2022, with the support of the Korea Environmental Industry & Technology Institute (KEITI)’s project, “Digital Infrastructure Building Project for Monitoring, Surveying and Evaluating the Environmental Health” (Project No. 2021003330006).

Conflicts of Interest

The authors declare no conflict of interest.

References

  1. Kim, B.-U.; Kim, O.; Kim, H.C.; Kim, S. Influence of fossil-fuel power plant emissions on the surface fine particulate matter in the Seoul Capital Area, South Korea. J. Air Waste Manag. Assoc. 2016, 66, 863–873. [Google Scholar] [CrossRef]
  2. Kim, S.; Kim, O.; Kim, B.-U.; Kim, H.C. Impact of Emissions from Major Point Sources in Chungcheongnam-do on Surface Fine Particulate Matter Concentration in the Surrounding Area [Internet]. J. Korean Soc. Atmos. Environ. 2017, 33, 159–173. [Google Scholar] [CrossRef]
  3. Buonocore, J.J.; Dong, X.; Spengler, J.D.; Fu, J.S.; Levy, J.I. Using the Community Multiscale Air Quality (CMAQ) model to estimate public health impacts of PM2.5 from individual power plants. Environ. Int. 2014, 68, 200–208. [Google Scholar] [CrossRef] [PubMed]
  4. Gao, M.; Beig, G.; Song, S.; Zhang, H.; Hu, J.; Ying, Q.; Liang, F.; Liu, Y.; Wang, H.; Lu, X.; et al. The impact of power generation emissions on ambient PM2.5 pollution and human health in China and India. Environ. Int. 2018, 121, 250–259. [Google Scholar] [CrossRef] [PubMed]
  5. Environmental Protection Agency. The Benefits and Costs of the Clean Air Act from 1990 to 2020; Environmental Protection Agency: Washington, DC, USA, 2011. [Google Scholar]
  6. Ministry of Environment. The Second Basic Plan on the Metropolitan Area Air Quality Management (2015–2024); Ministry of Environment: Sejong, Republic of Korea, 2013. [Google Scholar]
  7. Lelieveld, J.; Evas, J.S.; Fnais, M.; Giannadaki, D.; Pozzer, A. The contribution of outdoor air pollution sources to premature mortality on a global scale. Nature 2015, 525, 367–371. [Google Scholar] [CrossRef]
  8. Zhang, Q.; Jiang, X.; Tong, D.; Davis, S.J.; Zhao, H.; Geng, G.; Feng, T.; Zheng, B.; Lu, Z.; Streets, D.G.; et al. Transboundary health impacts of transported blobal air pollution and international trade. Nature 2017, 543, 705–709. [Google Scholar]
  9. Ministry of Environment. A Study on the Establishment and Application of Health Evaluation Model for Reduction of Environmental Pollution Control Policy; Ministry of Environment: Sejong, Republic of Korea, 2007. [Google Scholar]
  10. Ministry of Environment. The Study of Setting Policy Direction for Risk Management of Air Pollution; Ministry of Environment: Sejong, Republic of Korea, 2013. [Google Scholar]
  11. Bae, H.J.; Park, J. Health benefits of improving air quality in the rapidly aging Korean society. Sci. Total Environ. 2009, 407, 5971–5977. [Google Scholar] [CrossRef]
  12. Bae, H.J.; Kim, M.; Lee, A.K.; Park, J. Acute Effects of PM10 on Asthma Hospitalization Among Children and Benefit Analysis at Four Major Cities in Korea. J. Environ. Health Sci. 2009, 35, 1–10, (In Korean with English Abstract). [Google Scholar] [CrossRef]
  13. Bae, H.J.; Shin, J.Y.; Park, C.K.; Jung, K. Improving of Atomospheric PM2.5 Levels and Related Premature Deaths in Seoul, Korea. J. Korean Soc. Atmos. Environ. 2010, 26, 10–20, (In Korean with English Abstract). [Google Scholar] [CrossRef]
  14. Kim, H.C.; Kim, S.; Lee, S.-H.; Kim, B.-U.; Lee, P. Fine-Scale Columnar and Surface NOx Concentrations over South Korea: Comparison of Surface Monitors, TROPOMI, CMAQ and CAPSS Inventory. Atmosphere 2020, 11, 101. [Google Scholar] [CrossRef]
  15. Hur, S.K.; Ho, C.H.; Kim, J.; Oh, H.-R.; Koo, Y.S. Systematic bias of WRF-CMAQ PM10 simulations for Seoul, Korea. Atmos. Environ. 2021, 244, 117904. [Google Scholar] [CrossRef]
  16. Choi, M.-W.; Lee, J.-H.; Woo, J.-W.; Kim, C.-H.; Lee, S.-H. Comparison of PM2.5 Chemical Components over East Asia Simulated by the WRF-Chem and WRF/CMAQ Models: On the Models’ Prediction Inconsistency. Atmosphere 2019, 10, 618. [Google Scholar] [CrossRef]
  17. Zhang, Q.; Xue, D.; Liu, X.; Gong, X.; Gao, H. Process analysis of PM2.5 pollution events in a coastal city of China using CMAQ. J. Environ. Sci. 2019, 79, 225–238. [Google Scholar] [CrossRef]
  18. Uranishi, K.; Ikemori, F.; Shimadera, H.; Kondo, K.; Sugata, S. Impact of field biomass burning on local pollution and long-range transport of PM2.5 in Northeast Asia. Environ. Pollut. 2019, 244, 414–422. [Google Scholar] [CrossRef]
  19. Hong, S.Y.; Dudhia, J.; Chen, S.H. A Revised Approach to Ice Microphysical Processes for the Bulk Parameterization of 437 Clouds and Precipitation. Mon. Weather Rev. 2004, 132, 103–120. [Google Scholar] [CrossRef]
  20. Mlawer, E.J.; Taubman, S.J.; Brown, P.D.; Iacono, M.J.; Clough, S.A. Radiative transfer for inhomogeneous atmosphere: 440 RRTM, a validated correlated-K model for the longwave. J. Geophys. Res. 1997, 102, 16663–16682. [Google Scholar] [CrossRef]
  21. Dudhia, J. Numerical Study of Convection Observed during the Winter Monsoon Experiment Using a Mesoscale Two-443 Dimensional Model. J. Atmos. Sci. 1989, 46, 3077–3107. [Google Scholar] [CrossRef]
  22. Jiménez, P.A.; Dudhia, J.; González-Rouco, J.F.; Navarro, J.; Montávez, J.P.; García-Bustamante, E. A Revised Scheme for 446 the WRF Surface Layer Formulation. Mon. Weather Rev. 2012, 140, 898–918. [Google Scholar] [CrossRef]
  23. Chen, F.; Dudhia, J. Coupling an Advanced Land Surface-Hydrology Model with the Penn State-NCAR MM5 Modeling 448 System, Part I: Model Implementation and Sensitivity. Mon. Weather Rev. 2001, 120, 569–585. [Google Scholar] [CrossRef]
  24. Hong, S.Y.; Noh, Y.; Dudhia, J. A New Vertical Diffusion Package with an Explicit Treatment of Entrainment Processes. Mon. Weather Rev. 2006, 134, 2318–2341. [Google Scholar] [CrossRef]
  25. Kain, J.S. The Kain-Fritsch Convective Parameterization: An Update. J. Appl. Meteorol. Climatol. 2004, 43, 170–181, 453. [Google Scholar] [CrossRef]
  26. Carter, W.P.L. Documentation of the SAPRC-99 Chemical Mechanism for VOC Reactivity Assessment; Air Pollution Research Center and College of Engineering Center for Environmental Research and Technology University of California: Pasadena, CA, USA, 1999; Available online: https://intra.engr.ucr.edu/~carter/pubs/s99doc.pdf (accessed on 1 March 2020).
  27. Colella, P.; Woodward, P.L. The piecewise parabolic method (PPM) for gasdynamical simulations. J. Comput. Phys. 1984, 461, 174–201. [Google Scholar] [CrossRef]
  28. Louise, J.F. A Parametic Model of Vertical Eddy Fluxes in the Atmosphere. Bound.-Layer Meteor. 1979, 17, 187–202. [Google Scholar] [CrossRef]
  29. Pleim, J.E.; Chang, J.S. A non-local closure model in the convective boundary layer. Atmos. Environ. 1992, 26, 965–981. [Google Scholar] [CrossRef]
  30. Environmental Protection Agency. BenMAP: Environmental Benefits and Mapping Analysis Program—Community Edition User’s Manual; Environmental Protection Agency: Washington, DC, USA, 2022. [Google Scholar]
  31. Davidson, K.; Hallberg, A.; McCubbin, D.; Hubbell, B. Analysis of PM2.5 using the Environmental Benefits Mapping and Analysis Program (BenMAP). J. Toxicol. Environ. Health 2007, 32, 571–577. [Google Scholar]
  32. World Health Organization. Health Risks of Air Pollution in Europe-HRAPIE Project: Regional Office for Europe; World Health Organization: Geneva, Switzerland, 2013. [Google Scholar]
  33. Mircea, M.; Calori, G.; Pirovano, G.; Belis, C. EUR 30082 EN; European Guide on Air Pollution Source Apportionment for Particulate Matter with Source Oriented Models and Their Combined Use with Receptor Models. Publications Office of the European Union: Luxembourg, 2020; p. JRC119067ISBN 978-92-76-10698-2. [CrossRef]
  34. Emery, C.; Liu, Z.; Russell, A.G.; Odman, M.T.; Yarwood, G.; Kumar, N. Recommendations on statistics and benchmarks 467 to assess photochemical model performance. J. Air Waste Manag. Assoc. 2017, 67, 582–598. [Google Scholar]
  35. Gordis, L. Epidemiology, 4th ed.; Elsevier: Berkeley, CA, USA, 2008. [Google Scholar]
  36. Kim, H.; Kim, H.; Lee, J.T. Effects of ambient air particles on mortality in Seoul: Have the effects changed over time? Environ. Res. 2015, 140, 684–690. [Google Scholar] [CrossRef]
  37. Ha, J.; Moon, N. Uncertainty and estimation of health burden from particulate matter in Seoul metropolitan region. J. Korean Soc. Atmos. Environ. 2013, 29, 275–286, (In Korean with English Abstract). [Google Scholar]
  38. Künzli, N.; Medina, S.; Kaiser, R.; Quenel, P.; Horak Jr, F.; Studnicka, M. Assessment of deaths attributable to air pollution: Should we use risk estimates based on time series or on cohort studies? Am. J. Epidemiol. 2001, 153, 1050–1055. [Google Scholar]
Figure 1. Modeling domains for air quality simulation.
Atmosphere 14 00344 g001
Figure 2. Distributional characteristics of the (a) administrative district; (b) Air Control Zone; (c) air pollution sources; and (d) exposed population and (e) mortality.
Atmosphere 14 00344 g002
Figure 3. Comparison of observed and simulated concentrations of PM2.5 over the South Korea AQMS in 2015.
Atmosphere 14 00344 g003
Figure 4. PM2.5 contribution concentrations from emissions of (a) coal power plants; (b) LNG power plants; (c) the Sihwa-Banwol Industrial Complex; (d) the Daesan Petrochemical Complex; and (e) NICs that fall under the Special Measures Area for Preventing Air Pollution.
Atmosphere 14 00344 g004
Figure 5. PM2.5 contribution concentration for each region from emissions of (a) TPPs; and (b) NICs.
Atmosphere 14 00344 g005
Figure 6. Changes in PM2.5 concentration and early deaths.
Atmosphere 14 00344 g006
Table 1. Summary of WRF and CMAQ configuration.
(a) WRF
PhysicsSelected OptionReference
MicrophysicsWSM 3-class simple ice scheme [19]
Longwave RadiationRRTM scheme [20]
Shortwave RadiationDudhia scheme [21]
Surface LayerRevised MM5 Monin–Obukhov scheme[22]
Land SurfaceUnified Noah land–surface model [23]
Planetary Boundary layerYSU scheme [24]
Cumulus ParameterizationKain–Fritsch scheme [25]
(b) CMAQ
CategorySelected OptionReference
Chemical MechanismSAPRC99 [26]
Advection Scheme PPM [27]
Horizontal DiffusionMultiscale [28]
Vertical DiffusionEddy [28]
Cloud Scheme ACM [29]
Table 2. Statistics for PM2.5 at the South Korea air quality monitoring stations.
Number of Sites (N)Annual Mean (μg/m3)RBiasRMSEIOA
ObservedModeled
Annual9524.7921.160.50−3.6216.640.68
Table 3. Annual emissions of major substances by pollution source in South Korea.
SubstancesCAPSS 2015CAPSS 2013
Nationwide (Tons/Year)TPPs (Tons/Year)Percentage (TPPs/Nationwide)Nationwide (Tons/Year)NICs (Tons/Year)Percentage (TPPs/Nationwide)
NOx1,090,614130,86012.0%1,157,728195,19916.9%
SOx404,66070,77717.5%352,292158,77745.1%
VOC913,57312,3841.4%1,010,771235,07023.3%
CO696,68247,3696.8%792,77675,6949.5%
NH3292,9738640.3%297,16724,6988.3%
PM10121,56341663.4%233,17768,83229.5%
PM2.576,80234504.5%98,80637,48937.9%
Table 4. Changes in PM2.5 concentration for each ACZ and the attributable number of early deaths.
ClassificationSMRCentral RegionSoutheast RegionSouthern RegionOtherNationwide
Number of people aged 30 and over (N)16,614,550 3,909,205 7,410,629 1,672,892 4,517,311 34,124,587
Mortality of people aged 30 and over (N per 100,000)632 879 799 866 1273 793
Contribution concentration and number of early deaths by PM2.5 emission sourceTPPsPM2.5 concentration (μg/m3)0.616 1.136 0.420 0.695 0.503 0.611
Level of concentration compared to the national level1.010 1.861 0.687 1.139 0.823 1.000
Number of early deaths (N (95% CI))390 (254~525)238 (156~321)150 (98~202)61 (39~82)178 (116~240)1017 (663~1369)
Contribution to the number of early deaths nationwide38.3%23.4%14.8%6.0%17.5%100.0%
NICsPM2.5 concentration (μg/m3)0.824 1.361 2.551 1.336 0.883 1.245
Level of concentration compared to the national level0.662 1.093 2.048 1.073 0.709 1.000
Number of early deaths508 (332~684)286 (187~384)874 (572~1173)116 (76~156)308 (201~415)2091 (1367~2812)
PM2.5 contribution to the number of early deaths nationwide24.3%13.7%41.8%5.6%14.7%100.0%
TotalPM2.5 concentration (μg/m3)1.440 2.497 2.971 2.031 1.386 1.856
Level of concentration compared to the national level0.776 1.345 1.601 1.094 0.747 1.000
Number of early deaths (N (95% CI))898 (586~1209)524 (342~705)1024 (670~1375)177 (115~238)486 (317~655)3108 (2030~4181)
PM2.5 contribution to the number of early deaths nationwide28.9%16.9%32.9%5.7%15.6%100.0%
Disclaimer/Publisher’s Note: The statements, opinions and data contained in all publications are solely those of the individual author(s) and contributor(s) and not of MDPI and/or the editor(s). MDPI and/or the editor(s) disclaim responsibility for any injury to people or property resulting from any ideas, methods, instructions or products referred to in the content.

