Article

How Climate Change Affects River and Lake Water Temperature in Central-West Poland—A Case Study of the Warta River Catchment

Department of Land Improvement, Environmental Development and Spatial Management, Poznań University of Life Sciences, Piątkowska 94E, 60-649 Poznań, Poland
*
Author to whom correspondence should be addressed.
Atmosphere 2023, 14(2), 330; https://doi.org/10.3390/atmos14020330
Submission received: 12 December 2022 / Revised: 16 January 2023 / Accepted: 3 February 2023 / Published: 7 February 2023
(This article belongs to the Special Issue Water Management and Crop Production in the Face of Climate Change)

Abstract

:
Climate change has a significant impact on the abiotic and biotic environment. An increase in air temperatures translates into higher temperatures of water constituting the habitat of a wide range of species. The purpose of this study is to present the direction and extent of water temperature increases in eight rivers and three lakes on a monthly and annual basis. The analysis of river water temperatures used both measured data and data reconstructed using artificial neural networks from the period of 1984–2020. The analysis of the direction and extent of changes in air and water temperatures was performed using Mann-Kandall tests and a modified Sen test. The analysis of water temperature changes was conducted against the background of climatic conditions and catchment characteristics. The results indicate that in the Warta River basin in the period of 1984–2020, the average annual temperature rise reached 0.51 °C decade−1, ranging from 0.43 to 0.61 °C decade−1. This translated into an increase in mean annual water temperatures in lakes in a range from 0.14 to 0.58 °C decade−1, and for rivers in a range from 0.10 to 0.54 °C decade−1. The greatest changes in air temperature occurred in April, June, August, September, and November. It was reflected in an increase in water temperature in lakes and rivers. However, these changes did not occur in all rivers and lakes, suggesting the role of local factors that modify the effect of climate change. The study showed that the extent of air temperature changes was significantly higher than the extent of water temperature changes in rivers.

1. Introduction

Climate change is one of the most serious challenges faced by humanity. Surface water temperature is a key parameter in the investigation of the environmental and ecological impacts of climate change [1]. Temperature determines the course of many processes and phenomena [2,3]. A change in temperature triggers modifications in the hydrological regime and water quality [4,5].
To date, research regarding changes in the thermal regime of river in different regions of the world points to an increasing trend [6,7,8,9,10,11,12]. In Europe, the process of heating of inland waters progresses faster than in the case of marine and oceanic waters [13,14,15]. It is caused by the overlapping effect of climate change and human pressure. It is estimated that over the last century, water temperature in lakes and rivers increased from 1 to 3 °C. It is simultaneously emphasised that the future direction of changes will be maintained, and their rate will increase [15,16]. Moreover, the subject of many studies is the dependency of air and water temperature, as well as the rate of these changes [11,17,18]. According to research, differences in the response of the thermal regime of a river to air temperature depend on the type of river and catchment characteristics [19,20]. Rivers flowing through forests show lower increasing temperature trends in comparison to waters flowing through agricultural areas [4]. In Poland and Germany, the lowland rivers are the most susceptible to climate change [19,21]. In urban catchments, reduced infiltration capacities increase rapid flow, although in periods with no rainfall, they contribute to a decrease in river supply and occurrence of low water stages, and consequently to faster water heating [6,22,23,24]. Moreover, hydrotechnical infrastructure contributes to a change in the hydrological and thermal regime. As a consequence, it worsens the physicochemical state of water [25,26,27]. Changes in thermal conditions are also shaped by the functioning of power plants, through discharge of technological waters used for cooling [4,28,29].
The analysis of changes in thermal conditions of waters is conducted in the context of their impact on living organisms, and particularly fish [30,31,32,33]. Changes in the thermal conditions of waters lead to disturbances in food webs [34,35]. Warming of waters favours the development of parasites, for example, myxozoan organisms responsible for kidney diseases in fish from the Salmonid family. It is one of the causes of the disappearance of the population of these organisms in the natural environment, particularly affecting areas of Europe and North America [36,37]. Another disorder resulting from temperature stress in fish is skeletal deformation [38].
Thermal conditions are one of the primary factors shaping habitats and their distribution [14]. Permanent transformations of thermal regime pose a threat to native and endemic species, showing a weak ability to adaptation to new abiotic conditions. It favours the development of invasive species, usually showing higher temperature tolerance and less susceptibility to changes in environmental conditions [31,39,40].
In Europe, river waters are more affected by climate change than marine and ocean waters [14,15]. Therefore, rivers are more vulnerable to biodiversity loss than seas and oceans. Moreover, it is projected that in the near future the greatest losses will occur in the case of common species of ichthyofauna and invertebrate macrofauna. A large portion of rare species may be subject to a reduction in abundance or completely disappear [6,30,31,34,39,40,41,42,43,44].
Proper identification of the direction of changes and their extent may also provide the basis for undertaking activities aimed at mitigating the effects of climate change [45]. The objective of the paper is the assessment of the direction and extent of changes in water temperatures in rivers and lakes in the context of changes in air temperature. The analysis was conducted for the period of 1984–2020 for eight rivers and three lakes within the Warta River catchment in Poland. The analysis is a starting point for undertaking effective measures aimed at limiting the effect of climate change on waters, and identification of future threats to water ecosystems and those dependent on them.

2. Materials and Methods

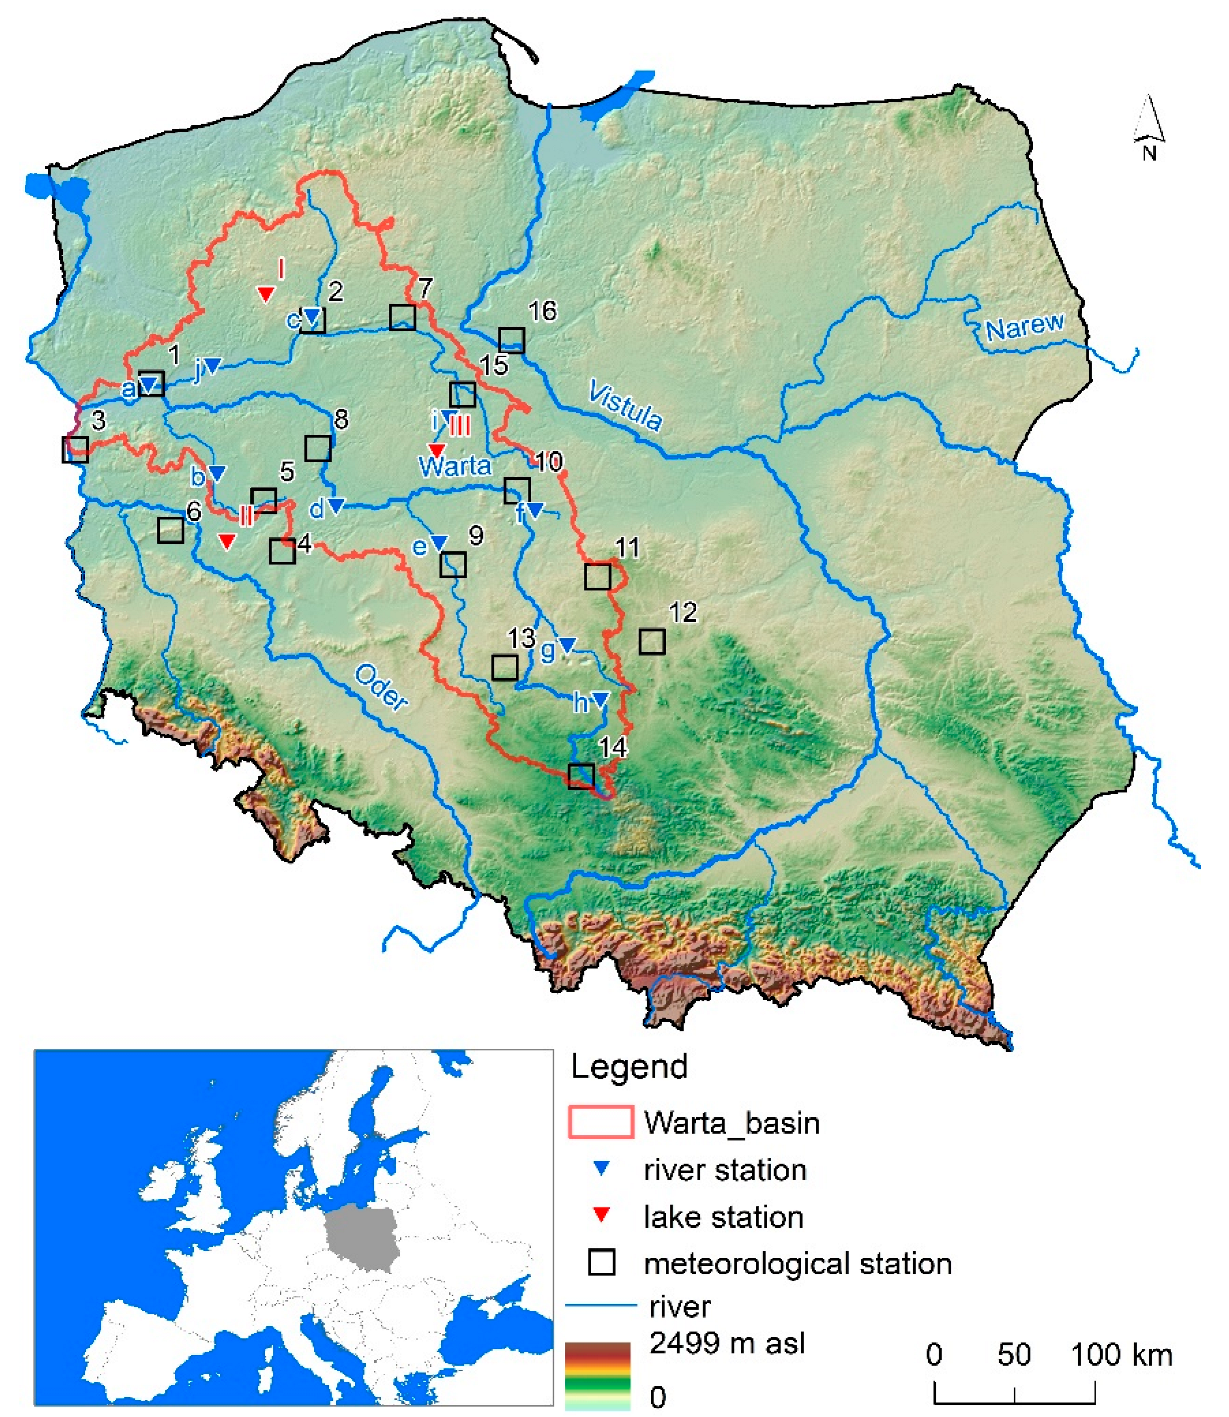
2.1. Study Site Area

The study area is the Warta River basin with an area of 54.5 × 10³ km2, accounting for almost 18% of the territory of Poland. The Warta River has a length of around 800 km. It is one of the longest rivers in Poland, and the longest right-bank tributary of the Oder River. The analysis covered three hydrological stations in the upper, middle, and lower course of the Warta River, namely, stations Bobry, Śrem, and Gorzów Wielkopolski, respectively. Direct tributaries of the Warta River were selected for analysis, i.e., the Noteć, Widawka, Ner, Prosna, and Obra Rivers. Two secondary tributaries of Warta were also analysed. The Mała Noteć and Gwda Rivers are direct tributaries of the Noteć River (Figure 1) (Table 1). The mean annual air temperature in the study area ranges from 8 to 9 °C. The highest mean values occur in the southern and western part of the catchment, and the lowest in its north-eastern fragment. The highest mean annual precipitation occurs in the northern part of the catchment, reaching almost 700 mm. Over a major area of the catchment, precipitation below 550 mm is recorded. The Warta basin has an agricultural character. The arable land occupies 60% of the total basin area. This type of land use is particularly dominant in the central part of the basin. The north-western part is primarily occupied by forest, constituting approximately 30% of the basin area. The third most important type of land use in the Warta basin is the anthropogenic area, including its largest cities: Poznań, Łódź, Częstochowa, and Gorzów Wielkopolski.

2.2. Materials

The investigation of the direction and extent of changes in thermal conditions was based on daily water and air temperatures from the period of 1984–2020, provided by the Institute of Meteorology and Water Management—National Research Institute (IMGW-PIB). Data series regarding water temperature in rivers were incomplete; therefore, reconstruction of the data was conducted employing the artificial neural networks model, described in detail in Section 2.3. Daily temperatures provided the basis for the calculation of mean monthly and mean annual temperatures. The analysis of the direction and extent of changes in water and air temperatures was performed in reference to months and hydrological years. The hydrological year begins on 1 November of the preceding year and ends on 31 October. The analysis was conducted for 29 stations (Table 1). The dataset covered 10 hydrological stations on 8 rivers, 3 hydrological stations on lakes, and 16 meteorological stations. The distribution of the analysed stations is presented in Figure 1. Four meteorological stations and one lake hydrological station are located outside of the boundaries of the Warta River basin. However, data from these stations were necessary for the reconstruction of the missing data.

2.3. Data Reconstruction

The first stage involved verification of the obtained data in terms of their completeness. The analysis showed that none of the hydrological stations of rivers had a complete set of data (Table 2). As a result, it was necessary to reconstruct the data to obtain a data series of the same timeframe for further analysis in each case. The paper employed the artificial neural networks model. The artificial neural networks model provides better results than multiple regression and random tree methods [46,47,48,49]. The data reconstruction applied a methodology developed by Sojka and Ptak [49], using a multilayer perceptron network (MLP). The research showed the best results of water temperature reconstruction in rivers obtained based on data from three meteorological stations and one hydrological station from the nearest lake. MLP network learning was based on data from the period of 1984–2015. Data were divided into two parts. The first includes 70% of the data used during the artificial neural network learning stage, and the second includes 30% of the data used during the testing and validation stage. Finding the optimal MLP network architecture employed the automated network design method. Designing the network architecture covered the determination of the number of input and output variables (i.e., neurons in input and output layers), and the determination of the number of hidden layers and neurons in each hidden layer. Three-layer network architecture was assumed, with the second hidden layer containing from 3 to 20 neurons. Input data were mean monthly air temperatures (from three meteorological stations) and mean monthly lake water temperatures (from the nearest lake). Moreover, the analysis involved the application of a qualitative variable, i.e., monthly index. The output variables were mean monthly river water temperatures. The network development assumed the following activation functions: Linear, logistic, tanh, exponential, and sinus. Each time, 100 different network architectures were tested, resulting in the attainment of 5 networks with the best results. Finally, one reference network was selected out of the 5 best networks—based on statistical parameters describing errors obtained at the stage of model validation. Model validation applied the following statistical parameters: Coefficient of determination, root mean square error, normalised root mean square error, Nash–Sutcliffe model efficiency coefficient, and mean absolute percentage error. The method of calculation of particular statistical parameters is presented in Table S1. The MLP was developed in the Statistica programme version 13.1 (TIBCO Software Inc., Palo Alto, CL, USA) [50].

2.4. Analysis of the Direction and Extent of Temperature Changes

The determination of the direction and extent of changes in mean monthly water and air temperatures employed non-parametric Mann-Kendall and Sen tests. The Mann-Kandall test is usually applied in research on trends of meteorological and hydrological variables [7,51,52,53,54,55,56,57]. The Mann-Kendall is a non-parametric test; therefore, the analysed variables do not have to show normal distribution. Moreover, the test is resistant to the occurrence of extreme observations [58]. Standard analysis by means of a Mann-Kendall test calculates values of statistic S, the variance of statistic S, and the test statistic Z. The primary assumption of the Mann-Kendall test is the lack of autocorrelation in data series. The occurrence of data autocorrelations may result in an underestimation of Var(S). As a result, a corrected value of variance Var*(S) should be calculated [59]:
V a r * S = V a r S n n *
where:
n is the sample size; and
n* is the effective sample size.
Ratio n/n* is the correction factor due to the existence of a serial correlation in sample data. It is calculated from the following formula:
n n * = 1 + 2 n n 1 n 2 j = 1 n 1 n k n k 1 n k 2 r k R
where:
k is the shift; and
rkR is the autocorrelation coefficient.
According to Hamed and Rao [60], only when the autocorrelation coefficient rkR is significant at a level of 0.05, the correction factor n/n* should be calculated, followed by the corrected variance Var*(S). Then, the value of the corrected variance Var*(S) is considered in the calculation of the test statistic Z. This method of data analysis was applied by Abdul Aziz and Burn [61], Khattak et al. [62], and Kumar et al. [63].
The determination of the extent of water and air temperature changes employed a non-parametric Sen test [64]. The Sen test is less sensitive to the occurrence of extreme observations than the linear regression method [53]. Changes in water and air temperature in time can be described by means of the following general formula:
f t = Q t + B
where Q is the slope of the trend line and B is the intercept. The Q value was calculated as a median from the trend line slope value between each possible pair of points in the set of monthly or annual water and air temperatures from the following formula:
Q = m e d i a n x m x l m l ,   l < m
where:
xl, xm denote the monthly/annual temperature; and
l, m denote the years.
The analysis of the direction and extent of changes by means of MK and S tests employed the modifiedmk package developed by Patakamuri and O’Brien [65]. The statistical analysis by means of a Mann-Kendall test was conducted with the assumption of the standard levels of significance of 0.05 and 0.01. Sen coefficient values were compared for meteorological and hydrological stations on rivers and lakes. The comparison aimed at the verification of the null hypothesis on the lack of significant differences between changes in air and water temperatures. For this purpose, a non-parametric U Mann-Whitney test was applied. The analysis was conducted at a significance level of 0.05.

3. Results

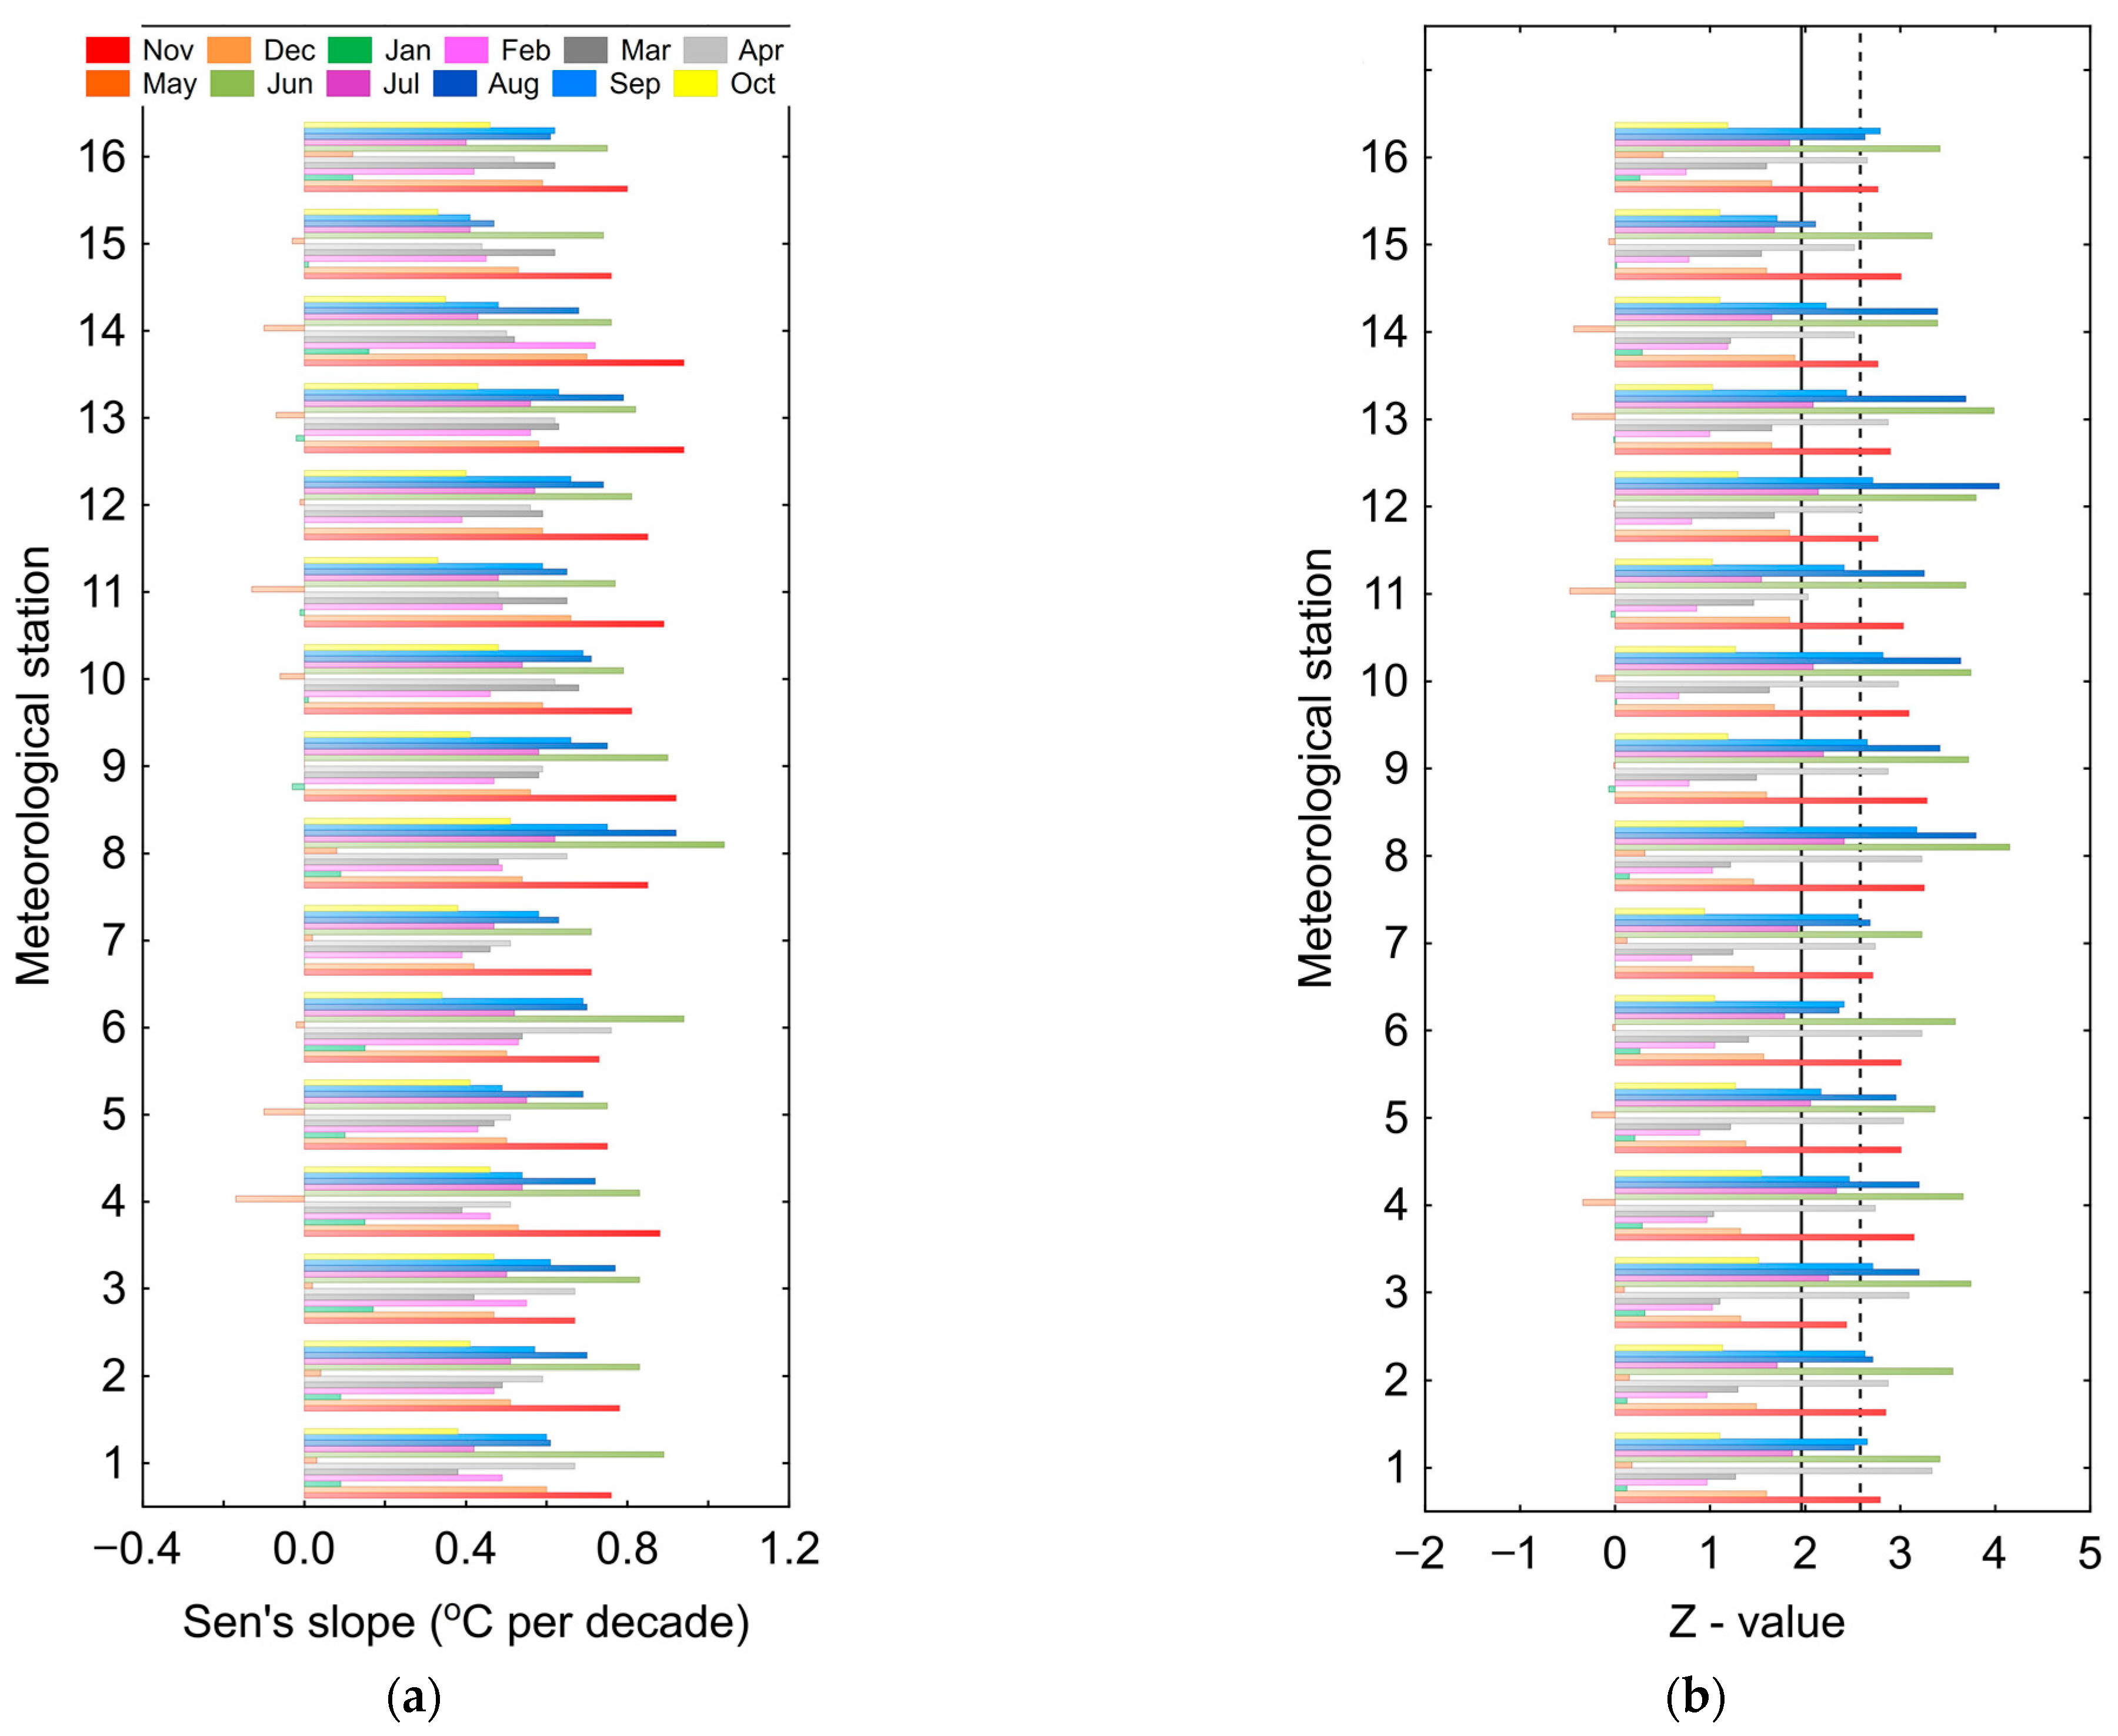
3.1. Air Temperature

The mean air temperature from the multiannual period of 1984–2020 for the analysed meteorological stations was 8.8 °C. The lowest values of mean annual air temperatures occurred at meteorological station Lgota Górna (No. 14) (7.95 °C) at the southern edge of the Warta River catchment. The highest mean annual air temperatures were recorded in meteorological station Słubice (No. 3) (9.46 °C) in the western part of the catchment. Regarding mean monthly air temperatures, July was the warmest (18.9 °C), and January was the coldest (−1.0 °C). Higher variability of air temperatures between meteorological stations was observed in winter months. The difference in mean monthly temperatures between stations in January is 2.5 °C. The lowest variability of air temperatures was observed in June. The difference in temperatures between stations was approximately 1.0 °C.
The trend analysis by means of a Mann-Kendall test revealed an increase in air temperatures in most meteorological stations both in reference to monthly and annual values (Table S2). Slight decreases in temperature, not statistically significant, occurred only in 2 months. The highest increase in air temperature occurred in stations Poznań (No. 8) (0.61 °C·decade−1), Wieluń (No. 3) (0.57 °C·decade−1), and Słubice (No. 13) (0.55 °C·decade−1). The lowest increase in air temperature occurred in station Kołuda Wielka (No. 15) (0.43 °C·decade−1). In nine out of sixteen analysed stations, an increase in air temperature higher than 0.50 °C·decade−1 was recorded (Figure 2). In each meteorological station, an increase in temperature in annual periods was statistically significant, and in monthly periods, significant changes were observed in April, June, August, and November. Increases in temperatures in November and June were in a range from 0.67 to 1.04 °C·decade−1 (Figure 3). The highest increase occurred in meteorological stations in the central and southern part of the catchment. For November, the highest increase in air temperature was recorded for stations Lgota Górna, Wieluń, and Kalisz, and in June for stations Poznań, Zielona Góra, and Kalisz (Table S2).

3.2. River Water Temperature

In the period of 1984–2020, the mean annual river water temperature in the Warta River basin ranges from 8.3 °C for the Gwda River (Piła station—No. c) to 12.2 °C for the Warta River (Śrem station—No. d). The lowest mean water temperatures were recorded in January (2.4 °C) and the highest in July (19.2 °C). Higher variability of water temperatures between the river stations occurred in the summer months (July—September). A different course of monthly water temperatures was observed in river station Szczerców on the Widawka River (No. g). Water temperatures in summer months were lower by approximately 1.5 °C in comparison to the remaining rivers, and for the winter period, temperatures were higher by approximately 2 °C. Changes in water temperatures in the Widawka River may be caused by the vicinity of an open-cast lignite mine in Bełchatów that discharges waters from the mine to the river. Waters supplied by the mine drainage reduce the temperature in the river in summer and increase it in winter. A somewhat different phenomenon was observed on the Ner River (No. f), where the calculated values of mean monthly water temperatures for the winter period exceeded temperatures in the remaining rivers (except for Widawka) by approximately 0.90 °C. In the summer period, the values were higher (0.13 °C). The situation particularly occurred in the first years of observation (1984–1994). It may result from the discharge of high amounts of industrial and municipal wastewater that had not been subject to appropriate treatment until the mid-1990s [66]. Moreover, the Ner River within the range of the hydrological station flows through a flat valley filled with peats. The above situation may be of great importance, in terms of water temperature changes, in the context of groundwater alimentation [9]. The statistical analysis of mean water temperatures for the period of 1984–2020 revealed transformations of river water temperatures in the Warta basin (Table S3). An average increase in water temperature in the period of 1984–2020 was approximately 0.35 °C·decade−1. The highest changes occurred in hydrological stations Śrem (No. d) and Zbąszyń (No. b), for which the mean annual temperature increased by 0.54 and 0.50 °C·decade−1, respectively (Figure 2). In comparison to hydrological stations Dąbie (Ner—No. f) and Bobry (Warta—No. h), the changes were as follows: 0.10 and 0.16 °C·decade−1. For the Ner River, an increase in mean annual water temperatures was not statistically significant. Ner is the only river where no significant changes in water temperatures were indicated in monthly or annual periods. On the one hand, a slight increase in water temperature in the Ner River in the period of 1984–2020 can be explained with a reduction in the discharge of wastewater to the waters after 1995. On the other hand, it can be explained with the increasing air temperature. In hydrological stations Bogusław (No. e), Gębice (No. i), Gorzów Wielkopolski (No. a), Śrem (No. d), Nowe Drezdenko (No. j), and Zbąszyń (No. b), increases in mean annual water temperatures expressed in values of the Sen coefficient were higher than 0.35 °C·decade−1.
In monthly periods, a trend for a decrease in water temperatures in rivers occurred only in 7%. They primarily concerned January and May, although the changes were not statistically significant. In the remaining cases, water temperatures increased. The highest increase in water temperatures in rivers was observed in November and June. Values of the Sen coefficient were in a range from 0.20 to 0.85 °C decade−1, whereas the average for November was 0.55 °C decade−1, and for June 0.60 °C decade−1. Moreover, it was evidenced that in June in all hydrological stations except for station Dąbie (No. f), a significant increase in temperatures occurred. In May, the lowest changes in water temperatures were observed, varying from −0.15 to 0.30 °C decade−1. Considering particular hydrological stations, the highest number of statistically significant changes was recorded for stations Zbąszyń (Obra River—No. b.), Nowe Drezdenko (Noteć—No. j), and Śrem (Warta—No. d), for 9 months each. For 8 months, changes were recorded for hydrological stations Bogusław (Prosna—No. e), Gorzów Wielkopolski (Warta—No. a), and Szczerców (Widawka—No. g). In 7 months, changes occurred in hydrological station Piła (Gwda—No. c) (Figure 4).

3.3. Lake Water Temperatures

Mean annual water temperatures in lakes in the multiannual period of 1984–2020 reached 11.04 °C. Water temperature in lakes was higher by approximately 0.60 °C than water temperature in rivers. Mean monthly water temperatures in lakes were in a range from 1.93 to 19.94 °C. The lowest values were recorded in January, and the highest in July. Results of values of mean annual temperature trends for the analysed lakes were approximate as in the case of rivers, at a level of 0.36 °C·decade−1. The highest changes occurred in June and November. Moreover, a high increase in water temperatures in lakes was observed in September, at a level of 0.67 °C·decade−1. Monthly trend slope values described by the Sen coefficient varied from −0.02 to 0.69 °C decade−1. The lowest values occurred in January, February, and May, and they were not statistically significant in any of the cases (Table S4). The highest changes were recorded for Lake Sławskie (No. II) (from 0.07 to 0.93 °C decade−1, averaging 0.57 °C decade−1), and generally for each month, the changes were statistically significant at a significance level of 0.05, or even 0.01. For Lake Powidzkie (No. III), Sen coefficient values varied from −0.27 to 0.53 °C·dek−1, and in the case of 9 months and at the annual scale, they were not statistically significant. The significance of mean monthly water temperatures in lakes is presented in Figure 5.

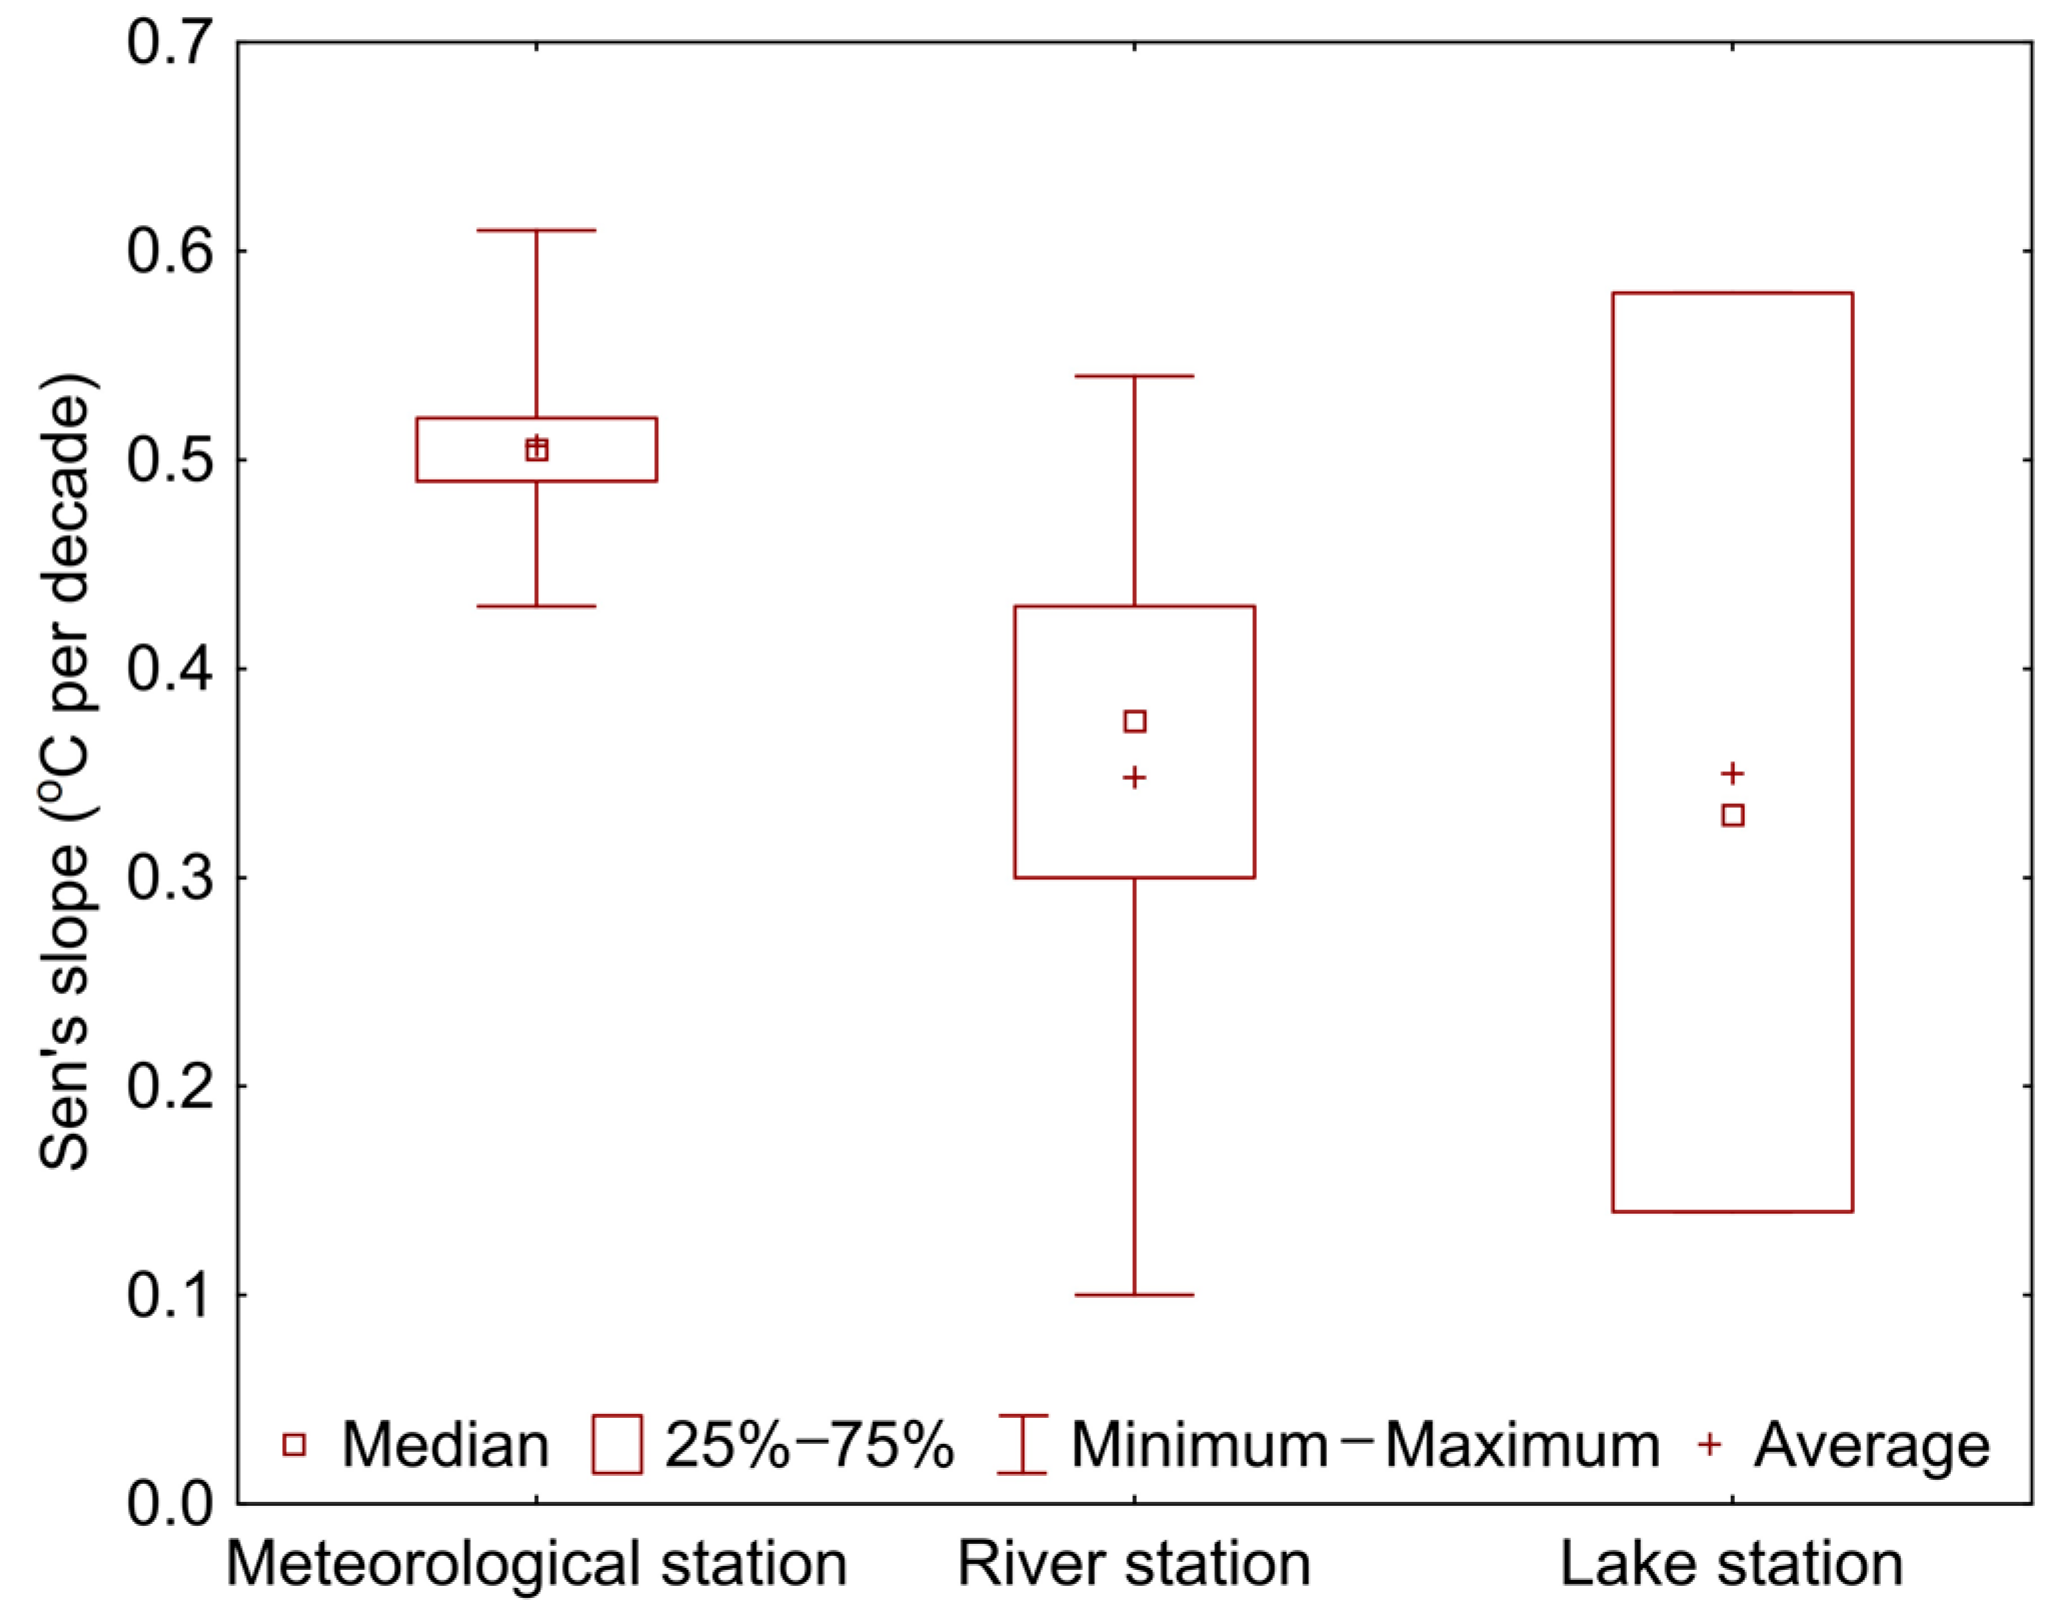
3.4. Comparison of the Extent of Changes in Air and Water Temperatures

The obtained results of the U Mann-Whitney test show that increases in air temperatures in the years 1984–2020 were higher than increases in water temperatures in rivers. Significant differences occurred for the annual period and for February, March, April, June, July, August, November, and December. The differences are significant at a level of 0.05. The comparison of changes in air temperatures with changes in water temperatures in lakes is less credible with consideration of the fact that the analysis covered only three hydrological stations in lakes. However, the analysis by means of a U Mann-Whitney test points to significant differences in February and December. The U Mann-Whitney test showed the lack of differences between changes in water temperatures in lakes and rivers. Verification of these hypotheses requires increasing the population of the analysed lakes in the future. Differences between changes in mean annual and monthly air and water temperatures are illustrated in a box-plot (Figure 6 and Figure S1).

4. Discussion

The obtained results showed that increases in air temperatures were higher than those for water temperatures. Moreover, research by Pekarov et al. [18] revealed that both air and water temperatures show an increasing trend, whereas air temperature increased by 1.5 °C, and water temperature increased by merely 0.12 °C. In this study, changes in mean annual air temperatures averaged 0.51 °C decade−1, and changes in water temperatures in rivers reached 0.35 °C decade−1. A somewhat different response of waters to climate change results from the fact that next to climatic factors, water temperature in rivers is associated with the geological structure of the catchment, among other groundwater alimentations of rivers.
The obtained results point to different responses to climate change not only in the case of particular rivers, but also sections of rivers. Depending on the analysed hydrological station, the conducted analyses of changes in water temperatures in rivers in the Warta catchment showed different rates of changes, which is caused by local factors that modify the effect of global factors. Earlier research on the thermal conditions of the Warta River showed an increase in annual water temperatures in the years 1960–2009 at a level from 0.096 to 0.281 °C decade−1 [4]. In this study, changes in mean annual water temperatures in the Warta River in the period of 1984–2020, in particular, hydrological stations, varied from 0.16 to 0.54 °C decade−1. Furthermore, research by Chen et al. [67] shows an increase in water temperatures in rivers varying from 0.29 to 0.46 °C decade−1. The cause of these changes was an increase in air temperature, but also changes in local human activities (e.g., increasing developed areas and population density, and decreasing forest areas). Despite the obtained differences, the research confirms an increase in water temperatures, which corresponds with the results obtained by other authors, e.g., [6,12,68,69,70,71]. In hydrological station Śrem in the central course of the Warta River, higher changes in water temperatures were recorded. This part of the catchment is mainly of agricultural character. In hydrological station Gorzów Wielkopolski in the lower course of the river, where the share of forests is higher, an increase in temperature in the period of 1984–2020 was lower. The importance of forests in the catchment and their effect on water temperature in the river are emphasised by Ptak [72] and Sridhar et al. [73].
The obtained results showed that the model of changes in mean monthly water temperatures in rivers is approximate to mean air temperatures. This evidences that air temperatures are the primary factor shaping water temperatures in rivers. Other factors are of secondary modifying character. This is confirmed by Arora et al. [19], Marszelewski and Pius [7], Ptak et al. [71], and Ptak et al. [4], among others. The situation is different in the case of lake waters, since their temperature depends on morphometric parameters of the lake basin, thermal stratification, and water mixing to a greater extent [74]. An increase in mean annual temperatures in lakes was at a level from 0.14 to 0.58 °C·decade−1. These values are higher than those obtained by Virdis et al. [1] for artificial lakes on the island of Sardinia, where an increase in mean annual temperatures was at a level of 0.10 °C·decade−1. Research by Peng et al. [75] evidences that in urbanised areas, lakes are under a stronger impact of local factors. Moreover, research shows that an increase in water temperatures is stronger than in air temperatures. This suggests that local and climatic factors show the same direction of impact. The lakes analysed in this paper were characterised by different changes in thermal conditions at the monthly and annual scale. An example is Lake Powidzkie, where at the annual scale, the changes were not statistically significant. Results by Öğlü et al. [76] for Lake Peipsi (Estonia/Russia) also show that the water temperature in the lake did not increase significantly on an annual basis.
Water temperature is a key parameter supporting the investigation of the environmental and ecological impact of climate change. The direction and extent of changes in water temperature presented in this paper can provide the basis for undertaking activities aimed at mitigating this trend. Further increase in water temperatures may have a negative effect on water quality, but also on the condition of ecosystems. It can particularly lead to the disappearance of native species and loss of biodiversity [77]. This trend of changes is expected in the future. According to Piccolroaz at al. [78], mean annual water temperatures in lakes will increase by 0.15 and 0.34 °C per decade under scenarios RCP4.5 and RCP8.5 in the future. Climate warming is expected to have a major impact on river water quality, water column/hyporheic zone biogeochemistry, and aquatic ecosystems.
In the context of the forecasted changes in water temperatures in rivers and lakes, a decrease in the waters’ self-cleaning ability should be expected, as well as an increase in oxygen deficits. As a result, the amount of pollutants supplied to waters should be reduced, as they may additionally magnify this unfavourable trend.

5. Conclusions

The study results show that in the years 1984–2020, changes in water temperatures in rivers usually showed an increasing trend, both for monthly and annual periods. It should be emphasised that even within the same rivers, changes in river water temperature showed different extents. This results from the variable character of the river, its geological structure, water supply to the river, and land use structure. In addition, differences occurred between particular rivers. Moreover, modifying factors included anthropogenic effects, discharge of mining waters, and discharge of wastewater. An increase in water temperatures in rivers was lower than in air temperature due to the alimentation of rivers with groundwaters with no direct contact with air. The obtained results showed no differences between changes in water temperatures in rivers and lakes. One of the reasons could be the effect of local factors shaping water temperature in lakes. Future research should involve water temperature monitoring of a larger pool of lakes, permitting the expansion of the analyses and final verification of the hypothesis on the lack of differences in the response of river and lake waters to climate change. It will also permit verification of the hypothesis concerning differences between trends of air and water temperatures in lakes. Furthermore, it should be emphasised that the analysis of changes in river water temperatures was carried out on the basis of both measured and reconstructed data. To clearly assess the response of rivers to climate change, direct measurements of river water temperature should be restarted as soon as possible.

Supplementary Materials

The following supporting information can be downloaded at: https://www.mdpi.com/article/10.3390/atmos14020330/s1. Figure S1: The ranges of mean monthly changes in air and water temperatures in rivers and lakes; Table S1: Statistical parameters; Table S2: The results of trends analysis of air temperature for the period of 1984–2020; Table S3: The results of trends analysis of river water temperature for the period of 1984–2020; Table S4: The results of trends analysis of lake water temperature for the period of 1984–2020.

Author Contributions

Conceptualization, M.S.; methodology, M.S. and J.G.; software, M.S.; validation, M.S.; formal analysis, M.S. and J.G; investigation, M.S. and J.G; resources, J.G.; data curation, J.G.; writing—original draft preparation, M.S. and J.G.; writing—review and editing, M.S.; visualization, M.S. and J.G.; supervision, M.S.; project administration, M.S.; funding acquisition, M.S. All authors have read and agreed to the published version of the manuscript.

Funding

This research received no external funding.

Institutional Review Board Statement

Not applicable.

Informed Consent Statement

Not applicable.

Data Availability Statement

All data were obtained from the website of the Institute of Meteorology and Water Management—National Research Institute: www.danepubliczne.imgw.pl/data/dane_pomiarowo_obserwacyjne (accessed on 12 September 2022).

Conflicts of Interest

The authors declare no conflict of interest.

References

  1. Virdis, S.G.; Soodcharoen, N.; Lugliè, A.; Padedda, B.M. Estimation of satellite-derived lake water surface temperatures in the western Mediterranean: Integrating multi-source, multi-resolution imagery and a long-term field dataset using a time series approach. Sci. Total Environ. 2019, 707, 135567. [Google Scholar] [CrossRef] [PubMed]
  2. Araźny, A.; Kejna, M.; Wawrzyniak, T.; Osuch, M.; Plenzler, J.; Budzik, T. Zmiany klimatu w ekosystemach Arktyki i Antarktyki. Kosmos. Probl. Nauk. Biol. 2021, 4, 579–595. [Google Scholar] [CrossRef] [PubMed]
  3. Vásquez, C.; Aguirre, C.; Choccña, M.; Guerrero, J. Variabilidad interanual de la temperatura super cial del lago Titicaca usando imágenes MODIS del invierno (2001–2014). Rev. Investig. Física 2022, 25, 10–18. [Google Scholar] [CrossRef]
  4. Ptak, M.; Sojka, M.; Kałuża, T.; Choiński, A.; Nowak, B. Long-term water temperature trends of the Warta River in the years 1960–2009. Ecohydrol. Hydrobiol. 2019, 19, 441–451. [Google Scholar] [CrossRef]
  5. Rivaes, R.P.; Feio, M.J.; Almeida, S.F.P.; Calapez, A.R.; Sales, M.; Gebler, D.; Lozanovska, I.; Aguiar, F.C. River ecosystem endangerment from climate change-driven regulated flow regimes. Sci. Total Environ. 2022, 818, 151857. [Google Scholar] [CrossRef] [PubMed]
  6. Kasushal, S.S.; Linkes, G.E.; Jaworski, N.A.; Pace, M.L.; Sides, A.M.; Seekell, D.; Belt, K.T.; Wingate, R.L. Rising stream and river temperatures in the United States. Front. Ecol. Environ. 2010, 8, 461–466. [Google Scholar] [CrossRef]
  7. Marszelewski, W.; Pius, B. Long-term changes in temperature of river waters in the transitional zone of the temperate climate: A case study of Polish rivers. Hydrol. Sci. J. 2016, 61, 1430–1442. [Google Scholar] [CrossRef]
  8. Nowak, B.; Skolasińska, K.; Stanek, P. Zmiany warunków termicznych i lodowych rzeki Warty w Sieradzu w wieloleciu 1956–2014. In Varia. Prace z Zakresu Geografii; Bogucki Wydawnictwo Naukowe: Poznań, Poland, 2019; pp. 27–46. [Google Scholar]
  9. Ptak, M. Zmiany temperatury wody i zjawisk lodowych rzeki Ner (centralna Polska) w latach 1965–2014. Pol. J. Sustain. Dev. 2017, 21, 49–56. [Google Scholar] [CrossRef]
  10. Ptak, M.; Nowak, B. Zmiany temperatury wody w Prośnie w latach 1965–2014. Woda-Sr.-Obsz. Wiej. 2017, 17, 101–112. [Google Scholar]
  11. Van Vliet, M.T.H.; Ludwig, F.; Zwolsman, J.J.G.; Weedon, G.P.; Kabat, P. Global river temperatures and sensitivity to atmospheric warming and changes in river flow. Water Resour. Res. 2011, 47, 1–19. [Google Scholar] [CrossRef]
  12. Žganec, K. The effects of water diversion and climate change on hydrological alteration and temperature regime of karst rivers in central Croatia. Environ. Monit. Assess. 2012, 184, 5705–5723. [Google Scholar] [CrossRef]
  13. EEA. Woda to Życie. Sygnał EEA 2018; Europejska Agencja Środowiskowa: Kopenhaga, Dania, 2018; p. 79. [Google Scholar] [CrossRef]
  14. Zalewski, M.; Izydorczyk, K.; Kiedrzyńska, E.; Jarosiewicz, P.; Czerniawski, R. Ekohydrologia dla kompensacji antropopresji i łagodzenia skutków zmian klimatu w ekosystemach rzecznych. In Funkcjonowanie i Ochrona Wód Płynących; Czerniawski, R., Bilski, P., Eds.; Uniwersytet Szczeciński: Szczecin, Poland, 2019; pp. 5–20. [Google Scholar]
  15. EEA Report No 1/2017. Climate Change, Impacts and Vulnerability in Europe 2016; An Indicator-Based Report; European Environment Agency: Copenhaga, Denmark, 2017; p. 419. [CrossRef]
  16. IPCC, 2022: Summary for Policymakers. In Climate Change 2022: Impacts, Adaptation, and Vulnerability. Contribution of Working Group II to the Sixth Assessment Report of the Intergovernmental Panel on Climate Change; Pörtner, H.-O.; Roberts, D.C.; Tignor, M.; Poloczanska, E.S.; Mintenbeck, K.; Alegría, A.; Craig, M.; Langsdorf, S.; Löschke, S.; Möller, V.; et al. (Eds.) Cambridge University Press: Cambridge, UK; New York, NY, USA, 2022; pp. 3–33. [Google Scholar]
  17. Isaak, D.J.; Wollrab, S.; Horan, D.; Chandler, G. Climate change effect on stream and river temperatures across the northwest U.S. from 1980–2009 and implications for salmonid fishes. Clim. Change 2012, 113, 499–524. [Google Scholar] [CrossRef]
  18. Pekárová, P.; Miklánek, P.; Halmová, D.; Onderka, M.; Pekár, J.; Kučárová, K.; Liová, S.; Škoda, P. Long-term trend and multi-annual variability of water temperature in the pristine Bela River basin (Slovakia). J. Hydrol. 2011, 400, 333–340. [Google Scholar] [CrossRef]
  19. Arora, R.; Tockner, K.; Venohr, M. Changing river temperatures in northern Germany: Trends and drivers of change. Hydrol. Process. 2016, 30, 3084–3096. [Google Scholar] [CrossRef]
  20. Wrzesiński, D.; Graf, R. Temporal and spatial patterns of the river flow and water temperature relations in Poland. J. Hydrol. Hydromech. 2022, 70, 12–29. [Google Scholar] [CrossRef]
  21. Graf, R.; Wrzesiński, D. Zróżnicowanie czasowo-przestrzenne tendencji zmian termiki wód rzecznych w Polsce. In Naturalne i Antropogeniczne Zmiany Obiegu Wody. Współczesne Problemy i Kierunki Badań; Wrzesiński, D., Graf, R., Perz, A., Plewa, K., Eds.; Bogucki Wydawnictwo Naukowe: Poznań, Poland, 2020; pp. 145–160. [Google Scholar]
  22. Hannah, D.M.; Garner, G. River water temperature in the United Kingdom: Changes over the 20th century and possible changes over the 21st century. Prog. Phys. Geogr. 2015, 39, 68–92. [Google Scholar] [CrossRef]
  23. Ketabchy, M.; Sample, D.J.; Wynn-Thompson, T.; Nayeb Yazdi, M. Thermal evaluation of urbanization using a hybrid approach. J. Environ. Manag. 2018, 226, 457–475. [Google Scholar] [CrossRef]
  24. Nelson, K.C.; Palmer, M.A. Stream temperature surges under urbanization and climate change: Data, models, and responses. J. Am. Water Resour. Assoc. 2007, 43, 440–452. [Google Scholar] [CrossRef]
  25. Lammers, R.B.; Pundsack, J.W.; Shiklomanov, A.I. Variability in river temperature, discharge, and energy flux from the Russian pan-Arctic landmass. J. Geophys. Res.-Atmos. 2007, 112, 1–15. [Google Scholar] [CrossRef] [Green Version]
  26. Webb, B.W.; Nobilis, F. Long-term changes in river temperature and the influence of climatic and hydrological factors. Hydrol. Sci. J. 2007, 52, 74–85. [Google Scholar] [CrossRef]
  27. Yang, R.; Wu, S.; Wu, X.; Ptak, M.; Li, X.; Sojka, M.; Graf, R.; Dai, J.; Zhu, S. Quantifying the impacts of climate variation, damming, and flow regulation on river thermal dynamics: A case study of the Włocławek Reservoir in the Vistula River, Poland. Environ. Sci. Eur. 2022, 34, 3. [Google Scholar] [CrossRef]
  28. Álvarez-Troncoso, R.; Benetti, C.J.; Sarr, A.B.; Pérez-Bilbao, A.; Garrido, J. Impact of hydroelectric power stations on Trichopter assemblages in four rivers in NW Spain. Limnologica 2015, 53, 35–41. [Google Scholar] [CrossRef]
  29. Rapits, C.E.; vna Vliew, M.T.H.; Pfister, S. Global therm pollution of rivers from thermoelectric power plants. Environ. Res. Lett. 2015, 11, 104011. [Google Scholar] [CrossRef]
  30. Barbarossa, V.; Bosmans, J.; Wanders, N.; King, H.; Bierkens, M.F.P.; Huijbregts, M.A.J.; Schipper, A.M. Threats of global warming to the world’s freshwater fishes. Nat. Commun. 2021, 12, 11. [Google Scholar] [CrossRef] [PubMed]
  31. Caissie, D. The thermal regime of rivers: A review. Freshw. Biol. 2006, 51, 1389–1406. [Google Scholar] [CrossRef]
  32. Leuven, R.S.E.W.; Hendriks, A.J.; Huijbregts, M.A.J.; Lenders, H.J.R.; Matthews, J.; van der Velde, G. Differences in sensitivity of native and exotic fish species to changes in river temperature. Curr. Zool. 2011, 57, 852–862. [Google Scholar] [CrossRef]
  33. Fullerton, A.H.; Torgersen, C.E.; Lawler, J.J.; Steel, E.A.; Ebersole, J.L.; Lee, S.Y. Longitudinal thermal heterogeneity in rivers and refugia for coldwater species: Effects of scale and climate change. Aquat. Sci. 2018, 80, 15–29. [Google Scholar] [CrossRef] [PubMed]
  34. Poole, G.C.; Berman, C.H. An Ecological perspective on in-stream temperature: Natural heat dynamics and mechanisms of human-caused thermal degradation. Environ. Manag. 2001, 27, 787–802. [Google Scholar] [CrossRef] [PubMed]
  35. Psuty, I.; Wandzel, T.; Lejk, A.; Podolska, M.; Zaporowski, R.; Smoliński, S.; Grochowski, A.; Wodzinowski, T. Przewodnik Metodyczny do Badań Terenowych i Analiz Labolatoryjnych Ichtiofauny w Wodach Przejściowych i Przybrzeżnych w Ramach Monitoringu Diagnostycznego Ichtiofauny; Biblioteka Monitoringu Środowiska: Warszawa, Poland, 2014; p. 101. [Google Scholar]
  36. Souaissi, Z.; Ouarda, T.B.M.J.; St-Hilaire, A. River water temperature quantiles as thermal stress indicators: Case study in Switzerland. Ecol. Indic. 2021, 131, 13. [Google Scholar] [CrossRef]
  37. Sudhagar, A.; Kumar, G.; El-Matbouli, M. The Malacosporean Myxozoan Parasite Tetracapsuloides bryosalmonae: A Threat to Wild Salmonids. Patogens 2019, 9, 16. [Google Scholar] [CrossRef]
  38. Dziemian, Ł.; Spich, K.; Kolada, A.; Kutyła, S.; Piekło, B. Ryby w wodach przjściowych i przybrzeżnych. In Podręcznik do Monitoring Elementów Biologicznych i Klasyfikacji Stanu Ekologicznego Wód Powierzchniowych. Aktualizacja Metod; Kolada, A., Ed.; Bibliotek Monitoringu Środowiska: Warszawa, Poland, 2020; pp. 369–406. [Google Scholar]
  39. Bell, D.A.; Kovach, R.P.; Muhlfeld, C.C.; Al.-Chokhachy, R.; Cline, T.J.; Whited, D.C.; Schmetterling, D.A.; Lukacs, P.M.; Whiteley, A.R. Climate change and expanding invasive species drive widespread declines of native trout in the northern Rocky Mountains, USA. Sci. Adv. 2021, 7, 11. [Google Scholar] [CrossRef] [PubMed]
  40. Markovic, D.; Carrizo, S.; Freyhof, J.; Cid, N.; Lengyel, S.; Scholz, M.; Kasperdius, H.; Darwall, W. Europe’s freshwater biodiversity under climate change: Distribution shifts and conservation needs. Divers. Distrib. 2014, 20, 1097–1107. [Google Scholar] [CrossRef]
  41. Comte, L.; Buisson, L.; Daufresne, M.; Grenouillet, G. Climate-induced changes in the distribution of freshwater fish: Observed and predicted trends. Freshw. Biol. 2013, 58, 625–639. [Google Scholar] [CrossRef]
  42. Domisch, S.; Araujo, M.B.; Bonada, N.; Pauls, S.U.; Jahnig, S.C.; Haase, P. Modelling distribution in European stream macroinvertebrates under future climates. Glob. Change Biol. 2013, 19, 752–762. [Google Scholar] [CrossRef] [PubMed]
  43. Knouft, J.; Ficklin, D. The potential impact of climate change on biodiversity in flowing freshwater systems. Annu. Rev. Ecol. Evol. S. 2017, 48, 111–133. [Google Scholar] [CrossRef]
  44. Manjarrés-Hernández, A.; Guisande, C.; García-Roselló, E.; Heine, J.; Pelayo-Villamil, P.; Pérez-Costas, E.; González-Vilas, L.; González-Dacosta, J.; Duque, S.R.; Granado-Lorencio, C.; et al. Predicting the effects of climate change on future freshwater fish diversity at global scale. Nat. Conserv. 2021, 43, 1–24. [Google Scholar] [CrossRef]
  45. Grantham, T.E.; Matthews, J.H.; Bledsoe, P.B. Shifting currents: Managing freshwater systems for ecological resilience in a changing climate. Water Secur. 2019, 8, 100049. [Google Scholar] [CrossRef]
  46. Bellido-Jiménez, J.A.; Gualda, J.E.; García-Marín, A.P. Assessing Machine Learning Models for Gap Filling Daily Rainfall Series in a Semiarid Region of Spain. Atmosphere 2021, 12, 1158. [Google Scholar] [CrossRef]
  47. Rabi, A.; Hadzima-Nyarko, M.; Šperac, M. Modelling river temperature from air temperature: Case of the River Drava (Croatia). Hydrol. Sci. J. 2015, 60, 1490–1507. [Google Scholar] [CrossRef]
  48. Graf, R.; Zhu, S.; Sivakumar, B. Forecasting river water temperature time series using a wavelet-neural network hybrid modelling approach. J. Hydrol. 2019, 578, 124115. [Google Scholar] [CrossRef]
  49. Sojka, M.; Ptak, M. Possibilities of River Water Temperature Reconstruction Using Statistical Models in the Context of Long-Term Thermal Regime Changes Assessment. Appl. Sci. 2022, 12, 7503. [Google Scholar] [CrossRef]
  50. TIBCO Software Inc. Statistica (Data Analysis Software System), Version 13; Stanford Research Park: Palo Alto, CA, USA, 2017. [Google Scholar]
  51. Mavromatis, T.; Stathis, D. Response of the water balance in Greece to temperature and precipitation trends. Theor. Appl. Climatol. 2010, 104, 13–24. [Google Scholar] [CrossRef]
  52. Ptak, M.; Sojka, M.; Graf, R.; Choiński, A.; Zhu, S.; Nowak, B. Warming Vistula River—The effects of climate and local conditions on water temperature in one of the largest rivers in Europe. J. Hydrol. Hydromech. 2022, 70, 1–11. [Google Scholar] [CrossRef]
  53. Ptak, M.; Sojak, M.; Nowak, B. Changes in ice regime of Jagodne Lake (North-Eastern Poland). Acta Sci. Pol. Form. Circumiectus 2019, 18, 89–100. [Google Scholar] [CrossRef]
  54. ur Rauf, A.; Muhammad, S.; Rafi, M.S.; Irshad, A.; Muhammad, U. Temperature Trend Detection in Upper Indus Basin by Using Mann-Kendall Test. Adv. Sci. Technol. Eng. Syst. J. 2016, 1, 5–13. [Google Scholar] [CrossRef]
  55. da Silva, R.; Santos, C.; Moreira, M.; Corte-Real, J.; Silva, V.; Medeiros, I. Rainfall and river flow trends using Mann–Kendall and Sen’s slope estimator statistical tests in the Cobres River basin. Nat. Hazards 2015, 77, 1205–1221. [Google Scholar] [CrossRef]
  56. Svensson, C.; Kundzewicz, Z.W.; Maurer, T. Trend detection in river flow series: 2. Flood and low-flow index series/ Détection de tendance dans des séries de débit fluvial: 2. Séries d’indices de crue et d’étiage. Hydrolog. Sci. J. 2005, 50, 824. [Google Scholar] [CrossRef]
  57. Wrzesiński, D. Tendencja zmian przepływu rzek polski w drugiej połowie XX wieku. Badania Fizjograficzne nad Polską Zachodnią. Geogr. Fiz. 2009, A60, 147–162. [Google Scholar] [CrossRef]
  58. Yue, S.; Pilon, P.; Cavadias, G. Power of the Mann–Kendall and Spearman’s rho tests for detecting monotonic trends in hydrological series. J. Hydrol. 2002, 259, 254–271. [Google Scholar] [CrossRef]
  59. Yue, S.; Pilon, P.; Phinney, B.; Cavadias, G. The Influence of Autocorrelation on the Ability to Detect Trend in Hydrological Series. Hydrol. Process. 2002, 16, 1807–1829. [Google Scholar] [CrossRef]
  60. Hamed, K.H.; Rao, A.R. A Modified Mann-Kendall Trend Test for Autocorrelated Data. J. Hydrol. 1998, 204, 182–196. [Google Scholar] [CrossRef]
  61. Abdul Aziz, O.I.; Burn, D.H. Trends and variability in the hydrological regime of the Mackenzie River Basin. J. Hydrol. 2006, 319, 282–294. [Google Scholar] [CrossRef]
  62. Khattak, S.; Babel, M.; Sharif, M. Hydro-meteorological trends in the upper Indus River basin in Pakistan. Clim. Res. 2011, 46, 103–119. [Google Scholar] [CrossRef]
  63. Kumar, S.; Merwade, V.; Kam, J.; Thurner, K. Streamflow trends in Indiana: Effects of long term persistence, precipitation and subsurface drains. J. Hydrol. 2009, 374, 171–183. [Google Scholar] [CrossRef]
  64. Gilbert, R.O. Statistical Methods for Environmental Pollution Monitoring. Van Nostrand Reinhold, Co.: New York, NY, USA, 1987; p. 320. [Google Scholar]
  65. Patakamuri, S.K.; O’Brien, N.M. Modified Versions of Mann Kendall and Spearman’s Rho Trend Tests 2019; The R Project for Statistical Computing: Vienna, Austria, 2019; p. 19. [Google Scholar]
  66. Jokiel, P. Wpływ antropopresji na zmiany przepływu Neru w przekroju Dąbie. Pr. I Stud. Geogr. 2018, 63, 103–118. [Google Scholar]
  67. Chen, D.; Hu, M.; Guo, Y.; Dahlgren, R.A. Changes in river water temperature between 1980 and 2012 in Yongan watershed, eastern China: Magnitude, drivers and models. J. Hydrol. 2015, 533, 191–199. [Google Scholar] [CrossRef]
  68. Kelleher, C.A.; Golden, H.E.; Archfield, S.A. Monthly river temperature trends across the US confound annual changes. Environ. Res. Lett. 2021, 16, 104006. [Google Scholar] [CrossRef] [PubMed]
  69. Kędra, M. Regional Response to Global Warming: Water Temperature Trends in Semi-Natural Mountain River Systems. Water 2020, 12, 283. [Google Scholar] [CrossRef]
  70. Ptak, M. Long-term temperature fluctuations in rivers of the Fore-Sudetic region in Poland. Geografie 2018, 123, 279–294. [Google Scholar] [CrossRef]
  71. Ptak, M.; Choiński, A.; Kirviel, J. Long-term water temperature fluctuations in coastal rivers (Southern Baltic) in Poland. Bull. Geogr. Phys. Geogr. Ser. 2016, 11, 35–42. [Google Scholar] [CrossRef] [Green Version]
  72. Ptak, M. Wpływ zalesienia zlewni na temperaturę wody w rzece. Leśne Pr. Badaw. 2017, 78, 251–256. [Google Scholar] [CrossRef]
  73. Sridhar, V.; Sansone, L.; LaMarche, J.; Dubin, T.; Lettenmaier, D. Prediction of Stream Temperature in Forested Watershedes. J. Am. Water 2004, 40, 197–213. [Google Scholar] [CrossRef]
  74. Ptak, M.; Sojka, M.; Choiński, A.; Nowak, B. Effect of Environmental Conditions and Morphometric Parameters on Surface Water Temperature in Polish Lakes. Water 2018, 10, 580. [Google Scholar] [CrossRef]
  75. Peng, Z.; Yang, K.; Shang, C.; Duan, H.; Tang, L.; Zhang, Y.; Cao, Y.; Luo, Y. Attribution analysis of lake surface water temperature changing—Taking China’s six main lakes as example. Ecol. Indic. 2022, 145, 109651. [Google Scholar] [CrossRef]
  76. Öğlü, B.; Möls, T.; Kaart, T.; Cremona, F.; Kangur, K. Parameterization of surface water temperature and long-term trends in Europe’s fourth largest lake shows recent and rapid warming in winter. Limnologica 2020, 82, 125777. [Google Scholar] [CrossRef]
  77. Hardenbicker, P.; Viergutz, C.; Becker, A.; Kirchesch, V.; Nilson, E.; Fischer, H. Water temperature increases in the river Rhine in response to climate change. Reg. Environ. Change 2017, 17, 299–308. [Google Scholar] [CrossRef]
  78. Piccolroaz, S.; Zhu, S.; Ptak, M.; Sojka, M.; Du, X. Warming of lowland Polish lakes under future climate change scenarios and consequences for ice cover and mixing dynamics. J. Hydrol. Reg. Stud. 2021, 34, 100780. [Google Scholar] [CrossRef]
Figure 1. Analysed hydrological and meteorological stations. Numbering of stations in accordance with Table 1 (letters denote hydrological stations on rivers, roman numerals denote hydrological stations on lakes, digits denote meteorological stations).
Atmosphere 14 00330 g001
Figure 2. Changes in mean annual air and water temperatures in rivers and lakes: (a) Rate of changes in °C per decade and (b) significance of the changes.
Atmosphere 14 00330 g002
Figure 3. Changes in mean monthly air temperatures: (a) Rate of changes in °C per decade and (b) significance of the changes (solid line—significance level of 0.05, dashed line—significance level of 0.01).
Atmosphere 14 00330 g003
Figure 4. Changes in mean monthly river water temperatures: (a) Rate of changes in °C per decade and (b) significance of the changes (solid line—significance level of 0.05, dashed line—significance level of 0.01).
Atmosphere 14 00330 g004
Figure 5. Changes in mean monthly lake water temperatures: (a) Rate of changes in °C per decade and (b) significance of the changes (solid line—significance level of 0.05, dashed line—significance level of 0.01).
Atmosphere 14 00330 g005
Figure 6. The ranges of mean annual changes in air and water temperatures in rivers and lakes.
Atmosphere 14 00330 g006
Table 1. Analysed hydrological stations on rivers and lakes, and meteorological stations.
River-StationLake-StationMeteorological Station
Warta—Gorzów Wielkopolski (a)Bytyń Wielki—Nakielno (I)Gorzów Wielkopolski (1)
Piła (2)
Słubice (3)
Obra—Zbąszyń (b)Sławskie—Radzyń (II)Leszno (4)
Wielichowo (5)
Zielona Góra (6)
Gwda—Piła (c)Bytyń Wielki—Nakielno (I)Chrząstkowo (7)
Gorzów Wielkopolski (1)
Piła (2)
Warta—Śrem (d)Powidzkie—Powidz (III)Leszno (4)
Poznań—Ławica (8)
Wielichowo (5)
Prosna—Bogusław (e)Powidzkie—Powidz (III)Kalisz (9)
Koło (10)
Poznań—Ławica (8)
Ner—Dąbie (f)Powidzkie—Powidz (III)Kalisz (9)
Koło (10)
Łódź—Lublinek (11)
Widawka—Szczerców (g)Powidzkie—Powidz (III)Łódź—Lublinek (11)
Sulejów (12)
Wieluń (13)
Warta—Bobry (h)Powidzkie—Powidz (III)Lgota Górna (14)
Sulejów (12)
Wieluń (13)
Mała Noteć—Gębice (i)Powidzkie—Powidz (III)Koło (10)
Kołuda Wielka (15)
Toruń (16)
Noteć—Nowe Drezdenko (j)Bytyń Wielki—Nakielno (I)Gorzów Wielkopolski (1)
Piła (2)
Poznań—Ławica (8)
Table 2. Scope of the available data on river water temperatures.
River-StaionData Availability
Warta—Gorzów Wielkopolski (a)1984—2010; 2012—2014
Obra—Zbąszyń (b)1985—2020
Gwda—Piła (c)1984—2015
Warta—Śrem (d)1987—2015
Prosna—Bogusław (e)1984—2015
Ner—Dąbie (f)1985—2015
Widawka—Szczerców (g)1985—2015
Warta—Bobry (h)1985—2019
Mała Noteć—Gębice (i)1985—2020
Noteć—Nowe Drezdenko (j)1984—2015
Disclaimer/Publisher’s Note: The statements, opinions and data contained in all publications are solely those of the individual author(s) and contributor(s) and not of MDPI and/or the editor(s). MDPI and/or the editor(s) disclaim responsibility for any injury to people or property resulting from any ideas, methods, instructions or products referred to in the content.

