1. Introduction
Reliable information on possible changes in future climate is vital for planning sustainable development [
1]. Therefore, the projection of the future climate plays a fundamental role in the awareness of possible risks and response options. Climate change scenarios with a high spatial and temporal resolution are required to evaluate the effects of climate change. Such scenarios should reproduce changes in mean weather characteristics and incorporate the changes in climate variability, indicated by the global climate model (GCM) [
2]. The Scenario Model Intercomparison Project (ScenarioMIP) is the primary activity within Phase 6 of the Coupled Model Intercomparison Project (CMIP6) that will provide multi-model climate projections based on alternative scenarios of future emissions and land use changes, produced with integrated assessment models. CMIP6 employs a framework of Shared Socioeconomic Pathways (SSPs). The new pathways include a bundle of mitigation and adaptation actions on climate change based on future economic and social projected changes, like population and social aspects, resources, and economic development, ecosystems, and institutions [
3]. Recent regional evaluation studies have shown that CMIP6 models have improved relative to the previous phases [
4,
5].
In recent years, many researchers have been using CMIP6 data. Ref. [
6] studied the extreme temperature events in the East Azerbaijan province (Iran) from 2009–2049, and the results showed an increase in heat wave events for all stations. Ref. [
7] 2020 evaluated the recently released CMIP6 precipitation simulations over Iran. The CMIP6 models best reproduce the climatological features of precipitation and its spatio-temporal changes over the country’s arid and hyper-arid areas. At micro scales (local and station), studies have been done on climate change in Iran, including [
8], who studied the performance of LARS-WG and SDSM downscaling models in simulating temperature and precipitation changes in the west of Iran. Moreover, several studies have evaluated model simulations against reference observations [
9].
Many studies have been conducted in recent years with CMIP6 data, often evaluating the quality of these data compared to previous ensembles of climate model simulations, such as CMIP5 and CMIP3 [
10,
11,
12].
Performance evaluation is based on direct GCM outputs or outputs of secondary models that use GCM input, which some researchers have also done. For instance, in the case of precipitation, the GCM outputs overestimate or underestimate the observed precipitation according to the area’s season, topography, and climatic conditions [
11,
13,
14]. Some researchers analyzed the performance of meteorological phenomena, such as precipitation estimates, only from historical runs of the CMIP6 [
7]. Others have also studied the performance of GCMs to simulate historical and projected climate variables to understand climate change impact [
12,
15].
Because of the connection between driving circulation types and extreme events, it is highly interesting to understand future changes in the occurrence of atmospheric circulation types in climate change. Ref. [
16] used a convolutional neural network to classify the circulation patterns using the atmospheric variables, SLP and GPH, at 500 hPa at 5° resolution. In Iran, the study of the space and time variability of winter dry/wet events and their associated large-scale atmospheric circulations shows that the circulation types are potential predictors for the winter dry/wet events in western Iran [
17,
18] identified atmospheric circulation patterns in wet/dry periods using the PCA method in central Iran.
Ref. [
19] evaluated historical simulations of daily sea-level pressure atmospheric circulation types over six continental-scale regions (North America, South America, Europe, Africa, East Asia, and Australasia) by GCMs that contributed to both CMIP5 and CMIP6. Ref. [
20] evaluated a set of 16 GCMs’ historical CMIP6 simulations, during 1979–2014, in terms of how well they reproduced the atmospheric circulation over South Tropical South America (STSA), through a circulation-patterns approach during the dry-to-wet transition season (July–October). This study could identify a few GCMs that adequately simulated the CPs in STSA.
However, a comprehensive study of atmospheric circulation patterns and their changes in the Middle East and Iran using CMIP6 data has yet to be made. This study investigates possible changes in atmospheric circulation patterns over Iran and the Middle East using the recently released historical and projected CMIP6 data in the MPI-ESM1-2-HR model. The remainder of this paper is organized as follows:
Section 2 introduces the study area and methods,
Section 3 presents the results, and
Section 4 summarizes the findings and conclusions.
3. Results and Discussion
In order to study atmospheric circulation patterns in the historical (1975–2104) and future (2015–2054) periods in different scenarios (SSPs126, 370, and 585) affecting Iran’s climate, PCA with S array was used. The data matrix was the 500 hPa geopotential height with a resolution of 0.9351° × 0.9375° for the MPI-ESM1-2-HR model on all year days (58,440 days). Based on
Table 1, which shows the percentage of variance described by the vectors, 97.72% of the total variance of the data is explained by nine components. In addition, the first component, with 72.07% variance, has the biggest role in explaining the data variance; the other components have less weight.
All days were classified by the k-means method into 18 groups.
Figure 2 shows the frequency of CPs in different classes in the historical and future periods. As can be seen, some patterns in future scenarios have an increasing trend while others decrease. The frequency of CP3 increases significantly, and the frequency of CP11 shows a considerable decrease.
The mean sea level pressure patterns, 500 hPa geopotential height of the patterns in the historical and future in different scenarios, and the monthly frequency of all 18 patterns are shown in
Figure 3,
Figure 4,
Figure 5,
Figure 6,
Figure 7,
Figure 8,
Figure 9,
Figure 10,
Figure 11,
Figure 12,
Figure 13,
Figure 14,
Figure 15,
Figure 16,
Figure 17,
Figure 18,
Figure 19 and
Figure 20. CPs are explained in detail below.
Figure 3 (CP1) demonstrates the high pressure of 1024 hPa located in the east of the Caspian Sea and parts of northwestern Iran. The northern half of the country is affected by the high pressure of 1020 hPa in the historical map. Low-pressure penetrates from Northeast Africa and the Red Sea to western Saudi Arabia; low pressure (1016 hPa) is also located on the southeast coasts of Iran. Future patterns clearly show the penetration of high pressure (1024 hPa) into the northern strip of Iran, which, in SSPs126 and 370, covers the northeast, the southern shores of the Caspian Sea, and the Caspian Sea; in SSP585, it extends further northwest of the country. The spreading of high pressure into the northern half of Iran has weakened the Red Sea’s low pressure and caused a low-pressure retreat in southeastern Iran. In the mid-level atmosphere, the ridge in Saudi Arabia to the northwest of Iran has strengthened subtropical highs in future patterns.
Moreover, the geopotential height has been increased at low latitudes. Therefore, the geopotential of the 590 dams is formed in the Arabian Sea between latitudes 10 to 15° N. The monthly frequency of CP1 indicates that this pattern occurs in the cold months of the year so that, in the historical period, its highest frequency is in January, February, March, April, then November and December; however, in the future, there will be a significant reduction in its frequency.
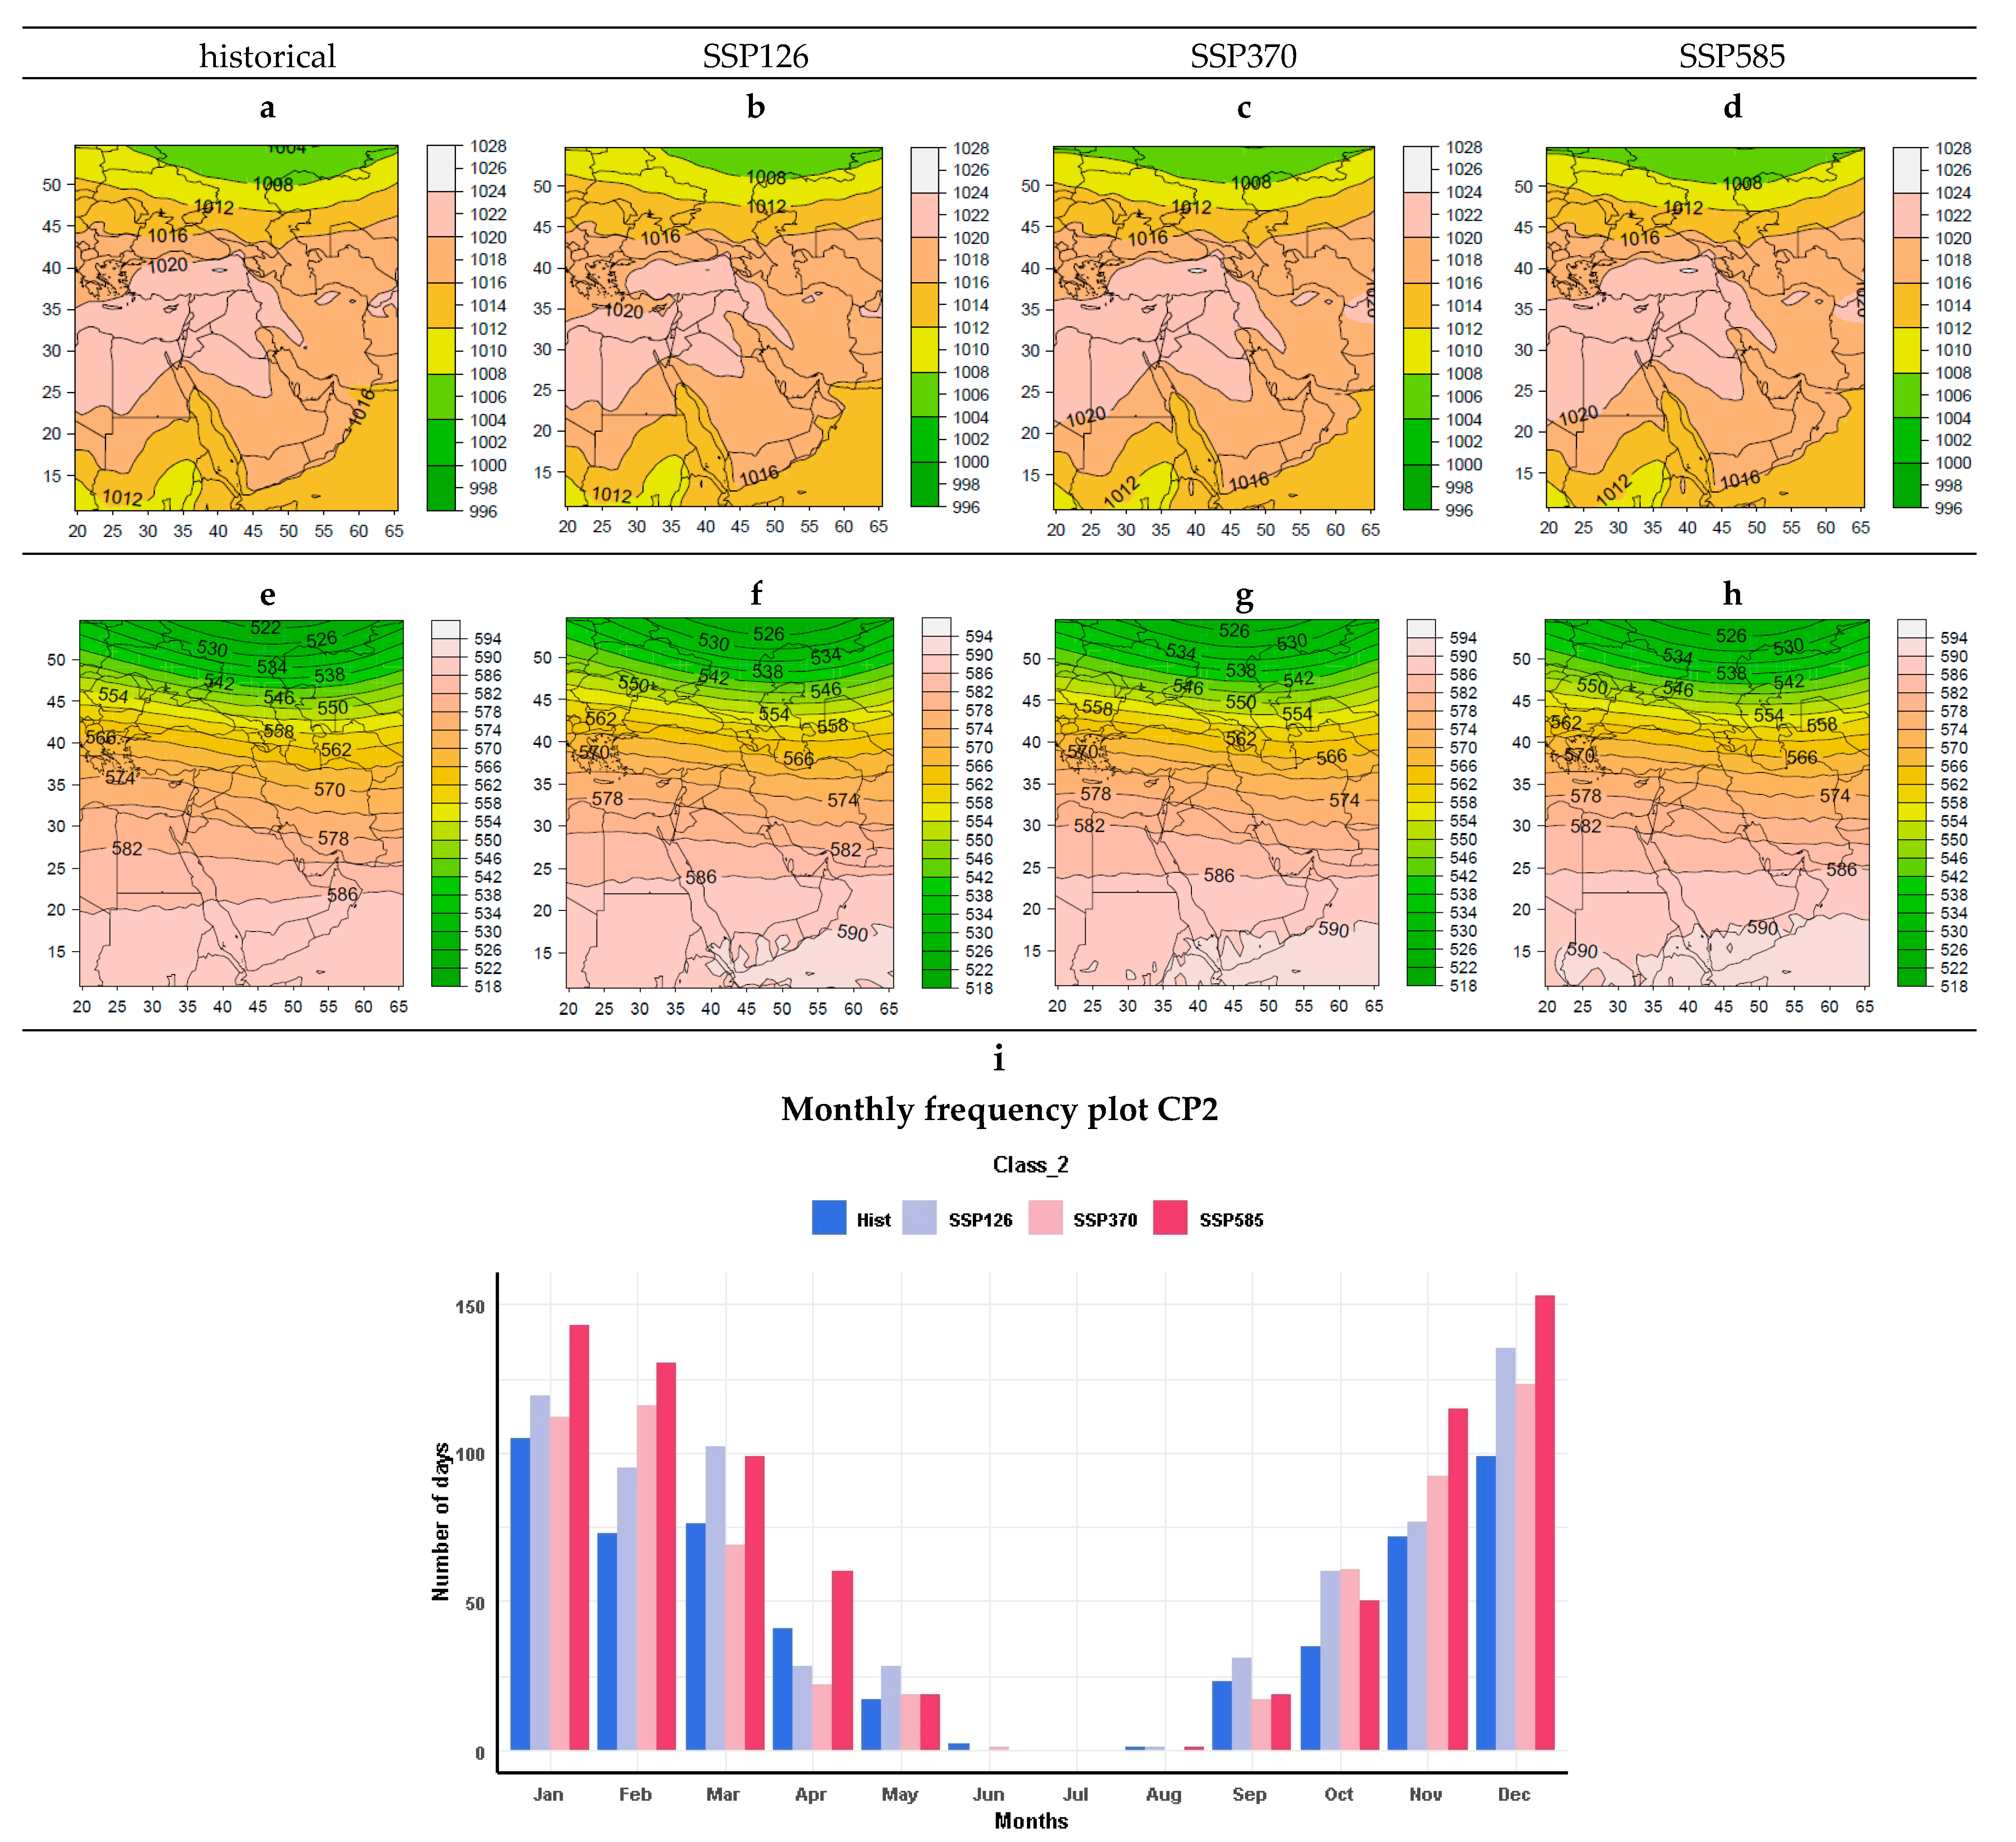
In CP2, the high pressure of 1020 hPa penetrates from North Africa and the Mediterranean towards western Iran, and geopotential height contours are parallel to the circuits in the mid-level of the atmosphere. In future patterns, the increase of the geopotential height in the Arabian Sea results in the emergence of the 590 dam contour. The frequency of CP2 is common in the cold period of the year—January, December, November, February, and March; the future projection shows an increase in the occurrence of this pattern. There are no events in June, July, and August. (
Figure 4).
CP3 is shown in
Figure 5. Thermal low pressure surrounded the southeast, south, and southwest of Iran, and isobar 1004 hPa sits on the southern coast of Iran, on the Oman Sea, and the eastern parts of the Persian Gulf. There is a weak high pressure in Eastern Europe. Future patterns indicate a shift of the thermal low-pressure to the western parts of the Persian Gulf, southwestern Iran, and southeastern Iraq, with the expansion of isobar 1004 hPa. At the 500 hPa level, the increase of GPH and the formation of the contour of 594 dams on the Red Sea and Saudi Arabia (SSP370), as well as in Northeast Africa (SSP585), indicate warming of the air mass. The monthly frequency of CP3 is highest in June, May, and then July, September, and August, indicating that this pattern often occurs during the warmer months of the year. A significant increase in the frequency of this pattern is evident in all three scenarios.
The Siberian high pressure in CP4 extends from the Caspian Sea to the north of Iran, which can be seen in the projected patterns for the future. Therefore, this high-pressure system affects the northern half of the country. At the 500 hPa level, the trough developed in the northeast of the country, and the ridge extends from Northeast Africa to the west of the Caspian Sea; there is no significant change in future patterns. CP4 also occurs often in the year’s cold season, so its frequency is higher in January, February, March, April, and December. There are no events in June, July, August, and September. The future projection shows a slight increase in frequency in January, March, and April (
Figure 6).
Most parts of Iran are affected by the dynamic high pressure of Siberia in CP5, which enters the country from the northeast. The low pressure is located in the east of Europe and the north of the Black Sea, and another low is over the Red Sea. In the mid-level, there is a trough in the southeast of Europe, and the ridge is located east of the Caspian Sea. Dynamic high-pressure strengthening and formation of isobar 1024 are predicted for the future. Moreover, future patterns predict an increase in geopotential height in the Arabian Sea. The highest number of occurrences of CP5 is in October and November, followed by April, May, and September. The frequency of events in the future projection decreases in the months of April, May, and September, and increases in the rest of the months (
Figure 7).
In CP6, Iran’s southern parts are affected by a thermal low-pressure that extends from India to the west and is associated with the subtropical high in the mid-level of the atmosphere. The future patterns are accompanied by increasing 500 hPa GPH so that the area south of latitude 30° N is covered by values exceeding 590 dams. CP6 occurs in summer and early fall, and the future pattern for late summer and early fall (September, October, and August) shows a significant increase in occurrences. (
Figure 8).
In the CP7, low pressure is located in the Middle East and Iran. It is also present in the future, but in SSP370 and SSP585, high pressure (1020 hPa) is seen in the Mediterranean and North Africa. In the mid-level of the atmosphere, the trough stretches from the eastern Black Sea to Saudi Arabia and is predicted in future patterns. However, an increase in geopotential height at low latitudes and a high (590 dam) formation is also predicted. The frequency of this pattern is higher in the spring months (April, March, and May) and then in January, February, November, and December. However, the frequency of its occurrence in the future increases considerably in different scenarios (
Figure 9).
Most parts of Iran (except the northeast and east) are influenced by low pressure, in which the southern part is formed in the Red Sea and its northern part is formed in the eastern Mediterranean Sea in CP8. In the mid-level, a deep trough over the Black Sea extends to the eastern Mediterranean and northeastern Africa. In future projections, the eastern half and the south are affected by high pressure. On the other hand, the GPH is increasing at lower latitudes and, based on the SSPs370 and 585 scenarios, 590 dam is exceeded over the Arabian Sea. CP8 occurs in autumn, winter, and early spring. The frequency of its occurrence in the future is decreasing (except in December) (
Figure 10).
On the surface map of CP9, Iran and the Middle East are affected by the high Siberian pressure from Northeast Iran. On the 500 hPa map, the ridge extends from the Red Sea to the east of the Caspian Sea, and the trough is on the southeast border of Iran. The strengthening of the Siberian high pressure and the increase in GPH are expected in the future (
Figure 11). CP9 occurs in winter and mid-spring in the study area. A slight decrease in the frequency of the occurrence of this circulation pattern is projected in the future.
In the region, CP10 occurs in late autumn and from winter to mid-spring. The southern parts of the country are affected by the low pressure of the Red Sea and the northern parts are affected by the high pressure. The trough is located in Saudi Arabia, south of the Red Sea. In future scenarios, with the expansion of high pressure to the western Mediterranean and North Africa, and the contrast of the two northern and southern air masses, the trough strengthened at the level of 500 hPa so that it can be seen from Iraq to the Red Sea. The western and southwestern regions of Iran are located on its eastern flank. A slight increase in the frequency of this pattern is expected in the future (
Figure 12).
CP11 is similar to CP6 but has a more intense thermal low so that low pressure of 1004 hPa is formed over the Persian Gulf and the Oman Sea, and a ridge of subtropical high extends from North Africa to the north of the Caspian Sea. In the projections, the low pressure will expand west of Iran and Iraq. The subtropical high will develop northward, next to northern Iran, and the geopotential height will increase in Iran (
Figure 13). Due to the absorption of more solar energy in June, July, and August, this system has developed towards the north, and the most frequent occurrence is in August. Therefore, CP11 occurs in the warm period of the year and has the highest occurrence in August, September, July, October, and June. Additionally, it faces a decrease in frequency in future patterns.
In
Figure 14 (CP12), on the surface map, high pressure is located in southeastern Europe to the Mediterranean Sea and North Africa. Pressure reaches 1024 hPa over the Mediterranean Sea and western Turkey. The western strip of Iran is also affected by this system. In future projections, the high strengthens and expands eastward, with the 1024 hPa isobar extending to western and central Turkey, the Mediterranean Sea, and parts of northern Africa. At the 500 hPa level, the trough extends from the north of the Caspian Sea to the west of Iran. In all three scenarios, this pattern is predicted. In addition, the increase in height at low latitudes (15° N), especially at SSPs370 and 585, is predicted. The frequency of events of this pattern is higher in January, December, February, March, November, and April, respectively, and is projected to decrease slightly in the future.
In CP13, high pressure 1020 covers the country’s northern half, and low pressure is in the west and center of the Mediterranean Sea, and over the Red Sea. The ridge extends from Saudi Arabia to the west of the Caspian Sea in the upper level. A strengthening of the subtropical high and an increasing GPH in the south of the Red Sea, the Arabian Sea, Yemen, and North Africa will occur in the future. The highest number of occurrences of CP13 is in January, February, March, and December. Its frequency is expected to decrease in the future (
Figure 15). CP13 is absent in the summer.
CP14 occurs most often in autumn and less frequently in winter and spring. The highest number of occurrences in the historical period is in October, but it shifts to a later period in the future scenarios, with a maximum in November in SSPs370 and 585. High pressure 1020 covers the northern regions of Iran, Turkey, and the western Mediterranean, and low pressure is in the south of the Red Sea. The trough is west of the Red Sea at the upper level, and a weak ridge extends from the south of Iran to the Caspian Sea. A strengthening of the subtropical high and an increasing geopotential over the Arabian Sea will occur in the future (
Figure 16).
In CP15 (
Figure 17), a thermal low-pressure surrounds the east, south, southwest, and even parts of the west and center of Iran. It also includes Iraq, Saudi Arabia, and the Red Sea. Isobar 1000 hPa is located on the Persian Gulf, and there is a high pressure in Southeast Europe to the west of the Black Sea. In future patterns, low pressure strengthens so that the isobar 1000 covers the Persian Gulf, the Oman Sea, southwestern Iran, and parts of eastern Saudi Arabia. Moreover, the strengthening of low pressure has caused the retreat of high pressure from the Black Sea. At the 500 hPa level, the increase of GPH, expansion of the high (590 dams) to the northern parts of the country, and the formation of the contour of 594 dams on the Red Sea and Saudi Arabia, as well as in Northeast Africa, signal the warming of the air mass. As expected, the frequency of the occurrence of CP15 is higher in July, June, August, and September. In addition, a relative decrease in the frequency of its occurrence can be seen in the future compared to the historical period.
A considerable increase in the number of occurrences of CP16 is expected, and this pattern often occurs in the spring. The mid-level pattern shows a relatively deep trough from southern Europe to the Mediterranean, which is accompanied by relatively low pressure (1012 hPa) on the surface map. The ridge of GPH over Iran extends north of the Caspian Sea, and the high pressure (1016 hPa) is northeast of Iran. The high-pressure influence on the northern country, the GPH increase, and the expansion of the subtropical high, with 590 dams, are predicted in the future (
Figure 18).
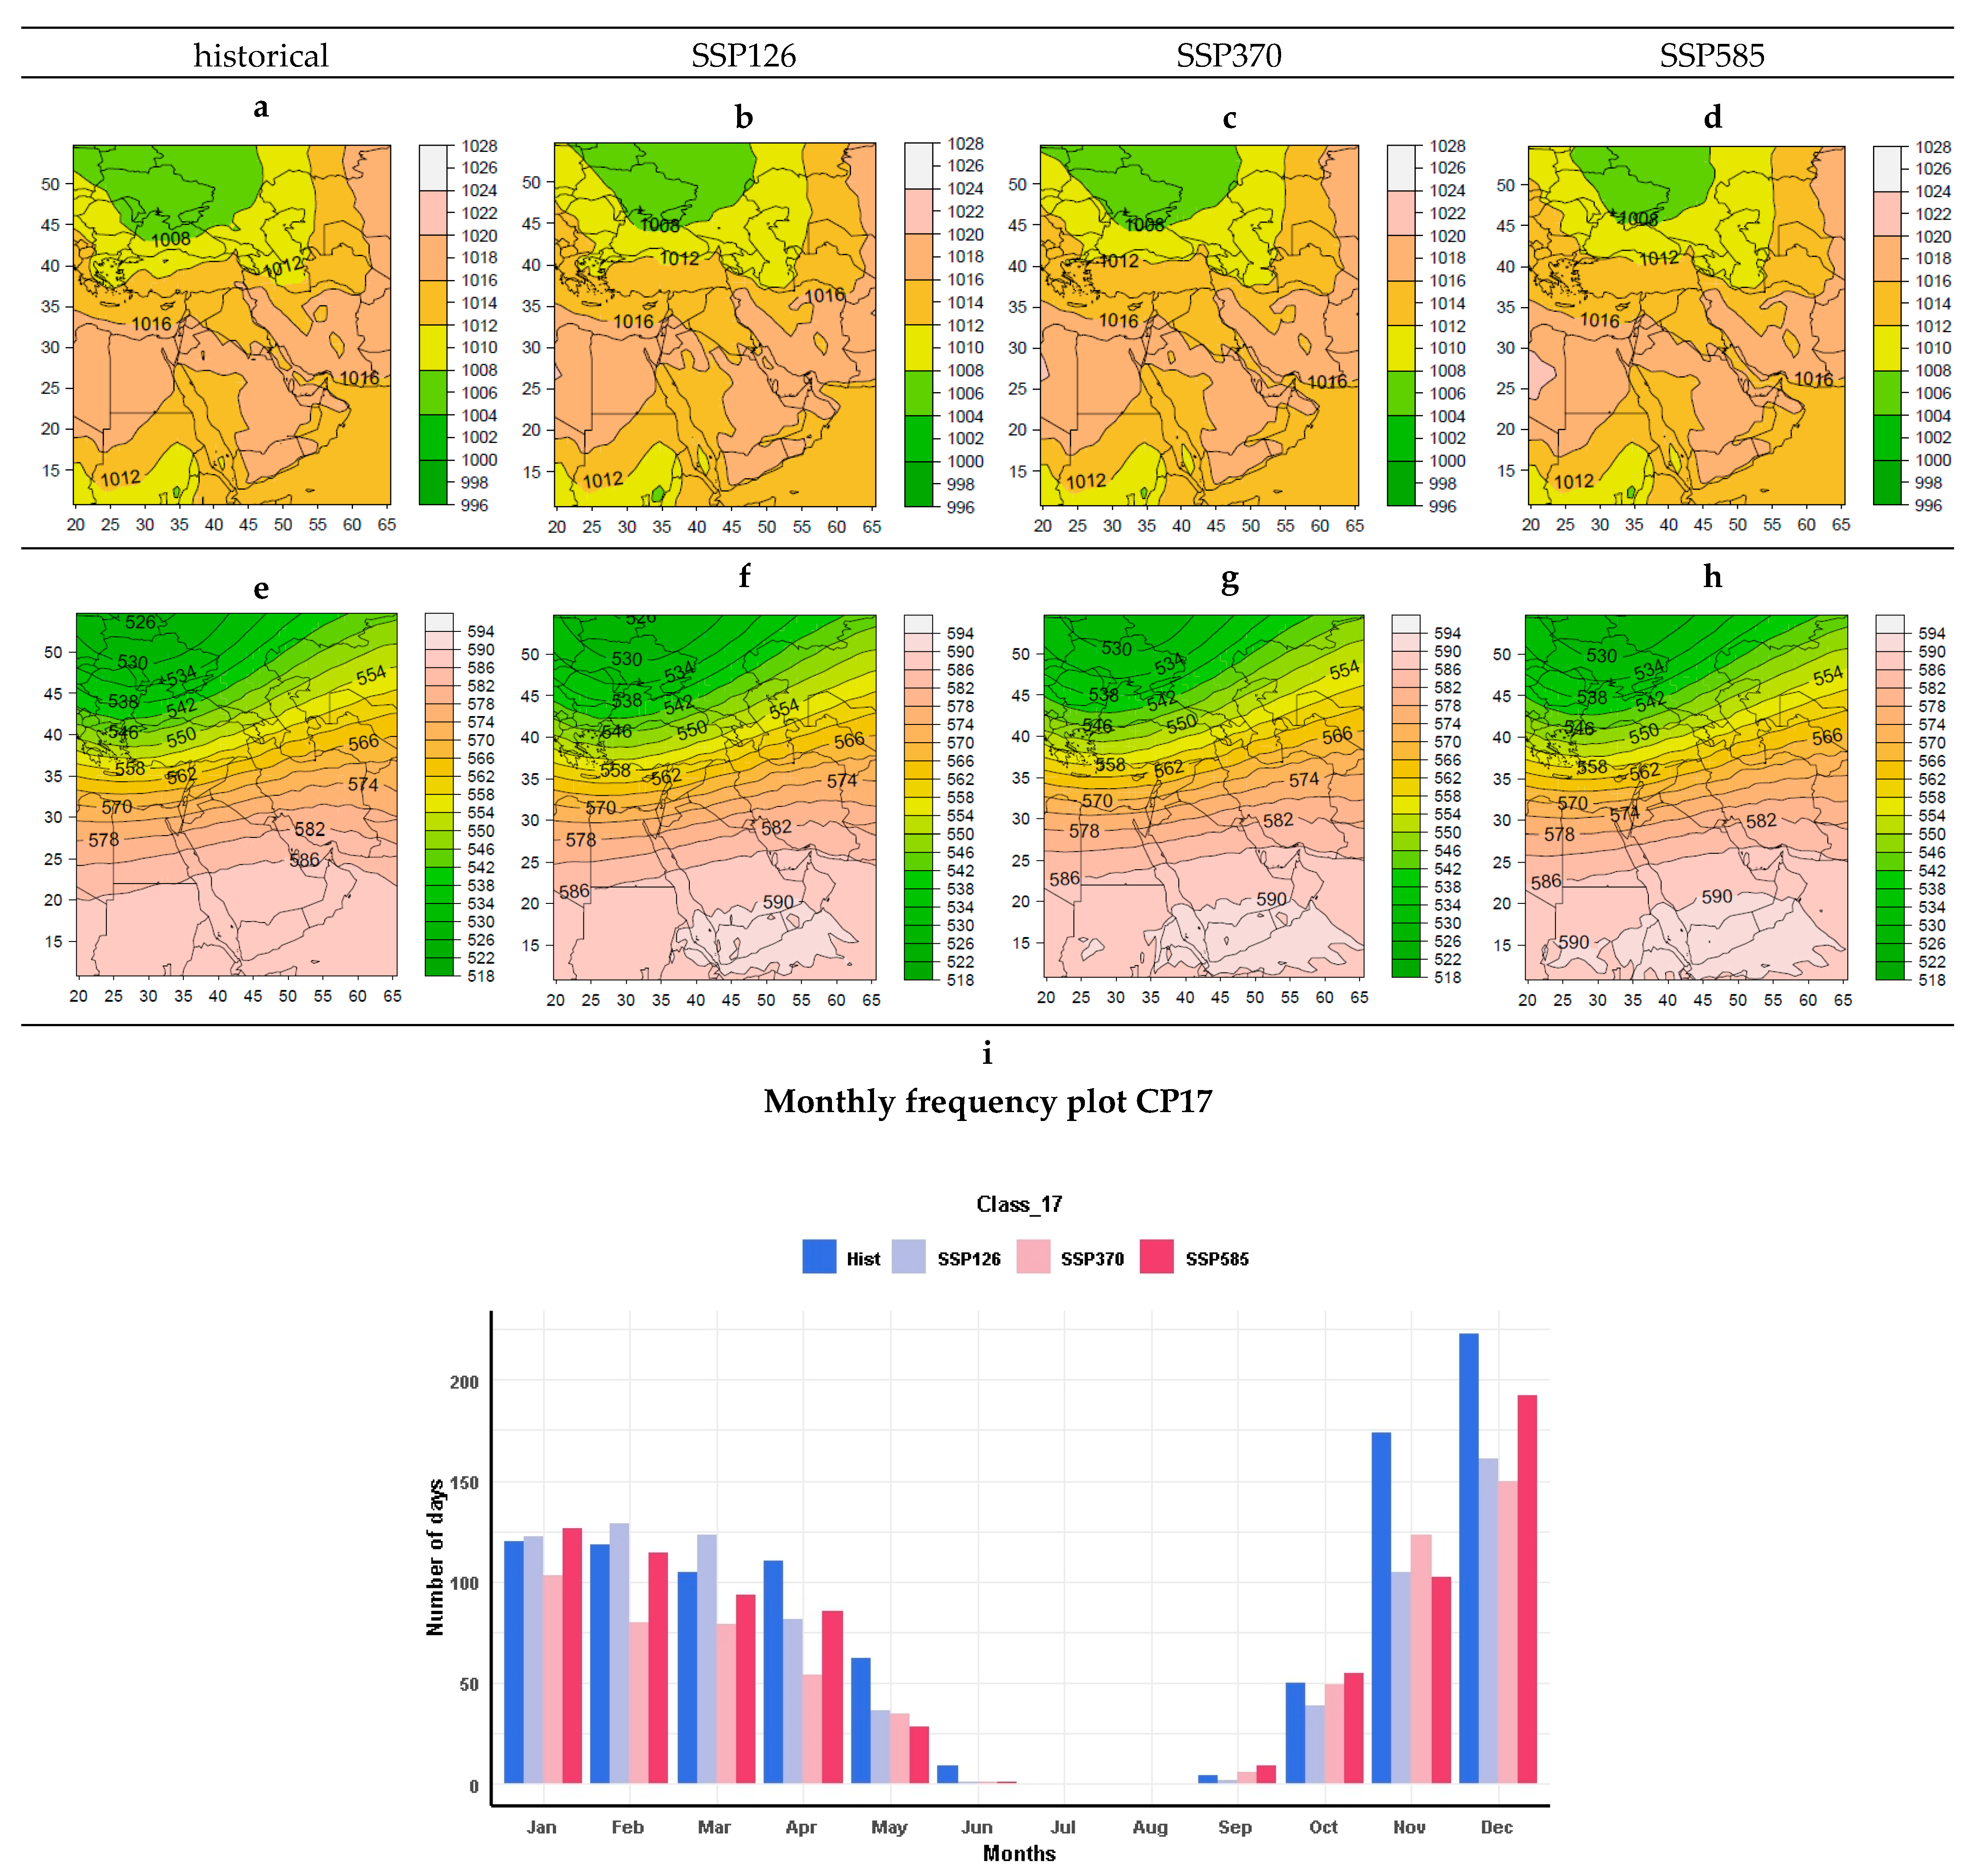
In CP17, low pressure (1008 hPa) is present over Eastern Europe and extends to the Black Sea. However, the low is projected to weaken and contract in the future so that it only covers a tiny part of the Black Sea in SSPs126 and 370, and is entirely out of the Black Sea in SSP 585. Relatively high pressure (1016 hPa) prevails in Northeast Africa, Saudi Arabia, and Iran. In the mid-level of the atmosphere, the trough is in Eastern Europe, west of the Black Sea, and over the Mediterranean Sea. These conditions are also present in the future patterns, but the subtropical high is strengthened, so the 590 dam is exceeded in the south of the Red Sea and Saudi Arabia. CP17 occurs most commonly in the year’s cold months, with the highest frequency in December and November and then in January, February, March, and April. Furthermore, a relative decrease in the frequency of incidents is predicted in future scenarios (
Figure 19).
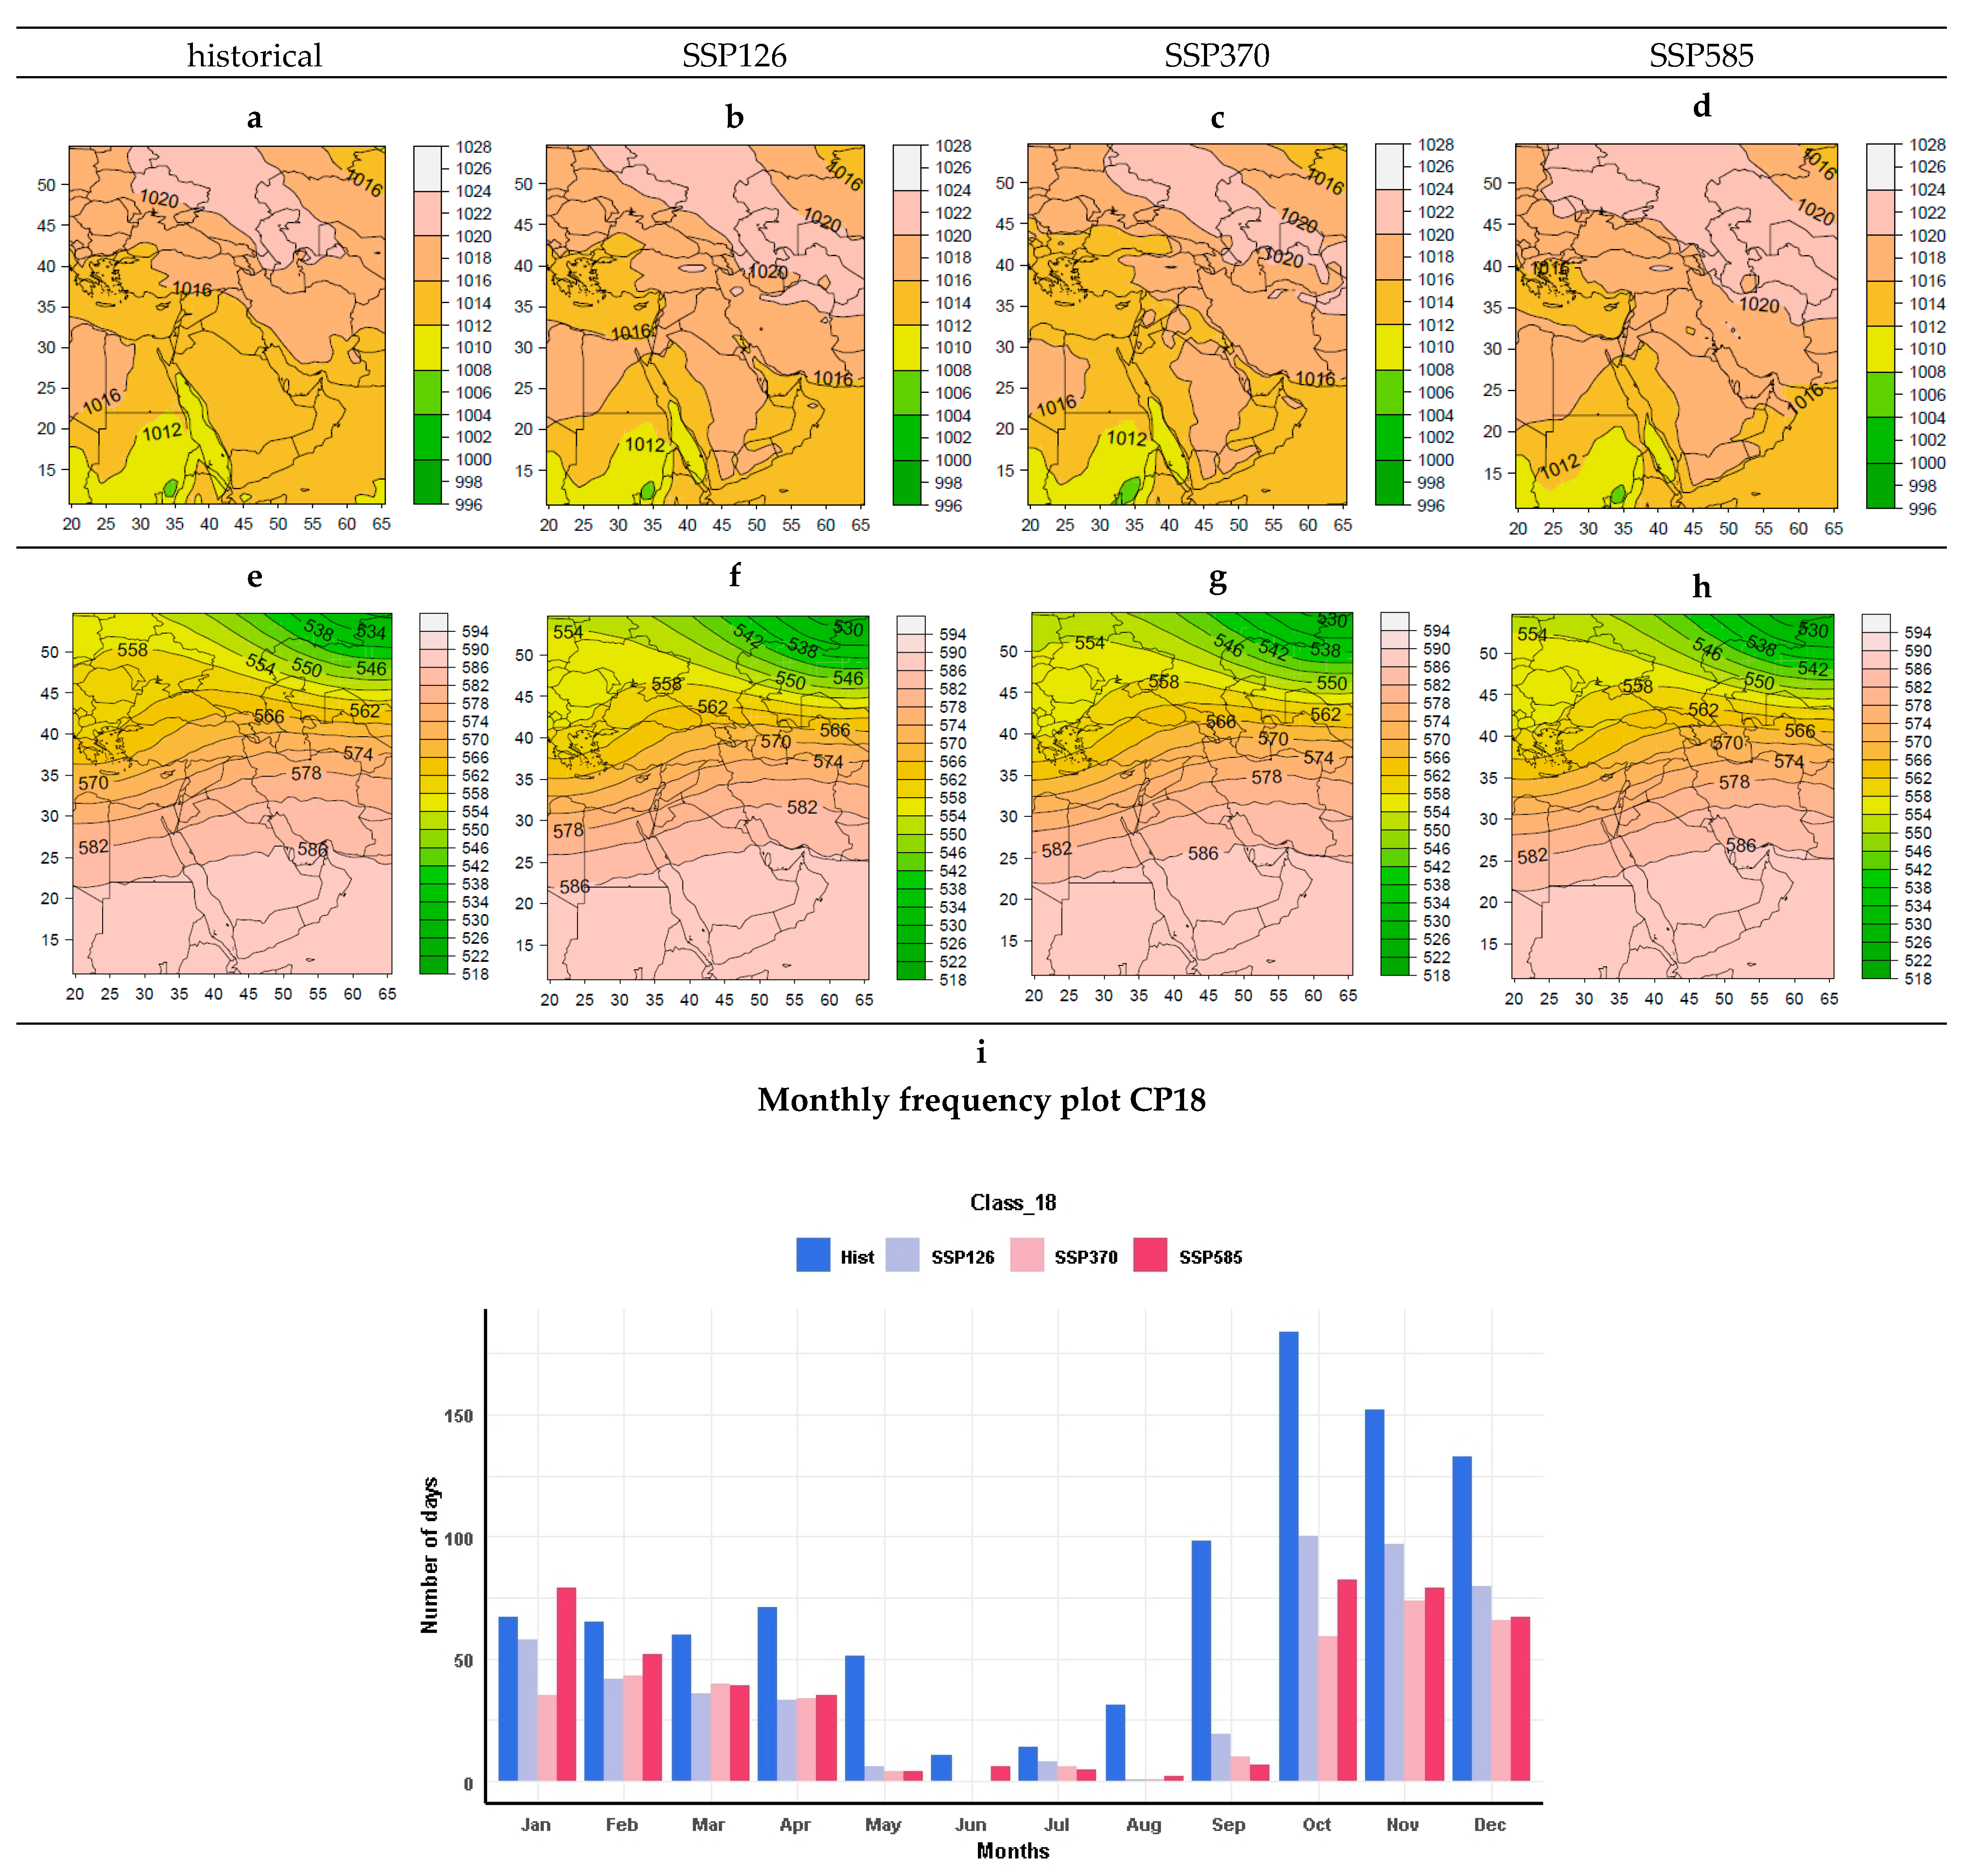
CP18 often occurs in the fall season (October, November, December, and September), and a significant decrease in its occurrence frequency can be seen. In future patterns, the arrival of high pressure from the north of the Caspian Sea to the north and northeast of the country will push back the low pressure from the south of Iran. A trough is located over the Mediterranean. As the Red Sea low pressure weakens, this dynamic system will weaken in future patterns (
Figure 20).
In order to evaluate the significance of the frequency of patterns, the standard t-test was performed at the 95% confidence level (Equation (1)).
and
represent 40 year mean values of the frequency of a given CP type, in a given month, in the historical simulation (1) and in any of the three scenario simulations (2).
and
are the corresponding interannual standard deviations in these frequencies and
are the numbers of years used.
Table 2 shows t statistics and
p-values. This table shows a significant increase in the frequency of CPs 3, 6, and 16, and a significant decrease in the frequency of CPs 11 and 18, for any of the three scenarios. In addition, it shows a slight increase in CPs 2 and 7, and a slight decrease in CPs 1, 8, 12, 15, and 17. There is also no significant difference in the frequencies of CPs 4, 5, and 10 for any of the three scenarios. The same applies to CPs 9 and 13 for SSPs126 and 585, and to CP14 for SSPs370 and 585. This is consistent with the frequency graphs of these CPs, which show no substantial projected increases or decreases in the future. For the rest of the CPs, such as CPs 3 and 6, the increasing trend is significant.
4. Conclusions
The existence of warm/cold and dry/wet weather, and the changes in extreme phenomena that accompany climate change in the future, depend on the variability of CPs. Therefore, using GCMs provides a better understanding of recent and future climate change. The results of this research showed that:
In CP1, dynamic high pressure prevails over Iran. The frequency of the occurrence of this cold pattern will be reduced significantly in all three scenarios. The future projections show an increase in the occurrence of CP2 (cold pattern) in which high pressure penetrates the west of Iran from the Mediterranean Sea. The frequency of occurrence of CPs 3 and 6 (warm patterns) will increase significantly in future periods. In these patterns, a thermal low is located in the southern half of Iran. The future projection shows a slight increase in the frequency of CP4, and it occurs more often from winter to mid-spring. CP5 often occurs during the transition season. The frequency of events in the future projections decreases in April, May, and September, but increases in October and November. CP7, which often occurs in the transition season, and less in winter, shows an increase in the projected frequency. In this CP, the southern low pressure over the Red Sea is associated with the trough of the Black Sea.
In CP8, the western parts of Iran are affected by the southern low pressure and a deep trough, which is located in the eastern Mediterranean. This cold season pattern is predicted to decrease slightly in future scenarios. CP9 is similar to CP1, but its thermal low pressure is more intense. A slight decrease in the number of occurrences of this winter-time pattern is expected in the future. CP10 shows the contrast between two air masses: northern (high pressure) and southern (low pressure). This pattern is active in the cold months of the year. CP11 is similar to CP6, but its low thermal pressure is more intense, and the subtropical high is developed northward, next to the southern shores of the Caspian Sea. It occurs in the warm period of the year and has the highest number of occurrences in August. In CP12, the western half of Iran is affected by the high pressure of Southeast Europe. The occurrence frequency of this cold pattern is predicted to decrease slightly in the future.
CP13 is also a winter-time pattern, and the number of occurrences is expected to decrease in future scenarios. In CP14, the low pressure of the Red Sea is associated with a trough that has formed in the eastern Mediterranean and the northern Red Sea. The highest number of occurrences is in October, and it will decrease relatively later, showing a significant increase in November. CP15, which shows the overall strengthening and expansion of the subtropical high and thermal low pressure in summer and early autumn, is predicted to decrease in the frequency of occurrences. Dynamic low pressure is located over southern Europe and the central Mediterranean in CP16. A considerable increase in the number of occurrences of CP16 is expected in the future. This pattern often occurs in the spring. In CP17, the low pressure in Southeast Europe is associated with the mid-level trough in the same region. The frequency of the occurrence of this cold pattern is predicted to decrease, which could only affect the areas of Northwest Iran. CP18 occurs throughout the year, but its highest frequency is in autumn, winter, and spring. As the Red Sea low pressure weakens, CP18 weakens in future patterns, and the frequency of occurrence decreases.
This study’s results indicate a significant difference in the arrangement of patterns, the frequency of weather types, the direction of movement of weather types, and their effectiveness in the study area. Therefore, this method can be considered quantitative and accurate for extracting atmospheric circulation patterns. Additionally, these patterns can be used as an index to analyze the relationship between environmental phenomena and synoptic patterns. In addition, in this research, the future perspective of patterns under the influence of global warming and climate change has been projected. This research approach examines the historical period of the atmospheric circulation pattern behavior based on CMIP6 data. Additionally, it examines the variability of the behavior of CPs with different scenarios for the next 40 years. Most importantly, an interpretation of effective environmental phenomena affecting the region can be depicted in the future by using the results of this research. It is noted that the results of this study are based on the MPI-Earth System model.


