Article

Variability in the Occurrence of Tropical and Extratropical Cyclones in the Atlantic Ocean and Its Climatic and Hydrological Determinants

1
Doctoral School of Natural Sciences, Adam Mickiewicz University, 61-680 Poznan, Poland
2
Department of Meteorology and Climatology, Adam Mickiewicz University, 61-680 Poznan, Poland
*
Author to whom correspondence should be addressed.
Atmosphere 2023, 14(2), 312; https://doi.org/10.3390/atmos14020312
Submission received: 3 January 2023 / Revised: 25 January 2023 / Accepted: 1 February 2023 / Published: 4 February 2023
(This article belongs to the Special Issue Extreme Weather Events and Atmospheric Circulation)

Abstract

:
The main objective of this study was to investigate the variability in annual counts and the northern extent of cyclones in the North Atlantic in the years 1970–2019. Cyclones were divided into tropical cyclones (TCs), called hurricanes in the Atlantic, and extratropical cyclones (ETCs), transformed from TCs. Linear regression methods and Pearson’s correlation coefficient were applied. The trend in numbers is upward for both types of cyclones. The maximum annual northern extent of TCs shows a decreasing trend, while that of ETCs is clearly increasing. Hurricane numbers show a moderate positive correlation (correlation coefficient 0.31) with the annual Southern Oscillation Index (SOI) and a negative correlation (−0.34) with the annual North Atlantic Oscillation (NAO) index. For the SOI in the months of the second half of the year, there is a strong correlation (up to 0.51) with the number of TCs in September–October. The highest correlation (0.65) is observed between the number of TCs and the annual Atlantic Multi-decadal Index (AMO). The number of TCs have been shown to correlate positively with the water temperature of the North Atlantic and western Pacific, and negatively with the eastern Pacific Ocean. A significant relationship has also been recorded between SST and the maximum annual extent of extratropical cyclones to the north and east (correlation coefficient of 0.4 to 0.6).

1. Introduction

A growing body of research points to the role of climate change in increasing the dynamics of tropical cyclones, including hurricanes in the Atlantic Ocean [1,2,3]. They are likely to do more damage than in a stable climate, exposing countries in America to mounting costs, as exemplified by Hurricane Sandy in 2012 [4], Hurricanes Harvey [5,6,7] and Maria [8] in 2017, and Hurricane Florence in 2018 [9]. The location where a hurricane reaches maximum intensity is moving farther and farther north [10]. Climate projections and simulations assume an increase in the frequency of hurricanes of magnitude 4 or 5 on the Saffir–Simpson scale if anthropogenic greenhouse gas emissions increase or continue their trend and the associated positive feedbacks amplify the Earth’s warming [11,12,13,14]. Computer modelling shows that the damage caused by hurricanes does and will continue to increase as the accompanying winds grow stronger and the flood waves become higher [15,16,17]. The strength of hurricanes is somewhat reduced by the aerosol cooling effect, but further warming of the climate, including a rise in sea temperatures, is likely to lead to this effect being cancelled out [18].
Gray [19] has shown that hurricane activity is highly dependent on the variability of factors, such as vertical wind shear, vorticity at low atmospheric levels, humidity at different altitudes (usually in the low and middle troposphere), and sea surface temperature (SST). Understanding single factors allows constructing and analyzing more complex variables, such as the potential intensity of the cyclone [20], convective available potential energy [21], or maximum possible intensity [22]. Macroscale circulation types play a large role in hurricane intensity. The African East Wave, which initiates the formation of a tropical depression that later develops into a tropical storm and finally into a hurricane, can be significant for hurricane activity and spread [23]. However, the various parameters associated with the intensity of North Atlantic cyclones correlate with the ENSO (El Niño-Southern Oscillation)—during the cooler phase (La Niña), their numbers are higher than average, and during the warmer phase (El Niño), lower [24]. However, the latitude and longitude at which landfall is made in the North Atlantic is higher during El Niño and lower during La Niña [25]. There is also a moderate relationship between North Atlantic Oscillation (NAO) and TC activity. A greater number of TCs is recorded during a negative phase than during a positive one. [26]. There are also significant connections between the positive phase of Atlantic Multi-decadal Oscillation (AMO) and hurricane activity [27,28]. AMO is also responsible for regional variation in hurricanes’ rainfall intensity [29].
A hurricane can weaken and move north–east, becoming a mid-latitude cyclone. Initially, knowledge of the latter was based on the mechanisms of temperature gradients and wind shear, which intensified the cyclone up to the point of occlusion [30]. It was not until Charney and Eliassen [31] that the importance of water temperature in the formation and maintenance of mid-latitude cyclones was demonstrated. Many years later, it was established how much of a role the baroclinic atmosphere plays in the existence of such structures [32]. As we became better acquainted with climate change and the phenomenon of global warming, it became apparent that rising water temperatures could have a measurable impact on the damage caused not only by hurricanes, but also by extratropical cyclones [33]. Interest in extratropical cyclones then grew considerably, and their impact on European weather appeared to be greater than previously thought. Consequently, a precise classification of such cyclones was created, with an emphasis on its use in synoptic meteorology and climatology [34]. A parameter called potential vorticity has been shown to be important for the northern migration of extratropical cyclones [35]. The exact evolution of a hurricane and the timing of its transition into an extratropical cyclone has also been studied [36,37,38]. Predictions created with climate models show that this type of cyclone will move farther and farther north as climate change proceeds [39].
The main objective of this study is to determine the trend of changes in the annual number and maximum extent of tropical cyclones (TCs) and extratropical cyclones (ETCs) in the Atlantic Ocean over the recent period spanning modern climate change (1970–2019), and to investigate initially the potential causes of this variability. The research hypothesis is that global warming, and the associated increase in ocean temperature, may influence the number of cyclones (both tropical and extratropical), as well as their expansion. Furthermore, this variability may also be modified by other factors of both atmospheric and oceanic origin, including the macrocirculation, conditioning the occurrence of a given El Niño–Southern Oscillation (ENSO), North Atlantic Oscillation (NAO), or Atlantic Multi-decadal Oscillation (AMO) phase. The additional aim of the study is to make a review of literature concerning recent changes in tropical and extra-tropical cyclones climatology, particularly pertaining to the objectives of this research, i.e., the number and extent of both cyclone types and their hydro-climatological conditions.

2. Materials and Methods

The HURDAT2 data available from the National Hurricane Center resources (an organ of NOAA—National Oceanic and Atmospheric Administration) were used to meet the research objective of the study. The data from the period 1970–2019, containing information on geographic coordinates and cyclone parameters at a temporal resolution of 6 h periods, were used in this study. Data indicating the annual and monthly North Atlantic Oscillation (NAO), Atlantic Multi-decadal Oscillation (AMO), and Southern Oscillation Index (SOI) representing the ENSO phase were also downloaded from the resources of the National Center for Atmospheric Research. The former are calculated using the Hurrell method [40], and values of the second one are based on the Trenberth and Shea method [41], while the third are based on measurements of pressure fluctuations in Darwin (Australia). Data indicating sea surface temperature (SST) at a temporal resolution of one month and dimensions of 1 degree latitude by 1 degree longitude were downloaded to reanalyze [42].
The achievement of the objective of the study is associated with the application of the following statistical analysis methods: (1) presenting the long-term variability of the phenomena under study and determining the trend by means of linear regression, and (2) establishing a potential causal relationship between the phenomena analyzed by means of Pearson’s correlation coefficient, taking into account statistical significance.
First, it was calculated how many of each type of cyclone (TC and ETC, separately) there were in each year of the time interval adopted (1970–2019). The seasonal variability of their occurrence was analyzed by computing the mean number of cases in each month. It was analyzed in which months the cyclones occurred, as well as the number of cyclones. Furthermore, the mean maximum northern extent of TCs and ETCs was determined with the month of their occurrences. It was then checked in which month the maximum northward extent was reached. A trend line was used for the multi-year abundance patterns, to which the equation of the linear function and the coefficient of determination were fitted.
For each year, the maximum latitude reached by TCs and ETCs, with the furthest extent of them in each season, was determined, and for ETCs only, the maximum eastern extent was determined. These annual records were also analyzed for multi-year trends. Similarly, analysis of the seasonal averages of the northern (TC and ETC) and eastern (TECETC) extents was also carried out. In the next step, correlation relationships between the abundance seasonal number and the maximum extent of cyclones and NAO and ENSO circulation types were reviewed, using monthly and annual NAO and SOI indices. Furthermore, an analysis of the relationship between the seasonal number and the maximum abundance and magnitude of the northern/eastern cyclone expansion and SST was conducted. A spatial correlation matrix was created, showing the relationship between Atlantic cyclones’ abundance/extent, and their maximum annual extent and SST at each point in the World Ocean.
The period 1970–2019 was chosen for the analysis, as the longer period covering earlier years could obscure the potential impact of climate change on cyclone development and would be prone to misinterpretations due to heterogeneous cyclone observation methods over a long time span [43,44]. In addition, the results of correlations with variables, such as SST, would have a lower range of reliability, as the reconstruction of such parameters prior to the satellite monitoring era is difficult and error-prone [45].

3. Results

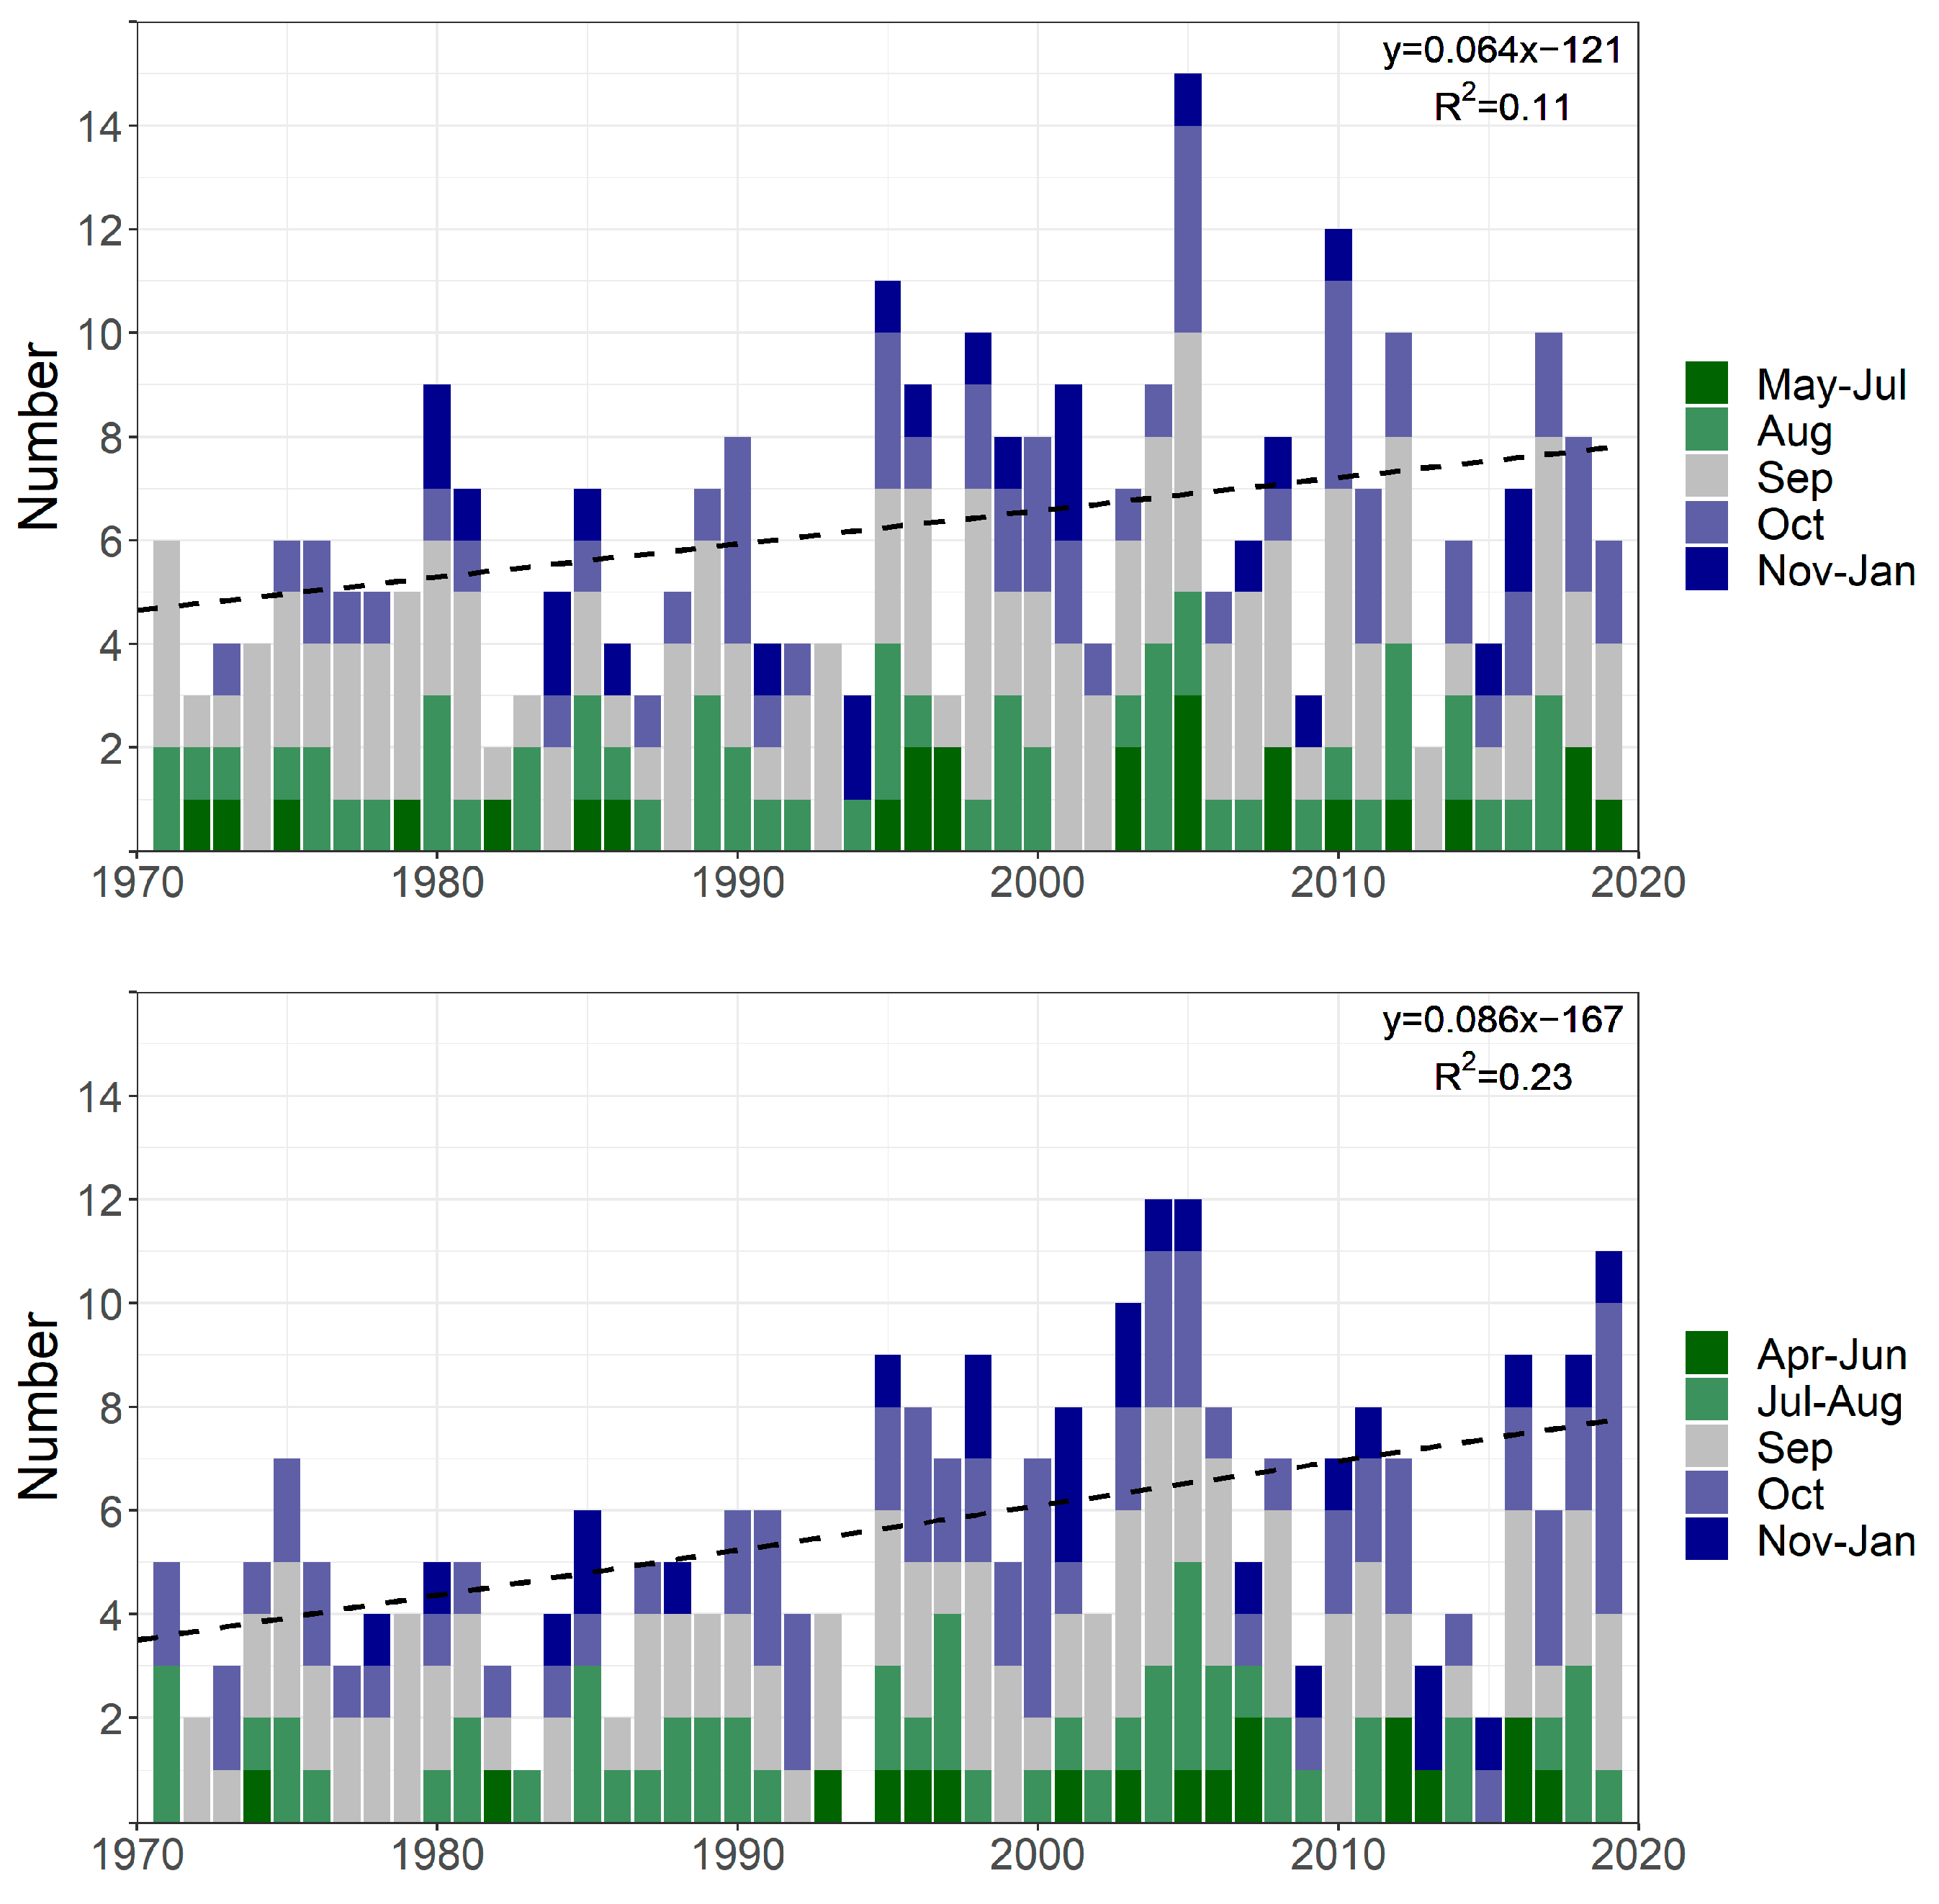
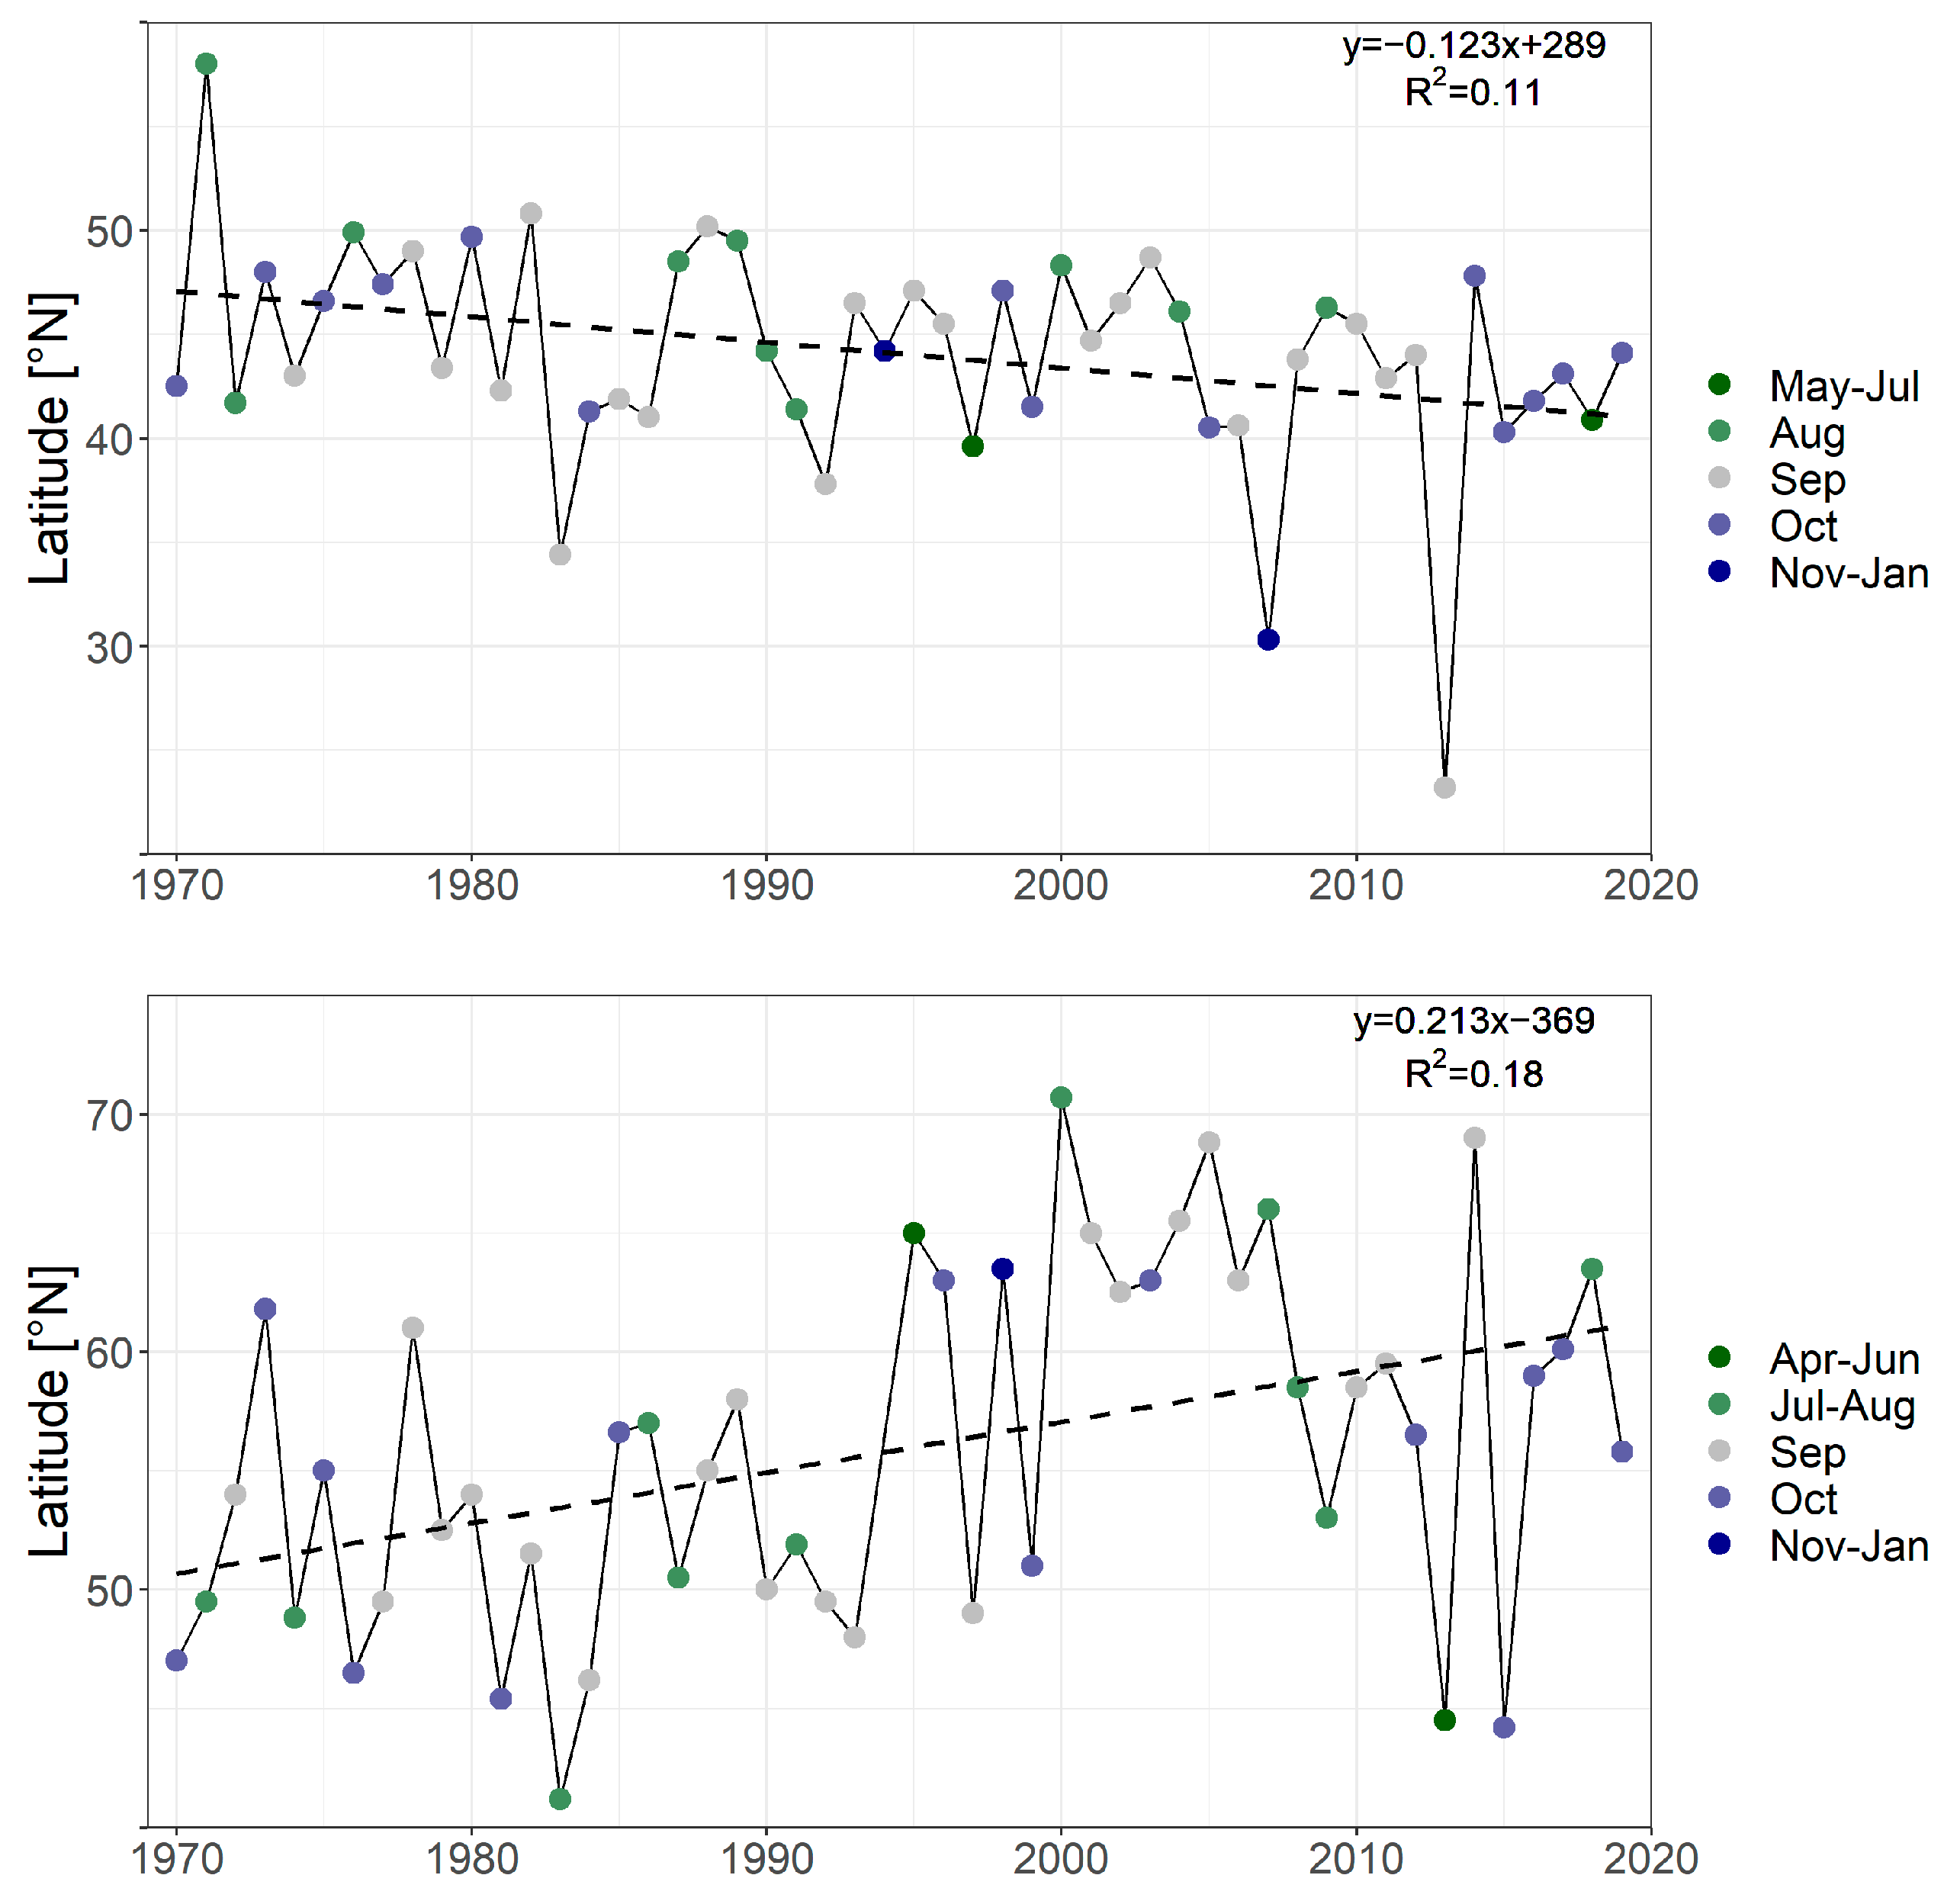
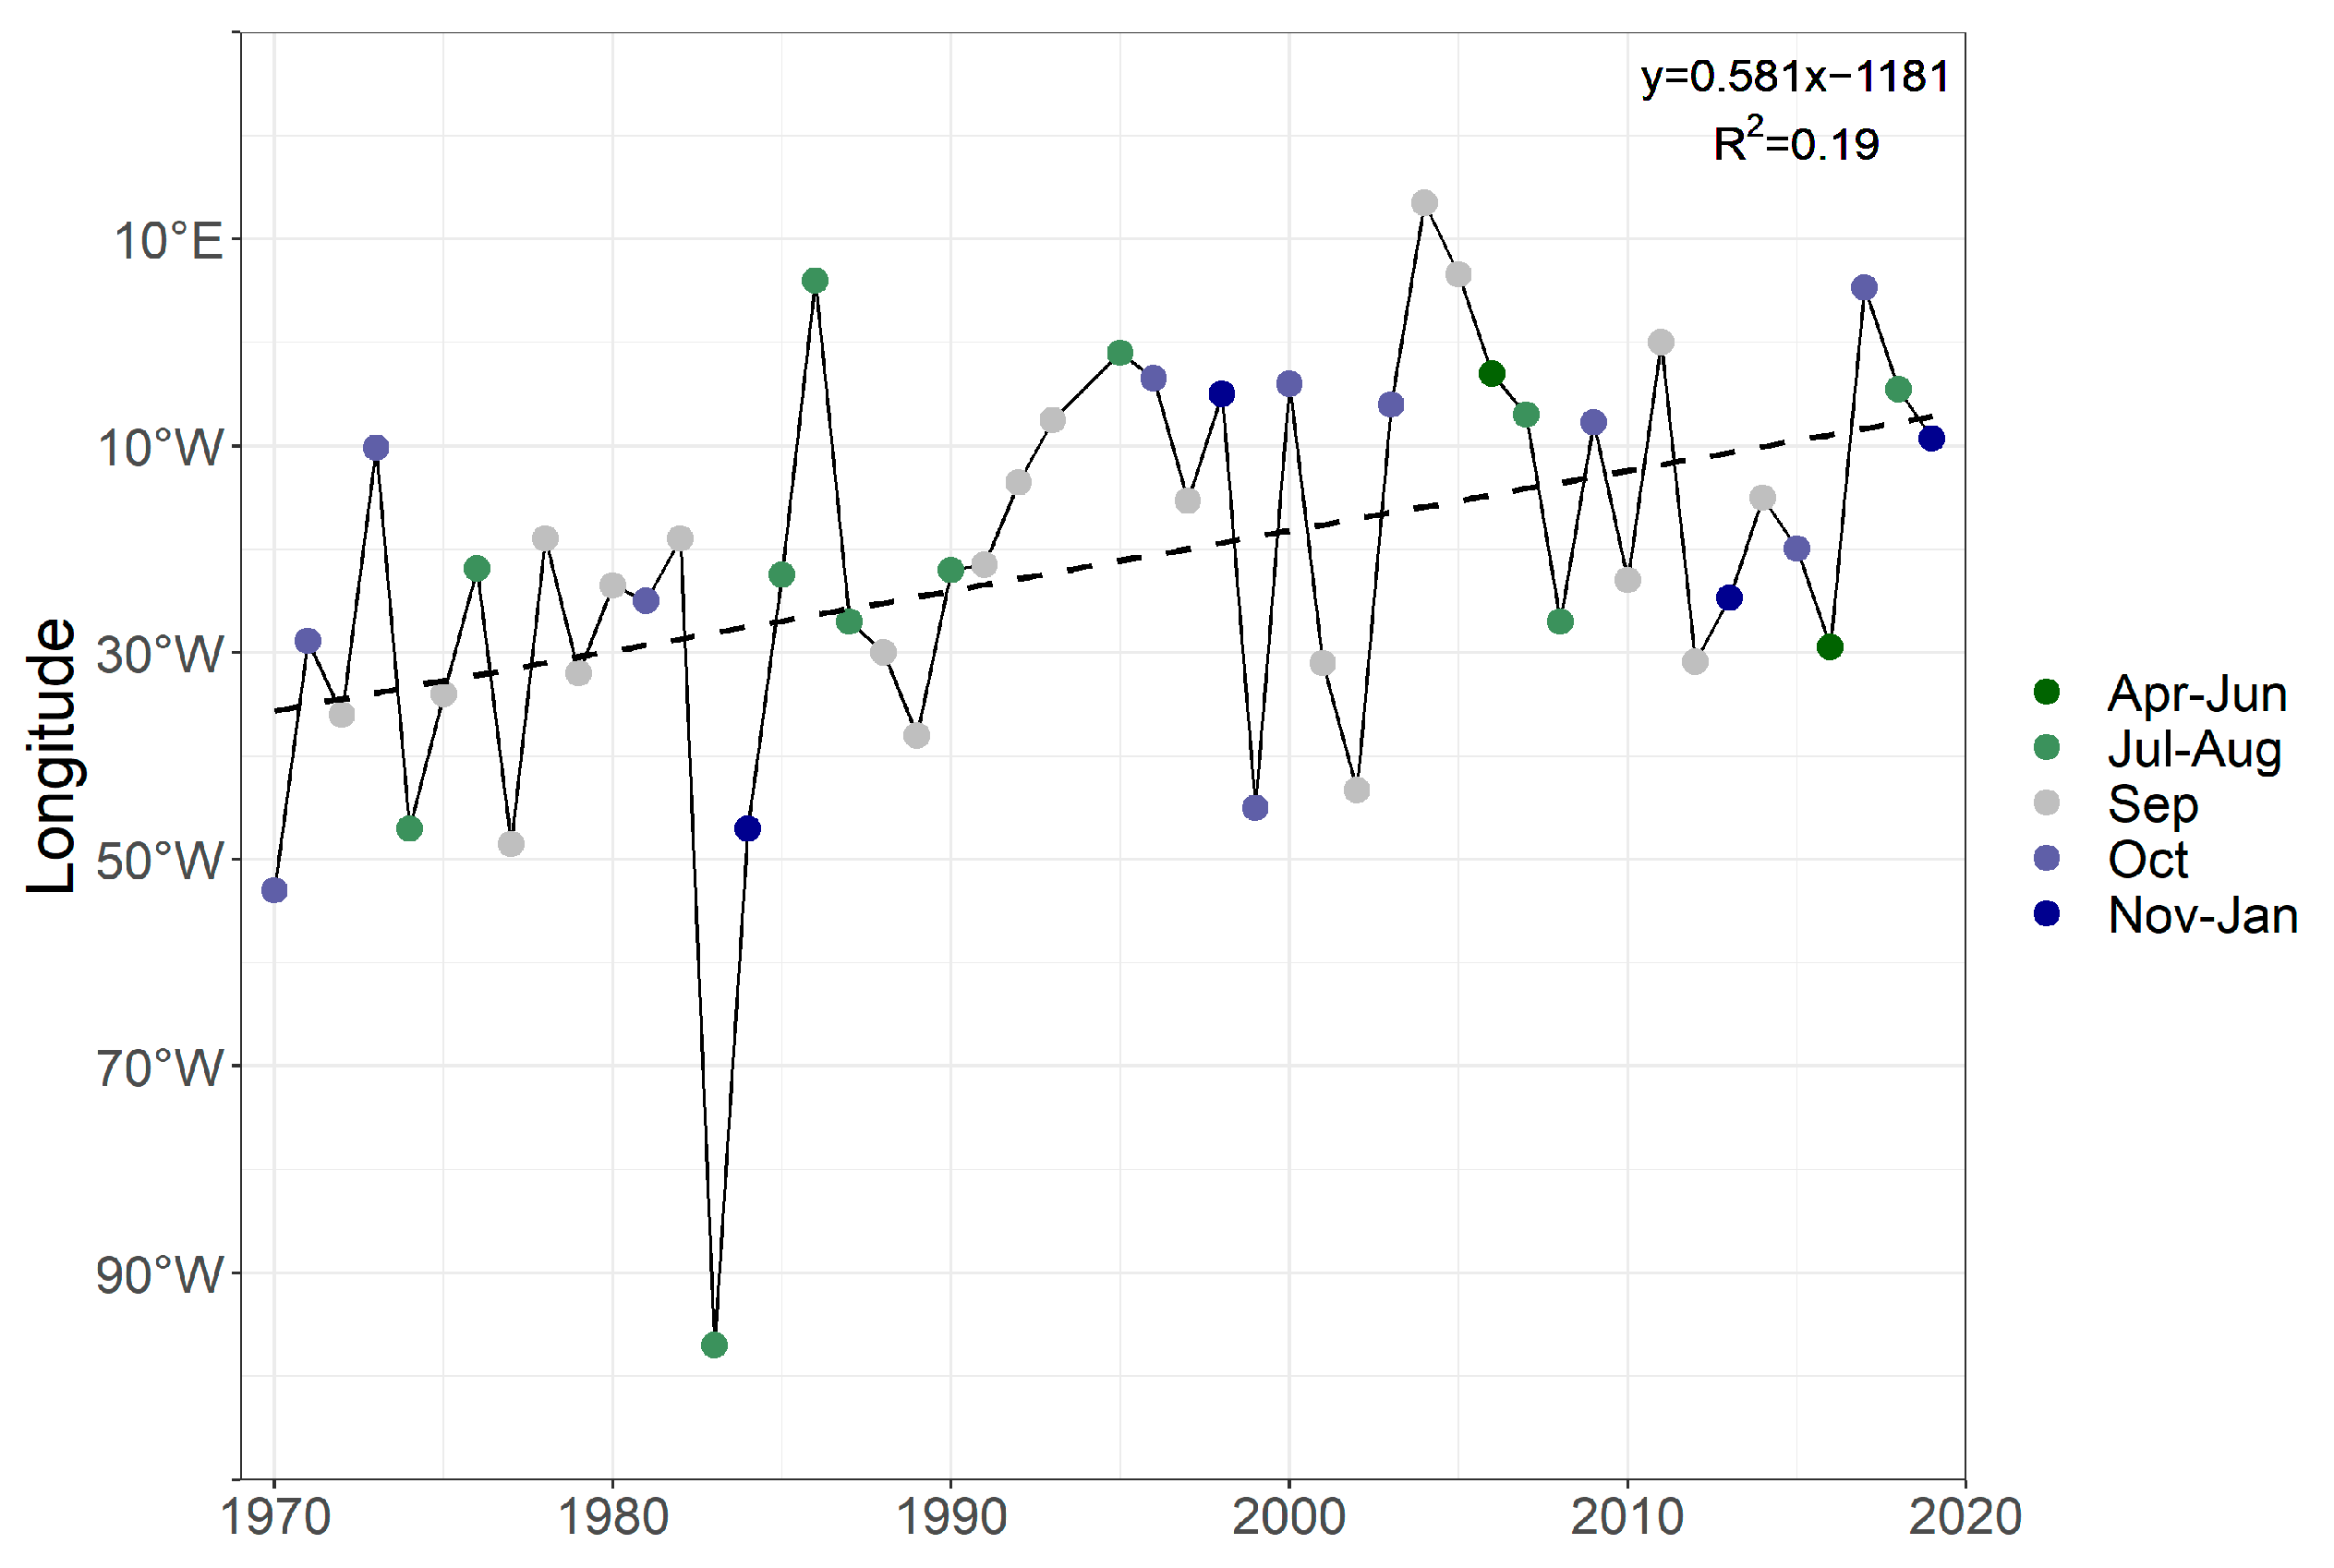
3.1. Temporal Variability and Trends in Occurrence of TC and ETC

Between 1970 and 2019, 311 hurricanes (TCs) and 281 extratropical cyclones (ETCs) were observed in the North Atlantic, or a total of 592 such structures. The month with the highest number of them was September (Figure 1), when 238 TCs and ETCs occurred, accounting for about 40% of all observations. There were 141 such occurrences in October and 91 in August. Unlike in August, ETCs were more frequently observed than TCs in October. A similar number of surveyed cyclones occurred in July and November (39 and 42 cases). In June, 21 cyclones were recorded, most of which were ETCs. Sporadically, cyclones were recorded in January, April, May, and December. In February and March, none of these structures were observed.
Hurricane abundance in the North Atlantic between 1970 and 2019 ranged from 2 per year (1982 and 2013) to 15 per year (Figure 2). The average was 6.22/year. The record value occurred in 2005. At that time, 15 TCs were observed in different months: 5 in September, 4 in October, 3 between May and July, 2 in August, and 1 in the winter months. Quite a few TCs were also recorded in 2010 and 1995 (12 and 11, respectively). An increasing trend in the annual number of TCs in the Atlantic over the analyzed time interval is observed, amounting to 0.64 per 10 years (a statistically significant result at the significance level α < 0.05). Almost every year, there was at least one hurricane in September (the exception was 1994). In 37 years, there was at least 1 observation of a hurricane in October, the same as in August. In three seasons, as many as four TCs were recorded in October (1990, 2005 and 2010), and in the case of August, this occurred only in 2004. In nearly 40% of the years analyzed, hurricanes were observed in May–July (3 times in 2005) and November–January (3 times in 2001).
A total of 281 extratropical cyclones were recorded in the analyzed multiyear period, giving an average of 5.6 per year. The only year without an ETC was 1994. Only 1 year later, however, as many as 9 such cyclones were recorded for the first time, while the maximum number was reached in 2004 and 2005, when 12 ETCs per year were observed. It was still close to equaling this record in 2019, when 11 ETCs were recorded. The linear trend is upwards of 0.86 per 10 years. This means that, on average, 1 new cyclone is observed every 10 years. The trend has a higher statistical significance than that for hurricanes (at a significance level of α < 0.001). In 41 years out of 50, at least 1 ETC occurred in September, while in 80% of the years analyzed, ETCs occurred in October. In 36 seasons, at least 1 cyclone of this type was recorded in the July–January period. Apart from 1994, when ETCs did not appear at all, only in 2013 was the phenomenon not recorded in the period from July to October, while usually the four months mentioned had the largest share of the total annual number of these cyclones. The phenomenon, although also occurring quite regularly from April to June and from November to January, is not characterized by a very high average annual abundance in these months.
Figure 3 shows only a single, year-record indication of the latitude at which a TC was observed. Subsequently, it transformed into an ETC, turned towards lower latitudes, or died out. A decreasing trend of the maximum TC extent so depicted is observed. The directional coefficient of the trend line is −0.12, while the coefficient of determination is 0.11. The result is statistically significant (α < 0.05). It should be noted that the nature of the regression is strongly influenced by two outliers on the two opposite sides of the time series. In October 1973, a hurricane was observed at 58°N. By contrast, in September 2013, the farthest TC recorded reached just 23°N. Most TCs ended their lives between 40 and 50 degrees north latitude. Maximum extents were reached by hurricanes at different times of the year. The most common periods were August, September, and October; however, twice the furthest northward extent was reached by a cyclone from the May–July period, and once from the November–January season.
An increasing trend of the maximum northern latitude reached by ETCs in a given year is observed. According to the linear regression model, the rate of northward shift of ETCs of extreme extent in a given season is 2 degrees per 10 years. The result is statistically significant (α < 0.01). Roughly since 1995, more and more ETCs have been observed at latitudes above 60° N. In 2000, an ETC went above 70° N, which is the only such case in the time period analyzed. It is noteworthy that this took place in the period before the hurricane season, namely between July and August. However, most of the annual maximum northward migration happened in September and October. The two September indications were close to reaching 70° N. ETCs from the April–June and November–January periods entered the polar circle region (one in case each).
The maximum annual eastern extent of ETCs was also examined. Again, the trend is increasing and statistically significant at the α < 0.01 level (Figure 4). In some years, ETCs even moved into the eastern hemisphere (four times, the last time in October 2017). In 2004, the September ETC reached a record 13.5° E. ETCs reached their annual maximum longitude in different months of the year. Most often, this occurred in September (21 times) and October (11 times).

3.2. Relationship between Macroscale Circulation Patterns (ENSO/NAO) and TC/ETC Occurrence

A high correlation is observed between the annual number of TCs and the annual AMO index (Table 1), equaling 0.65. Positive AMO is connected with higher water temperature in the northern part of the Atlantic Ocean. There is a moderate relationship between the annual number of hurricanes and the annual SOI and NAO indices. In the former case, a high annual number of hurricanes co-occurs with the La Niña phenomenon (cool phase of the ocean), in which there is a strong push of warm Pacific surface waters westwards (from the coast of South America to Australia) by the trade winds. The correlation coefficient between the seasonal number of hurricanes and the SOI (a measure of ENSO) is 0.31. There is a tendency for the NAO to increase the number of TCs in the negative phase of the oscillation. It consists in a weakening of the zonal west–to–east air flow in the temperate zone (from the coast of North America towards Central and Northern Europe). The correlation coefficient in this case is −0.34. However, there is no significant correlation between the maximum annual extent reached by TCs and the macroscale circulation types described here. In the case of extratropical cyclones, a correlation between their annual number and AMO, ENSO, or the NAO circulation index is observed to be lower than in the case of hurricanes. However, the correlation with the AMO index is still quite high (0.60). For ENSO, there is no significant correlation for both the number and extent of ETCs. As far as the NAO is concerned, there is a negative correlation with regard to their number. Thus, in the negative phase of the NAO in the Atlantic, an increased number of ETCs converted from hurricanes is observed. There is, in addition, a significant correlation between the northern extent of ETCs and the annual AMO index.
Monthly AMO indices are positively correlated with TC and ETC abundance in September–October (Table 2). The correlation coefficient for AMO indices measured in August/September and the number of TCs in the season equals 0.64. The highest correlation between AMO and ETC seasonal abundance is noted in August (0.56). Quite high correlation coefficients are also observed for AMO indices in other months of the year. Some monthly SOI indices show a significant correlation with TC abundance during the season of their occurrence (September–October) (Table 2). The strongest relationship occurs at the end of the year (0.51 in October, 0.39 in November, and 0.48 in December). Statistically significant results were also obtained for the July and September indices. The correlation with the number of hurricanes in September–October is moderate and negative for the NAO indices from two months: March (−0.35) and May (−0.30). For ETCs, the moderate correlations are both positive and negative. Higher SOIs in December seem to slightly coincide with higher numbers of ETCs during this period (correlation 0.28). In contrast, higher SOIs in June and February show an inverse relationship (correlations of −0.31 and −0.27, respectively). The correlation with the May NAO index is negative (−0.36) and with the September index positive (0.33).

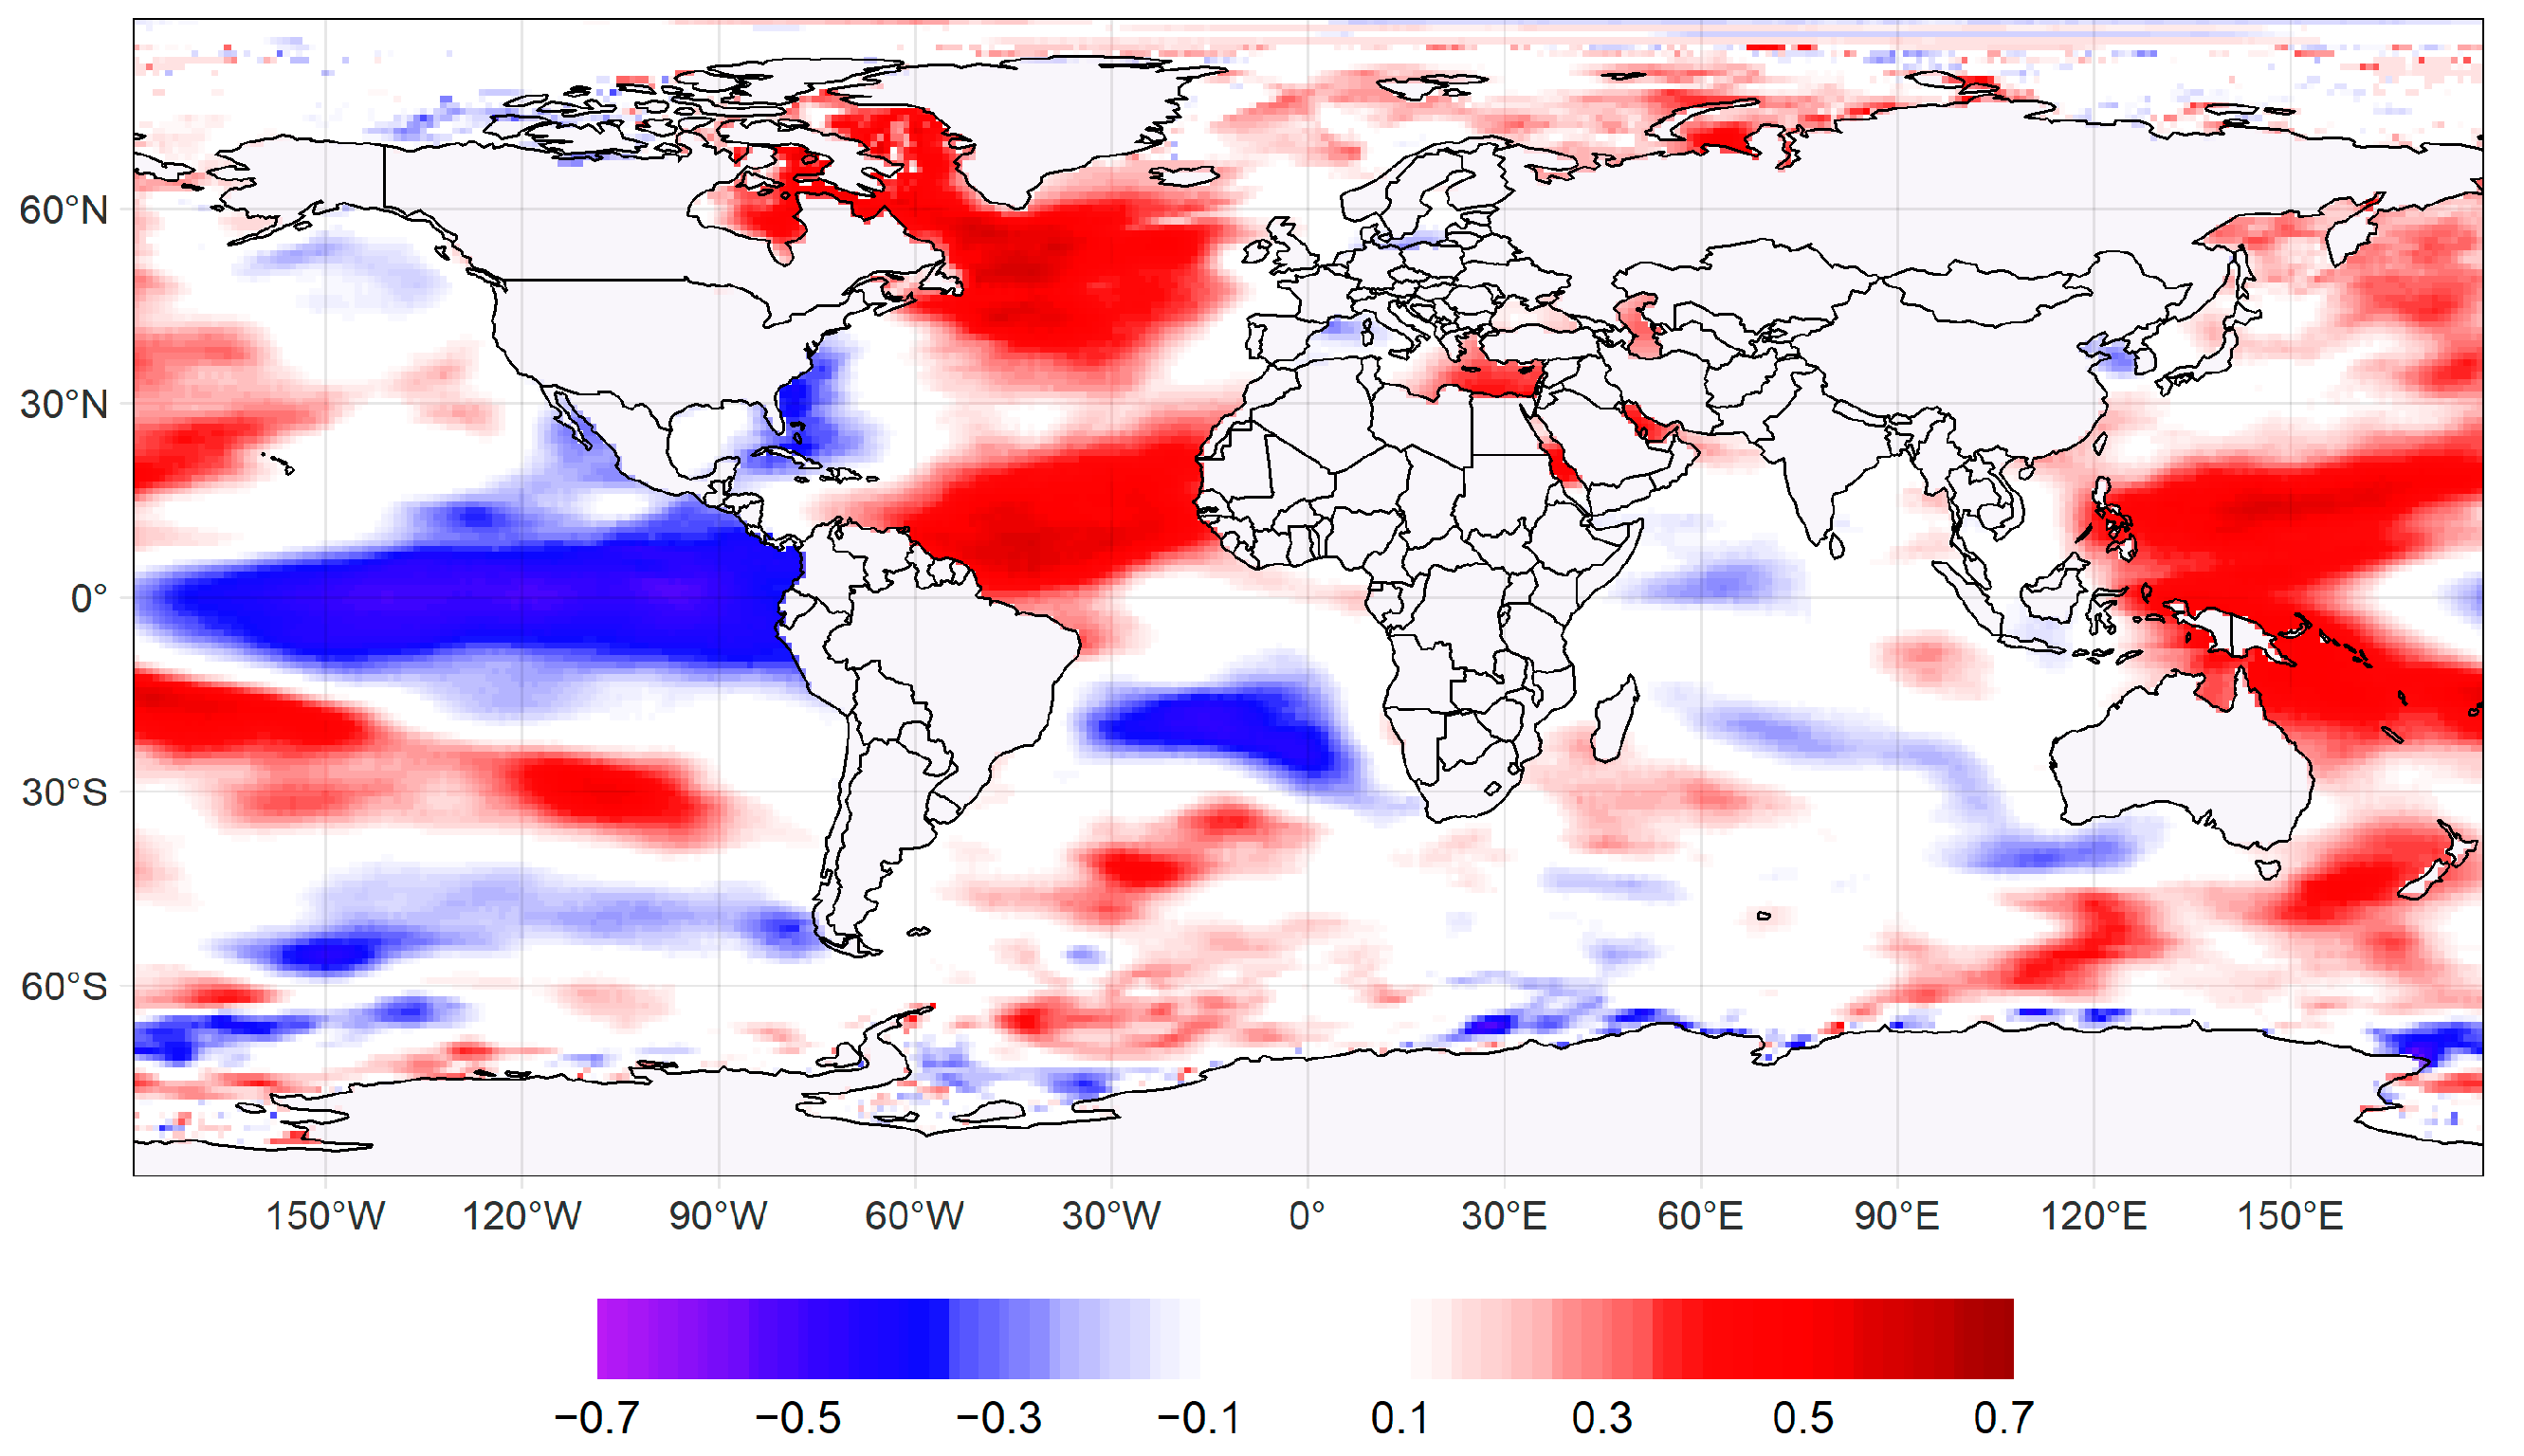
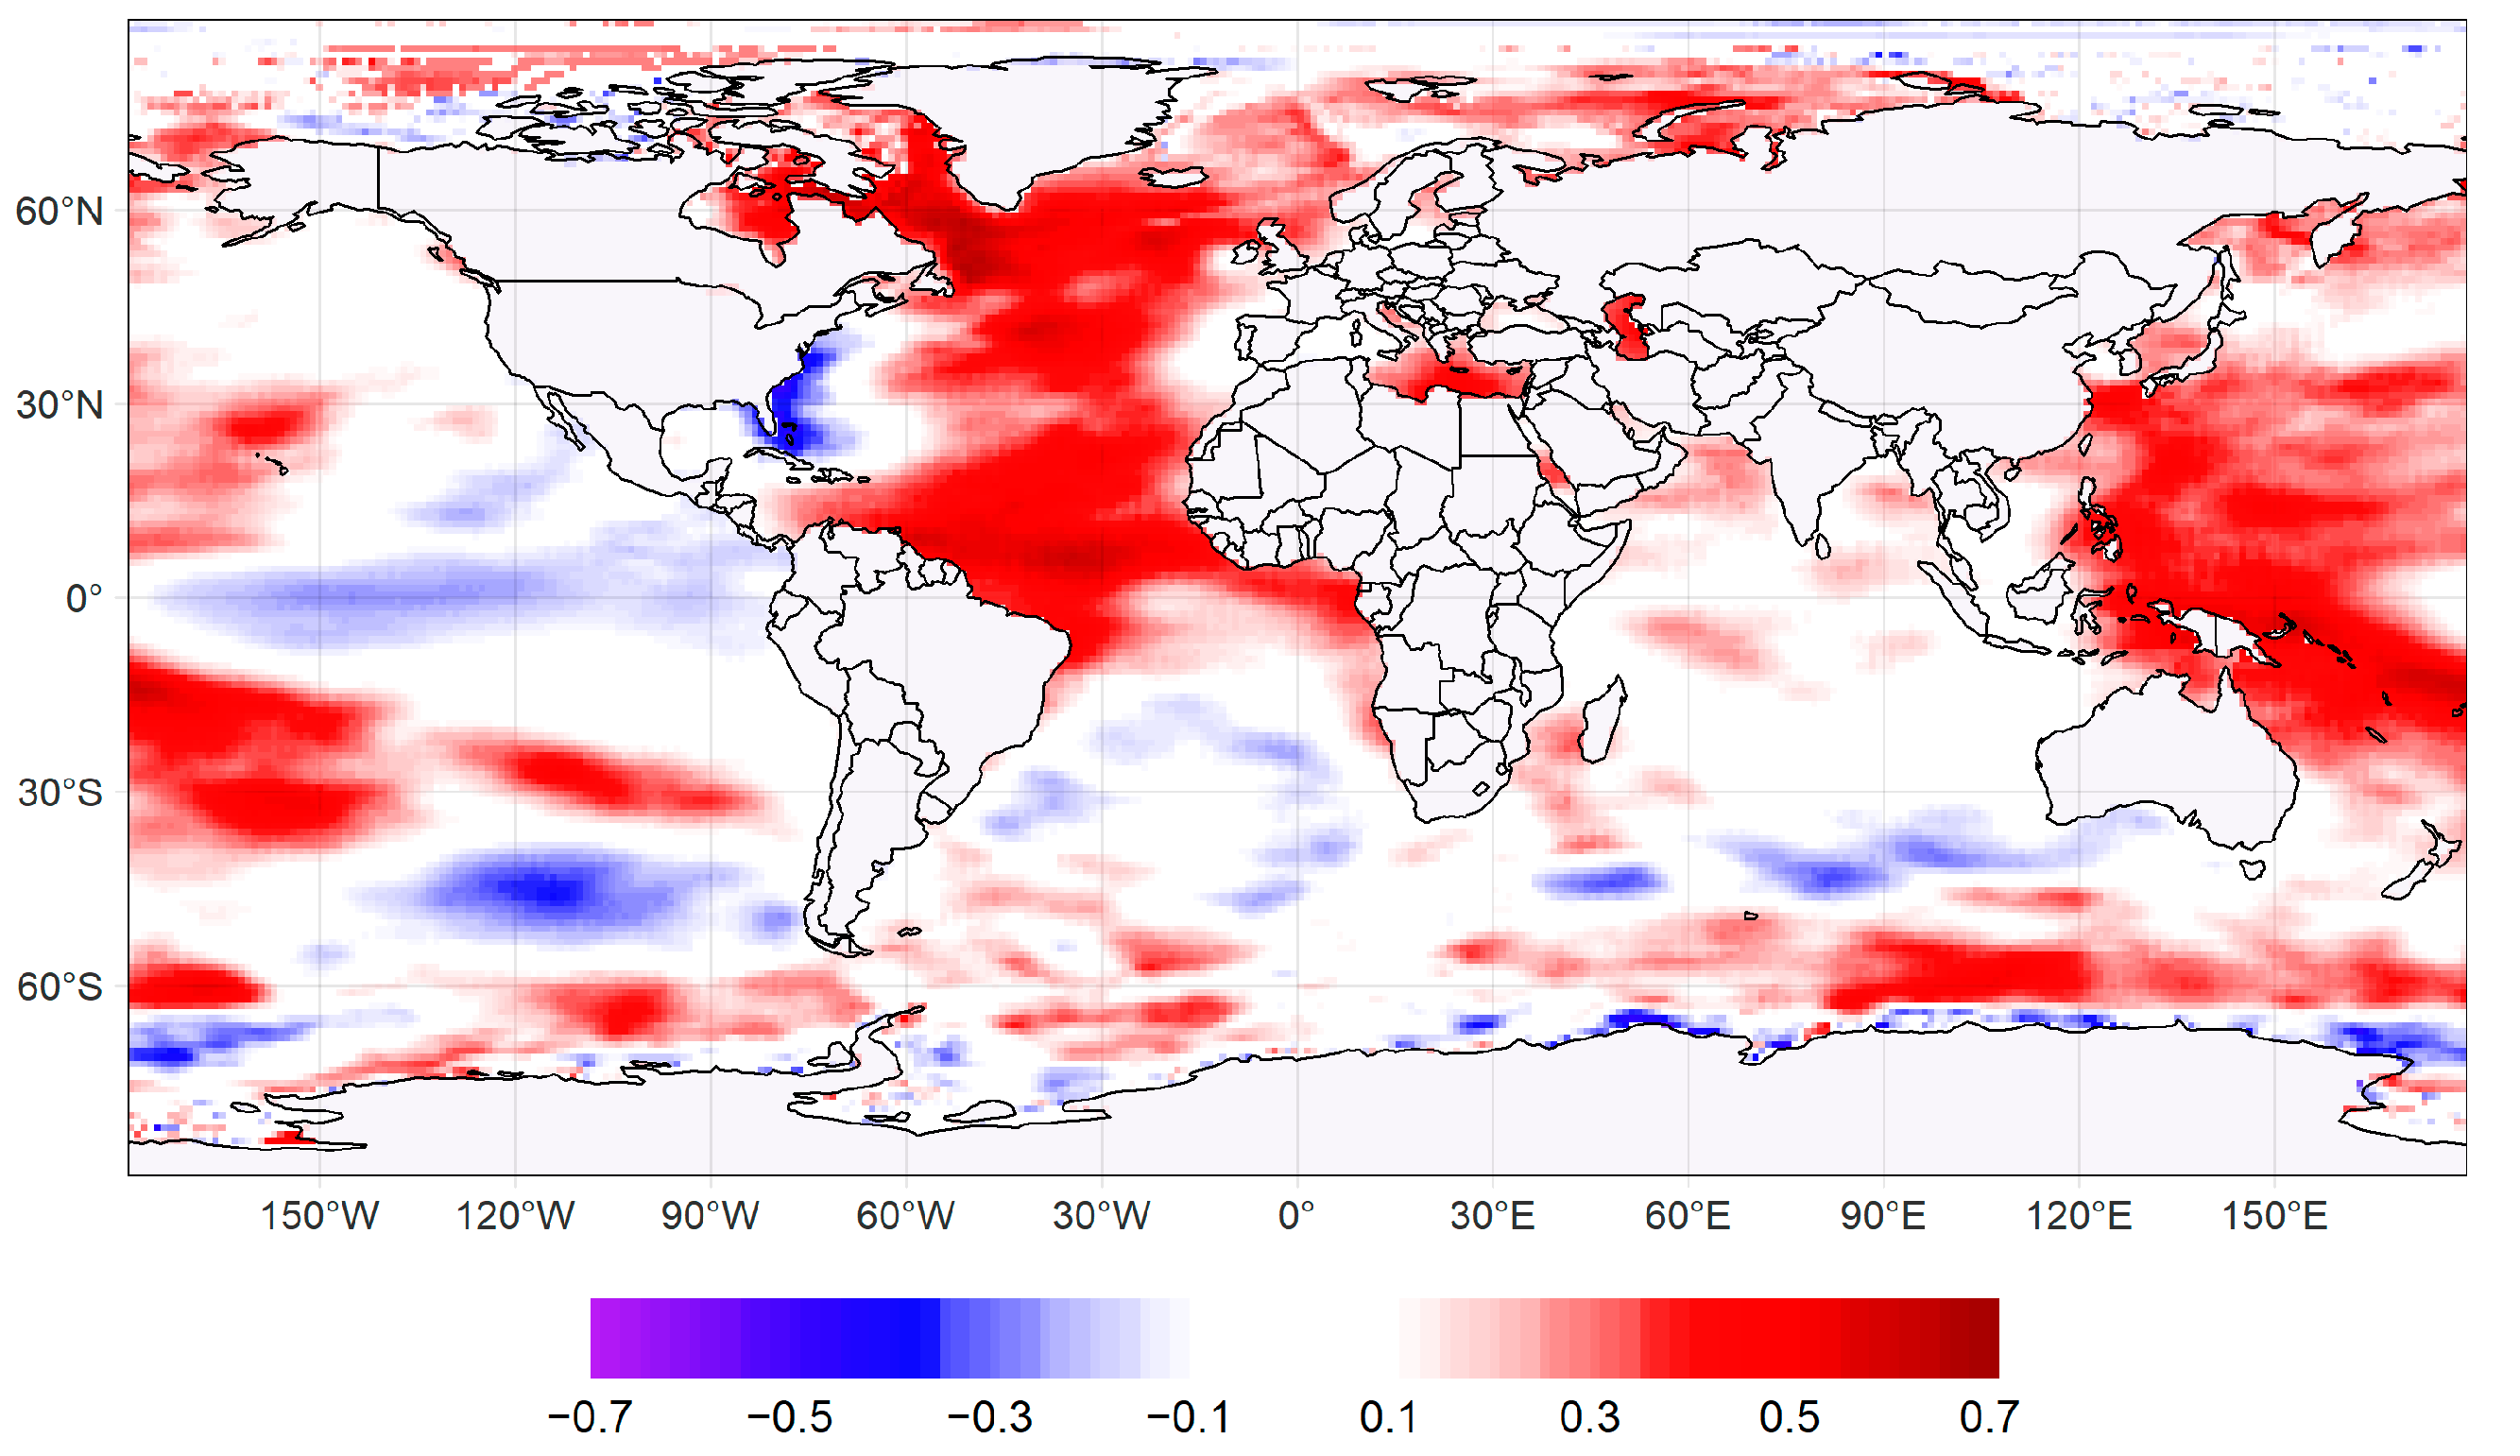
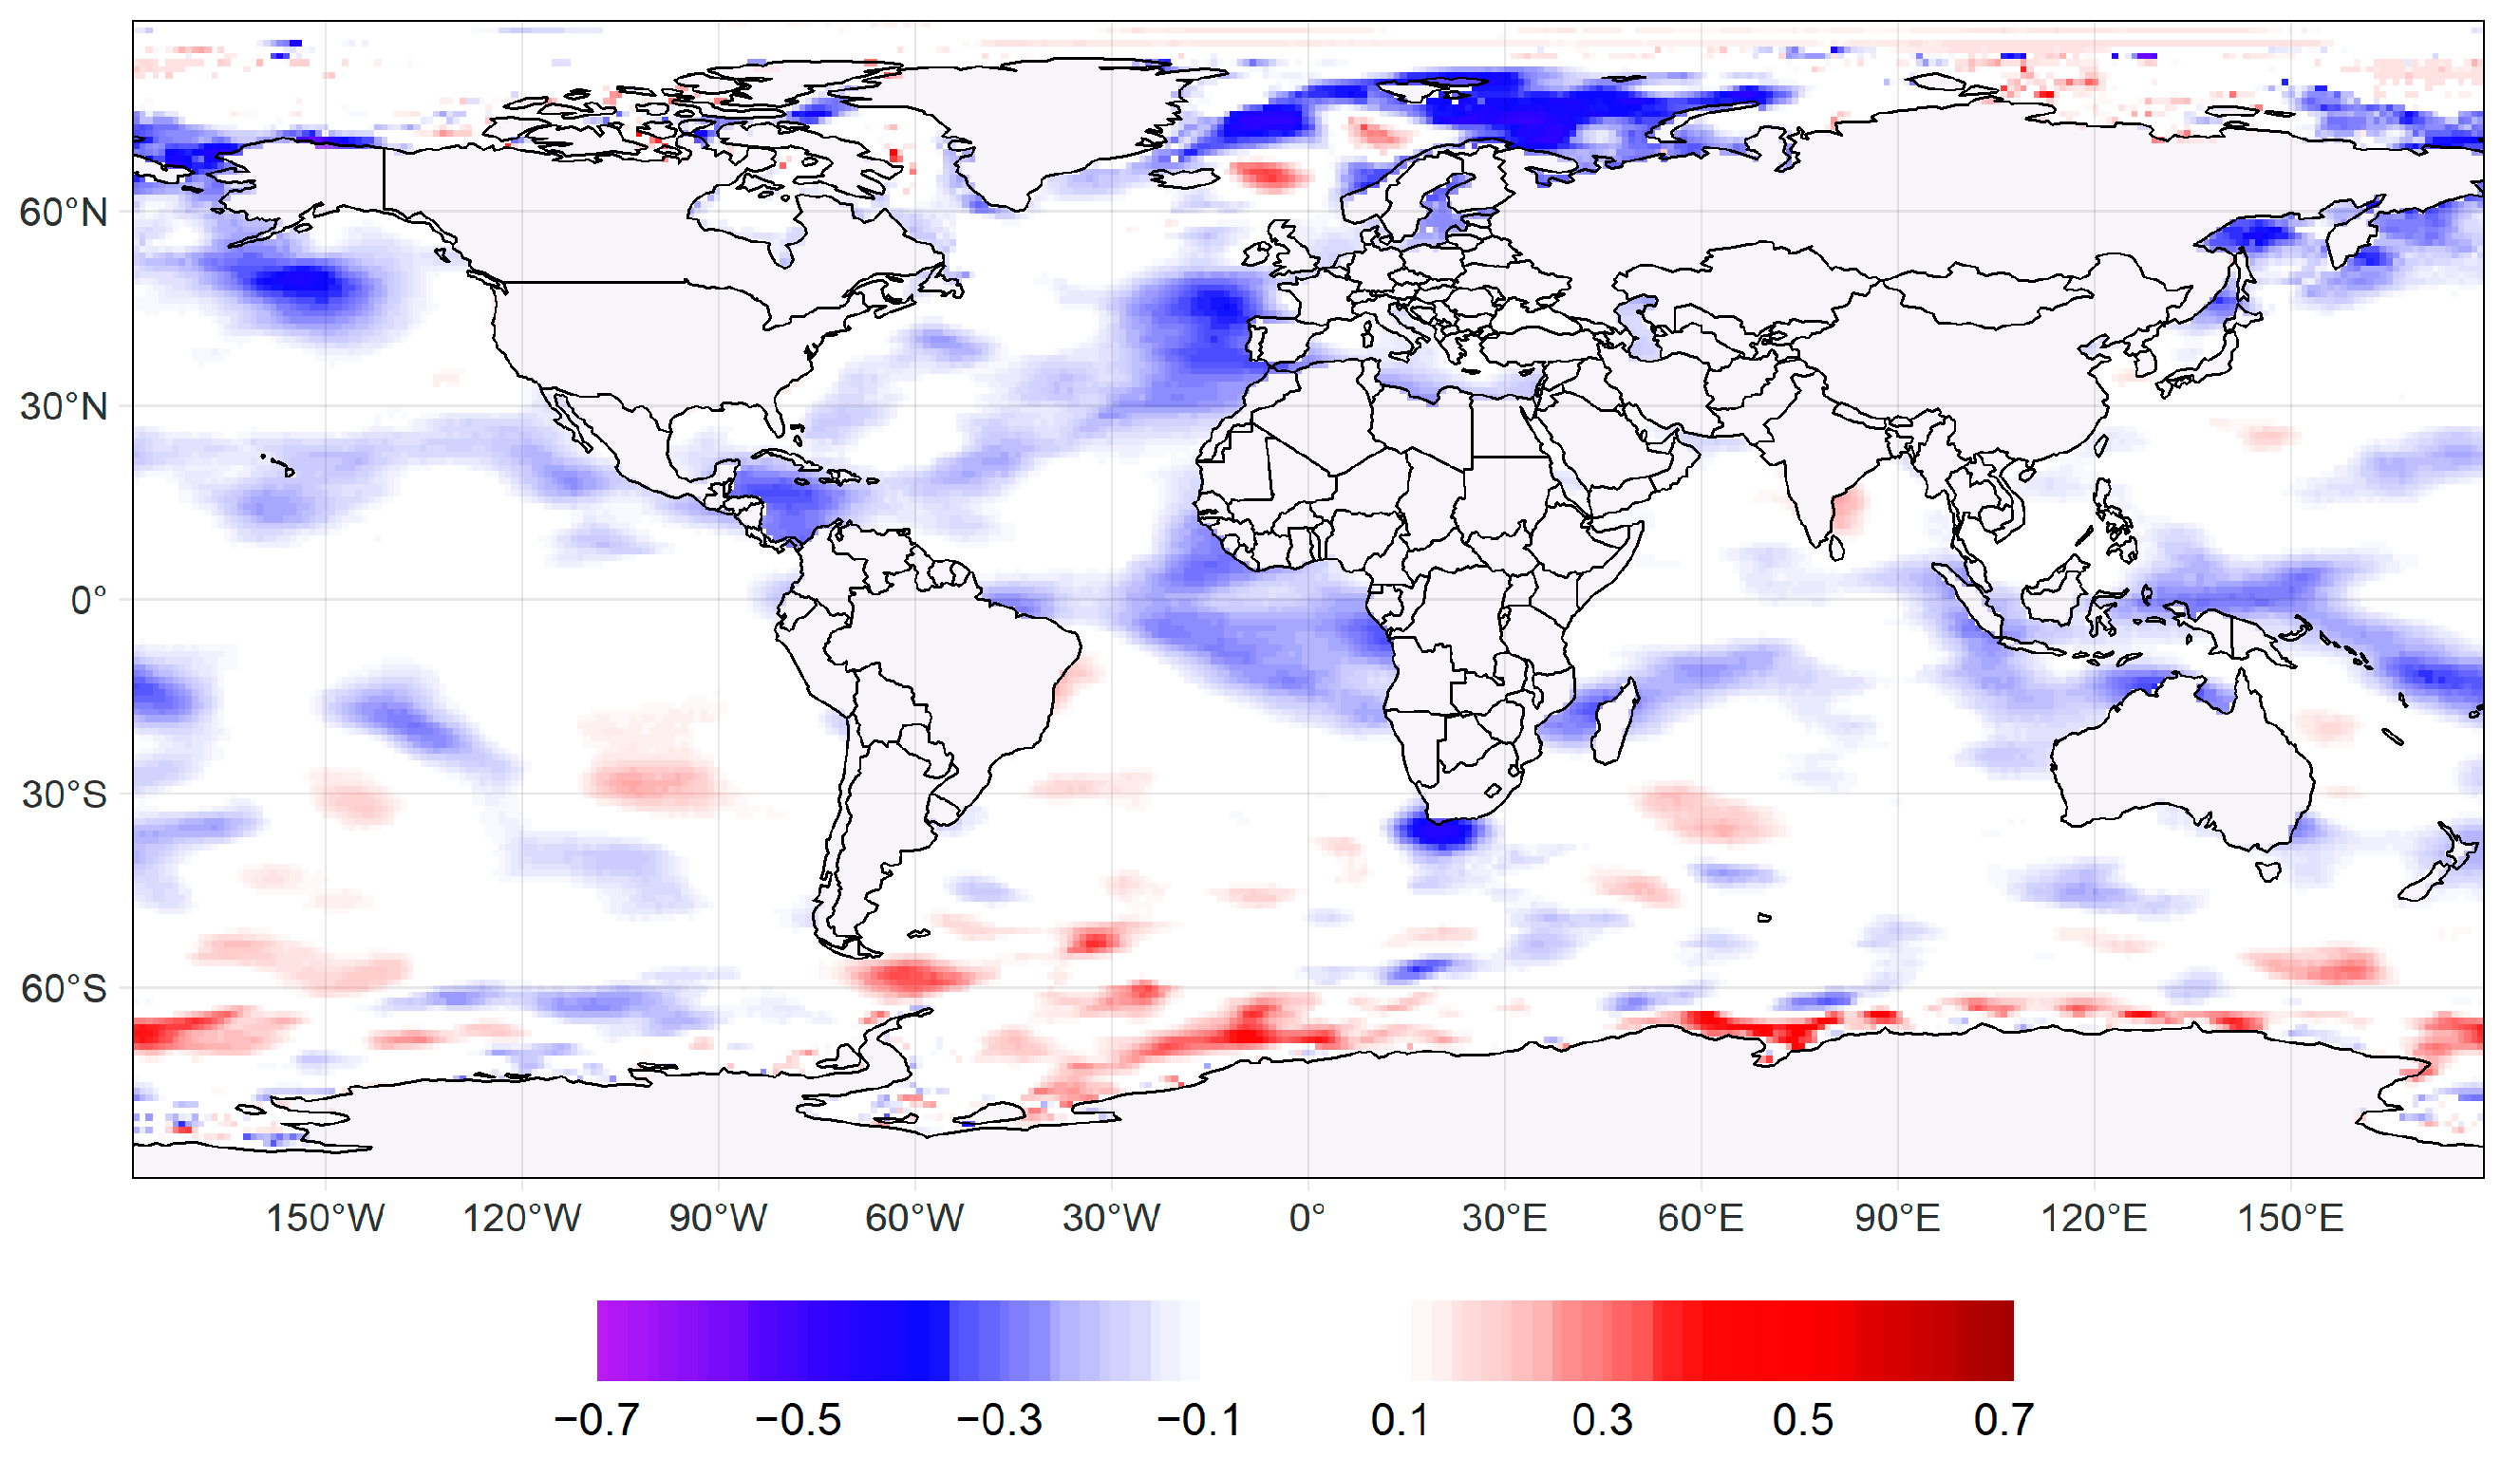
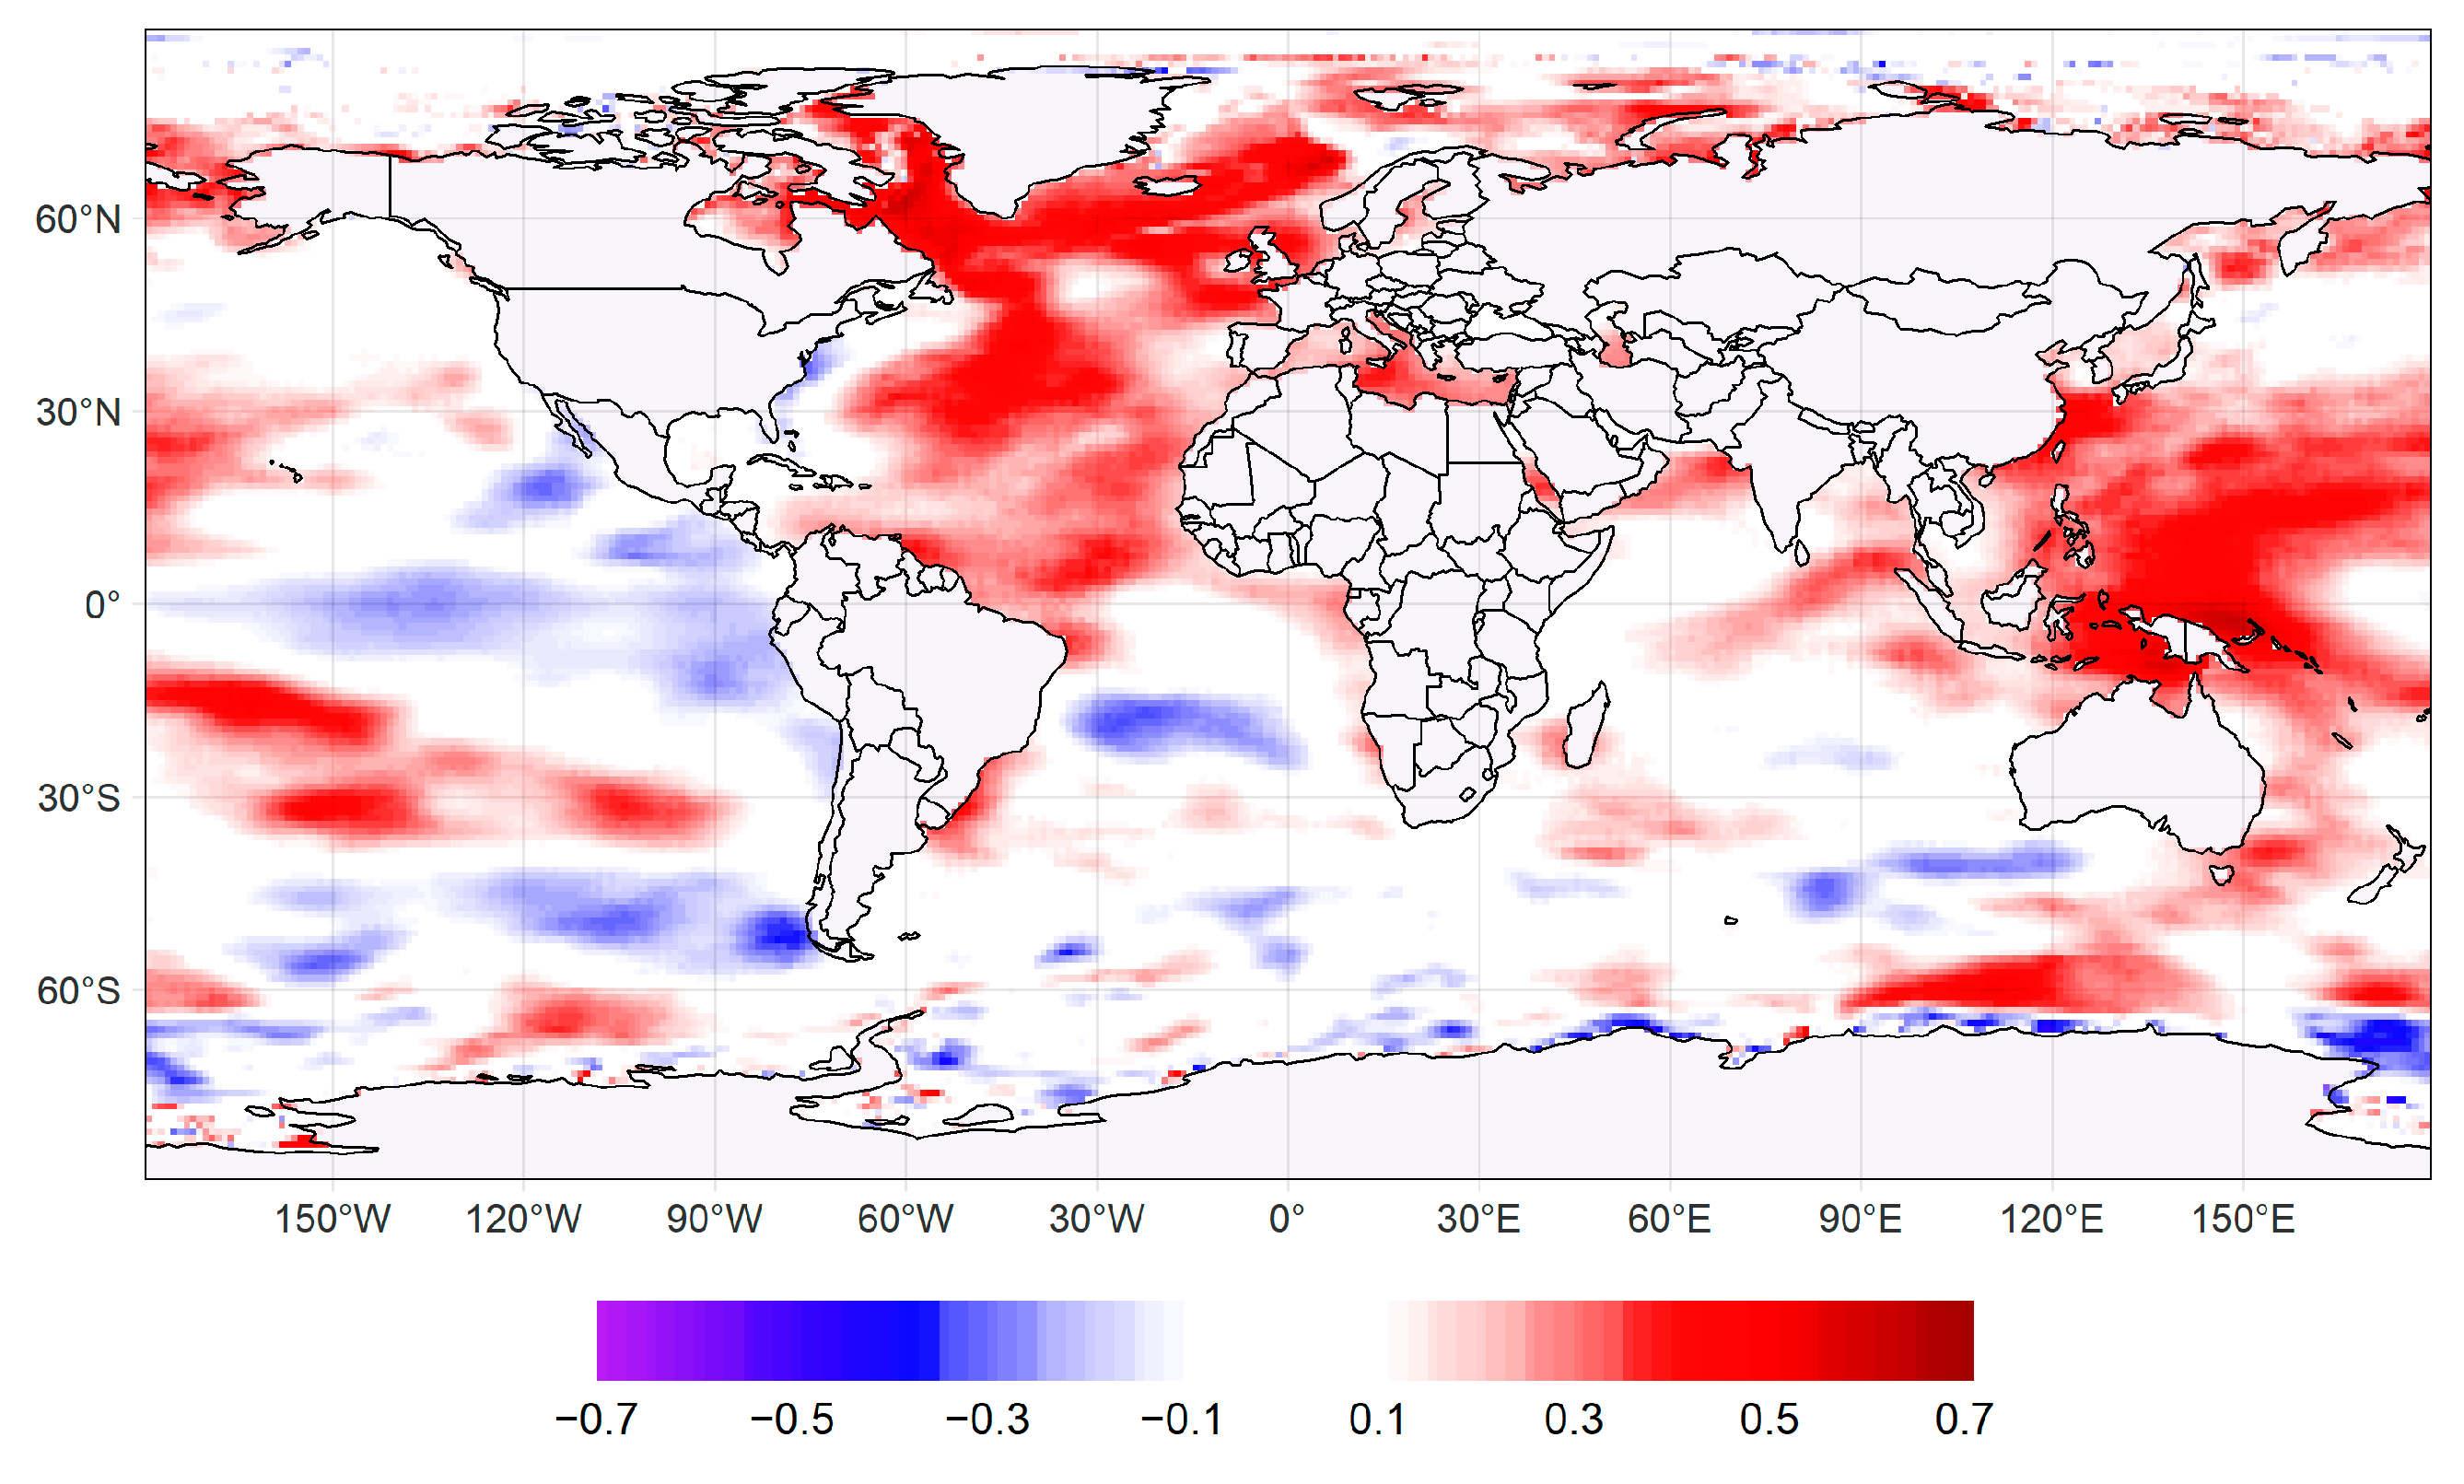
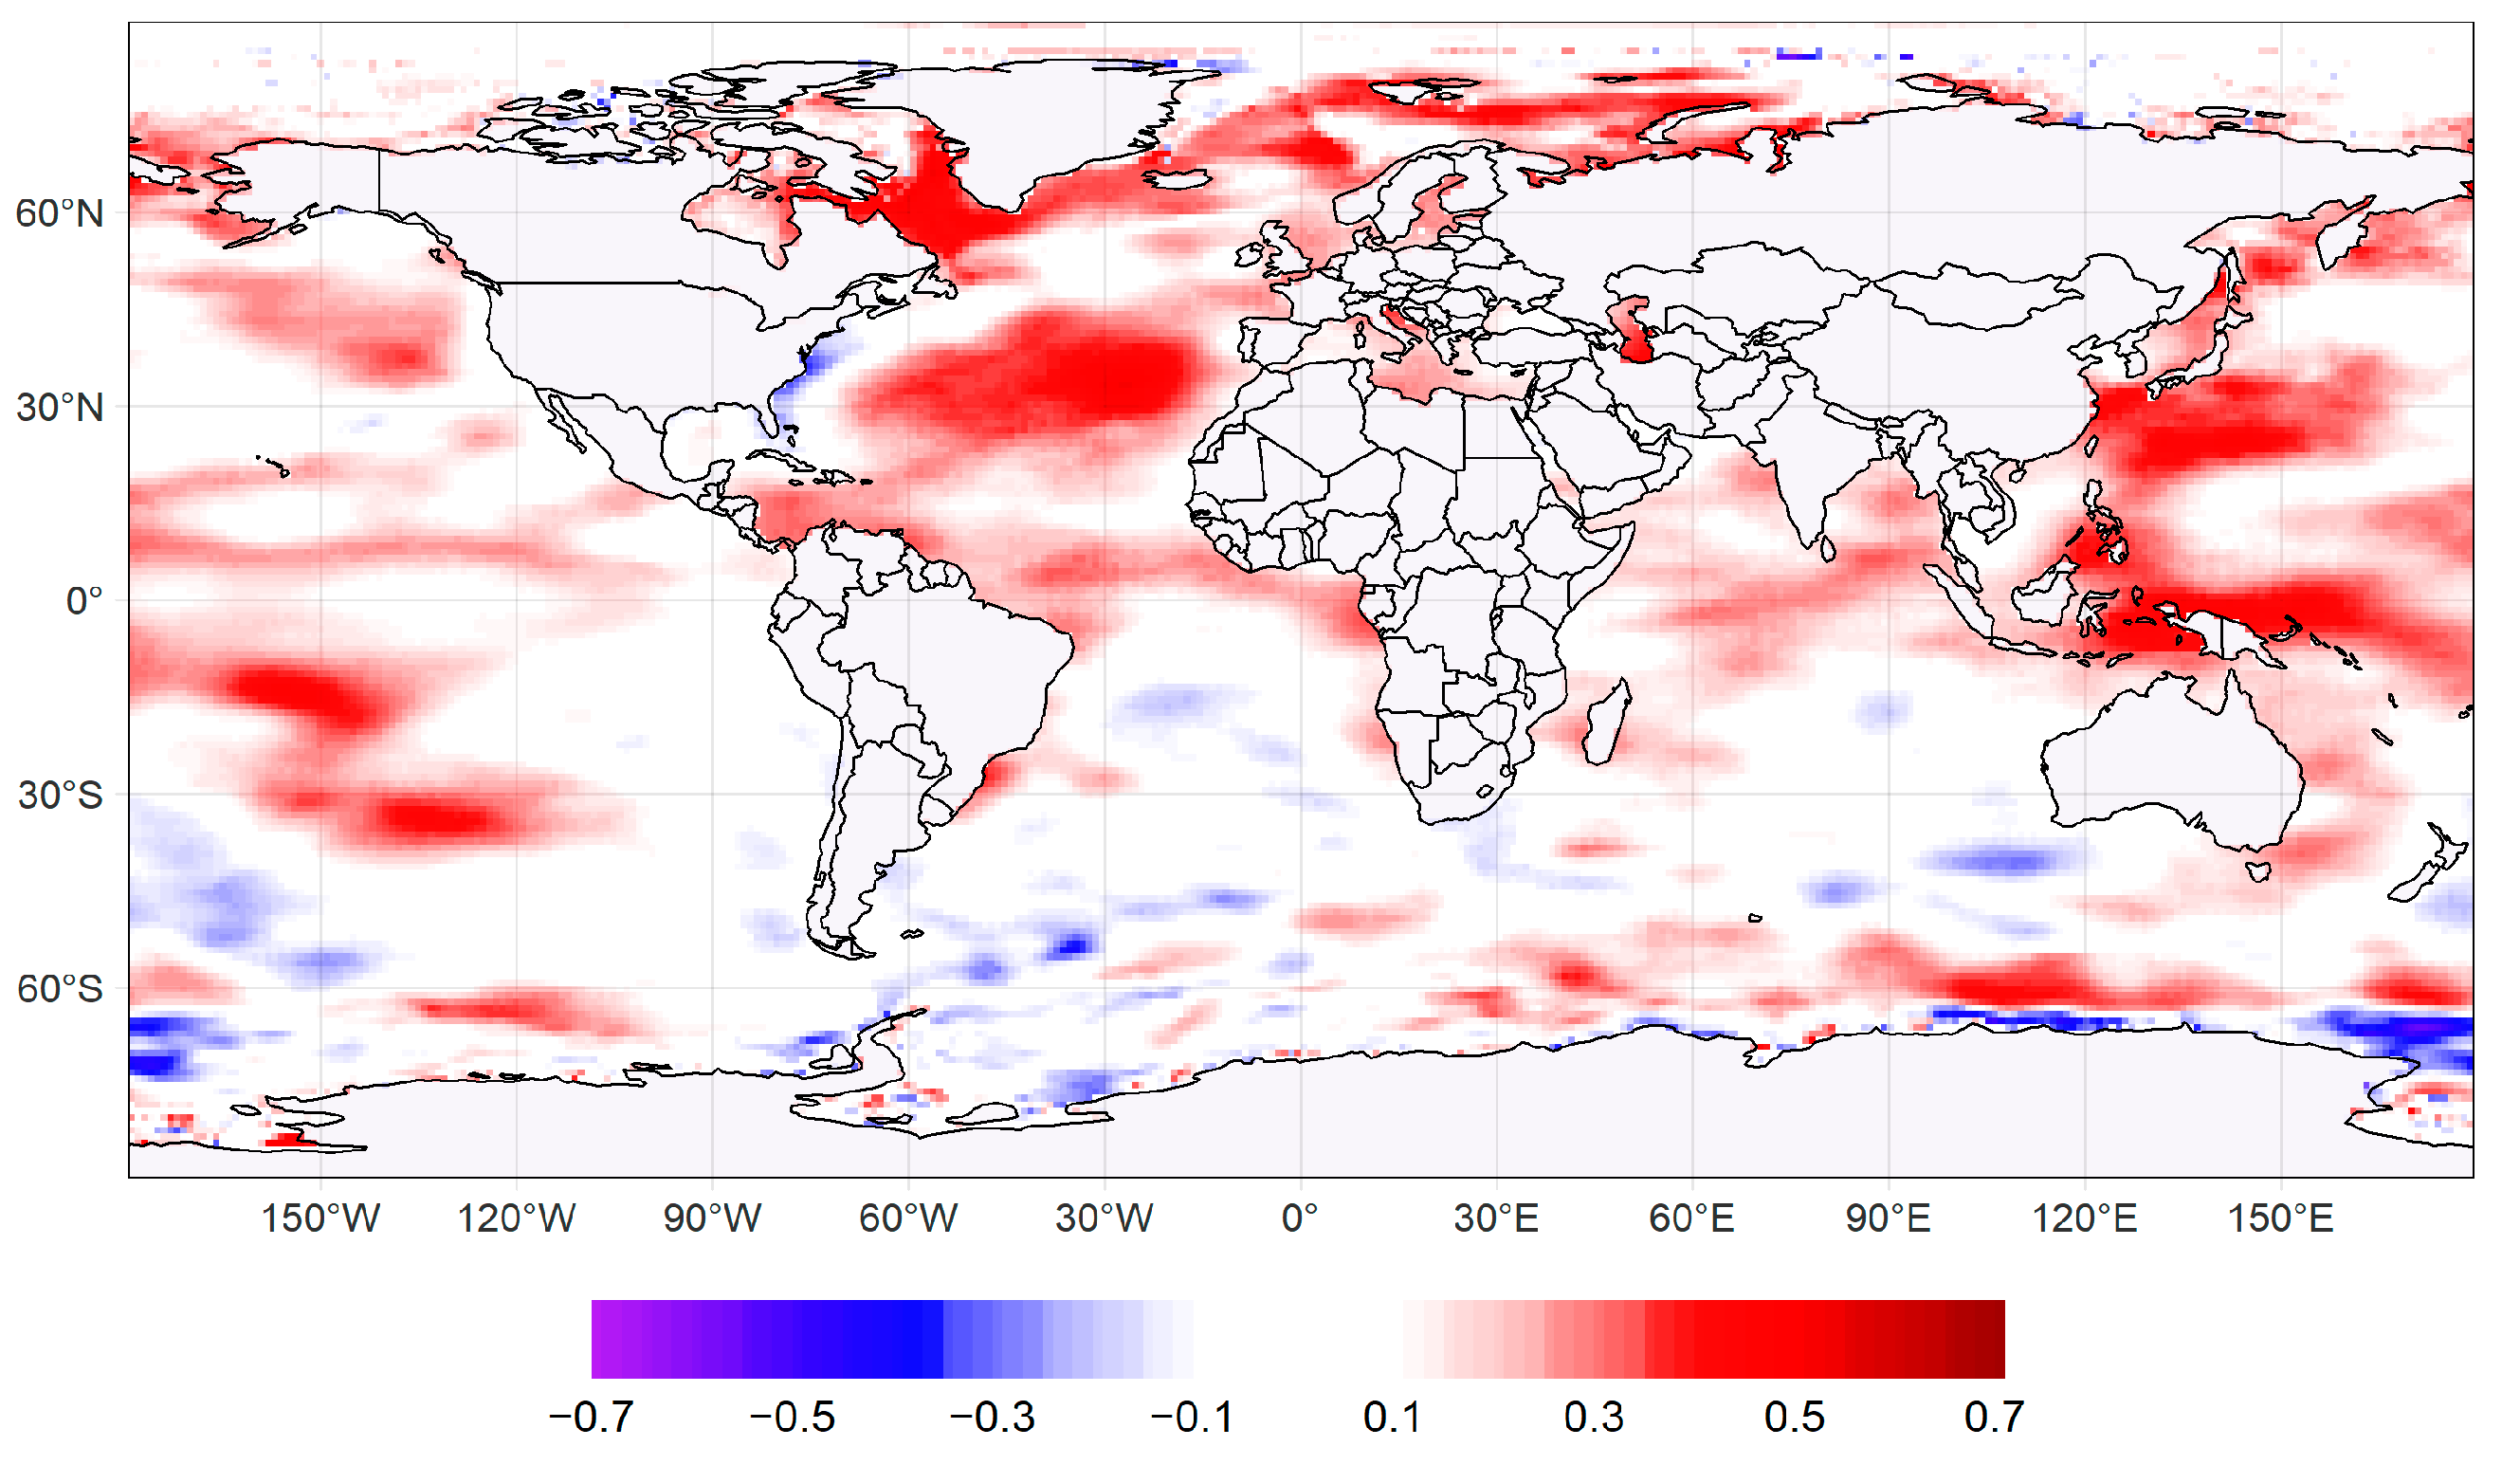
3.3. Influence of Global SST on TC/ETC Occurrence

The field of correlation between CT abundance and annual mean SST at grid points (1 × 1 resolution) (Figure 5) is characterized by the presence of 2 areas of elevated index values exceeding 0.4, and locally even 0.6, in the North Atlantic. The first of these fields extends roughly from the 40° N to 60° N parallel, reaching the waters of the Arctic Archipelago. The second field is located north of the equator, between Africa and South America. They are bisected by a belt of weak correlation, north of the Tropic of Cancer. A fairly high positive correlation also applies to the Pacific, especially the part in the eastern hemisphere. In the area of this ocean in the western hemisphere, however, wedges of positive correlation are noted between parallels 10 and 30° S (a strongly extended wedge, with values as high as 0.6) and 20 and 50° N (the wedge is more extended, with correlation values lower). In contrast, a strongly negative correlation is noted in the eastern Pacific along the equator (−0.6 and higher). This band of correlation extends towards the coasts of the Americas. In the Pacific, the correlation picture corresponds to conditions occurring during the cool phase of ENSO, which is associated with increased TC abundance (see previous subsection). A smaller area of strongly negative correlations is registered in the Atlantic between the coasts of South America and Africa, roughly along the Tropic of Capricorn. An inverse relationship between water temperature and the number of hurricanes also applies to the coastal waters of the eastern United States. In contrast, a band of negative correlations is evident at latitude 50° S, but not as significant as in the other cases discussed. In the Indian Ocean, the correlations are rather neutral, with isolated small areas of slightly positive and slightly negative correlations.
The high number of ETCs is strongly favored by the warmer, rather than the usual, waters of the North Atlantic. The correlation is positive from the northern parts of the ocean to areas near the Equator (Figure 6) and exceeds 0.6 between Greenland and the Labrador Peninsula. A clear correlation can also be seen with the temperature of the waters of the Arctic Archipelago and eastern Hudson Bay. Positive correlation coefficient values are also observed in the Pacific Ocean, especially in the intertropical belt in its western part. This relationship is well demonstrated in the waters surrounding the Malay Archipelago. There, the coefficients exceed 0.4, and locally even 0.6. A strong negative correlation (−0.6) is, in turn, recorded along the 50° S parallel to the west of South America. Moreover, a rather high negative correlation coefficient is recorded along the Florida Peninsula. Such an area of negative (but already lower) correlation still surrounds the North American coastline in a north–easterly direction. In contrast, areas of neutral correlation dominate in the Indian Ocean. It is worth noting, however, the transition zone between this ocean and the Pacific, where quite high correlation coefficients are again recorded.
In a further step, the correlation of sea surface temperature with the maximum annual TC range was examined (Figure 7). In the northern hemisphere, the correlation is negative in most areas. In the Atlantic, the coefficient reaches < −0.4 in the region west of the European continent. A negative correlation is also found between the temperature of the waters north of Europe, up to the extremity of the waters bordering Novaya Zemlya. A similar area can be seen in the Caribbean Sea and around Alaska. A significant area of positive correlation is noted around the southern part of South America, with a fairly high correlation coefficient within the Drake Strait. In addition to this area, patches of positive correlation with fairly irregular shapes are also observed in the southern parts of all oceans. The correlation generally increases towards the coast of Antarctica.
The correlation between the maximum northern extent of ETCs and sea surface temperature is positive in the North Atlantic Ocean (Figure 8). The coefficient values exceed 0.4 in most grids and are higher than 0.6 in some grids. The belt of very high correlation extends from the Labrador Sea to the Baffin Sea, between Baffin Island and western Greenland to the Norwegian Sea. The area of high correlation extends south to 30° N. Lower correlation values persist, even up to the Tropic of Capricorn. In the coastal part, the correlation values are lower, and off the east coast of the United States, the correlation is even negative, which indicates an inverse relationship between the expansion of extratropical cyclones and water temperature in this part of the World Ocean. However, high correlation values are found in the Pacific (as in the case of the correlation with the number of cyclones, in the eastern hemisphere), especially northeast of New Guinea. A negative correlation (starting at −0.2) is recorded in the Pacific in the western hemisphere along the Equator. On the edges of the area, already at higher latitudes, there are bands of positive correlation. However, a significant correlation, albeit more spatially limited (covering smaller areas of the North Atlantic and Western Pacific), is seen for the maximum extent of the eastern ETC (Figure 9).

4. Discussion and Conclusions

The results confirm that North Atlantic hurricanes occur most frequently in September and October. This agrees with theoretical considerations indicating that in September, the most favorable conditions for their formation occur. The strong solar radiation flux during the summer and early autumn warms the surface layer of the ocean (up to 50 meters) to at least 26.5 °C, the critical point above which hurricanes can form [46]. Hurricanes occur as early as August or even July. There have also been times when tropical cyclones have formed over the North Atlantic Ocean after the season, usually in November. The occurrence of TCs outside the September–October period is associated with the positive thermal anomaly of ocean waters over the intertropical waters during the summer and late autumn months. The abundance of ETCs analyzed in this study in the following months presents a similar pattern, as their formation is determined by the development and transformation of hurricanes [36,37]. The average annual number of TCs for the analyzed period was 6.22 per year, with a trend of 0.64 per decade (statistically significant for p < 0.05). These results support the hypothesis provided by previous studies [47,48] that in a warmer climate (i.e., later years), the abundance of TCs will be higher. The annual abundance for the 1970–2019 period is larger than for earlier periods; for example, in 1944–1995, it was 5.7 hurricanes per year [49]. The abundance is similar to the one from the 1966–2009 period (exactly 6.14/year) and the 1971–2020 period (6.4/year) found in other research [50,51]. Some of the previous studies, such as [10], indicate that the northern range of maximum TCs intensity is increasing, whereas we examined the maximum annual extent of TCs, which shows that it is decreasing. It can be assumed that this is related to the intensification of TCs and their rapid dissipation. It is also worth noting that in recent years, there has been a rapid increase in the number of ETCs (increase of more than 0.8 per decade; average annual number of more than 5), which can be a major threat in temperate latitudes. The average annual number of ETCs for the analyzed period is 5.6/year, which is slightly greater than the number (5.0/year) found for the period 1979–2005 in other research [39]. In contrast to the TCs, their maximum annual northern range is clearly increasing. The maximum eastern range was also studied, which is getting farther, too.
A positive SOI, which corresponds to the occurrence of the La Niña phenomenon, often co-occurs with a high TC abundance. This explains why a high negative correlation of eastern Pacific SST and TC abundance is also noted—during a positive ENSO phase, there is strong, intense upwelling in this part of the ocean. It must be assumed that both phenomena (the emergence of La Niña and the higher TC abundance) have a similar macrocirculatory basis. The development of the La Niña phenomenon itself is gradual and at times slow, and the SOI is a reflection of changes that were already taking place in the atmospheric pressure field much earlier. The course of the ENSO phase in the final months of the year is determined by, among other things, their weakening or strengthening, which can be initiated even a few months earlier. Therefore, the phenomena determining the La Niña phase at the end of the year appear to influence both hurricane abundance and the reversal of typical atmospheric circulation patterns in the Pacific, where atmospheric pressure measurements are made for the SOI, resulting in the existence of a higher correlation in the last months of the year. Furthermore, if a particular circulation phase occurs in September, for example, it will usually persist until the end of the year (and even be amplified), which also explains the correlation coefficients obtained. Similar results have been found in other studies on the relationship between ENSO and cyclone activity [24,25,52,53]. It has also been pointed out that a reverse phase, i.e., El Niño in June, may impact more extratropical cyclone activity in September–October. During this phase, the trade winds weaken, and the resulting hurricanes do not move as much to the west, reducing the likelihood of rapid landfall (in the Caribbean region) and whole cyclone extinction [54]. Fewer hurricanes are then formed, but they show a greater likelihood of turning into an extratropical cyclone. Weaker correlation coefficients are observed between the abundance of TCs and the NAO Index. Moreover, the correlation with the number of ETCs is even lower. Negative values are observed in two spring months (March and May). A negative NAO phase is usually associated with a slightly warmer Atlantic in the tropics, but some areas farther north may be cooler, which could explain the uncertain relationship. In addition, NAO is a periodic circulation—its effects are best seen in winter and spring [40]—in months when TCs are unlikely to be observed. The correlation with the negative NAO phase has been seen in other research too [26,55]. The strongest correlation can be seen between the AMO index and the number of TCs and ETCs. During the positive phase of this oscillation, the North Atlantic becomes much warmer [56], which is clearly conducive to the birth of new hurricanes. High correlation coefficients have been found also in other research [27,28,57]. The correlation is also significant between the AMO and the northern migration of ETCs, confirming the importance of warmer ocean waters for the expansiveness of these structures. The highest correlation coefficients are observed in August and September, i.e., at a time similar to the highest TC and ETC activity in the year. AMO turns out to be a good predictor of the abundance of both structures, because the correlation—although lower—is significant in each month of the year, unlike with SOI.
There are moderate to strong spatial correlations between ocean water temperatures and the abundance of hurricanes and extratropical cyclones. This may be due to climate change driving an increase in the mean sea surface temperature. This would explain the increasing trends in TC and ETC abundance over the analyzed multi-year period. The change in SST is stronger at higher latitudes, which could explain the stronger trend in the change in the abundance of extratropical cyclones [58]. In the case of an increase in the maximum annual extent of hurricanes, an inverse relationship is observed. This may be due to a strong intensification at lower latitudes and early landfall, or to a faster transformation into an extratropical cyclone due to a rapid loss of energy [59,60]. Extratropical cyclones, on the other hand, are characterized by an increasing northward and eastward migration, which has been shown to have a strong correlation with increasing SST at high latitudes. Such cyclones, moving far to the northeast, contribute to the occurrence of anomalous weather events in temperate latitudes [61], the increased frequency of which has already been reported in earlier studies [62]. It is important to note that some of the correlations observed in the maps may be coincidental (especially correlation fields with a small area and high degree of isolation) or lack a good theoretical explanation.
We presented, in a synthetic way, some factors that are responsible for the variability of selected parameters associated with tropical and extratropical cyclones in the Atlantic. This is a preliminary study, in which we analyze the available data and compare it to existing research results. It is significant, because it combines both direct and indirect causes of the variable abundance and expansiveness of cyclones in the Atlantic. In addition to the systematizing function of the article, it also contains its own analysis of various data sets in the years that the authors considered significant in terms of the progress of climate change. To this factor, we added an analysis of the macrocirculation situation, thanks to which we received comprehensive statistics on the development of these structures.
The study of tropical and extratropical cyclones is important because of the ecological and socioeconomic threats these structures pose. They occur almost every year, with the most negative impact on the Caribbean region and the North American continent. Extratropical cyclones are increasingly migrating towards Europe, leading to weather anomalies in the region. Cyclones are subject to natural temporal oscillations, which is to some extent connected with the same mechanisms that lead to changes in atmospheric circulation, as described by ENSO and NAO. Their activity is also conditioned by rising ocean temperatures as a result of modern climate change. In the case of extratropical cyclones, there is an increase in both the abundance and the maximum northward extent. This study aims to allow a better understanding of some of the mechanisms determining cyclone activity in order to be able to predict their behavior more efficiently—both that caused by macrocirculation and by thermodynamic factors. However, apart from the SST and atmospheric circulation analyzed in this paper, there are many other factors influencing the occurrence, strength, lifespan, and geographical outreach of tropical and extratropical cyclones, which should be considered in further research.

Author Contributions

Conceptualization, A.S. and E.B.; methodology, A.S. and E.B.; software, A.S.; validation, A.S. and B.C.; formal analysis, A.S.; investigation, A.S.; resources, A.S.; data curation, A.S.; writing—original draft preparation, A.S.; writing—review and editing, E.B. and B.C.; visualization, A.S.; supervision, E.B.; project administration, A.S. All authors have read and agreed to the published version of the manuscript.

Funding

This research received no external funding.

Institutional Review Board Statement

Not applicable.

Informed Consent Statement

Not applicable.

Data Availability Statement

No new data were created or analyzed in this study. Data sharing is not applicable to this article.

Conflicts of Interest

The authors declare no conflict of interest.

References

  1. Lim, Y.-K.; Schubert, S.D.; Kovach, R.; Molod, A.M.; Pawson, S. The roles of climate change and climate variability in the 2017 Atlantic hurricane season. Sci. Rep. 2018, 8, 16172. [Google Scholar] [CrossRef]
  2. Mann, M.E.; Emanuel, K.A. Atlantic hurricane trends linked to climate change. Eos Trans. Am. Geophys. Union 2006, 87, 233–241. [Google Scholar] [CrossRef]
  3. Mudd, L.; Wang, Y.; Letchford, C.; Rosowsky, D. Assessing climate change impact on the US East Coast hurricane hazard: Temperature, frequency, and track. Nat. Hazards Rev. 2014, 15, 04014001. [Google Scholar] [CrossRef]
  4. Strauss, B.H.; Orton, P.M.; Bittermann, K.; Buchanan, M.K.; Gilford, D.M.; Kopp, R.E.; Kulp, S.; Massey, C.; de Moel, H.; Vinogradov, S. Economic damages from Hurricane Sandy attributable to sea level rise caused by anthropogenic climate change. Nat. Commun. 2021, 12, 1–9. [Google Scholar]
  5. Frame, D.J.; Wehner, M.F.; Noy, I.; Rosier, S.M. The economic costs of Hurricane Harvey attributable to climate change. Clim. Change 2020, 160, 271–281. [Google Scholar] [CrossRef]
  6. Trenberth, K.E.; Cheng, L.; Jacobs, P.; Zhang, Y.; Fasullo, J. Hurricane Harvey links to ocean heat content and climate change adaptation. Earth’s Future 2018, 6, 730–744. [Google Scholar] [CrossRef]
  7. Risser, M.D.; Wehner, M.F. Attributable human-induced changes in the likelihood and magnitude of the observed extreme precipitation during Hurricane Harvey. Geophys. Res. Lett. 2017, 44, 12–457. [Google Scholar] [CrossRef]
  8. Keellings, D.; Hernández Ayala, J.J. Extreme rainfall associated with Hurricane Maria over Puerto Rico and its connections to climate variability and change. Geophys. Res. Lett. 2019, 46, 2964–2973. [Google Scholar] [CrossRef]
  9. Reed, K.A.; Stansfield, A.M.; Wehner, M.F.; Zarzycki, C.M. Forecasted attribution of the human influence on Hurricane Florence. Sci. Adv. 2020, 6, eaaw9253. [Google Scholar] [CrossRef]
  10. Kossin, J.P.; Emanuel, K.A.; Vecchi, G.A. The poleward migration of the location of tropical cyclone maximum intensity. Nature 2014, 509, 349–352. [Google Scholar] [CrossRef]
  11. Bender, M.A.; Knutson, T.R.; Tuleya, R.E.; Sirutis, J.J.; Vecchi, G.A.; Garner, S.T.; Held, I.M. Modeled impact of anthropogenic warming on the frequency of intense Atlantic hurricanes. Science 2010, 327, 454–458. [Google Scholar] [CrossRef] [PubMed] [Green Version]
  12. Villarini, G.; Vecchi, G.A. Projected increases in North Atlantic tropical cyclone intensity from CMIP5 models. J. Clim. 2013, 26, 3231–3240. [Google Scholar] [CrossRef]
  13. Zhao, M.; Held, I.M.; Lin, S.-J.; Vecchi, G.A. Simulations of global hurricane climatology, interannual variability, and response to global warming using a 50-km resolution GCM. J. Clim. 2009, 22, 6653–6678. [Google Scholar] [CrossRef]
  14. Vecchi, G.A.; Delworth, T.L.; Murakami, H.; Underwood, S.D.; Wittenberg, A.T.; Zeng, F.; Zhang, W.; Baldwin, J.W.; Bhatia, K.T.; Cooke, W. Tropical cyclone sensitivities to CO2 doubling: Roles of atmospheric resolution, synoptic variability and background climate changes. Clim. Dyn. 2019, 53, 5999–6033. [Google Scholar] [CrossRef]
  15. Emanuel, K.A. Downscaling CMIP5 climate models shows increased tropical cyclone activity over the 21st century. Proc. Natl. Acad. Sci. 2013, 110, 12219–12224. [Google Scholar] [CrossRef] [PubMed]
  16. Dinan, T. Projected increases in hurricane damage in the United States: The role of climate change and coastal development. Ecol. Econ. 2017, 138, 186–198. [Google Scholar] [CrossRef]
  17. Marsooli, R.; Lin, N.; Emanuel, K.; Feng, K. Climate change exacerbates hurricane flood hazards along US Atlantic and Gulf Coasts in spatially varying patterns. Nat. Commun. 2019, 10, 3785. [Google Scholar] [CrossRef]
  18. Sobel, A.H.; Camargo, S.J.; Hall, T.M.; Lee, C.-Y.; Tippett, M.K.; Wing, A.A. Human influence on tropical cyclone intensity. Science 2016, 353, 242–246. [Google Scholar] [CrossRef] [PubMed]
  19. Gray, W.M. Global view of the origin of tropical disturbances and storms. Mon. Weather Rev. 1968, 96, 669–700. [Google Scholar] [CrossRef]
  20. Bister, M.; Emanuel, K.A. Low frequency variability of tropical cyclone potential intensity 1. Interannual to interdecadal variability. J. Geophys. Res. Atmos. 2002, 107, ACL-26. [Google Scholar] [CrossRef]
  21. Garner, S. The relationship between hurricane potential intensity and CAPE. J. Atmos. Sci. 2015, 72, 141–163. [Google Scholar] [CrossRef]
  22. Camp, J.P.; Montgomery, M.T. Hurricane maximum intensity: Past and present. Mon. Weather Rev. 2001, 129, 1704–1717. [Google Scholar] [CrossRef]
  23. Wang, S.-Y.; Gillies, R.R. Observed change in Sahel rainfall, circulations, African easterly waves, and Atlantic hurricanes since 1979. Int. J. Geophys. 2011, 2011, 259529. [Google Scholar] [CrossRef]
  24. Saunders, M.A.; Chandler, R.E.; Merchant, C.J.; Roberts, F.P. Atlantic hurricanes and NW Pacific typhoons: ENSO spatial impacts on occurrence and landfall. Geophys. Res. Lett. 2000, 27, 1147–1150. [Google Scholar] [CrossRef]
  25. Smith, S.R.; Brolley, J.; O’Brien, J.J.; Tartaglione, C.A. ENSO’s impact on regional US hurricane activity. J. Clim. 2007, 20, 1404–1414. [Google Scholar] [CrossRef]
  26. Elsner, J.B.; Jagger, T.H. Prediction models for annual US hurricane counts. J. Clim. 2006, 19, 2935–2952. [Google Scholar] [CrossRef]
  27. Vimont, D.J.; Kossin, J.P. The Atlantic meridional mode and hurricane activity. Geophys. Res. Lett. 2007, 34, L07709. [Google Scholar] [CrossRef]
  28. Klotzbach, P.; Gray, W.; Fogarty, C. Active Atlantic hurricane era at its end? Nat. Geosci. 2015, 8, 737–738. [Google Scholar] [CrossRef]
  29. Curtis, S. The Atlantic multidecadal oscillation and extreme daily precipitation over the US and Mexico during the hurricane season. Clim. Dyn. 2008, 30, 343–351. [Google Scholar] [CrossRef]
  30. Bjerknes, J. Life cycle of cyclones and the polar front theory of atmospheric circulation. Geophys. Publik. 1922, 3, 1–18. [Google Scholar]
  31. Charney, J.G.; Eliassen, A. On the growth of the hurricane depression. J. Atmos. Sci. 1964, 21, 68–75. [Google Scholar] [CrossRef]
  32. Jones, S.C.; Harr, P.A.; Abraham, J.; Bosart, L.F.; Bowyer, P.J.; Evans, J.L.; Hanley, D.E.; Hanstrum, B.N.; Hart, R.E.; Lalaurette, F. The extratropical transition of tropical cyclones: Forecast challenges, current understanding, and future directions. Weather Forecast. 2003, 18, 1052–1092. [Google Scholar] [CrossRef]
  33. Ranson, M.; Kousky, C.; Ruth, M.; Jantarasami, L.; Crimmins, A.; Tarquinio, L. Tropical and extratropical cyclone damages under climate change. Clim. Change 2014, 127, 227–241. [Google Scholar] [CrossRef]
  34. Catto, J.L. Extratropical cyclone classification and its use in climate studies. Rev. Geophys. 2016, 54, 486–520. [Google Scholar] [CrossRef]
  35. Tamarin, T.; Kaspi, Y. The poleward motion of extratropical cyclones from a potential vorticity tendency analysis. J. Atmos. Sci. 2016, 73, 1687–1707. [Google Scholar] [CrossRef]
  36. Evans, C.; Wood, K.M.; Aberson, S.D.; Archambault, H.M.; Milrad, S.M.; Bosart, L.F.; Corbosiero, K.L.; Davis, C.A.; Pinto, J.R.D.; Doyle, J. The extratropical transition of tropical cyclones. Part I: Cyclone evolution and direct impacts. Mon. Weather Rev. 2017, 145, 4317–4344. [Google Scholar] [CrossRef]
  37. Kofron, D.E.; Ritchie, E.A.; Tyo, J.S. Determination of a consistent time for the extratropical transition of tropical cyclones. Part I: Examination of existing methods for finding “ET time”. Mon. Weather Rev. 2010, 138, 4328–4343. [Google Scholar] [CrossRef]
  38. Ritchie, E.A.; Elsberry, R.L. Simulations of the extratropical transition of tropical cyclones: Phasing between the upper-level trough and tropical cyclones. Mon. Weather Rev. 2007, 135, 862–876. [Google Scholar] [CrossRef]
  39. Liu, M.; Vecchi, G.A.; Smith, J.A.; Murakami, H. The present-day simulation and twenty-first-century projection of the climatology of extratropical transition in the North Atlantic. J. Clim. 2017, 30, 2739–2756. [Google Scholar] [CrossRef]
  40. Hurrell, J.W.; Kushnir, Y.; Ottersen, G.; Visbeck, M. An overview of the North Atlantic oscillation. Geophys. Monogr. -Am. Geophys. Union 2003, 134, 1–36. [Google Scholar]
  41. Trenberth, K.E.; Shea, D.J. Atlantic hurricanes and natural variability in 2005. Geophys. Res. Lett. 2006, 33, L12704. [Google Scholar] [CrossRef]
  42. Ishii, M.; Shouji, A.; Sugimoto, S.; Matsumoto, T. Objective analyses of sea-surface temperature and marine meteorological variables for the 20th century using ICOADS and the Kobe collection. Int. J. Climatol. A J. R. Meteorol. Soc. 2005, 25, 865–879. [Google Scholar] [CrossRef]
  43. Vecchi, G.A.; Landsea, C.; Zhang, W.; Villarini, G.; Knutson, T. Changes in Atlantic major hurricane frequency since the late-19th century. Nat. Commun. 2021, 12, 4054. [Google Scholar] [CrossRef] [PubMed]
  44. Chang, E.K.M.; Guo, Y. Is the number of North Atlantic tropical cyclones significantly underestimated prior to the availability of satellite observations? Geophys. Res. Lett. 2007, 34, L14801. [Google Scholar] [CrossRef]
  45. Chan, D.; Vecchi, G.A.; Yang, W.; Huybers, P. Improved simulation of 19th-and 20th-century North Atlantic hurricane frequency after correcting historical sea surface temperatures. Sci. Adv. 2021, 7, eabg6931. [Google Scholar] [CrossRef]
  46. Palmen, E. On the formation and structure of tropical hurricanes. Geophysica 1948, 3, 26–38. [Google Scholar]
  47. Goldenberg, S.B.; Landsea, C.W.; Mestas-Nuñez, A.M.; Gray, W.M. The recent increase in Atlantic hurricane activity: Causes and implications. Science 2001, 293, 474–479. [Google Scholar] [CrossRef]
  48. Loehle, C.; Staehling, E. Hurricane trend detection. Nat. Hazards 2020, 104, 1345–1357. [Google Scholar] [CrossRef]
  49. Landsea, C.W.; Nicholls, N.; Gray, W.M.; Avila, L.A. Downward trends in the frequency of intense at Atlantic Hurricanes during the past five decades. Geophys. Res. Lett. 1996, 23, 1697–1700. [Google Scholar] [CrossRef]
  50. Vecchi, G.A.; Zhao, M.; Wang, H.; Villarini, G.; Rosati, A.; Kumar, A.; Held, I.M.; Gudgel, R. Statistical–dynamical predictions of seasonal North Atlantic hurricane activity. Mon. Weather Rev. 2011, 139, 1070–1082. [Google Scholar] [CrossRef]
  51. Schreck III, C.J.; Klotzbach, P.J.; Bell, M.M. Optimal climate normals for North Atlantic hurricane activity. Geophys. Res. Lett. 2021, 48, e2021GL092864. [Google Scholar] [CrossRef]
  52. Elsner, J.B.; Bossak, B.H.; Niu, X. Secular changes to the ENSO-US hurricane relationship. Geophys. Res. Lett. 2001, 28, 4123–4126. [Google Scholar] [CrossRef]
  53. Tang, B.H.; Neelin, J.D. ENSO influence on Atlantic hurricanes via tropospheric warming. Geophys. Res. Lett. 2004, 31, L24204. [Google Scholar] [CrossRef]
  54. Tartaglione, C.A.; Smith, S.R.; O’Brien, J.J. ENSO impact on hurricane landfall probabilities for the Caribbean. J. Clim. 2003, 16, 2925–2931. [Google Scholar] [CrossRef]
  55. Elsner, J.B.; Jagger, T.; Niu, X. Changes in the rates of North Atlantic major hurricane activity during the 20th century. Geophys. Res. Lett. 2000, 27, 1743–1746. [Google Scholar] [CrossRef]
  56. Dijkstra, H.A.; te Raa, L.; Schmeits, M.; Gerrits, J. On the physics of the Atlantic multidecadal oscillation. Ocean Dyn. 2006, 56, 36–50. [Google Scholar] [CrossRef]
  57. Knight, J.R.; Folland, C.K.; Scaife, A.A. Climate impacts of the Atlantic multidecadal oscillation. Geophys. Res. Lett. 2006, 33, L17706. [Google Scholar] [CrossRef]
  58. Serreze, M.C.; Barry, R.G. Processes and impacts of Arctic amplification: A research synthesis. Glob. Planet. Change 2011, 77, 85–96. [Google Scholar] [CrossRef]
  59. Kaplan, J.; DeMaria, M. Large-scale characteristics of rapidly intensifying tropical cyclones in the North Atlantic basin. Weather Forecast. 2003, 18, 1093–1108. [Google Scholar] [CrossRef]
  60. Elsner, J.B.; Kossin, J.P.; Jagger, T.H. The increasing intensity of the strongest tropical cyclones. Nature 2008, 455, 92–95. [Google Scholar] [CrossRef]
  61. Browning, K.A. The sting at the end of the tail: Damaging winds associated with extratropical cyclones. Q. J. R. Meteorol. Soc. A J. Atmos. Sci. Appl. Meteorol. Phys. Oceanogr. 2004, 130, 375–399. [Google Scholar] [CrossRef]
  62. Cohen, J.; Screen, J.A.; Furtado, J.C.; Barlow, M.; Whittleston, D.; Coumou, D.; Francis, J.; Dethloff, K.; Entekhabi, D.; Overland, J. Recent Arctic amplification and extreme mid-latitude weather. Nat. Geosci. 2014, 7, 627–637. [Google Scholar] [CrossRef] [Green Version]
Figure 1. Total monthly abundance of hurricanes (TCs) and extratropical cyclones (ETCs) in the years 1970–2019.
Atmosphere 14 00312 g001
Figure 2. Total annual abundance of TCs (top graph) and ETCs (bottom graph) and proportion of their occurrence by month (1970–2019).
Atmosphere 14 00312 g002
Figure 3. Multiannual changes in the maximum latitude reached in a given year by a TC (top graph) and an ETC (bottom graph) of the furthest northern extent in the North Atlantic for the 1970–2019 period, with months taken into account.
Atmosphere 14 00312 g003
Figure 4. Multiannual changes in the maximum longitude reached in a given year by the easternmost ETC in the North Atlantic over the 1970–2019 period, with months taken into account.
Atmosphere 14 00312 g004
Figure 5. Spatial distribution of the correlation coefficient between the annual number of TCs and the annual average SST.
Atmosphere 14 00312 g005
Figure 6. Spatial correlation between the annual number of ETCs and the annual mean SST.
Atmosphere 14 00312 g006
Figure 7. Spatial correlation between maximum annual northern TC extent and annual mean SST.
Atmosphere 14 00312 g007
Figure 8. Spatial correlation between the annual maximum northern extent of ETCs and the annual mean SST.
Atmosphere 14 00312 g008
Figure 9. Spatial correlation between the annual maximum eastern extent of ETCs and the annual mean SST.
Atmosphere 14 00312 g009
Table 1. Correlation coefficients between the annual number and maximum annual extent of TC and ETC and the SOI, NAO and AMO index values. In bold, statistically significant results at the significance level α < 0.05 are shown.
VariableIndexCorrelation Coefficient
Number of TCSOI0.31
NAO
AMO
−0.34
0.65
Extent (northern) of TCSOI0.18
NAO
AMO
−0.17
−0.14
Number of ETCSOI0.10
NAO
AMO
−0.27
0.60
Extent (northern) of ETCSOI0.18
NAO
AMO
0.10
0.46
Table 2. Correlation coefficients between monthly SOI and NAO indices and TC or ETC abundance in September–October. In bold, statistically significant results at the significance level of α < 0.05 (one asterisk), α < 0.01 (two asterisks), α < 0.001 (three asterisks) are shown.
Month of Index MeasurementIndexCorrelation with TCCorrelation with ETC
JanuarySOI0.11−0.06
NAO
AMO
−0.07
0.42 **
−0.13
0.30 *
FebruarySOI−0.20−0.27 *
NAO
AMO
−0.04
0.50 ***
0.01
0.36 **
MarchSOI0.140.00
NAO
AMO
−0.35 **
0.51 ***
−0.19
0.35 **
AprilSOI0.06−0.09
NAO
AMO
−0.08
0.57 ***
−0.09
0.37 **
MaySOI0.13−0.13
NAO
AMO
−0.30 *
0.56 ***
−0.36 **
0.38 **
JuneSOI−0.05−0.31 *
NAO
AMO
−0.11
0.63 ***
−0.11
0.42 **
JulySOI0.36 **0.09
NAO
AMO
0.20
0.55 ***
0.06
0.44 ***
AugustSOI0.240.01
NAO
AMO
−0.03
0.64 ***
−0.20
0.56 ***
SeptemberSOI0.30 *−0.06
NAO
AMO
0.22
0.64 ***
0.33 *
0.46 ***
OctoberSOI0.51 ***0.20
NAO
AMO
0.08
0.51 ***
0.00
0.30 *
NovemberSOI0.39 **0.03
NAO
AMO
−0.20
0.58 ***
−0.02
0.34 *
DecemberSOI0.48 ***0.28 *
NAO
AMO
−0.23
0.58 ***
−0.08
0.38 **
Disclaimer/Publisher’s Note: The statements, opinions and data contained in all publications are solely those of the individual author(s) and contributor(s) and not of MDPI and/or the editor(s). MDPI and/or the editor(s) disclaim responsibility for any injury to people or property resulting from any ideas, methods, instructions or products referred to in the content.

