Article

Application of Hollow Fiber Membrane for the Separation of Carbon Dioxide from Atmospheric Air and Assessment of Its Distribution Pattern in a Greenhouse

1
Department of Smart Farm, Graduate School of Gyeongsang National University, Jinju 52828, Republic of Korea
2
Institute of Smart Farm, Gyeongsang National University, Jinju 52828, Republic of Korea
*
Author to whom correspondence should be addressed.
Atmosphere 2023, 14(2), 299; https://doi.org/10.3390/atmos14020299
Submission received: 17 January 2023 / Revised: 24 January 2023 / Accepted: 1 February 2023 / Published: 2 February 2023
(This article belongs to the Section Air Pollution Control)

Abstract

:
Research on carbon management is fueled by the growing concern over rising carbon dioxide (CO2) levels in the atmospheric air and its possible impacts on the climate. In this study, we proposed a method of CO2 separation from atmospheric air. This study aimed to investigate the effects of CO2 enrichment on the air temperature inside a greenhouse using a hollow fiber (HF) membrane system. The experiment was conducted over a period of 30 days in two experimental conditions: 15 days without CO2 enrichment (WCS) and 15 days with CO2 enrichment (CS). Results showed that the mean CO2 concentration and air temperature were highest inside the greenhouse during the CS period, with values of 1120 ppm and 37.42 °C, respectively. Regression analysis revealed a positive correlation between CO2 concentration and temperature during the CS period (R2 = 0.628). The HF membrane system was found to be effective in increasing both the CO2 concentration and air temperature inside the greenhouse. However, the system also has limitations, including the cost, maintenance, and suitability for all types of crops. Further experiments are needed to address these limitations and determine the optimal CO2 concentration for different kinds of crops growing in greenhouses.

1. Introduction

The cause of global warming is primarily due to the emission of greenhouse gases, particularly carbon dioxide (CO2), by human activities such as fossil fuel combustion for power generation, transportation, and heating, which began to increase significantly with the onset of the industrial revolution [1,2]. Currently, the global atmospheric concentration of CO2 is estimated at approximately 400 ppm or more [3,4]. This figure is reported to be the highest in history since measurements of atmospheric CO2 began 63 years ago [4]. As such, CO2 is responsible for most changes in the earth’s radiation balance and the leading cause of global warming, as it steadily increases every year; therefore, the international community is making efforts to reduce CO2 emissions to alleviate global warming effects [5].
Recently, a number of mitigation measures have been proposed for reducing CO2 emissions, including reducing energy consumption, increasing energy efficiency, using renewable energy sources, and sequestration [6,7]. Moreover, CO2-captured technology has been widely applied at CO2 separation units in industries as a mitigation measure [8,9]. Meanwhile, Styring et al. [10] mentioned carbon capture and use (CCU) technologies, which attracted great attention for converting the captured CO2 into a renewable carbon source. Based on the available literature, some of the main limitations of carbon-capture technologies include safety concerning secured storage and the possibility of leakage [11], public acceptance [12,13], and the high deployment costs associated [14]. Moreover, carbon capture storage and utilization technologies are yet to be proven on a large scale [15]. In addition, afforestation and reforestation [16], biochar [17,18], soil carbon sequestration [19], and wetland restoration and construction [20] processes have gained considerable attention as viable approaches for carbon capture. In addition to these mitigation measures for CO2 gas emissions, the hollow fiber (HF) membrane is emerging as a potential CO2 separation technology where the CO2 is directly separated from the atmospheric air. The underlying principle behind the technology is the permeability property of each atmospheric gas [21]. The permeability of each atmospheric gas depends on its solubility and diffusivity rate into the HF membrane where the gas passes through the high-pressure zone to the low-pressure zone [22] (Figure 1).
A number of research studies have been conducted for the preparation and characterization of hollow fiber membranes as well as for gas separation [23,24,25]. An experiment on improving HF membrane permeability was conducted by Uragami et al. [26], who stated that improved fluxes could be prepared by adding polyethylene glycol (PEG) as a pore-forming agent in the solution containing N-methyl-2-pyrrolidone and the tetrahydrofuran solvent. Prior studies on HF membranes noted that HF membrane permeability tends to be significantly reduced compared to theoretical values due to the presence of internal and external concentration polarization during the mass transport process [27,28]. Liu et al. [29] reported that the permeation rate of HF thin membranes was comparatively higher than thick for gas separation. Moreover, it has been suggested that the HF membrane is the most suitable for the forward osmosis process compared to the flat sheet membranes due to its self-supported and possesses flow pattern, which is essential for the forward osmosis process [30,31]. In addition, manufacturing hollow fiber modules with a high packing density is much easier and more cost-effective [32]. Considering the advantages of the HF membrane, the current study used an HF membrane for CO2 separation from atmospheric air.
All the studies carried out above were focused on the membranes applied at the laboratory and industry scales for CO2 separation. Furthermore, on review of the published literature, limited studies have used HF membranes to separate CO2 from atmospheric air and supply it to an experimental greenhouse [33,34]. Xue et al. [34] and Sampranpiboon et al. [35] experimented with separating CO2 using HF membranes from atmospheric air and supplied it to an experimental greenhouse; however, they did not assess the distribution pattern of CO2 and the temperature inside the greenhouse. Agrahari et al. [35] investigated the application of HF membrane contactors to remove CO2 from water under liquid–liquid extraction mode. It is well noted in the literature that HF membranes are highly efficient in removing CO2 from wastewater. Since membrane-based gas separation is a recently emerging technology compared to conventional separation processes, it becomes an indispensable tool in greenhouse crop cultivation by supplying the separated CO2. Moreover, the separation of CO2 from the atmospheric air has gained global attention due to the enhanced greenhouse effect. Therefore, the present study has been undertaken (1) to separate CO2 from atmosphere air using a hollow fiber membrane and (2) to assess the distribution pattern of CO2 and temperature by supplying the separated CO2 to an experimental greenhouse.

2. Materials and Methods

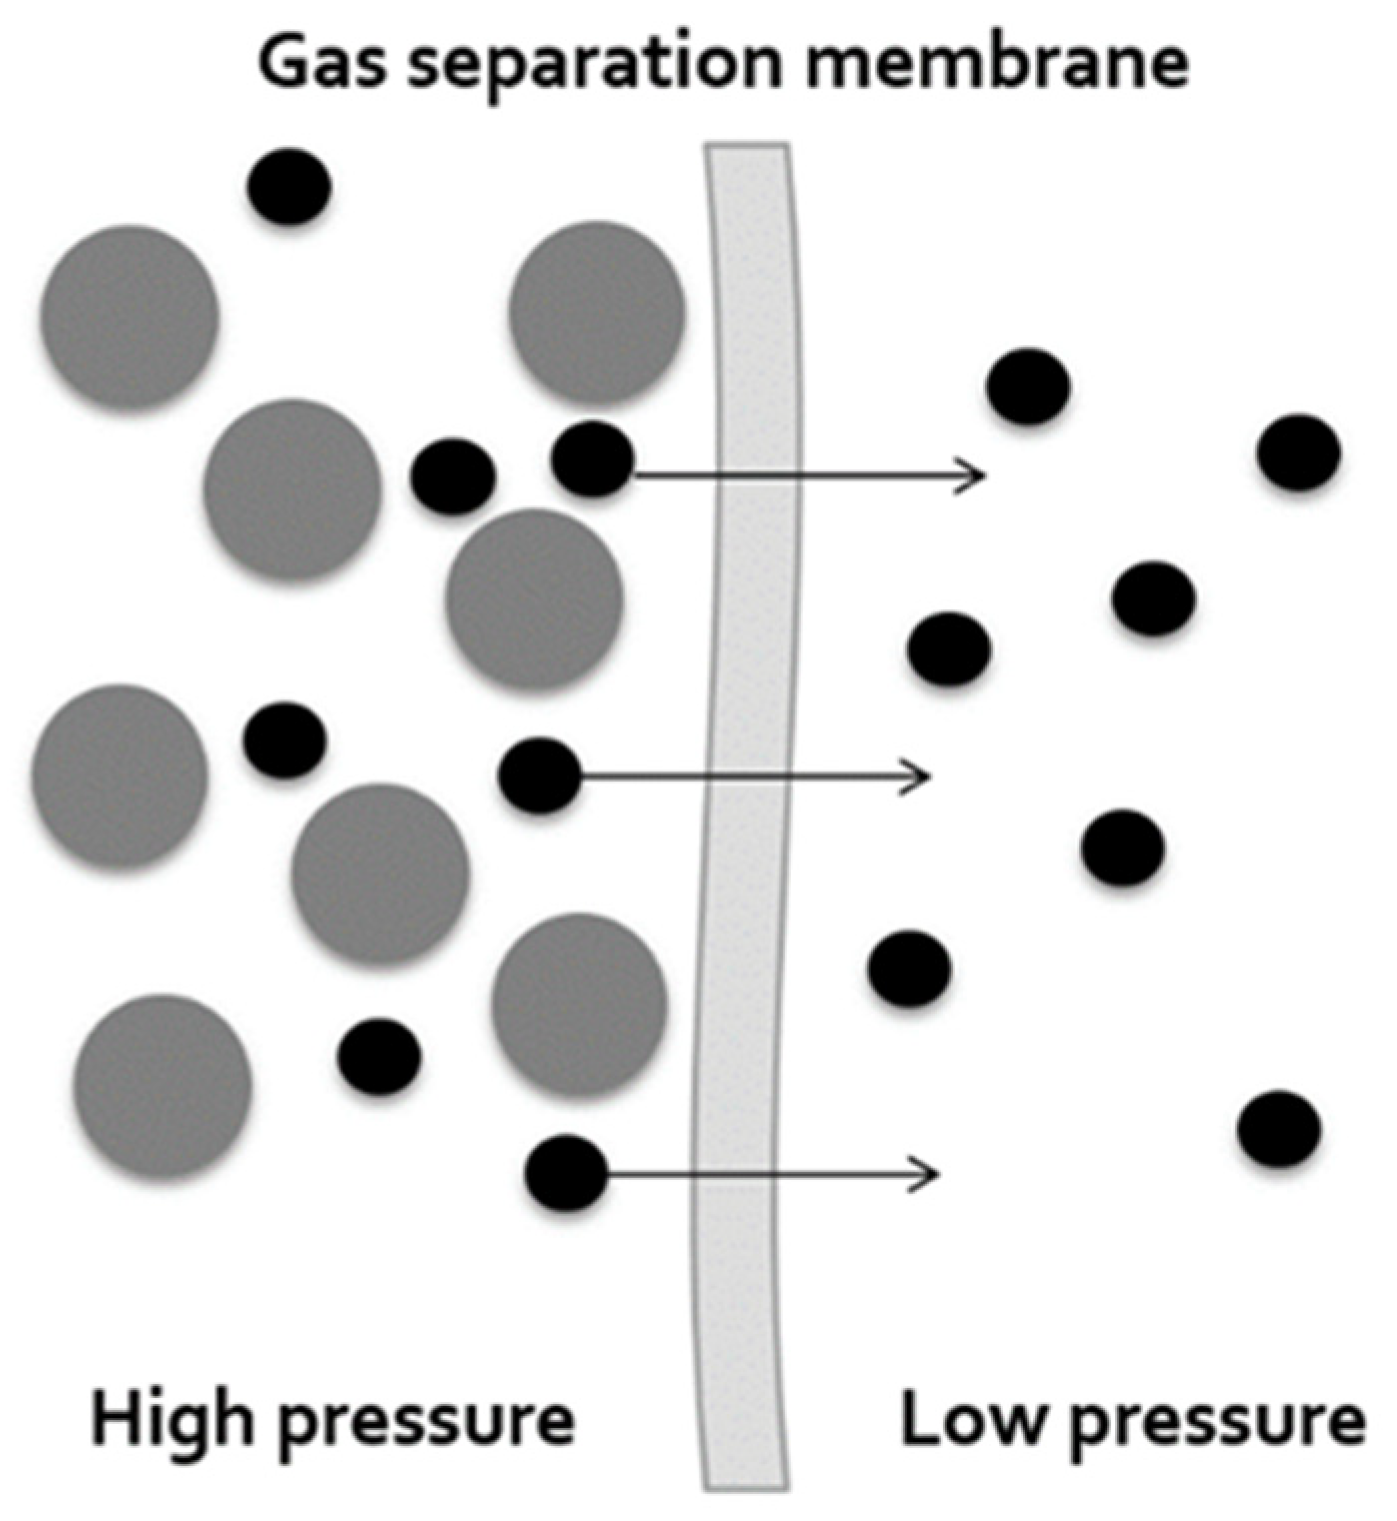
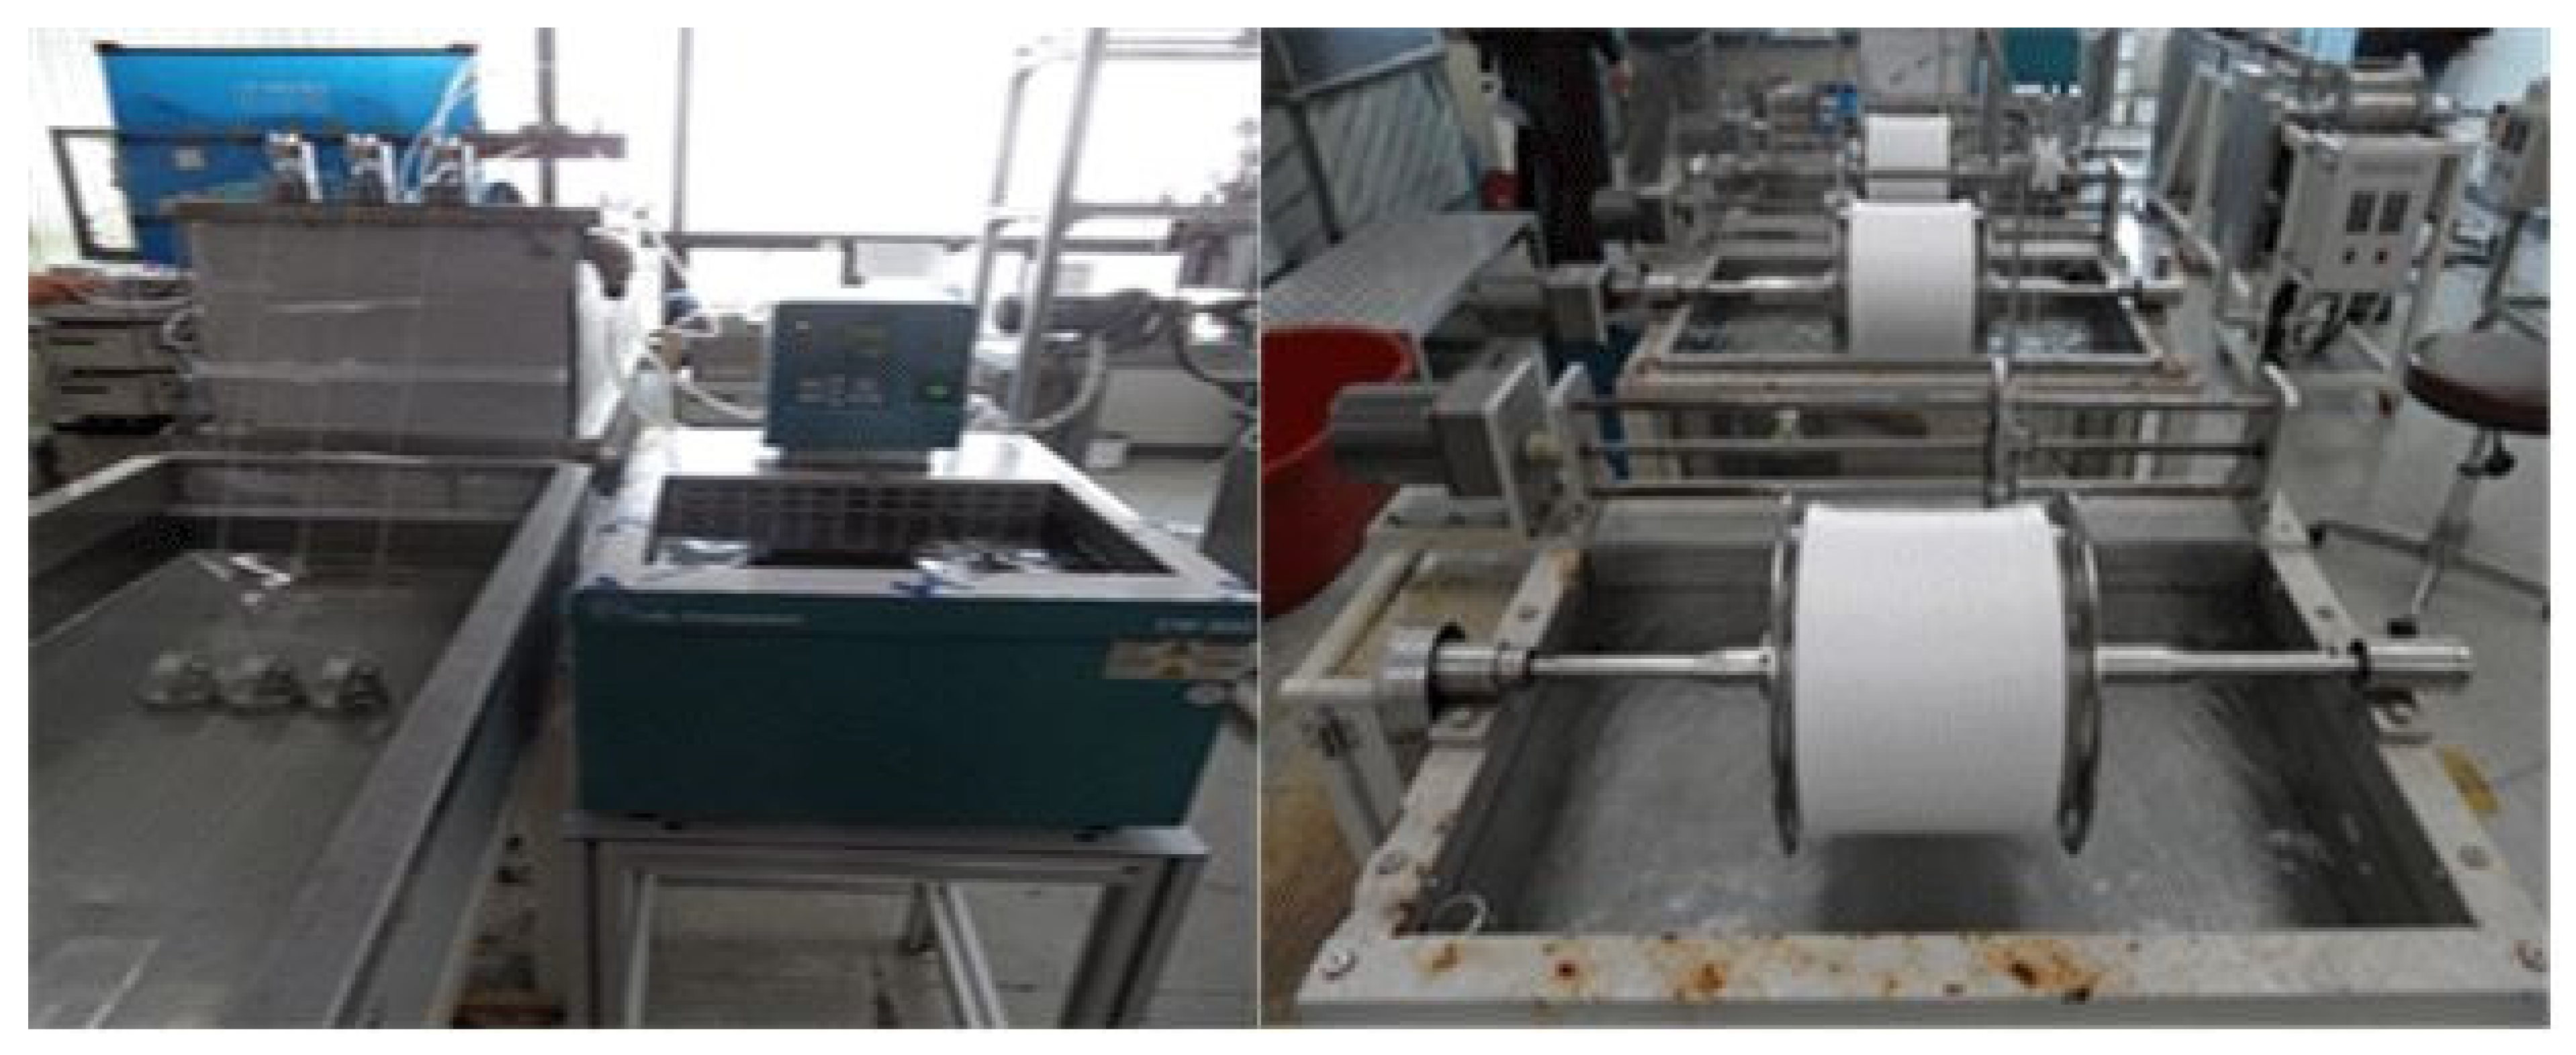
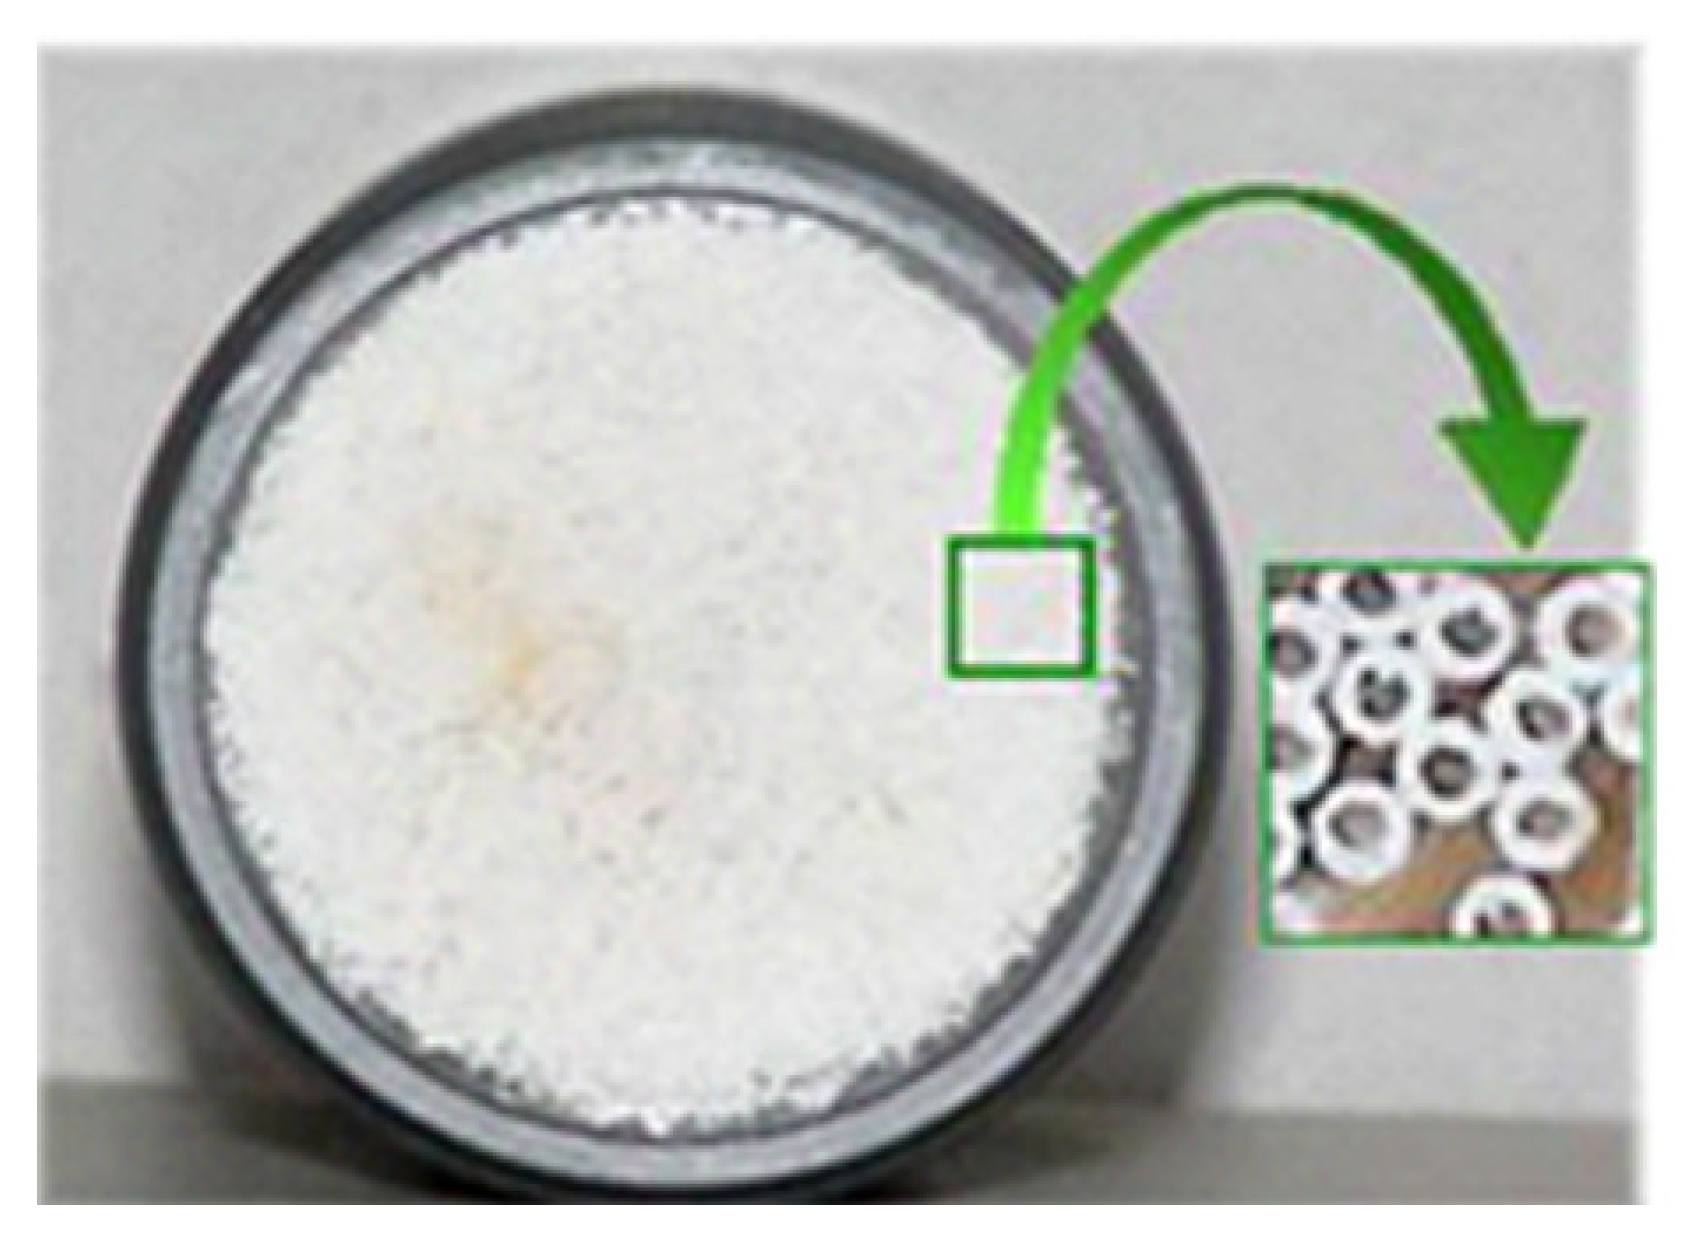
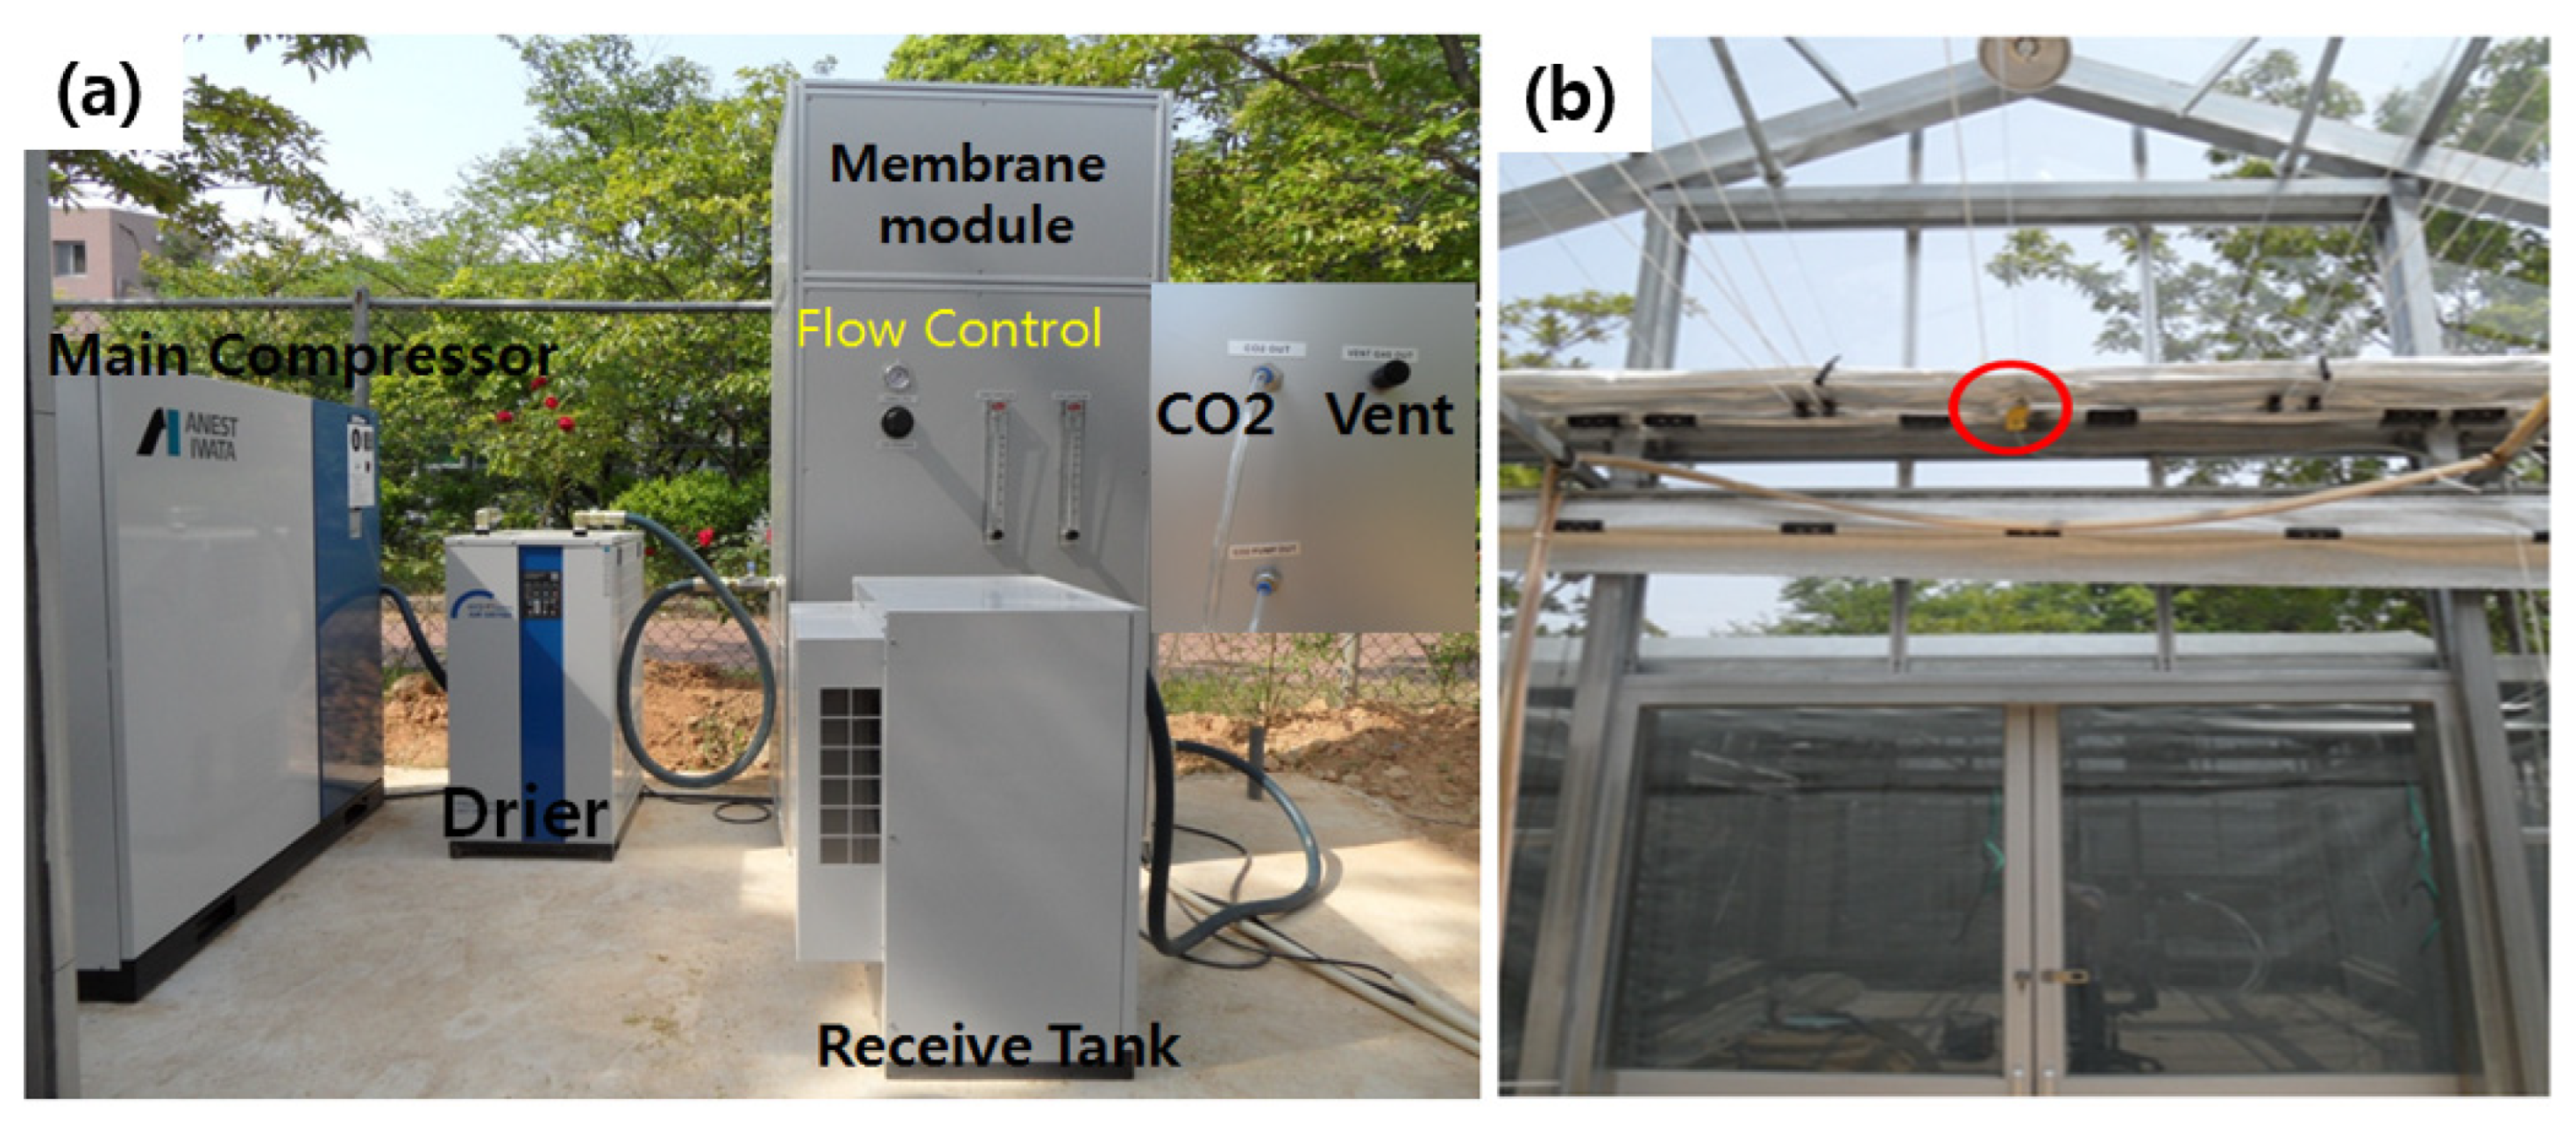
2.1. Hollow Fiber Membrane Module

The HF composite membrane was prepared in industry with a special engineering plastic with a polysulfone polymer material (polysolfone Udel P-1700) and a thermoplastic polymer chemical [36,37]. The procedure to prepare the pure polysulfone membrane was performed using a mixture of 25% polysulfone and 75% N-Methyl-2-Pyrrolidone (NMP) and drying the polysulfone under a vacuum for 24 h. The polysulfone was mixed with NMP at room temperature for 10 h, degassed for 4 h, and left to stand for an additional 24 h to remove any trapped microbubbles. The solution was poured onto a clean glass plate and spread with a casting knife at a thickness of 0.25 mm at room temperature, then immersed in deionized water for 24 h and solvent-exchanged with methanol for 2 h; finally, the membrane was dried in the open air and stored in a desiccator before use. The details of the equipment and procedures for preparing hollow fiber membranes have been described elsewhere [38]. To design the HF membrane module, the hollow fiber in the form of a thread was bundled with an asymmetric structure to make it modular (Figure 2).
The membrane samples were cut into circular shapes, and the packing density of the module was adjusted to 45% (Figure 2). The hollow fiber membrane module generally has a packing density range of 30 to 60% for gas separation [39]. It is noted that if the range of packing density is low, the performance of the membrane will be less; however, if the ratio is too high, the flow of gas through the hollow fiber membrane will not be smooth. Therefore, the ratio should be considered before the experiment starts [40]. The packing density of the HF membrane was calculated by the following Equation (1). The effective length and diameter of each HF membrane were 36.0 cm and 5.5 cm, which corresponds to a total permeation area of 23.76 cm2 in the membrane module (Figure 3). The intrinsic permselectivity and the permeability of the HF membrane were measured using the same methods used by Liu et al. [29]. The system specifications of the hollow fiber membrane separator are shown in Table 1.
Packing   density = A r   ×   A h N
where Ar is the cross-sectional area of the hollow fiber membrane, N is the number of hollow fiber strands, and A h is the cross-sectional area.
The mechanical strength of the HF membrane is very important due to the high-pressure air that is passed through the membrane capillary. In this case, when air pressure is more than 2 MPa, the air is fed from outside since the hollow fibers are more resistant to compression than to stretching, whereas when air pressure is low, the feed is introduced inside the micro-pipe [41]. In this study, the experiment was performed using the HF membrane module with productivity equal to 40 N m3 day−1 for air pressure of 0.8~1 MPa. Moreover, the pressure buildup inside and outside the hollow fibers in the HF membrane was found to be negligible. The working principle of the HF membrane is similar to that reported by Won et al. [39].

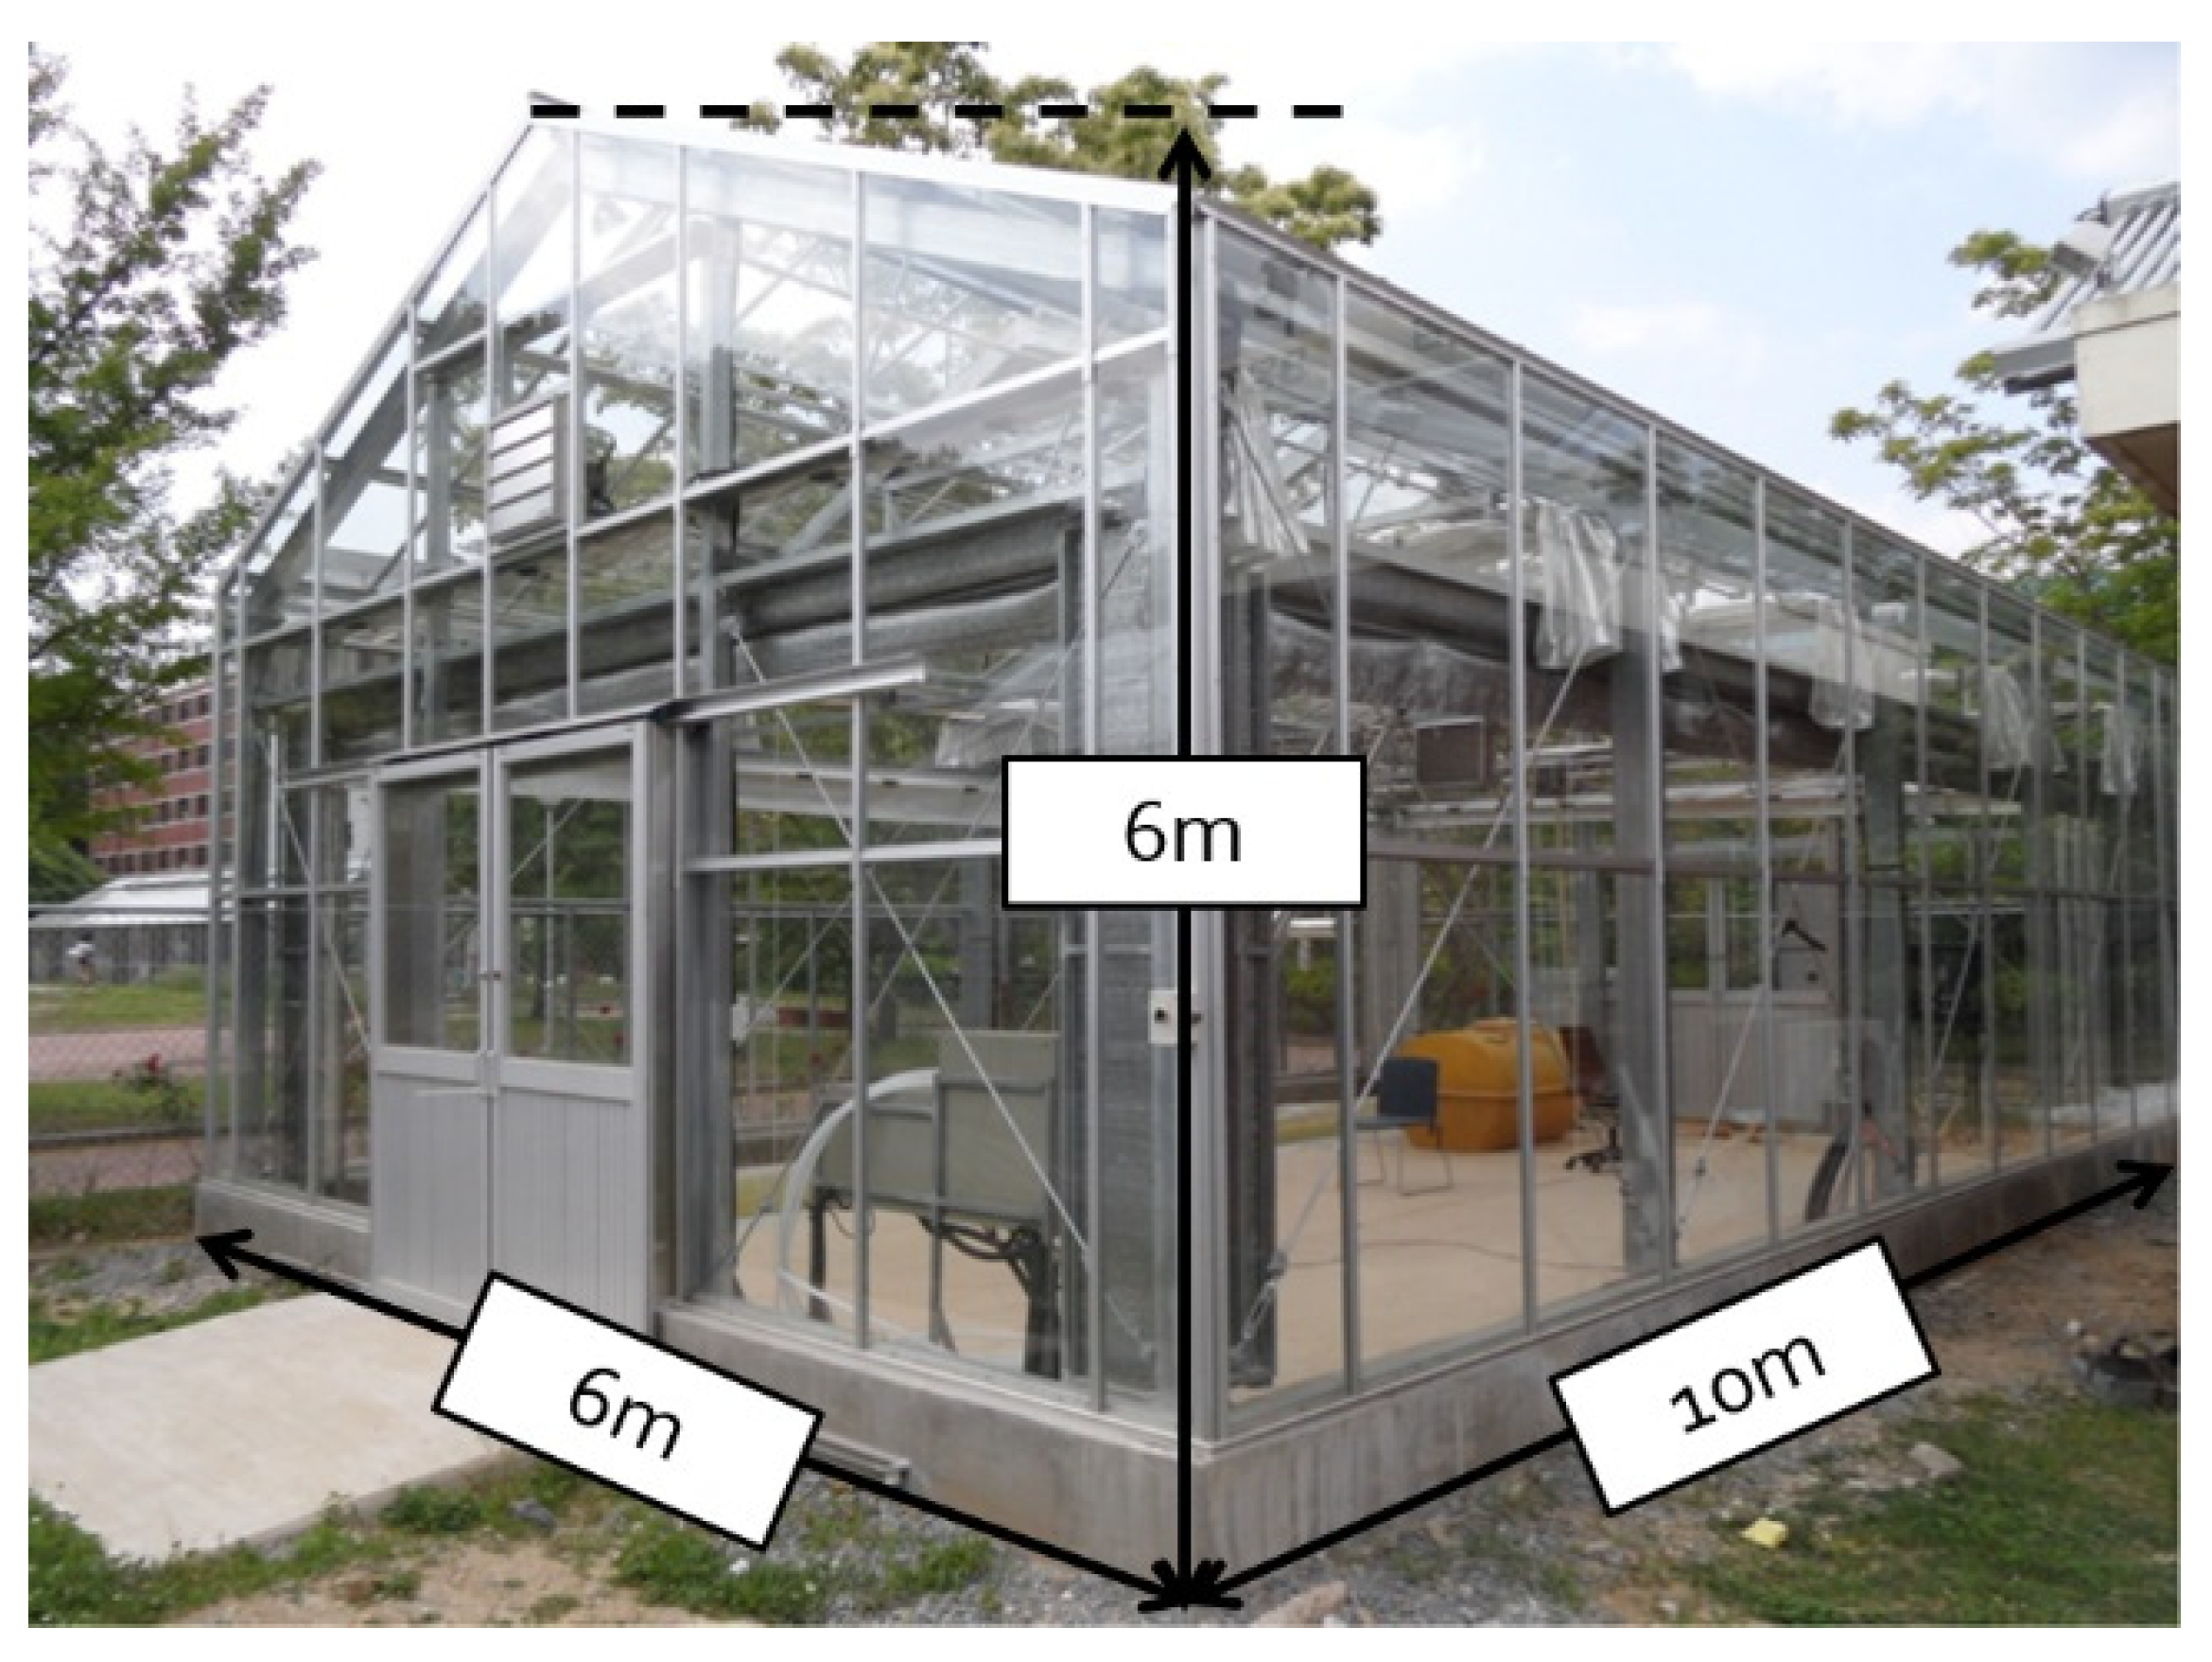
2.2. Experimental Greenhouse

This study was conducted in a greenhouse (latitude 35°09′8″ N, longitude 128°05′46.1″ E) (Figure 4) of 6m × 6m × 10 m in width × height × length located at the Smart Farm Systems Laboratory at Gyeongsang National University in Korea from September 2022 to November 2022. A number of articles have been carried out considering greenhouse covering materials, dimensions, and environmental sustainability [42,43]. Different types of materials have been used for preparing greenhouses; however, glass and plastic sheets are widely used as covering materials due to their high thermal efficiency [44,45], optical properties [46], energy sustainability [47], and synthesis techniques [48]. Hao et al. [49] conducted a comparative study on different greenhouse materials (D-poly, acrylic, and glass). They found that glass was the most appropriate for covering the greenhouse to prevent energy losses and maintain internal cooling. Therefore, in the current study, we used glass as a covering material to prepare the greenhouse. Moreover, a natural ventilation system was installed in the experimental greenhouse 5 m from the ground surface in the upper location.

2.3. Carbon Dioxide Supply in the Greenhouse

A membrane separation module was installed near the experimental greenhouse to separate CO2 from atmospheric air (Figure 5). Air was supplied at a pressure capable of operating the membrane module by collecting from the atmosphere through the main compressor. After that, moisture was removed from the atmosphere through an air dryer to minimize mechanical defects of the membrane module. Finally, CO2 was separated through the membrane module, and the remaining gases were released into the atmosphere. The CO2 separated from the membrane system is shown in Figure 5. An air nozzle was installed at the height of 4 m in the experimental greenhouse to supply the separated CO2 gas. The CO2 amount was measured at 160 L min−1 and the flow rate was set at 15.7 ms−1 and supplied inside the greenhouse in the morning (9–11 a.m.), afternoon (1–3 p.m.), and late afternoon–evening (4–6 p.m.).

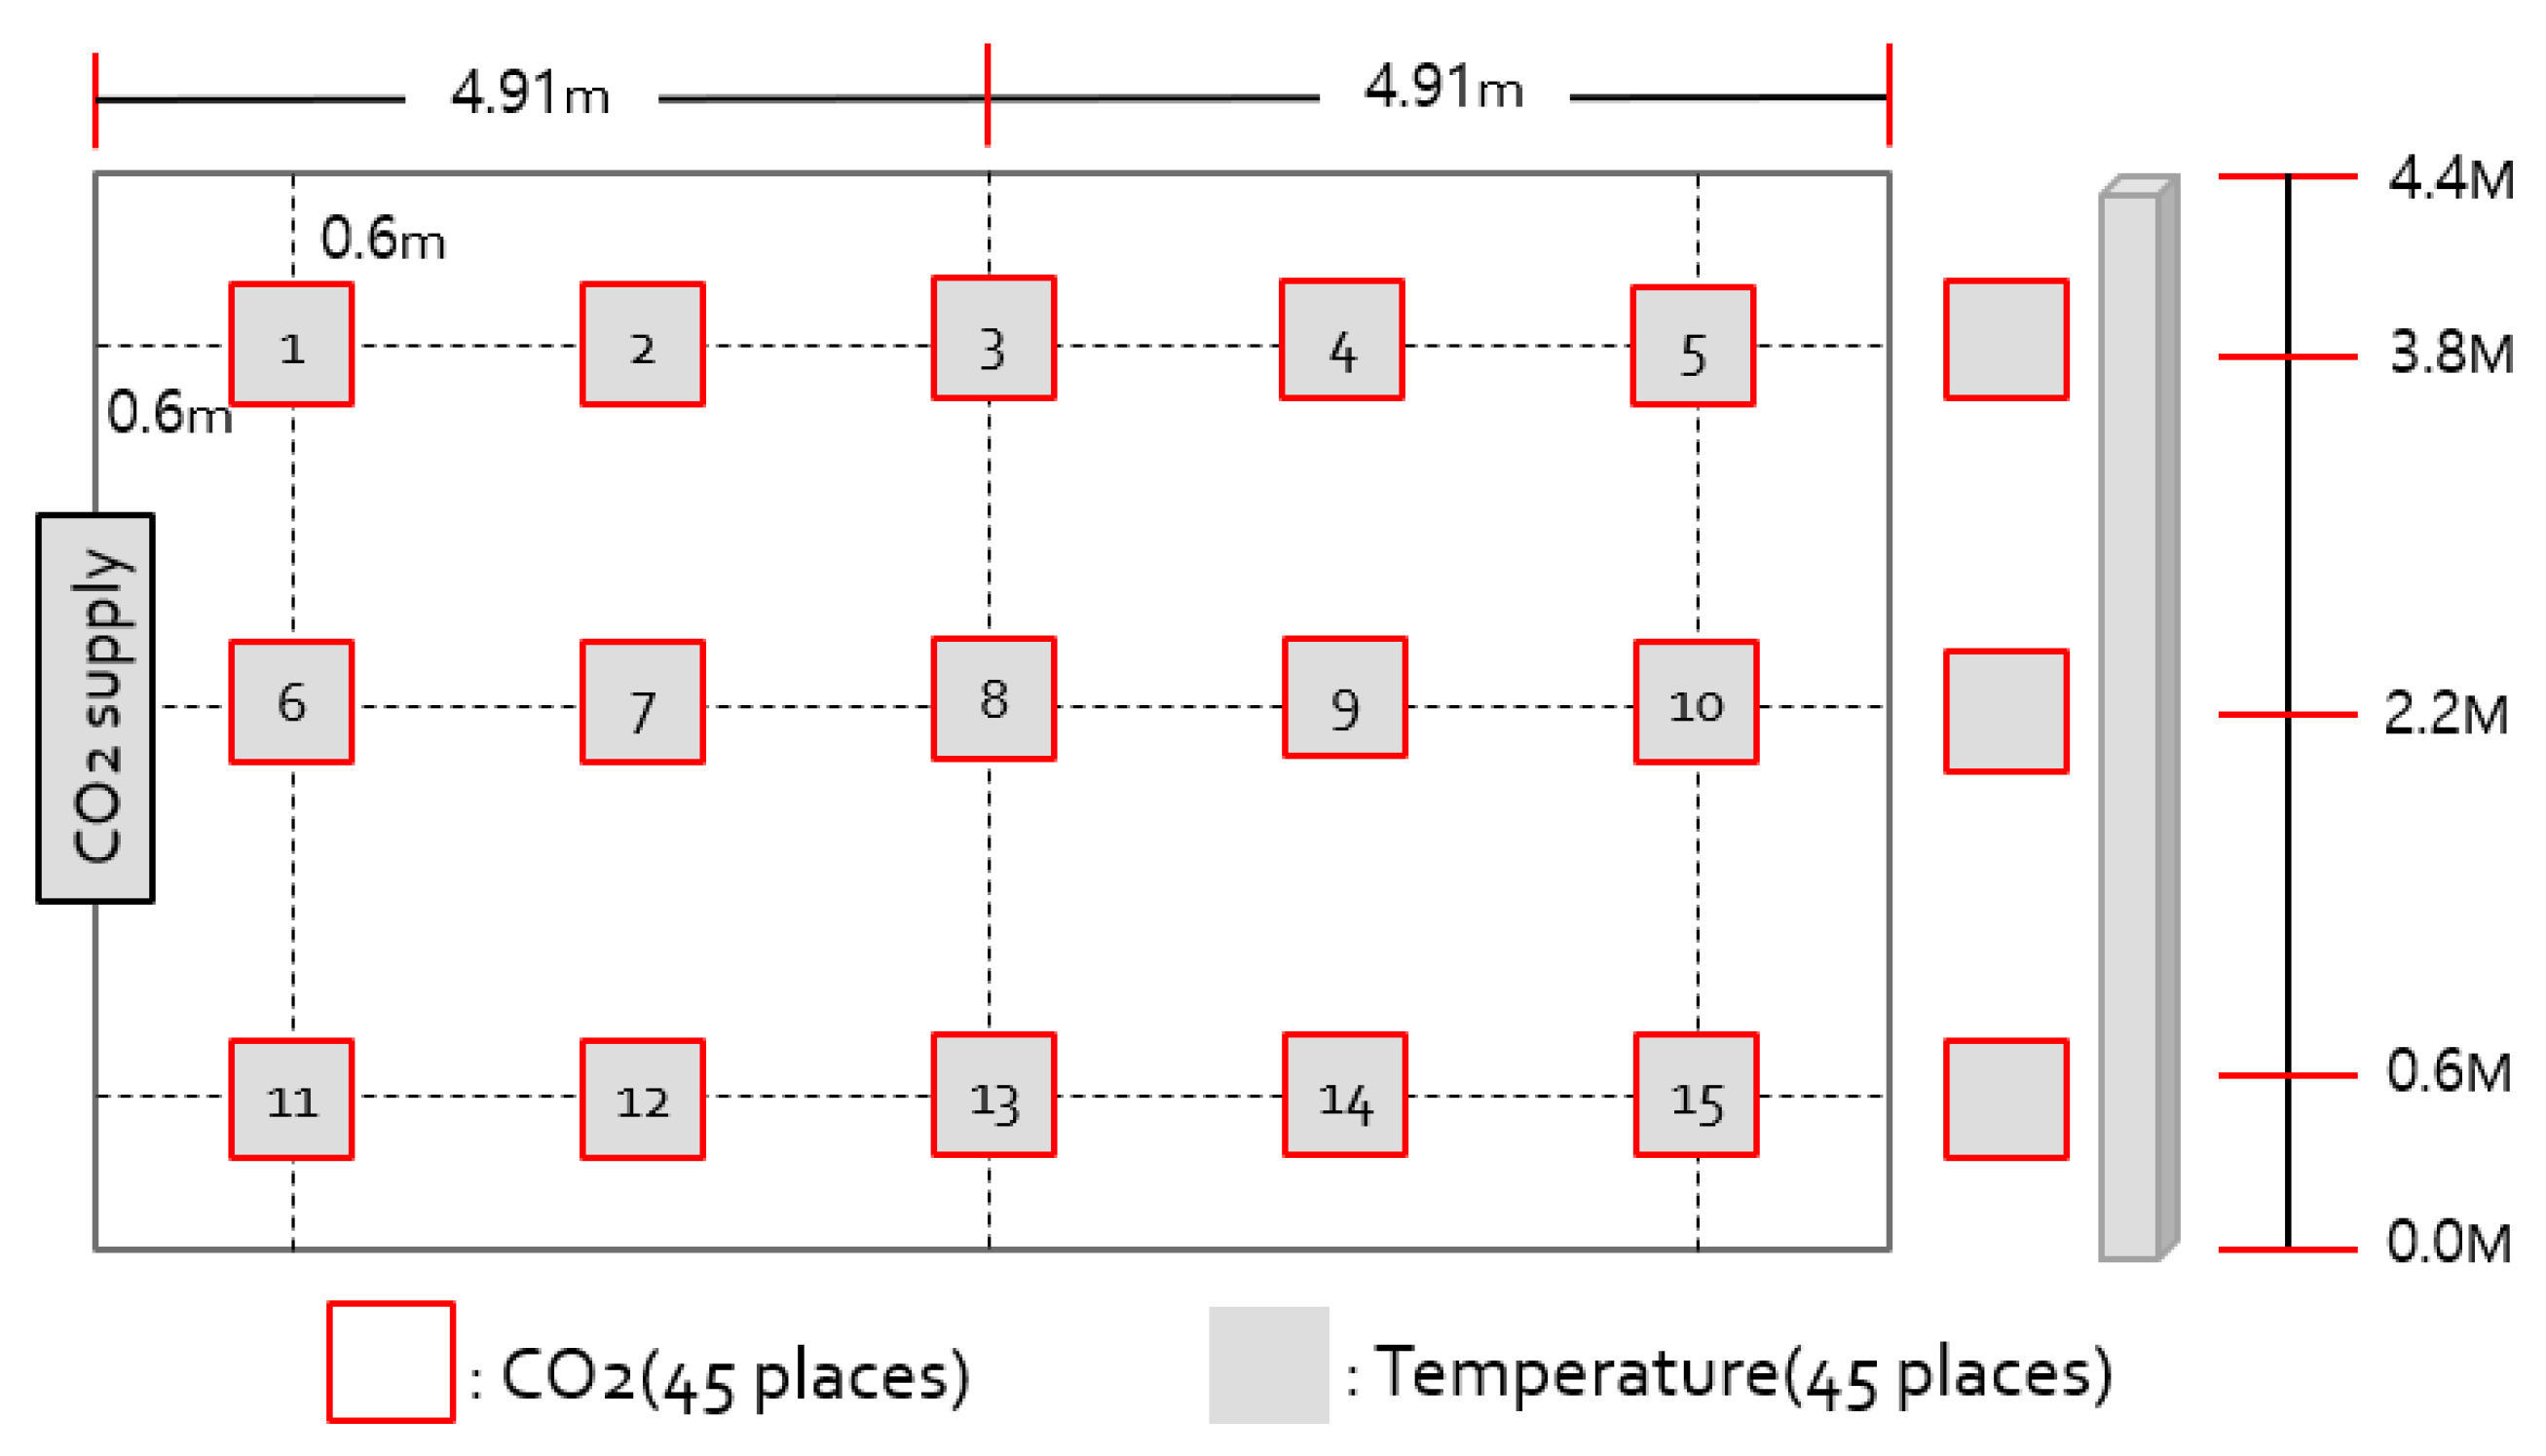
2.4. Data Collection and Analysis Methods

In this study, temperature data were measured using data loggers (GL 820, Graphtec Corporation, Yokohama, Japan) and a K-type thermocouple at a total of 45 points inside the greenhouse (Figure 6). The CO2 concentrations were also recorded at the same temperature-measuring positions using indoor air-quality meters (TSI 7525, TSI, Inc., Shoreview, MN, USA). The environmental data inside and outside the greenhouse were collected from 1 October to 30 October 2022. Carbon dioxide is generally heavy and sinks in the air; however, the point of gas flow according to temperature change was considered [50]. Therefore, the CO2 and temperature sensors were set up in the same locations. Measurements of temperature and CO2 were taken three times a day: 10 to 11 a.m. when the temperature rapidly increased during the day, 2 to 3 p.m. when the temperature was the highest during the day, and 5 to 6 p.m. when the temperature was dropping [51]. Since the temperature inside the greenhouse is affected by the outside temperature [52,53], the outside temperature with the CO2 concentration was also measured using a weather sensor (MetPRO, Producer: Campbell Scientific, Logan, UT, USA) located near the greenhouse throughout the entire experimental period.
Statistical Package for the Social Sciences (IBM, SPSS Statistics 22.0.0.0, New York, NY, USA) was used for statistical analysis and Origin Pro 9.5.5 (OriginLab, Northampton, MA, USA) was used for the data representation as figures. The measured data were analyzed using Sigma Plot (Sigma Plot v10.0, Systat Software Inc., Chicago, IL, USA).

3. Results and Discussion

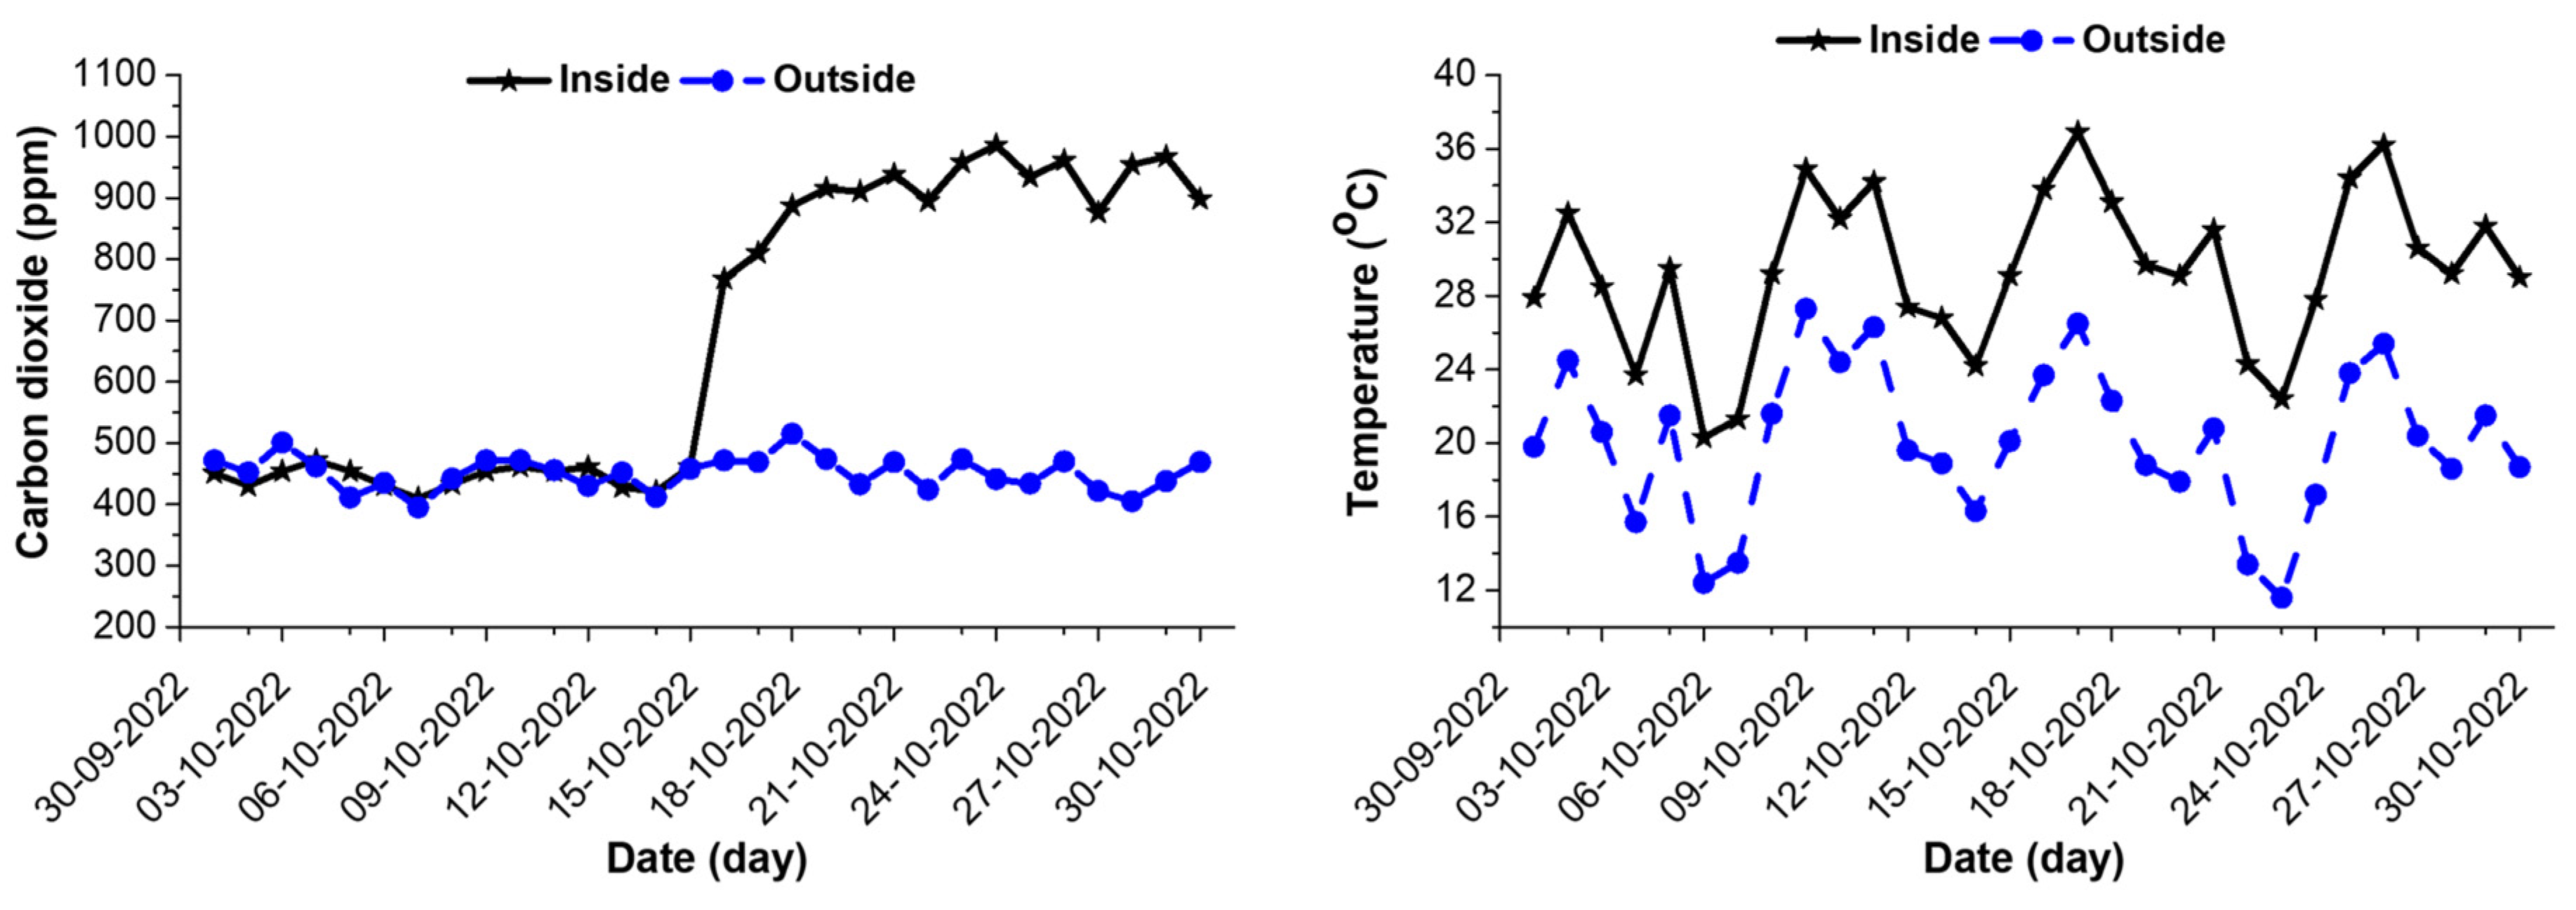
3.1. Variation of CO2 and Air Temperature inside the Greenhouse and Outside Environment

The CO2 concentration and air temperature data were collected from 1 October to 30 October 2022. In the first 15 days of the experimental periods, CO2 was not supplied to the greenhouse, denoted as WCS, and in the remaining 15 days, CO2 was supplied using HF membrane systems, denoted as CS. Table 2 shows the descriptive statistics for CO2 concentration and air temperature and data from inside the greenhouse and from the outside environment from 1 October to 30 October during both experimental conditions. Inside the greenhouse, the highest mean CO2 concentration and air temperature had values of 1120 ppm and 37.42 °C, respectively, in the CS period. Figure 7 illustrates the CO2 concentration and temperature changes before and after the CO2 application inside the greenhouse. The CO2 concentration rate inside the greenhouse increased significantly when the CO2 was applied using the HF membrane, while the air temperature and CO2 concentration in the outside environment followed similar patterns in the WCS and CS conditions.
Moreover, during WCS, there were no significant differences in the CO2 concentration inside and outside the greenhouse; however, a considerable variation in air temperature was observed. The average inside–outside air temperature differences in WCS and CS periods were 8.91 °C and 11.30 °C, respectively. Regarding average CO2 data, the differences in the inside–outside environments were 3.06 ppm and 456.54 ppm in WCS and CS, respectively. It was obvious that the supplied CO2 using HF membrane systems increased the air temperature and CO2 concentration inside the greenhouse. Similar patterns of changes in CO2 and temperature were reported for the greenhouse and outside environments [54,55]. N Bennis [56] and IB Lee [57] conducted research on natural ventilation rates and airflow patterns in greenhouses using computational fluid dynamics (CFD). They noted that factors such as the size of the vent openings, wind speed, and wind direction significantly impacted the indoor environment in greenhouses. Based on their findings, they observed an approximately 20% difference in air temperature between the inside and outside environments, which was in relatively good agreement with our experimental results. We discuss the results of a previous study to better understand the relationship between the internal and external ambient conditions in a greenhouse [58].

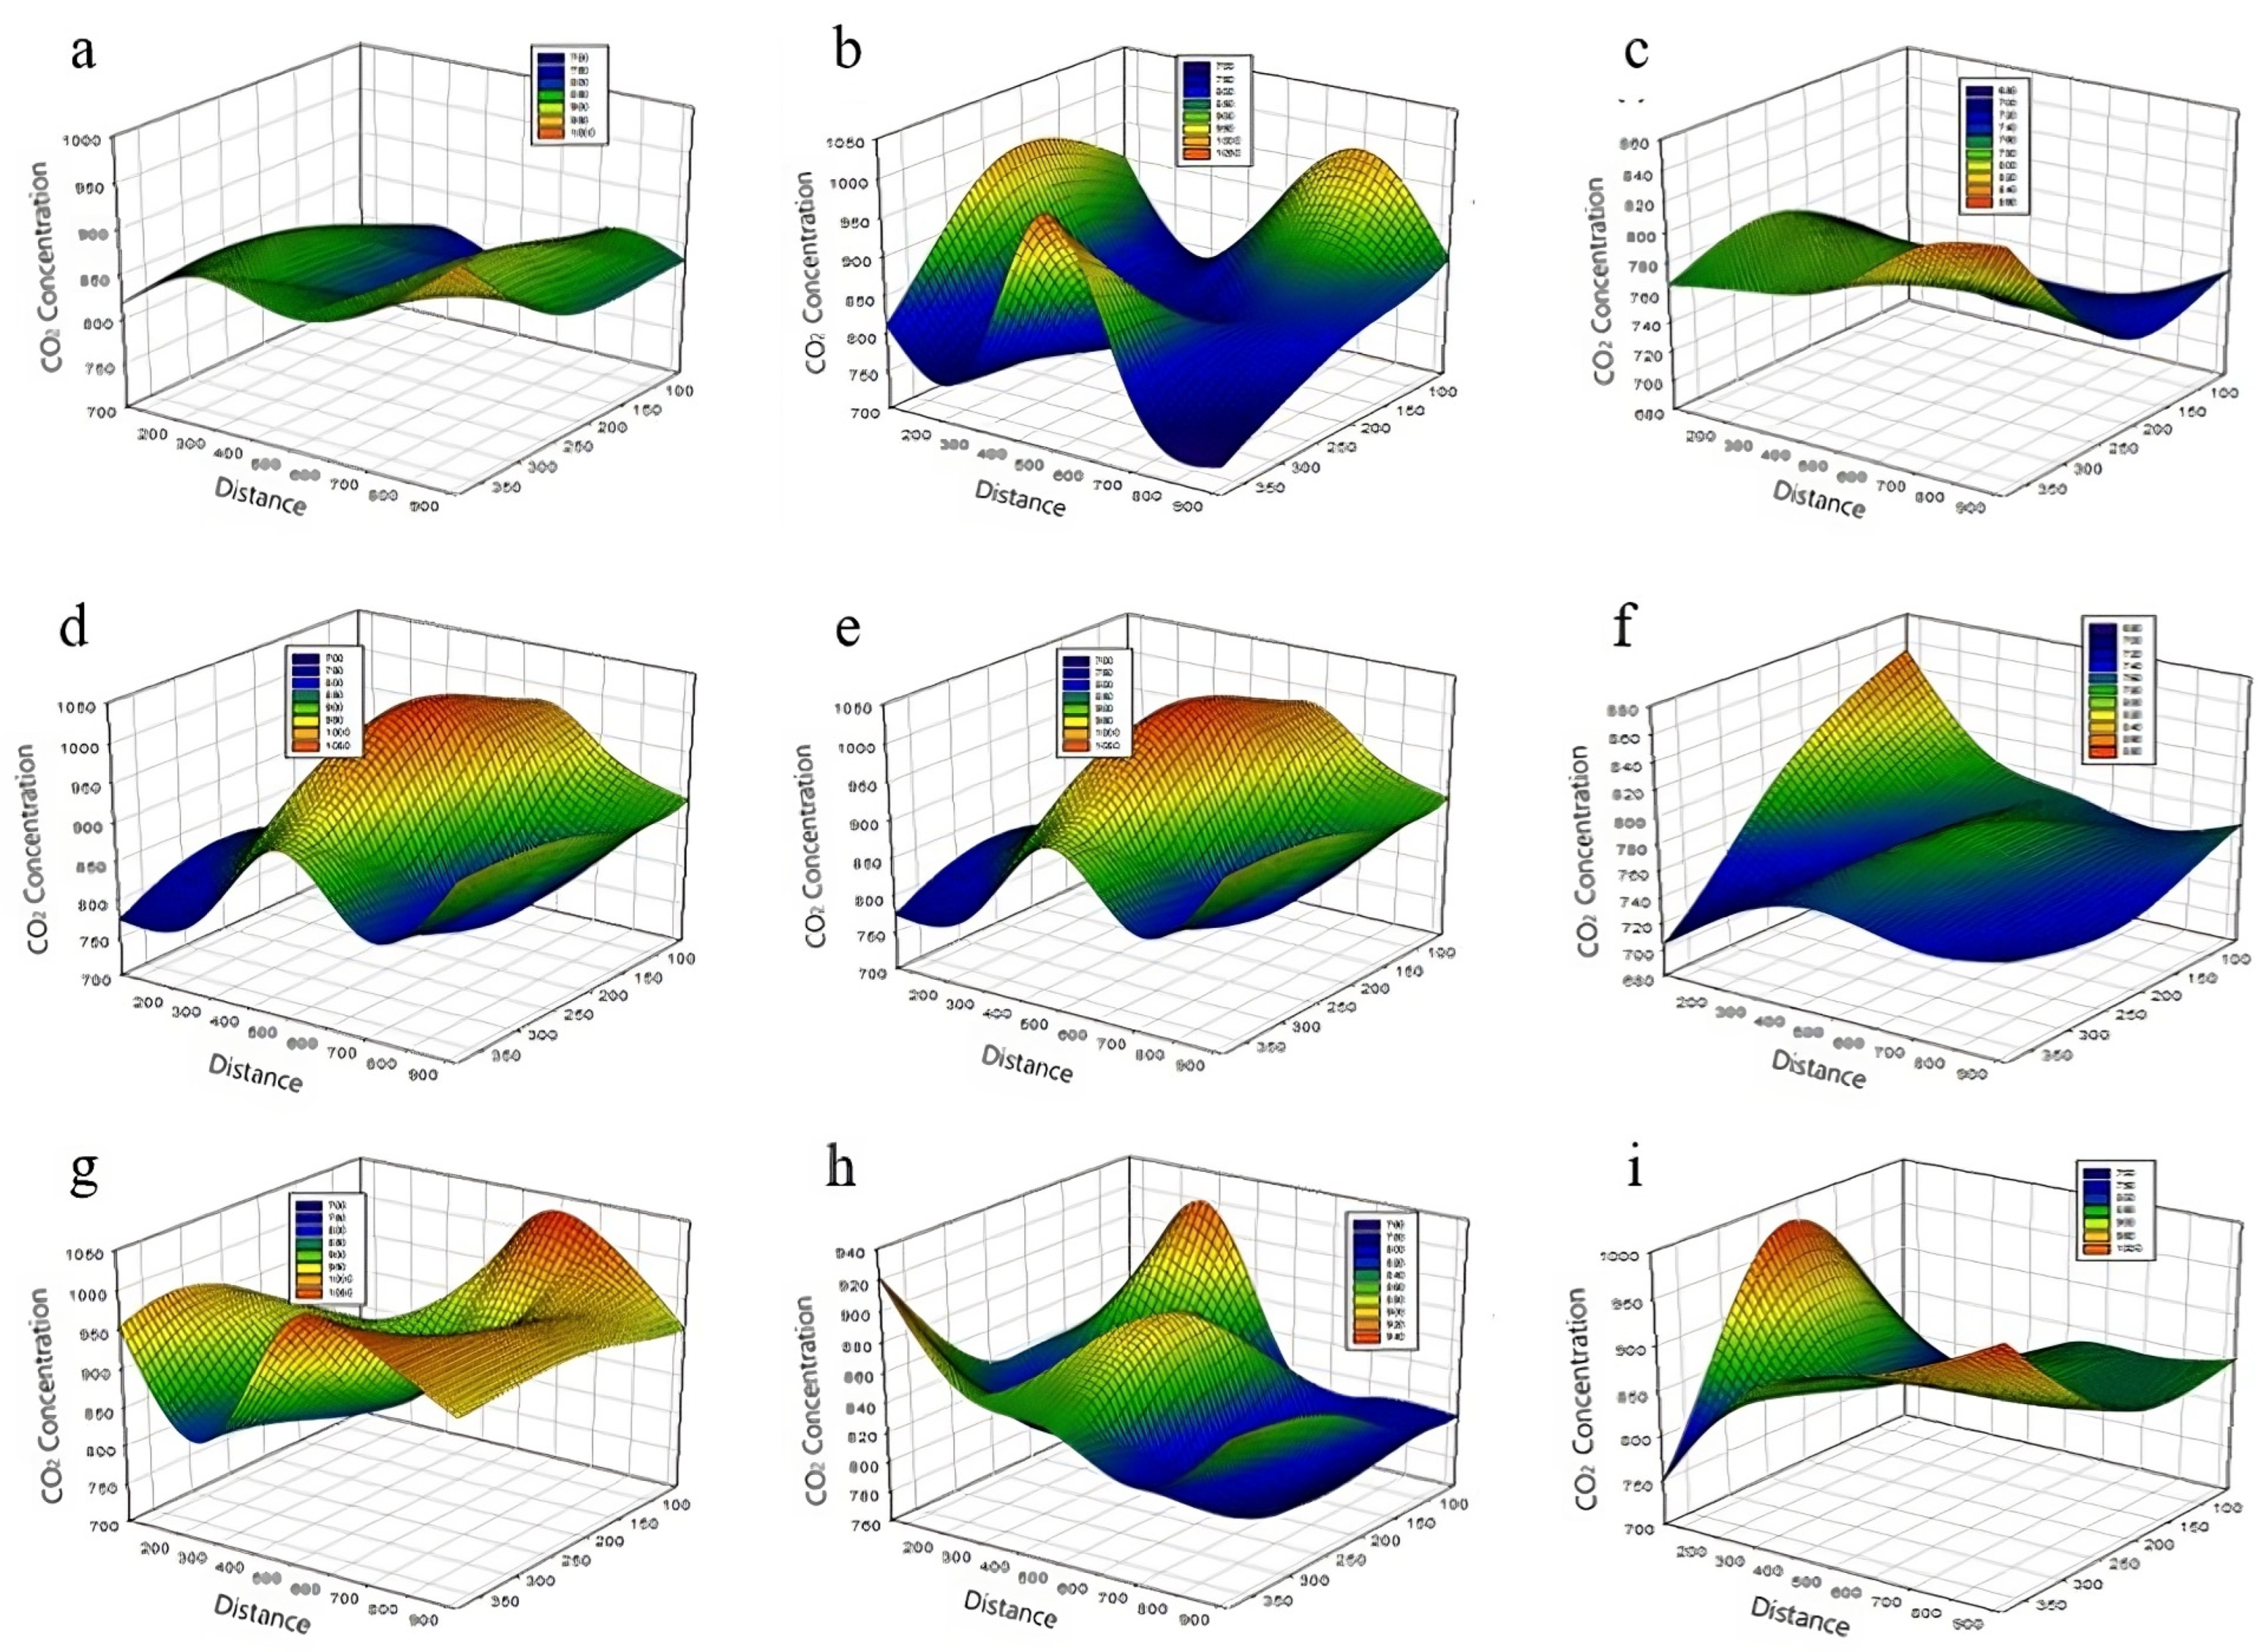
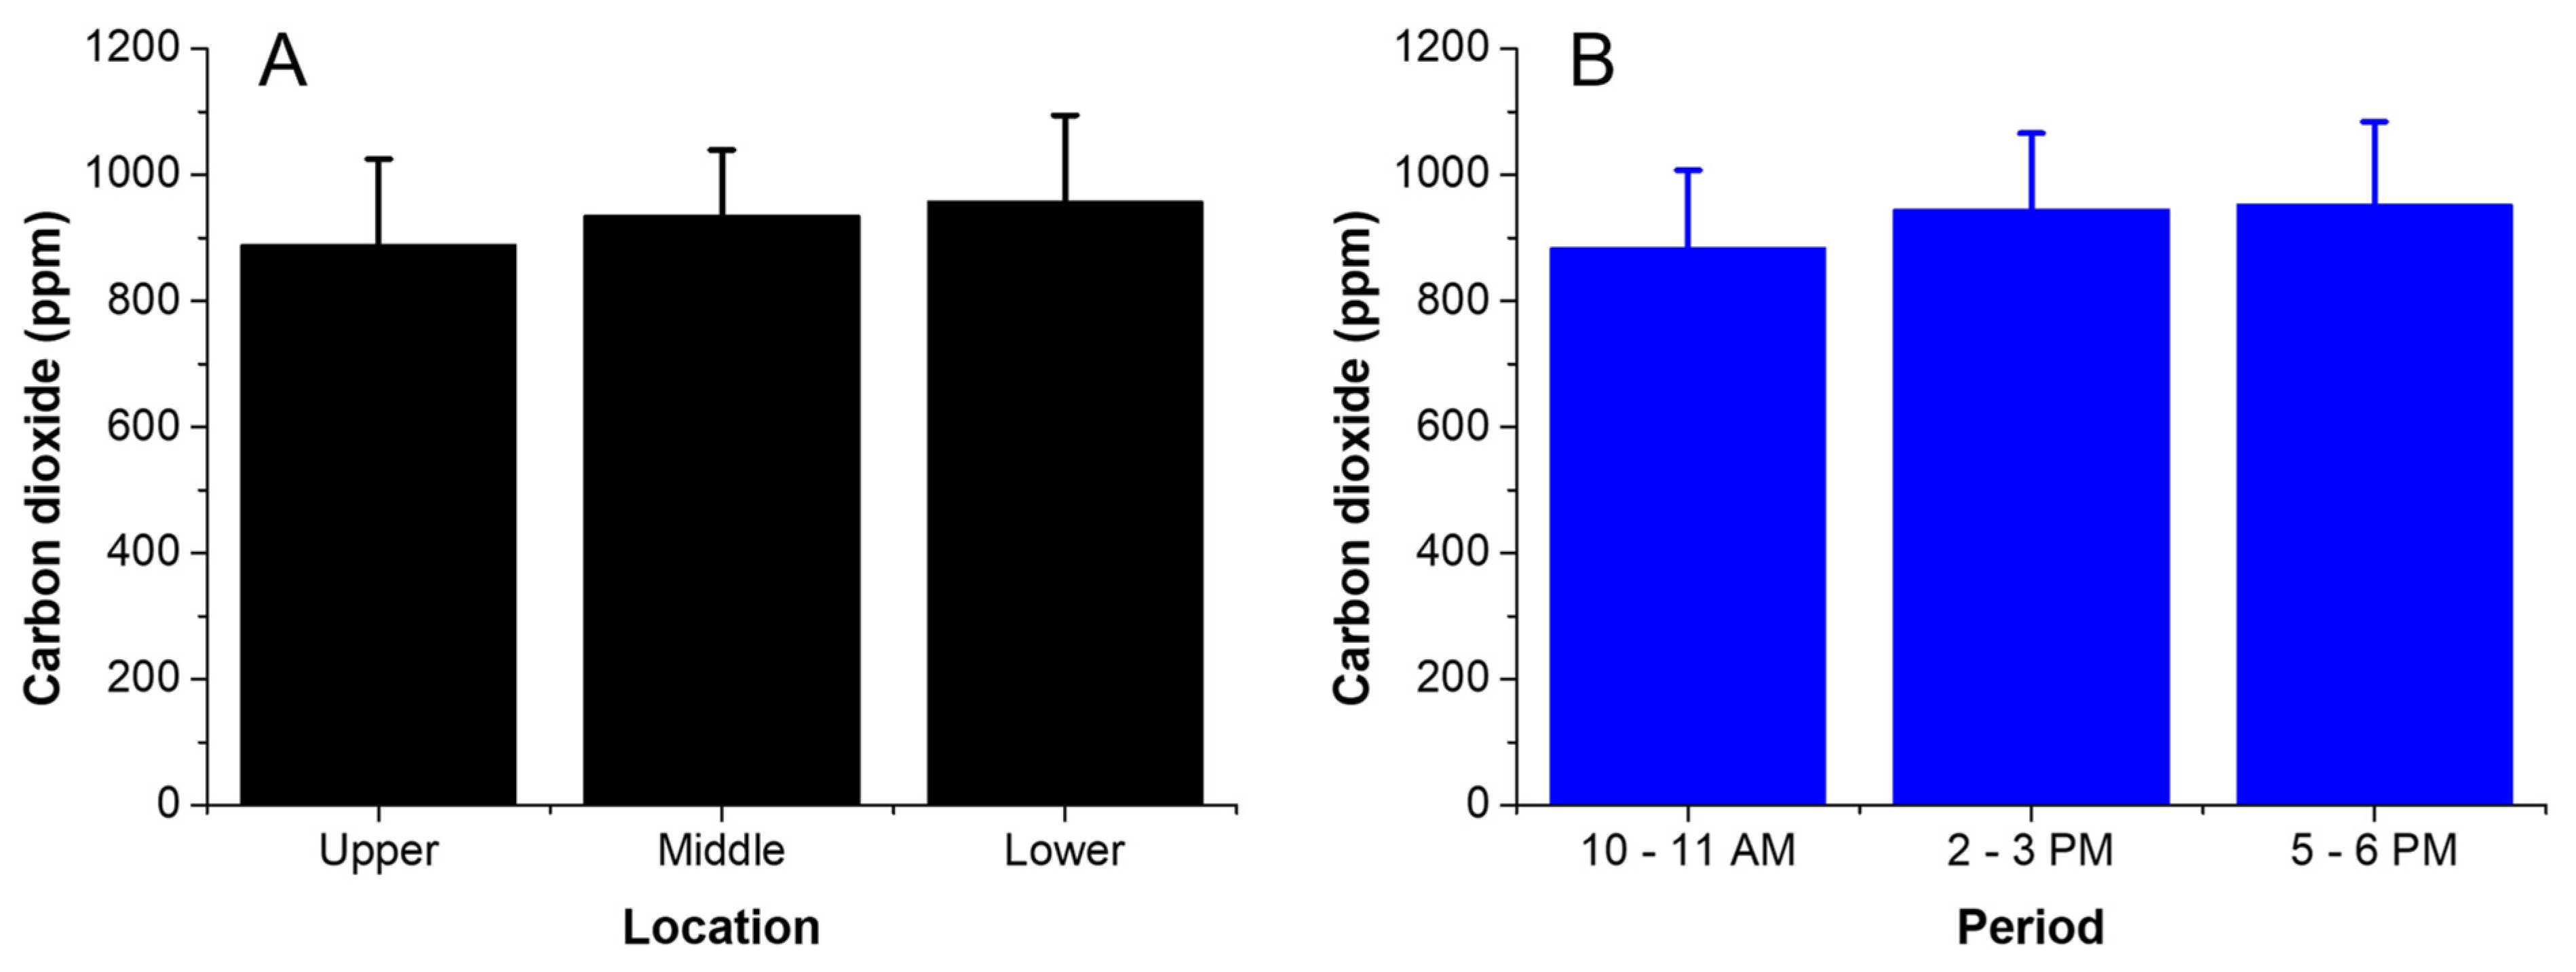
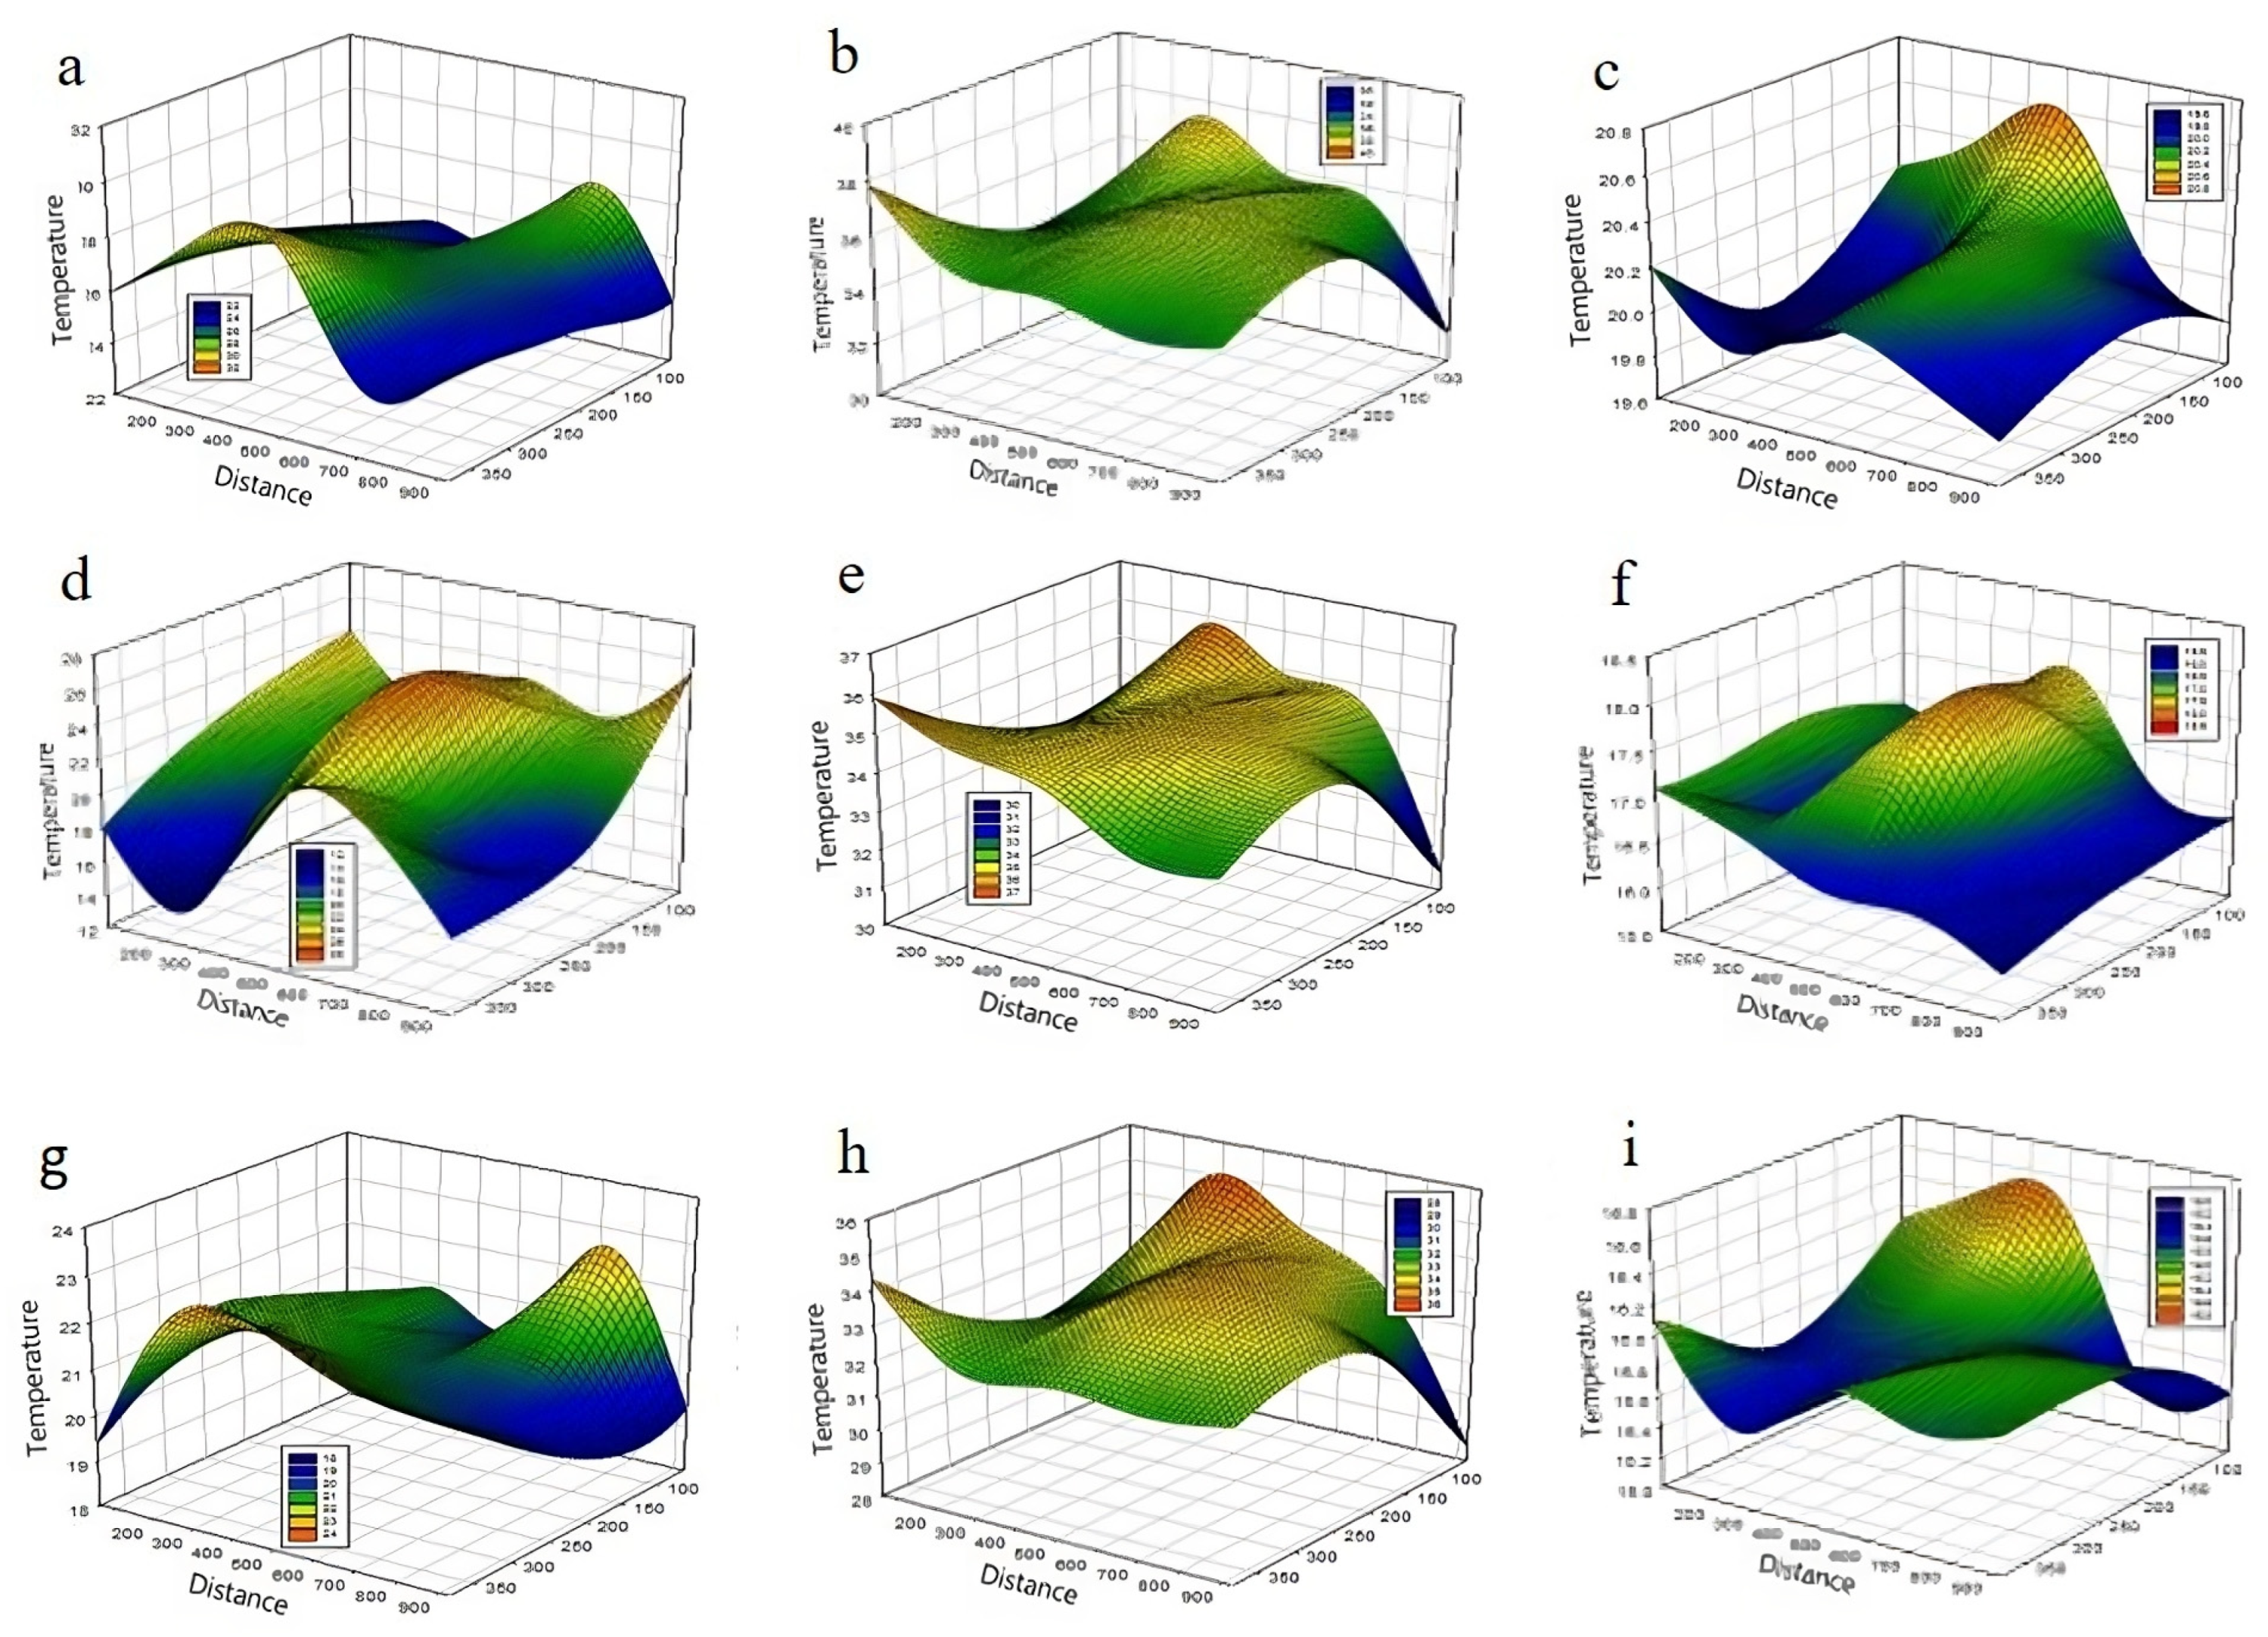
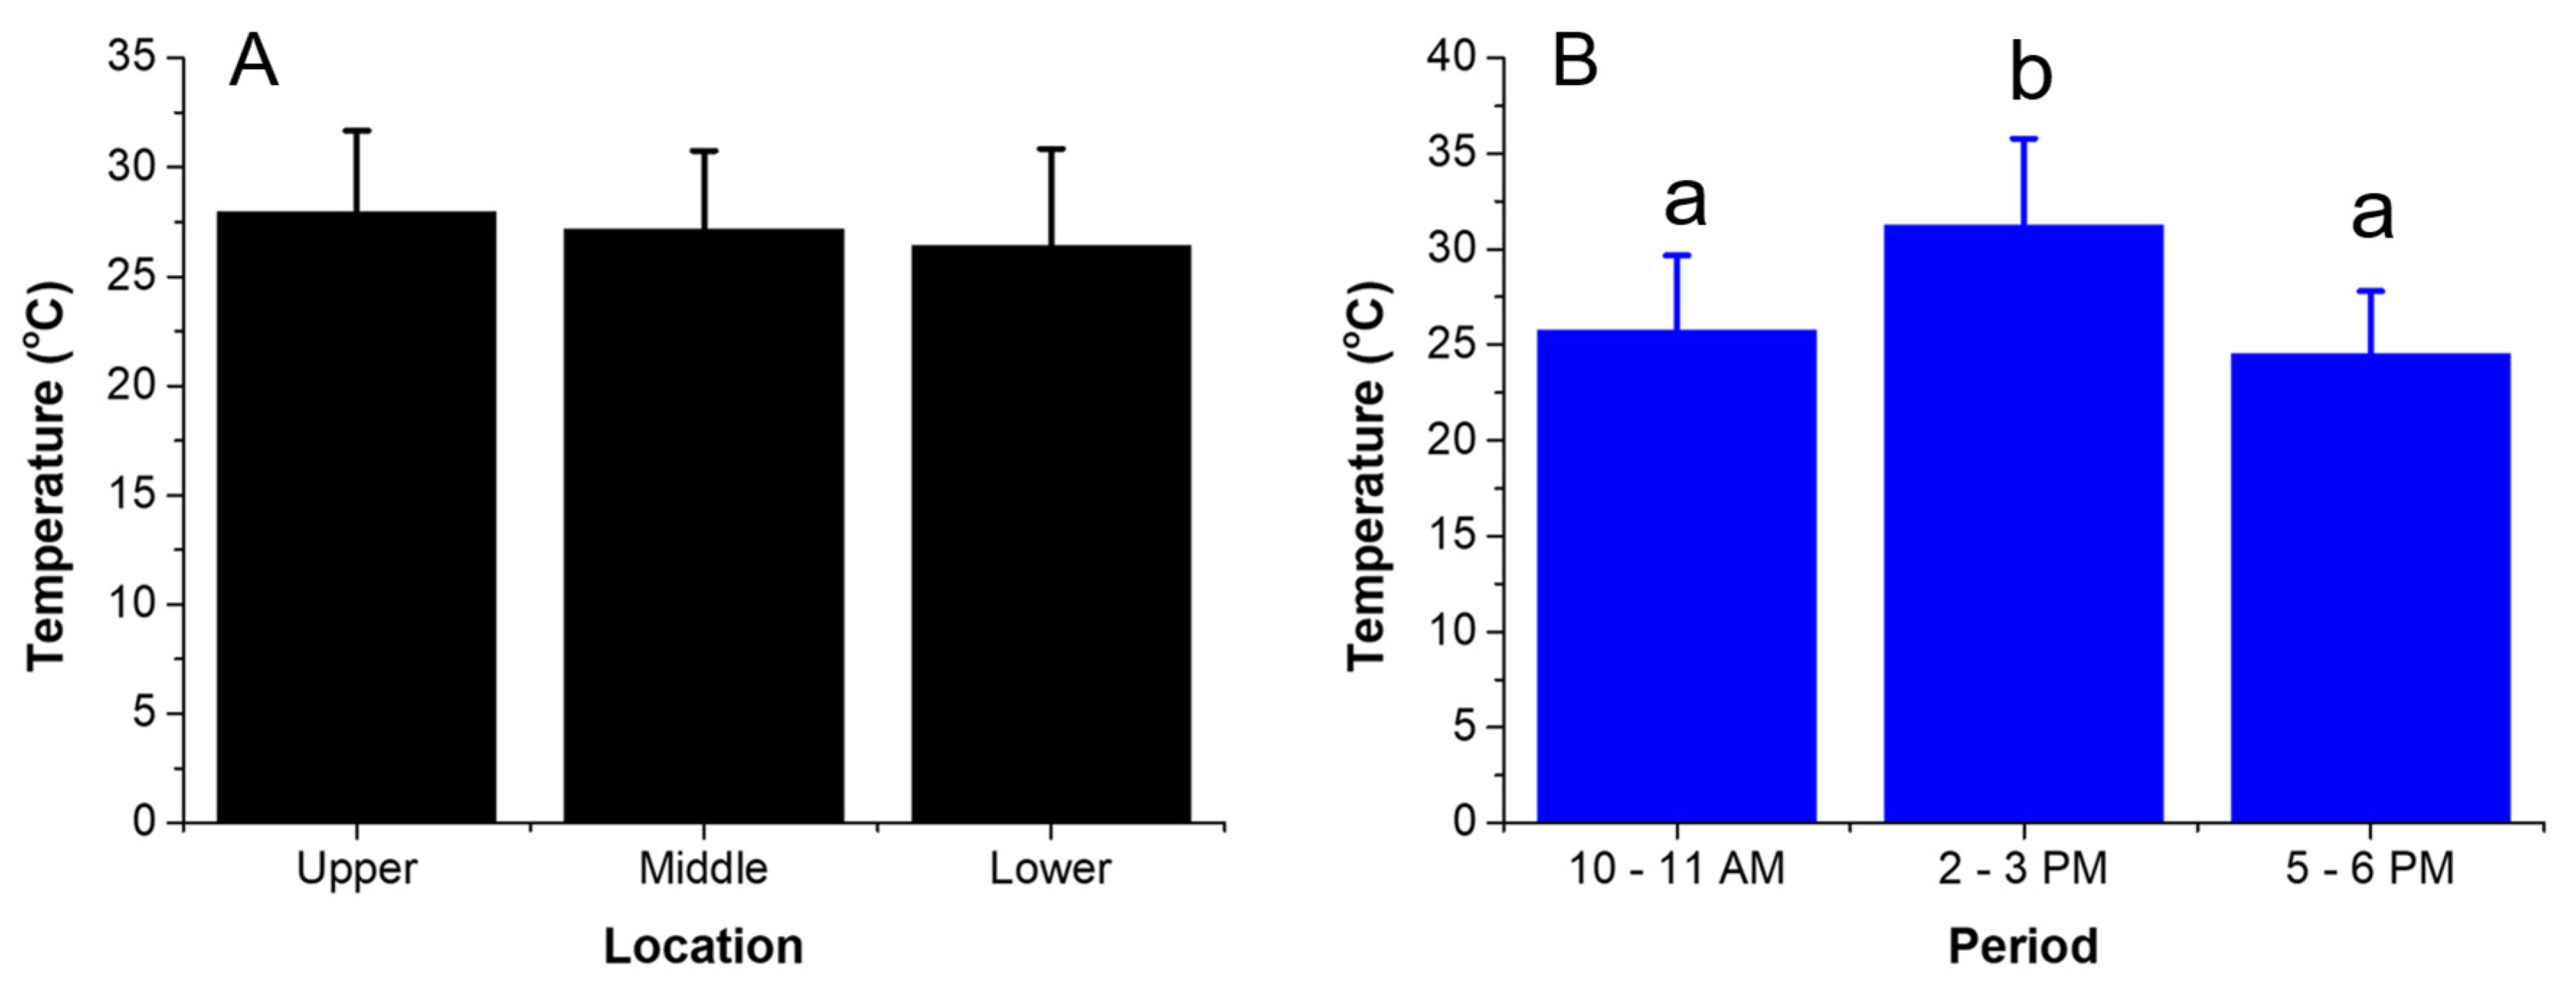
3.2. Vertical Distribution of CO2 and Temperature inside the Greenhouse in CS Conditions

The vertical distribution of carbon dioxide (CO2) in a greenhouse is primarily determined by air movement inside the greenhouse and the rate at which CO2 is introduced and removed from the greenhouse environment [59,60]. In this experiment, CO2 was supplied to the greenhouse through the HF separation process, where the air nozzle was installed at a 4 m height in the experimental greenhouse. The results of the study indicated that the concentration of CO2 was higher near the floor of a greenhouse, as it tends to accumulate in the lower levels of the greenhouse. The vertical distribution of CO2 concentrations during the CS period is presented in Figure 8. According to the layers, relatively high CO2 concentrations were found at the lower level (990.62 ± 111.34 ppm), and the lowest CO2 concentrations were found in the upper layer (880.68 ± 121.24 ppm) in the experimental greenhouse (Figure 9). In general, the CO2 concentrations during the CS condition in the lower layer were higher than the upper layer, and the average CO2 concentration in the lower layer was 10 percent higher than the upper layer. A similar result was also noted by Critten [61]. One of the main reasons behind this may be that CO2 is denser than air and tends to accumulate in the lower levels of the greenhouse due to the natural flow of air. Moreover, the concentration of CO2 tends to be higher near the floor of a greenhouse, while the temperature tends to be warmer near the top, due to the trapping of solar radiation by the transparent walls and roof [62]. Previous studies [63,64] also found that the average CO2 concentration in the lower layer was 5 to 15 percent higher than in the upper layer, which aligns with the findings of our current study. However, according to the analysis of variance, the changes in CO2 concentration among the three layers of the greenhouse were statistically insignificant (p > 0.05) (Figure 9).
In addition, the CO2 concentration was relatively higher in the evening time (5–6 p.m.) compared to the morning time (10–11 a.m.) (Figure 9). The maximum CO2 concentration was recorded in the evening, which was 1−5 percent more than in the morning time. In this experiment, CO2 was supplied to the greenhouse in the morning using the HF membrane on each experimental day and continued into the evening. This could have occurred due to the residual CO2 concentration that remained after the ventilation process with continuous supplied CO2 in the greenhouse. Titus and Wendlberger [62] also found variations in CO2 concentration in a greenhouse at different times on the same day. Moreover, the changes in the CO2 concentration in the three periods were statistically insignificant (Figure 9).
The vertical distribution of air temperature in a greenhouse is affected by a number of factors, including the intensity of solar radiation, the amount of insulation provided by the greenhouse structure and materials, and the rate of heat loss through convection and conduction [65,66]. The current study showed that the air temperature was higher close to the top layer in the greenhouse during the CS condition (Figure 10). According to layers, a relatively high air temperature was recorded at the upper layer (32.11 ± 4.87 °C), and the lowest air temperature was recorded at the lower layer (23.95 ± 3.92 °C) in the experimental greenhouse (Figure 11). The average air temperature in the upper layer was 3 to 10 percent higher than in the lower layer, which is consistent with previous research [67,68]. Hao et al. [66] studied a greenhouse covered with glass and found that the air temperature in the upper layer was approximately 7 percent higher compared to the lower layer. Generally, the temperature inside a greenhouse tends to be warmer near the top due to the trapping of solar radiation by the transparent walls and roof [69]. This can lead to temperature gradients within the greenhouse, with the warmest temperatures occurring near the top and cooler temperatures near the bottom. The temperature difference between the top and bottom of a greenhouse can be quite significant, depending on the design and location of the greenhouse and the length of the day [70]. However, the changes in air temperature among the three layers of the greenhouse were statistically insignificant (p > 0.05) (Figure 11).
Moreover, according to different time intervals within the same day, the current study found that the air temperature in the afternoon (2–3 p.m.) was relatively higher compared to the morning and evening inside the greenhouse. The average maximum temperature was recorded in the afternoon, which was 15 to 30 percent higher compared to morning and evening time. Similar findings have also been observed in other studies. Kuroyanagi et al. [71] found that in a greenhouse covered by plastic sheets, 12 to 24 percent temperature variations were found according to different time intervals within the same day, and the maximum temperature reading was counted in the afternoon. Several factors can cause the air temperature inside a greenhouse to be higher at noon compared to morning and evening, such as the sun’s rays being more directly angled onto the greenhouse at noon, which can cause the temperature inside the greenhouse to rise [72]. Moreover, Amir et al. [73] found that air temperature increases inside the greenhouse as the day progresses, even if the greenhouse is properly ventilated. However, as the sun sets and the greenhouse cools down in the evening, the air temperature generally decreases [73]. In addition to these factors, the outside environment can cause variations in the temperature inside the greenhouse on the same day [74].

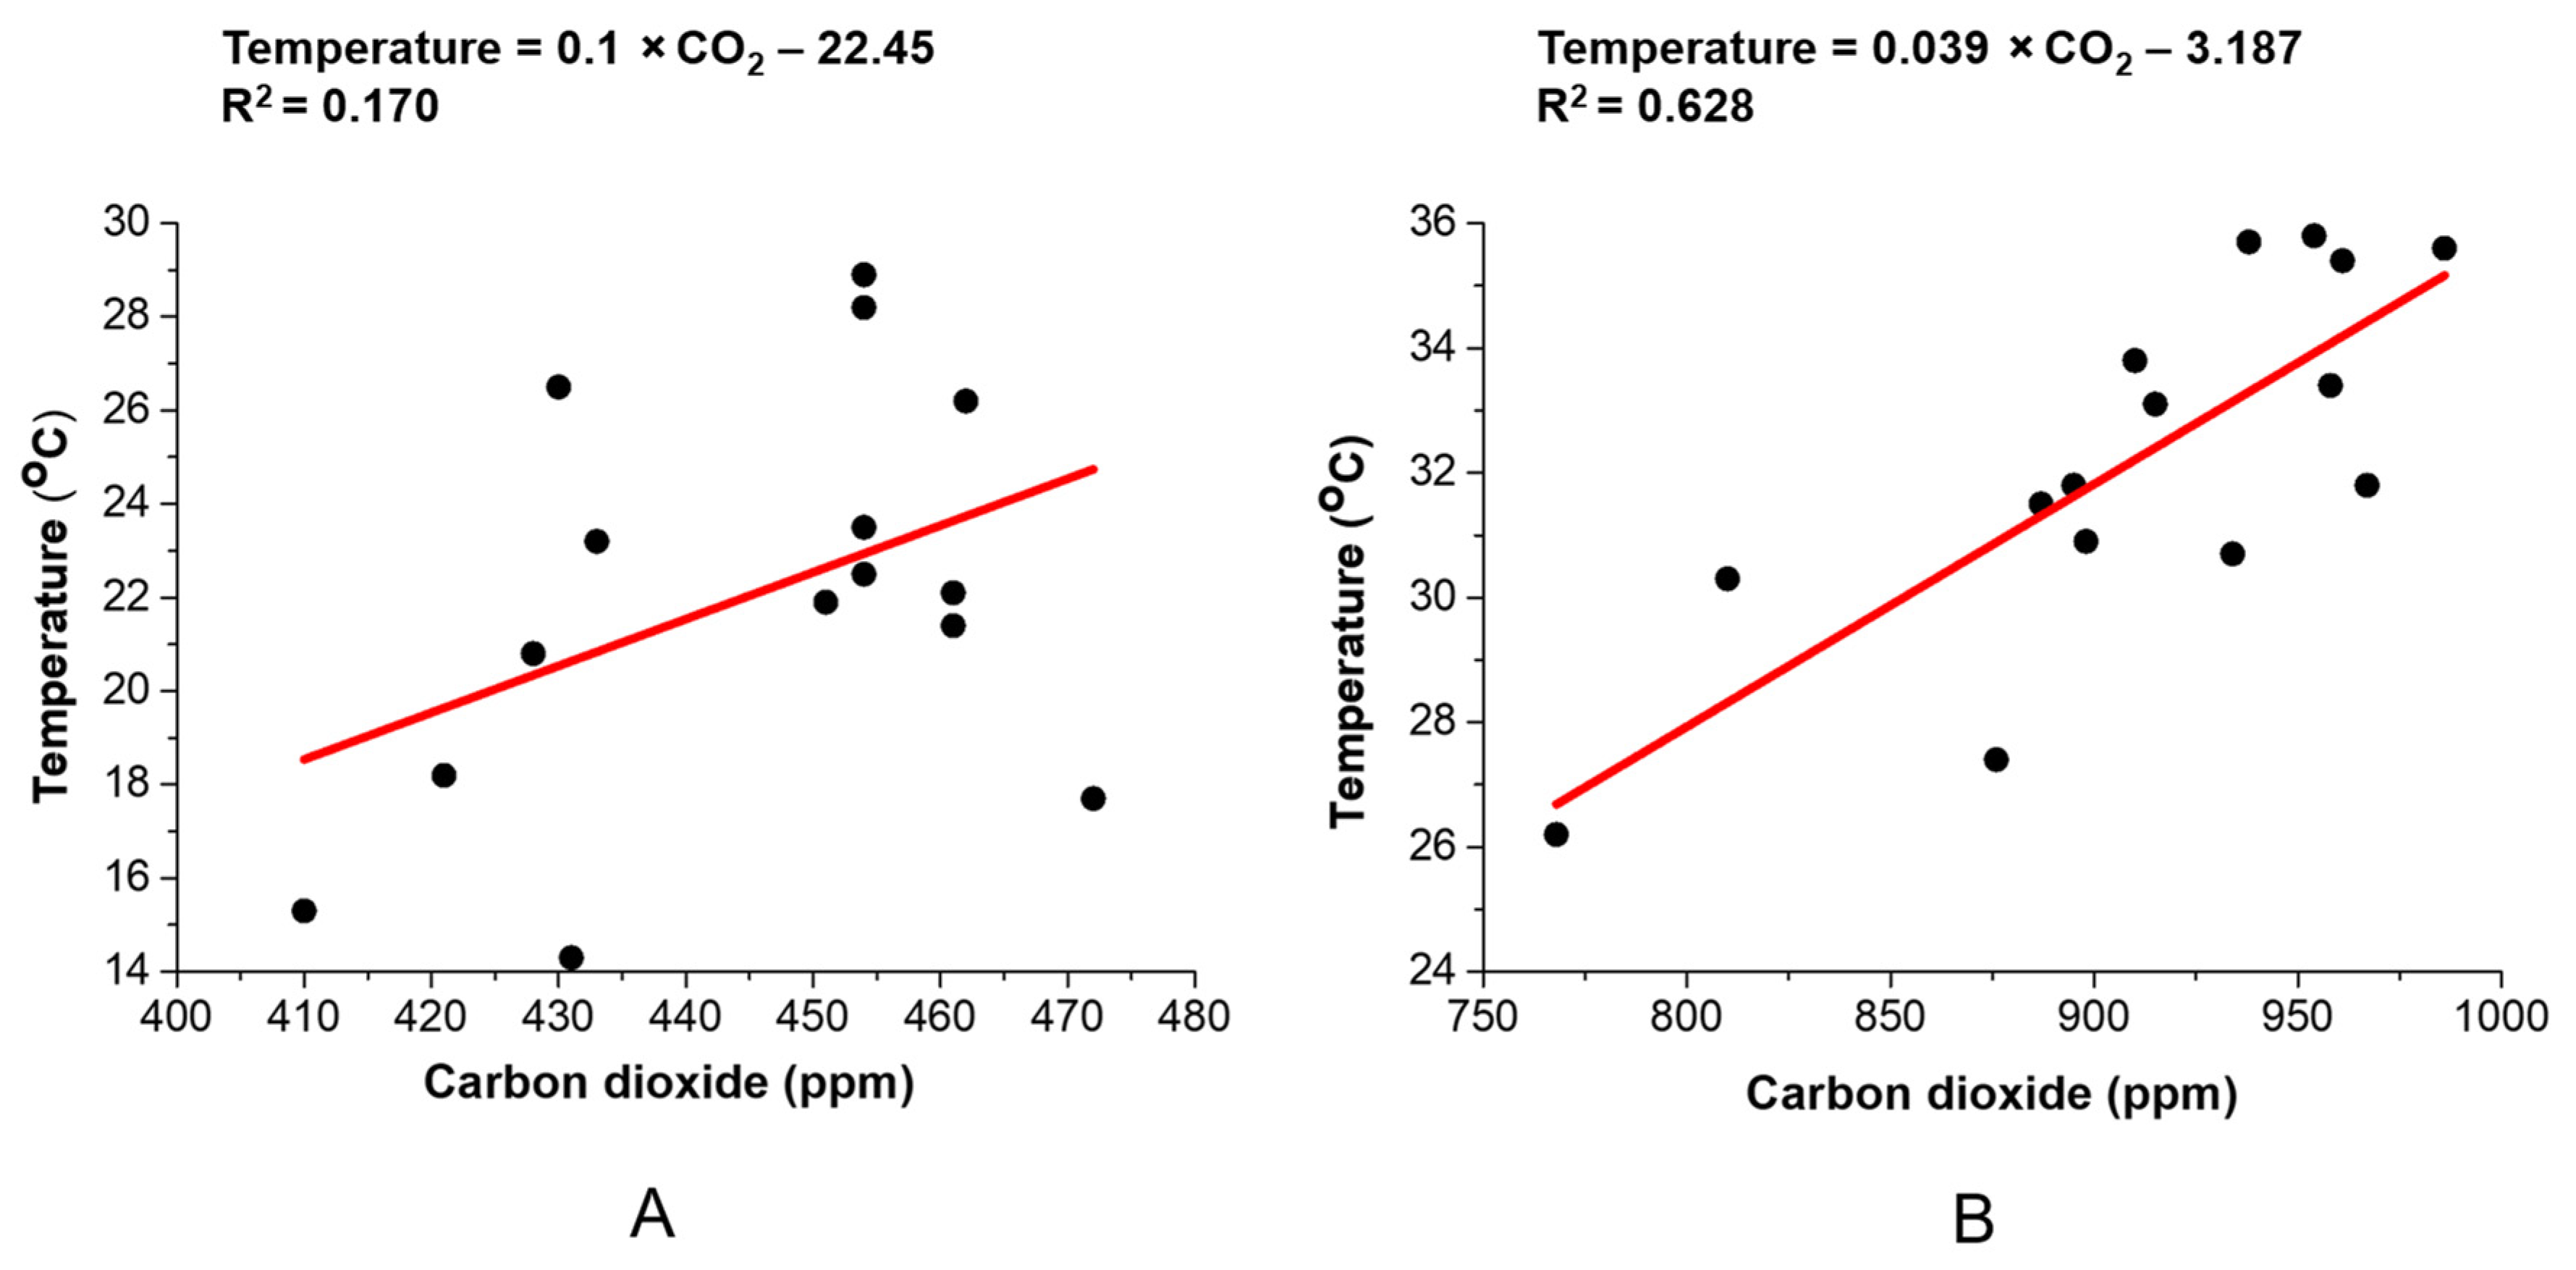
3.3. Relationship between CO2 and Temperature Variation inside the Greenhouse

In a greenhouse, the concentration of CO2 can affect the temperature inside the greenhouse; generally, increasing the concentration of CO2 inside the greenhouse can lead to an increase in temperature. However, the relationship between CO2 concentration and temperature variation inside a greenhouse can be complex and depends on several factors, such as the size and design of the greenhouse, the amount of sunlight it receives, and the presence of other greenhouse gases [59]. In addition, the temperature inside a greenhouse can be affected by external factors, such as the ambient temperature and humidity outside the greenhouse [69].
It is important to note that the relationship between CO2 and temperature in a greenhouse may not be linear, meaning that the temperature may not increase by a fixed amount for every increase in CO2 concentration. Instead, the temperature may increase more at lower CO2 concentrations and level off or even decrease at higher CO2 concentrations [75]. In this current study, we supplied CO2 inside the greenhouse using HF membrane systems to assess the level of changes in CO2 concentration along with air temperature. Regression analysis was conducted to observe the relationship between the CO2 concentration and temperature during the WCS and CS conditions. The average data of CO2 and temperature for the first 15 days (WCS condition) showed a somewhat positive linear relationship (R2 = 0.170); however, the next 15 days’ data (CS condition) showed a significantly positive correlation (R2 = 0.628) (Figure 12). One of the main reasons for this phenomenon could be the tendency of CO2 to absorb thermal energy, which contributes to the warming of the greenhouse. Similarly, Jin et al. [63] found that the air temperature inside a greenhouse increased with the increase in the CO2 concentration, where a coefficient of determination (R2) of approximately 68.4% was suitable for describing the relationship. However, an inverse relationship was observed between CO2 and temperature during the layer-wise analysis in the current study. According to the layer-wise analysis, the CO2 concentration was low in the upper layer inside the greenhouse, where the temperature was high in the daytime. This opposite relation between the two factors may be due to CO2 being denser than air and tending to accumulate in the lower levels of the greenhouse due to the natural flow of air and the location of the ventilation system, which was in the upper part of the greenhouse.

3.4. Implications and Limitations of HF Applications in the Enhancement of CO2 and Temperature in Greenhouse

The current study was conducted in two experimental conditions (WCS and CS) to observe the variation of CO2 and temperature inside the greenhouse. Based on the results obtained in this study, high CO2 concentrations and temperatures were obtained during the application of CO2 to the greenhouse using the HF membrane systems (CS condition). The potential of HF membrane technology has been noted in several studies for different applications. Its development has been driven by customer demand and has primarily focused on using air to produce high-purity CO2 for the horticultural industry to increase crop yields. Results from several studies showed that the concentration of carbon dioxide increased to enhance plant growth in a greenhouse. This is because the increased concentration of CO2 allows the plants to absorb more of this gas, which can help to increase the rate of photosynthesis and ultimately lead to increased plant growth [59]. Additionally, increasing the concentration of CO2 in a greenhouse also helps to improve the quality of certain crops, such as tomatoes, by increasing their sweetness and flavor [76]. However, the increase in yield will depend on various factors, including the type of crop being grown, the initial CO2 concentration, and the rate at which the CO2 is added [77,78]. Nevertheless, it is generally accepted that increasing the CO2 concentration to approximately 500–800 ppm can lead to significant increases in crop yield, with some studies reporting increases of up to 25% for certain crops [76]. It is worth noting, however, that the optimal CO2 concentration for plant growth will vary depending on the specific needs of the plants being grown.
Apart from CO2, the temperature is the other most influential factor for crop cultivation during the winter season, as it can affect the rate at which plants grow, their yields, and their overall health [79]. For example, if the temperature is too low, plants may grow more slowly or become stunted, resulting in lower yields. On the other hand, if the temperature is too high, plants may become stressed and more susceptible to diseases and pests [79]. Therefore, proper temperature management is crucial for successful greenhouse crop cultivation. There are several ways to maintain a consistent temperature in a greenhouse for crop cultivation, including insulation, heating systems, ventilation, covering materials, etc. [80]. Among the technologies, heating systems have commonly been used to control the temperature in a greenhouse during the winter season. However, heating systems are expensive to install and operate, which is a significant burden on the financial resources of the farmer [80]. Moreover, if the temperature inside the greenhouse rises too quickly or becomes too high, plants may become stressed, which can affect their growth and development.
By addressing these issues, the HF membrane system could be a useful technology for enhancing CO2 along with air temperature for greenhouse crop cultivation. In this study, we used a membrane system to separate CO2 from the air. The CO2 was then collected and used to enrich the greenhouse atmosphere, which can promote plant growth. The hollow fiber membrane system can be an effective technology for enhancing the CO2 and air temperature in a greenhouse because it allows farmers to control the levels of CO2 and temperature within the greenhouse, creating optimal conditions for their crops to thrive. In addition to enhancing CO2 levels, the hollow fiber membrane system can also be used to regulate the temperature inside the greenhouse. By capturing and releasing CO2 as needed, the system can help to maintain a consistent temperature within the greenhouse, even in changing weather conditions in the outside environment. This can be especially useful in the winter when the outside air temperature may be too cold for many crops to survive.
However, the limitations of the HF system in this study were pointed out. The HF system used in this study has some uncertainties regarding cost, maintenance, and application. The hollow fiber membrane system can be expensive to install and operate, which may be a burden on the financial resources of the farmer. Moreover, the system requires regular maintenance, such as cleaning and replacement of the fibers, which can be time-consuming and costly. In addition, the system may not be suitable for all types of crops in greenhouse environments. Therefore, further experiments need to be conducted with different crop types to find possible solutions to overcome these limitations.

4. Conclusions

In this study, we examined the effect of adding CO2 to a greenhouse using a hollow fiber membrane system on the concentration of CO2 and air temperature inside the greenhouse. The experiment was conducted over a period of 30 days, with the first 15 days serving as the control condition (WSC) and the remaining 15 days serving as the treatment condition (CS) during which CO2 was added to the greenhouse using the HF system. The results showed that the concentration of CO2 and the air temperature inside the greenhouse were significantly higher during the CS condition compared to the WSC condition. In addition, the relationship between average CO2 concentration and temperature data inside the greenhouse was found to be positive during the CS condition, with a coefficient of determination (R2) of 0.628. However, when analyzing the data by layer, we observed an inverse relationship between the CO2 concentration and temperature, with lower CO2 concentrations found at the upper layer where the temperature was higher. The inverse relationship between the CO2 concentration and temperature in the greenhouse may be due to CO2 being denser than air and therefore tending to accumulate in the lower levels of the greenhouse due to the natural flow of air and the location of the ventilation system in the upper part of the greenhouse. The results of this study suggest that using an HF membrane system to add CO2 to a greenhouse could be an effective way to enhance the CO2 concentration and temperature inside the greenhouse, which can, in turn, lead to improved plant growth. However, the system has certain limitations, such as cost and maintenance, which need to be considered before implementing it on a larger scale. Further research is required in order to assess the effectiveness of the HF system for different types of crops under different greenhouse conditions.

Author Contributions

N.E.K. conceived and designed the experiment, performed the experiment, analyzed and interpreted the data, and wrote the paper. H.T.K. and J.K.B. supervised and reviewed and edited the article. All authors have read and agreed to the published version of the manuscript.

Funding

This research was financially supported by the Korea Institute of Planning and Evaluation for Technology in Food, Agriculture, Forestry and Fisheries (IPET) through the Agriculture, Food and Rural Affairs Convergence Technologies Program for Educating Creative Global Leaders, funded by the Ministry of Agriculture, Food and Rural Affairs (MAFRA) (717001-7).

Institutional Review Board Statement

Not applicable.

Informed Consent Statement

Not applicable.

Data Availability Statement

The datasets generated during and/or analyzed during the current study are available from the corresponding author upon reasonable request.

Conflicts of Interest

The authors declare no conflict of interest.

References

  1. Danyagri, G.; Dang, Q.-L. Effects of Elevated [CO2] and Low Soil Moisture on the Physiological Responses of Mountain Maple (Acer spicatum L.) Seedlings to Light. PLoS ONE 2013, 8, e76586. [Google Scholar] [CrossRef]
  2. Bhattacharyya, S.S.; Leite, F.F.G.D.; Adeyemi, M.A.; Sarker, A.J.; Cambareri, G.S.; Faverin, C.; Tieri, M.P.; Castillo-Zacarías, C.; Melchor-Martínez, E.M.; Iqbal, H.M.N. A Paradigm Shift to CO2 Sequestration to Manage Global Warming–With the Emphasis on Developing Countries. Sci. Total Environ. 2021, 790, 148169. [Google Scholar] [CrossRef] [PubMed]
  3. Xu, M. The Optimal Atmospheric CO2 Concentration for the Growth of Winter Wheat (Triticum aestivum). J. Plant Physiol. 2015, 184, 89–97. [Google Scholar] [CrossRef]
  4. Allan, R.P.; Hawkins, E.; Bellouin, N.; Collins, B. IPCC, 2021: Summary for Policymakers; Cambridge University Press: Cambridge, UK, 2021. [Google Scholar]
  5. Smith, K.R.; Jerrett, M.; Anderson, H.R.; Burnett, R.T.; Stone, V.; Derwent, R.; Atkinson, R.W.; Cohen, A.; Shonkoff, S.B.; Krewski, D. Health and Climate Change 5 Public Health Benefits of Strategies to Reduce Greenhouse-Gas Emissions: Health Implications of Short-Lived Greenhouse Pollutants. Lancet 2009, 374, 2091–2103. [Google Scholar] [CrossRef] [PubMed]
  6. White, C.M.; Strazisar, B.R.; Granite, E.J.; Hoffman, J.S.; Pennline, H.W. Separation and Capture of CO2 from Large Stationary Sources and Sequestration in Geological Formations—Coalbeds and Deep Saline Aquifers. J. Air Waste Manag. Assoc. 2003, 53, 645–715. [Google Scholar] [CrossRef]
  7. Chow, J.C.; Watson, J.G.; Herzog, A.; Benson, S.M.; Hidy, G.M.; Gunter, W.D.; Penkala, S.J.; White, C.M. Separation and Capture of CO2 from Large Stationary Sources and Sequestration in Geological Formations. J. Air Waste Manag. Assoc. 2003, 53, 1172–1182. [Google Scholar] [CrossRef] [PubMed]
  8. Yan, S.; Fang, M.; Zhang, W.; Zhong, W.; Luo, Z.; Cen, K. Comparative Analysis of CO2 Separation from Flue Gas by Membrane Gas Absorption Technology and Chemical Absorption Technology in China. Energy Convers. Manag. 2008, 49, 3188–3197. [Google Scholar] [CrossRef]
  9. Zheng, L. Oxy-Fuel Combustion for Power Generation and Carbon Dioxide (CO2) Capture; Elsevier: Amsterdam, The Netherlands, 2011; ISBN 0857090984. [Google Scholar]
  10. Styring, P.; Jansen, D.; De Coninick, H.; Reith, H.; Armstrong, K. Carbon Capture and Utilisation in the Green Economy; Centre for Low Carbon Futures: New York, NY, USA, 2011; ISBN 0957258801. [Google Scholar]
  11. Ma, X.; Zhang, X.; Tian, D. Farmland Degradation Caused by Radial Diffusion of CO2 Leakage from Carbon Capture and Storage. J. Clean. Prod. 2020, 255, 120059. [Google Scholar] [CrossRef]
  12. Tcvetkov, P. Public Perception of Carbon Capture and Storage: A State-of-the-Art Overview. Heliyon 2019, 5, e02845. [Google Scholar] [CrossRef]
  13. Arning, K.; Offermann-van Heek, J.; Linzenich, A.; Kätelhön, A.; Sternberg, A.; Bardow, A.; Ziefle, M. Same or Different? Insights on Public Perception and Acceptance of Carbon Capture and Storage or Utilization in Germany. Energy Policy 2019, 125, 235–249. [Google Scholar] [CrossRef]
  14. Vinca, A.; Rottoli, M.; Marangoni, G.; Tavoni, M. The Role of Carbon Capture and Storage Electricity in Attaining 1.5 and 2 C. Int. J. Greenh. Gas Control 2018, 78, 148–159. [Google Scholar] [CrossRef]
  15. Qin, Z.; Chen, J.; Xie, X.; Luo, X.; Su, T.; Ji, H. CO2 Reforming of CH4 to Syngas over Nickel-Based Catalysts. Environ. Chem. Lett. 2020, 18, 997–1017. [Google Scholar] [CrossRef]
  16. Harper, A.B.; Powell, T.; Cox, P.M.; House, J.; Huntingford, C.; Lenton, T.M.; Sitch, S.; Burke, E.; Chadburn, S.E.; Collins, W.J. Land-Use Emissions Play a Critical Role in Land-Based Mitigation for Paris Climate Targets. Nat. Commun. 2018, 9, 2938. [Google Scholar] [CrossRef] [PubMed]
  17. Oni, B.A.; Oziegbe, O.; Olawole, O.O. Significance of Biochar Application to the Environment and Economy. Ann. Agric. Sci. 2019, 64, 222–236. [Google Scholar] [CrossRef]
  18. Osman, A.I.; Farrell, C.; Al-Muhtaseb, A.H.; Harrison, J.; Rooney, D.W. The Production and Application of Carbon Nanomaterials from High Alkali Silicate Herbaceous Biomass. Sci. Rep. 2020, 10, 2563. [Google Scholar] [CrossRef] [PubMed]
  19. Fuss, S.; Lamb, W.F.; Callaghan, M.W.; Hilaire, J.; Creutzig, F.; Amann, T.; Beringer, T.; de Oliveira Garcia, W.; Hartmann, J.; Khanna, T. Negative Emissions—Part 2: Costs, Potentials and Side Effects. Environ. Res. Lett. 2018, 13, 63002. [Google Scholar] [CrossRef]
  20. Villa, J.A.; Bernal, B. Carbon Sequestration in Wetlands, from Science to Practice: An Overview of the Biogeochemical Process, Measurement Methods, and Policy Framework. Ecol. Eng. 2018, 114, 115–128. [Google Scholar] [CrossRef]
  21. Gallant, K.; Withey, P.; Risk, D.; van Kooten, G.C.; Spafford, L. Measurement and Economic Valuation of Carbon Sequestration in Nova Scotian Wetlands. Ecol. Econ. 2020, 171, 106619. [Google Scholar] [CrossRef]
  22. Fawzy, S.; Osman, A.I.; Doran, J.; Rooney, D.W. Strategies for Mitigation of Climate Change: A Review. Environ. Chem. Lett. 2020, 18, 2069–2094. [Google Scholar] [CrossRef]
  23. Wong, S.; Yuan, H.; Gunter, W.D.; Zhou, Z.; Feng, X. CO2 Separation for Enhanced Coalbed Methane Recovery. In Proceedings of the International Symposium on Ecomaterials and Ecoprocesses 2003: The 42. Annual Conference of Metallurgists of CIM in Conjunction with the 33. Annual Hydrometallurgical Meeting of the Metallurgical Society of CIM, 2003 TMS Fall Extraction, Vancouver, BC, Canada, 24–27 August 2003. [Google Scholar]
  24. Flesher, J.R. Pebax® Polyether Block Amide—A New Family of Engineering Thermoplastic Elastomers. In High Performance Polymers: Their Origin and Development; Springer: Berlin/Heidelberg, Germany, 1986; pp. 401–408. [Google Scholar]
  25. Hasse, D.; Kulkarni, S.; Sanders, E.; Corson, E.; Tranier, J.-P. CO2 Capture by Sub-Ambient Membrane Operation. Energy Procedia 2013, 37, 993–1003. [Google Scholar] [CrossRef] [Green Version]
  26. Uragami, T.; Naito, Y.; Sugihara, M. Studies on Synthesis and Permeability of Special Polymer Membranes. Polym. Bull. 1981, 4, 617–622. [Google Scholar] [CrossRef]
  27. McCutcheon, J.R.; Elimelech, M. Modeling Water Flux in Forward Osmosis: Implications for Improved Membrane Design. AIChE J. 2007, 53, 1736–1744. [Google Scholar] [CrossRef]
  28. Tang, C.Y.; She, Q.; Lay, W.C.L.; Wang, R.; Fane, A.G. Coupled Effects of Internal Concentration Polarization and Fouling on Flux Behavior of Forward Osmosis Membranes during Humic Acid Filtration. J. Memb. Sci. 2010, 354, 123–133. [Google Scholar] [CrossRef]
  29. Liu, L.; Chakma, A.; Feng, X. Preparation of Hollow Fiber Poly(Ether Block Amide)/Polysulfone Composite Membranes for Separation of Carbon Dioxide from Nitrogen. Chem. Eng. J. 2004, 105, 43–51. [Google Scholar] [CrossRef]
  30. Xu, Y.; Peng, X.; Tang, C.Y.; Fu, Q.S.; Nie, S. Effect of Draw Solution Concentration and Operating Conditions on Forward Osmosis and Pressure Retarded Osmosis Performance in a Spiral Wound Module. J. Memb. Sci. 2010, 348, 298–309. [Google Scholar] [CrossRef]
  31. Mallevialle, J.; Odendaal, P.E.; Wiesner, M.R. Water Treatment Membrane Processes; American Water Works Association: Austin, TX, USA, 1996; ISBN 0070015597. [Google Scholar]
  32. Wang, R.; Shi, L.; Tang, C.Y.; Chou, S.; Qiu, C.; Fane, A.G. Characterization of Novel Forward Osmosis Hollow Fiber Membranes. J. Memb. Sci. 2010, 355, 158–167. [Google Scholar] [CrossRef]
  33. Kreulen, H.; Smolders, C.A.; Versteeg, G.F.; van Swaaij, W.P.M. Microporous Hollow Fibre Membrane Modules as Gas-Liquid Contactors Part 2. Mass Transfer with Chemical Reaction. J. Memb. Sci. 1993, 78, 217–238. [Google Scholar] [CrossRef]
  34. Xue, J.; Schulz, A.; Wang, H.; Feldhoff, A. The Phase Stability of the Ruddlesden-Popper Type Oxide (Pr0.9La0.1)2.0Ni0.74Cu0.21Ga0.05O4+δ in an Oxidizing Environment. J. Membr. Sci. 2016, 497, 357–364. [Google Scholar] [CrossRef]
  35. Agrahari, G.K.; Verma, N.; Bhattacharya, P.K. Application of Hollow Fiber Membrane Contactor for the Removal of Carbon Dioxide from Water under Liquid–Liquid Extraction Mode. J. Memb. Sci. 2011, 375, 323–333. [Google Scholar] [CrossRef]
  36. Serbanescu, O.S.; Voicu, S.I.; Thakur, V.K. Polysulfone Functionalized Membranes: Properties and Challenges. Mater. Today Chem. 2020, 17, 100302. [Google Scholar] [CrossRef]
  37. Julian, H.; Wenten, I.G. Polysulfone Membranes for CO2/CH4 Separation: State of the Art. IOSR J. Eng. 2012, 2, 484–495. [Google Scholar] [CrossRef]
  38. Mohamad, M.B.; Fong, Y.Y.; Shariff, A. Gas Separation of Carbon Dioxide from Methane Using Polysulfone Membrane Incorporated with Zeolite-T. Procedia Eng. 2016, 148, 621–629. [Google Scholar] [CrossRef]
  39. Won, W.; Feng, X.; Lawless, D. Pervaporation with Chitosan Membranes: Separation of Dimethyl Carbonate/Methanol/Water Mixtures. J. Memb. Sci. 2002, 209, 493–508. [Google Scholar] [CrossRef]
  40. Peng, N.; Widjojo, N.; Sukitpaneenit, P.; Teoh, M.M.; Lipscomb, G.G.; Chung, T.-S.; Lai, J.-Y. Evolution of Polymeric Hollow Fibers as Sustainable Technologies: Past, Present, and Future. Prog. Polym. Sci. 2012, 37, 1401–1424. [Google Scholar] [CrossRef]
  41. Harasimowicz, M.; Orluk, P.; Zakrzewska-Trznadel, G.; Chmielewski, A. Application of Polyimide Membranes for Biogas Purification and Enrichment. J. Hazard. Mater. 2007, 144, 698–702. [Google Scholar] [CrossRef] [PubMed]
  42. Maraveas, C. Environmental Sustainability of Greenhouse Covering Materials. Sustainability 2019, 11, 6129. [Google Scholar] [CrossRef]
  43. Kumar, A.; Sharma, G.; Naushad, M.; Ala’a, H.; García-Peñas, A.; Mola, G.T.; Si, C.; Stadler, F.J. Bio-Inspired and Biomaterials-Based Hybrid Photocatalysts for Environmental Detoxification: A Review. Chem. Eng. J. 2020, 382, 122937. [Google Scholar]
  44. La Mantia, F.P. Closed-Loop Recycling. A Case Study of Films for Greenhouses. Polym. Degrad. Stab. 2010, 95, 285–288. [Google Scholar] [CrossRef]
  45. Turner, D.A.; Williams, I.D.; Kemp, S. Greenhouse Gas Emission Factors for Recycling of Source-Segregated Waste Materials. Resour. Conserv. Recycl. 2015, 105, 186–197. [Google Scholar] [CrossRef]
  46. Hahladakis, J.N.; Velis, C.A.; Weber, R.; Iacovidou, E.; Purnell, P. An Overview of Chemical Additives Present in Plastics: Migration, Release, Fate and Environmental Impact during Their Use, Disposal and Recycling. J. Hazard. Mater. 2018, 344, 179–199. [Google Scholar] [CrossRef]
  47. Papadopoulos, A.P.; Hao, X. Effects of Three Greenhouse Cover Materials on Tomato Growth, Productivity, and Energy Use. Sci. Hortic. 1997, 70, 165–178. [Google Scholar] [CrossRef]
  48. Miller, S.A. Natural Fiber Textile Reinforced Bio-Based Composites: Mechanical Properties, Creep, and Environmental Impacts. J. Clean. Prod. 2018, 198, 612–623. [Google Scholar] [CrossRef]
  49. Hao, X.; Papadopoulos, A.P. Effects of Supplemental Lighting and Cover Materials on Growth, Photosynthesis, Biomass Partitioning, Early Yield and Quality of Greenhouse Cucumber. Sci. Hortic. 1999, 80, 1–18. [Google Scholar] [CrossRef]
  50. Li, X.; Zeng, L.; Zhang, N.; Zhang, X.; Song, M.; Chen, Z.; Li, Z. Effects of the Gas/Particle Flow and Combustion Characteristics on Water-Wall Temperature and Energy Conversion in a Supercritical down-Fired Boiler at Different Secondary-Air Distributions. Energy 2022, 238, 121983. [Google Scholar] [CrossRef]
  51. Korea Meteorological Agency Weather Information in Jinju Location. Available online: https://www.weather.go.kr/w/index.do (accessed on 30 November 2022).
  52. Arulmozhi, E.; Basak, J.K.; Sihalath, T.; Park, J.; Kim, H.T.; Moon, B.E. Machine Learning-Based Microclimate Model for Indoor Air Temperature and Relative Humidity Prediction in a Swine Building. Animals 2021, 11, 222. [Google Scholar] [CrossRef] [PubMed]
  53. Basak, J.K.; Eun, N.; Shihab, K.; Shahriar, A.; Paudel, B.; Eun, B. Applicability of Statistical and Machine Learning—Based Regression Algorithms in Modeling of Carbon Dioxide Emission in Experimental Pig Barns. Air Qual. Atmos. Health 2022, 15, 1899–1912. [Google Scholar] [CrossRef]
  54. Moon, T.W.; Jung, D.H.; Chang, S.H.; Son, J.E. Estimation of Greenhouse CO2 Concentration via an Artificial Neural Network That Uses Environmental Factors. Hortic. Environ. Biotechnol. 2018, 59, 45–50. [Google Scholar] [CrossRef]
  55. Kläring, H.-P.; Hauschild, C.; Heißner, A.; Bar-Yosef, B. Model-Based Control of CO2 Concentration in Greenhouses at Ambient Levels Increases Cucumber Yield. Agric. For. Meteorol. 2007, 143, 208–216. [Google Scholar] [CrossRef]
  56. Bennis, N.; Duplaix, J.; Enéa, G.; Haloua, M.; Youlal, H. Greenhouse Climate Modelling and Robust Control. Comput. Electron. Agric. 2008, 61, 96–107. [Google Scholar] [CrossRef]
  57. Lee, I.-B.; Short, T.H. Verification of Computational Fluid Dynamic Temperature Simulations in a Full-Scale Naturally Ventilated Greenhouse. Trans. ASAE 2001, 44, 119. [Google Scholar] [CrossRef]
  58. Elanchezhian, A.; Basak, J.K.; Park, J.; Khan, F.; Okyere, F.G.; Lee, Y.; Bhujel, A.; Lee, D.; Sihalath, T.; Kim, T. Evaluating Different Models Used for Predicting the Indoor Microclimatic Parameters of a Greenhouse. Appl. Ecol. Environ. Res. 2020, 18, 2141–2161. [Google Scholar] [CrossRef]
  59. Li, Y.; Ding, Y.; Li, D.; Miao, Z. Automatic Carbon Dioxide Enrichment Strategies in the Greenhouse: A Review. Biosyst. Eng. 2018, 171, 101–119. [Google Scholar] [CrossRef]
  60. Xu, S.; Zhu, X.; Li, C.; Ye, Q. Effects of CO2 Enrichment on Photosynthesis and Growth in Gerbera Jamesonii. Sci. Hortic. 2014, 177, 77–84. [Google Scholar] [CrossRef]
  61. Critten, D.L. Optimization of CO2 Concentration in Greenhouses: A Modelling Analysis for the Lettuce Crop. J. Agric. Eng. Res. 1991, 48, 261–271. [Google Scholar] [CrossRef]
  62. Titus, J.E.; Wendlberger, S.J. Gauging Submersed Plant Response to CO2 Enrichment: Pot Size Matters. Aquat. Bot. 2016, 134, 82–86. [Google Scholar] [CrossRef]
  63. Jin, C.; Du, S.; Wang, Y.; Condon, J.; Lin, X.; Zhang, Y. Carbon Dioxide Enrichment by Composting in Greenhouses and Its Effect on Vegetable Production. J. Plant Nutr. Soil Sci. 2009, 172, 418–424. [Google Scholar] [CrossRef]
  64. Zhang, Z.; Liu, L.; Zhang, M.; Zhang, Y.; Wang, Q. Effect of Carbon Dioxide Enrichment on Health-Promoting Compounds and Organoleptic Properties of Tomato Fruits Grown in Greenhouse. Food Chem. 2014, 153, 157–163. [Google Scholar] [CrossRef] [PubMed]
  65. Seginer, I.; van Straten, G.; van Beveren, P.J.M. Day-to-Night Heat Storage in Greenhouses: 2 Sub-Optimal Solution for Realistic Weather. Biosyst. Eng. 2017, 161, 188–199. [Google Scholar] [CrossRef]
  66. Hao, F.; Shen, M.; He, Y.; Feng, L. Three Dimensional Steady Simulation of Microclimate Pattern inside Single Plastic Greenhouse Using Computational Fluid Dynamics. Nongye Jixie Xuebao = Trans. Chin. Soc. Agric. Mach. 2014, 45, 297–304. [Google Scholar]
  67. Kozai, T.; Kubota, C.; Takagaki, M.; Maruo, T. Greenhouse Environment Control Technologies for Improving the Sustainability of Food Production. In Proceedings of the XXIX International Horticultural Congress on Horticulture: Sustaining Lives, Livelihoods and Landscapes (IHC2014): 1107, Brisbane, Australia, 17 August 2014; pp. 1–14. [Google Scholar]
  68. Stanghellini, C.; Incrocci, L.; Gázquez, J.C.; Dimauro, B. Carbon Dioxide Concentration in Mediterranean Greenhouses: How Much Lost Production? In Proceedings of the International Symposium on High Technology for Greenhouse System Management: Greensys2007 801, Naples, Italy, 4–6 October 2007; pp. 1541–1550. [Google Scholar]
  69. Panwar, N.L.; Kaushik, S.C.; Kothari, S. Solar Greenhouse an Option for Renewable and Sustainable Farming. Renew. Sustain. Energy Rev. 2011, 15, 3934–3945. [Google Scholar] [CrossRef]
  70. Yu, H.; Chen, Y.; Hassan, S.G.; Li, D. Prediction of the Temperature in a Chinese Solar Greenhouse Based on LSSVM Optimized by Improved PSO. Comput. Electron. Agric. 2016, 122, 94–102. [Google Scholar] [CrossRef]
  71. Kuroyanagi, T.; Yasuba, K.; Higashide, T.; Iwasaki, Y.; Takaichi, M. Efficiency of Carbon Dioxide Enrichment in an Unventilated Greenhouse. Biosyst. Eng. 2014, 119, 58–68. [Google Scholar] [CrossRef]
  72. Wang, J.; Niu, X.; Zheng, L.; Zheng, C.; Wang, Y. Wireless Mid-Infrared Spectroscopy Sensor Network for Automatic Carbon Dioxide Fertilization in a Greenhouse Environment. Sensors 2016, 16, 1941. [Google Scholar] [CrossRef]
  73. Amir, R.; Teitel, M.; Shemer, L. CO2 Enrichment in a Fan-Ventilated Greenhouse under Different Ventilation Modes. In Proceedings of the International Conference on Sustainable Greenhouse Systems-Greensys2004 691, Leuven, Belgium, 12–16 September 2004; pp. 619–624. [Google Scholar]
  74. Zeng, S.; Hu, H.; Xu, L.; Li, G. Nonlinear Adaptive PID Control for Greenhouse Environment Based on RBF Network. Sensors 2012, 12, 5328–5348. [Google Scholar] [CrossRef] [PubMed]
  75. Basak, J.K.; Qasim, W.; Okyere, F.G.; Khan, F.; Lee, Y.J.; Park, J.; Kim, H.T. Regression Analysis to Estimate Morphology Parameters of Pepper Plant in a Controlled Greenhouse System. J. Biosyst. Eng. 2019, 44, 57–68. [Google Scholar] [CrossRef]
  76. Feron, P.H.M.; Jansen, A.E. CO2 Separation with Polyolefin Membrane Contactors and Dedicated Absorption Liquids: Performances and Prospects. Sep. Purif. Technol. 2002, 27, 231–242. [Google Scholar] [CrossRef]
  77. Mohamed, S.J.; Jellings, A.J.; Fuller, M.P. Positive Effects of Elevated CO2 and Its Interaction with Nitrogen on Safflower Physiology and Growth. Agron. Sustain. Dev. 2013, 33, 497–505. [Google Scholar] [CrossRef]
  78. Basak, J.K.; Qasim, W.; Khan, F.; Okyere, F.G.; Lee, Y.; Arulmozhi, E.; Park, J.; Cho, W.; Kim, H.T. Assessment of the Effect of Dimethyl Ether (DME) Combustion on Lettuce and Chinese Cabbage Growth in Greenhouse. J. Bio-Environ. Control 2019, 28, 293–301. [Google Scholar] [CrossRef]
  79. Ainsworth, E.A.; Lemonnier, P.; Wedow, J.M. The Influence of Rising Tropospheric Carbon Dioxide and Ozone on Plant Productivity. Plant Biol. 2020, 22, 5–11. [Google Scholar] [CrossRef]
  80. Basak, J.K.; Qasim, W.; Okyere, F.G.; Khan, F.; Lee, Y.J.; Park, J.; Kim, H.T. Mitigating Chilling Stress of Pepper Plant (‘Capsicum annuum’L.) Using Dimethyl Ether Combustion Gas in Controlled Greenhouse. Aust. J. Crop Sci. 2019, 13, 1992–2002. [Google Scholar] [CrossRef]
Figure 1. Schematic diagram showing the working principle of the gas-separation membrane.
Atmosphere 14 00299 g001
Figure 2. Production system for preparation of hollow fiber membrane.
Atmosphere 14 00299 g002
Figure 3. Cross-sectional view of the hollow fiber membrane system.
Atmosphere 14 00299 g003
Figure 4. Experimental glass greenhouse used for the study with their respective dimensions.
Atmosphere 14 00299 g004
Figure 5. Membrane module and CO2 supply systems: (a) Membrane function; (b) carbon dioxide inlet.
Atmosphere 14 00299 g005
Figure 6. Measurement locations of environmental data inside the greenhouse.
Atmosphere 14 00299 g006
Figure 7. Changes in CO2 concentration and temperature inside and outside the greenhouse environment during the experimental period in WCS (1 October to 15 October) and CS conditions 16 October to 30 October).
Atmosphere 14 00299 g007
Figure 8. Changes in CO2 concentration (ppm) in upper location (in centimeters): (a) 10–11 a.m., (b) 2–3 p.m., (c) 5–6 p.m.; in middle location: (d) 10–11 a.m., (e) 2–3 p.m., (f) 5–6 p.m.; and in lower location: (g) 10–11 a.m., (h) 2–3 p.m., (i) 5–6 p.m. during the CS experimental periods.
Atmosphere 14 00299 g008
Figure 9. Data represent means and standard deviation (SD) of CO2 concentration in the experimental greenhouse for location-wise CO2 concentration variation (A) and period-wise CO2 concentration variation (B).
Atmosphere 14 00299 g009
Figure 10. Changes in air temperature (°C) in upper location (in centimeters): (a) 10–11 a.m., (b) 2–3 p.m., (c) 5–6 p.m.; in middle location: (d) 10–11 a.m., (e) 2–3 p.m., (f) 5–6 p.m.; and in lower location: (g) 10–11 a.m., (h) 2–3 p.m., (i) 5–6 p.m. during the CS experimental periods.
Atmosphere 14 00299 g010
Figure 11. Data represent means and standard deviation (SD) of air temperature in the experimental greenhouse for location-wise temperature variation (A) and period-wise temperature variation (B). Different letters above the bars (SD) denote significant differences in air temperature among the three periods at p ≤ 0.05 based on Tukey’s HSD post-hoc test.
Atmosphere 14 00299 g011
Figure 12. The relationships between CO2 concentration and air temperature inside the greenhouse during the WCS condition (A) and CS condition (B) in the experimental periods. The regression analysis of the average data of CO2 and temperature was recorded in three different layers in the experimental greenhouse.
Atmosphere 14 00299 g012
Table 1. The specification of the hollow fiber membrane system.
ParametersSpecification
Size600 × 800 × 400 (W × H × D, mm)
Range of supply gas pressure0.40–1.0 MPa
Conditions of supply gasSiloxane ≤ 0.1 ppm, H2S ≤ 3ppm
Range of operation pressure0.40–0.7 MPa
Range of operation temperature15~45 °C
Port of supply gas3/8″ Ferrel type
Port of methane recycling, CO2 exhaust6 mm tube type
Table 2. Variations of CO2 concentration and temperature inside the greenhouse and outside environment. Values represent the mean ± the standard deviation.
Period LocationCO2 Concentration (ppm)Temperature (°C)
WCS Outside448.13 ± 27.9418.27 ± 4.40
Inside445.07 ± 18.0227.18 ± 4.37
CSOutside453.93 ± 28.4918.04 ± 4.13
Inside910.47 ± 59.4429.34 ± 4.02
WCS: Without CO2 supply inside the greenhouse; CS: CO2 supply inside the greenhouse.
Disclaimer/Publisher’s Note: The statements, opinions and data contained in all publications are solely those of the individual author(s) and contributor(s) and not of MDPI and/or the editor(s). MDPI and/or the editor(s) disclaim responsibility for any injury to people or property resulting from any ideas, methods, instructions or products referred to in the content.

