1. Introduction
With every passing day, water resources across the globe are depleting and becoming contaminated. Water consumption is also increasing with the growing population, resulting in a reduction in conventional sources [
1,
2]. Climate change has also complicated the water issues. Several unconventional solutions to solve the freshwater shortage problem are being explored, leading to processes such as seawater desalination and water extraction from air.
The consumption of contaminated drinking water is hazardous to human health, and it is imperative to guarantee access to safe and clean drinking water worldwide. Recently, the United Nations World Water Development reported a shocking fact that death of children due to drinking unsafe water occurs at a staggering rate of one child per second [
3]. Water is essential for the production of food and energy. However, domestic water filters cannot eliminate all the heavy metals, bacteria, viruses, and parasites from contaminated water. This necessitates the development of techniques appropriate for arid regions, particularly those located in the remote parts of developing countries, to generate clean and safe potable drinking water, in addition to conserving both water and energy [
4,
5]. The lack of drinking water sources is a continual, severe, and common problem in Central and Southern Asia, the Middle East, and northern Africa. Several studies have indicated that this problem can be solved by applying one or more of the following methods: freshwater transportation from other locations via water trucks or other infrastructure [
6,
7], the desalination of saltwater [
8,
9,
10], or water extraction from atmospheric air [
11,
12,
13].
Freshwater transportation from other locations is not favourable because it is very expensive [
6,
7]. Moreover, saltwater desalination relies on the availability of saline water resources in arid areas, which is often rare [
8,
9,
10]. This method also requires an enormous amount of electric power to create high pressure to force the water component of the seawater to flow through a membrane. Even though freshwater transportation and seawater desalination consumes large amounts of energy and requires highly skilled operations, they are currently the primary methods for providing potable water in various regions of the world [
6,
7,
8,
9,
10]. As these two methods depend on fossil fuel consumption, they result in significant CO
2 emissions that are harmful to the environment. Furthermore, the energy required to operate the desalination plants is expensive in a majority of the locations. These disadvantages have encouraged researchers to concentrate on extracting water from air.
An infinite volume of atmospheric air is naturally available and can be considered a renewable and endless water reservoir that is available everywhere on the Earth’s surface. Water extraction from air has many benefits compared with the other two methods, as air is a clean and renewable water source [
11]. The total volume of water available in the air is 14,000 km
3, whereas the volume of freshwater available on the earth is only 1200 km
3 [
11,
14]. Although water can be extracted from air by applying various methods, the majority of them depend on cooling moist air until its temperature is below the dew point and absorbing it in a liquid or solid desiccant. Subsequently, water is recovered by heating the desiccant and condensing the evaporated water [
11,
14,
15,
16]. The selection of a suitable method for water extraction from air is considered an engineering decision that depends on different factors, such as local climatic conditions and other economic factors, including energy costs, operating costs, and capital outlay. The requirements of devices for water extraction differ in scale depending on the volume of potable water produced.
Tu and Hwang [
17] reviewed atmospheric water harvesting technologies used in various heating, ventilation, and air conditioning systems such as vapour compression cycles, TEC cooling, and adsorption/absorption cooling. Eslami et al. [
18] compared water condensates as a function of the air flow rate and current for water harvesting from humid air using TEC coolers. Asim et al. [
19] presented and discussed progress in the fields of sorbent materials and condensation with a focus on system design and future considerations to accelerate commercialization. Kode et al. [
20] performed a technoeconomic analysis of atmospheric water generated by hybrid nanofluids. They performed an energy balance on a single-point design of the system and demonstrated that a low specific energy consumption could be obtained by changing the inlet desiccant stream concentrations. Zhao et al. [
21] reported a high-efficiency water production system using atmospheric water harvesting for a wide range of relative humidity values by using a super moisture-absorbent gel. Siegel and Conser [
22] reported that water may be produced from atmospheric humidity; however, only a limited number of atmospheric water-harvesting technologies have been deployed. They established a system-level thermodynamic model of several atmospheric water harvesting pathways to clarify the important energy flows by reducing the energy required.
In some of these studies, data about the mass fraction of water or the amount of produced water were not provided. Meanwhile, some studies only used a single method of analysis. This study aims to solve this gap by using two methods of analysis to experimentally and numerically evaluate the amount of produced water. The design of an atmospheric water harvester using a TEC and its experimental testing in actual weather conditions at varying temperature and relative humidity values have been described in an earlier study [
23]. The present study takes the aforementioned study further by testing the prototype experimentally (in a climate chamber and under actual weather conditions) and numerically to measure different parameters, such as the mass fraction of water and air, temperature distribution, and velocity distribution at a constant temperature and relative humidity. Furthermore, this study attempts to (a) ascertain which of the two approaches produces a higher volume of water and (b) understand the functioning of the device for future improvements.
The remainder of this paper is organised as follows:
Section 2 describes the methodology adopted in the study.
Section 3 presents the results and discussion. Finally,
Section 4 presents the conclusions.
2. Methods
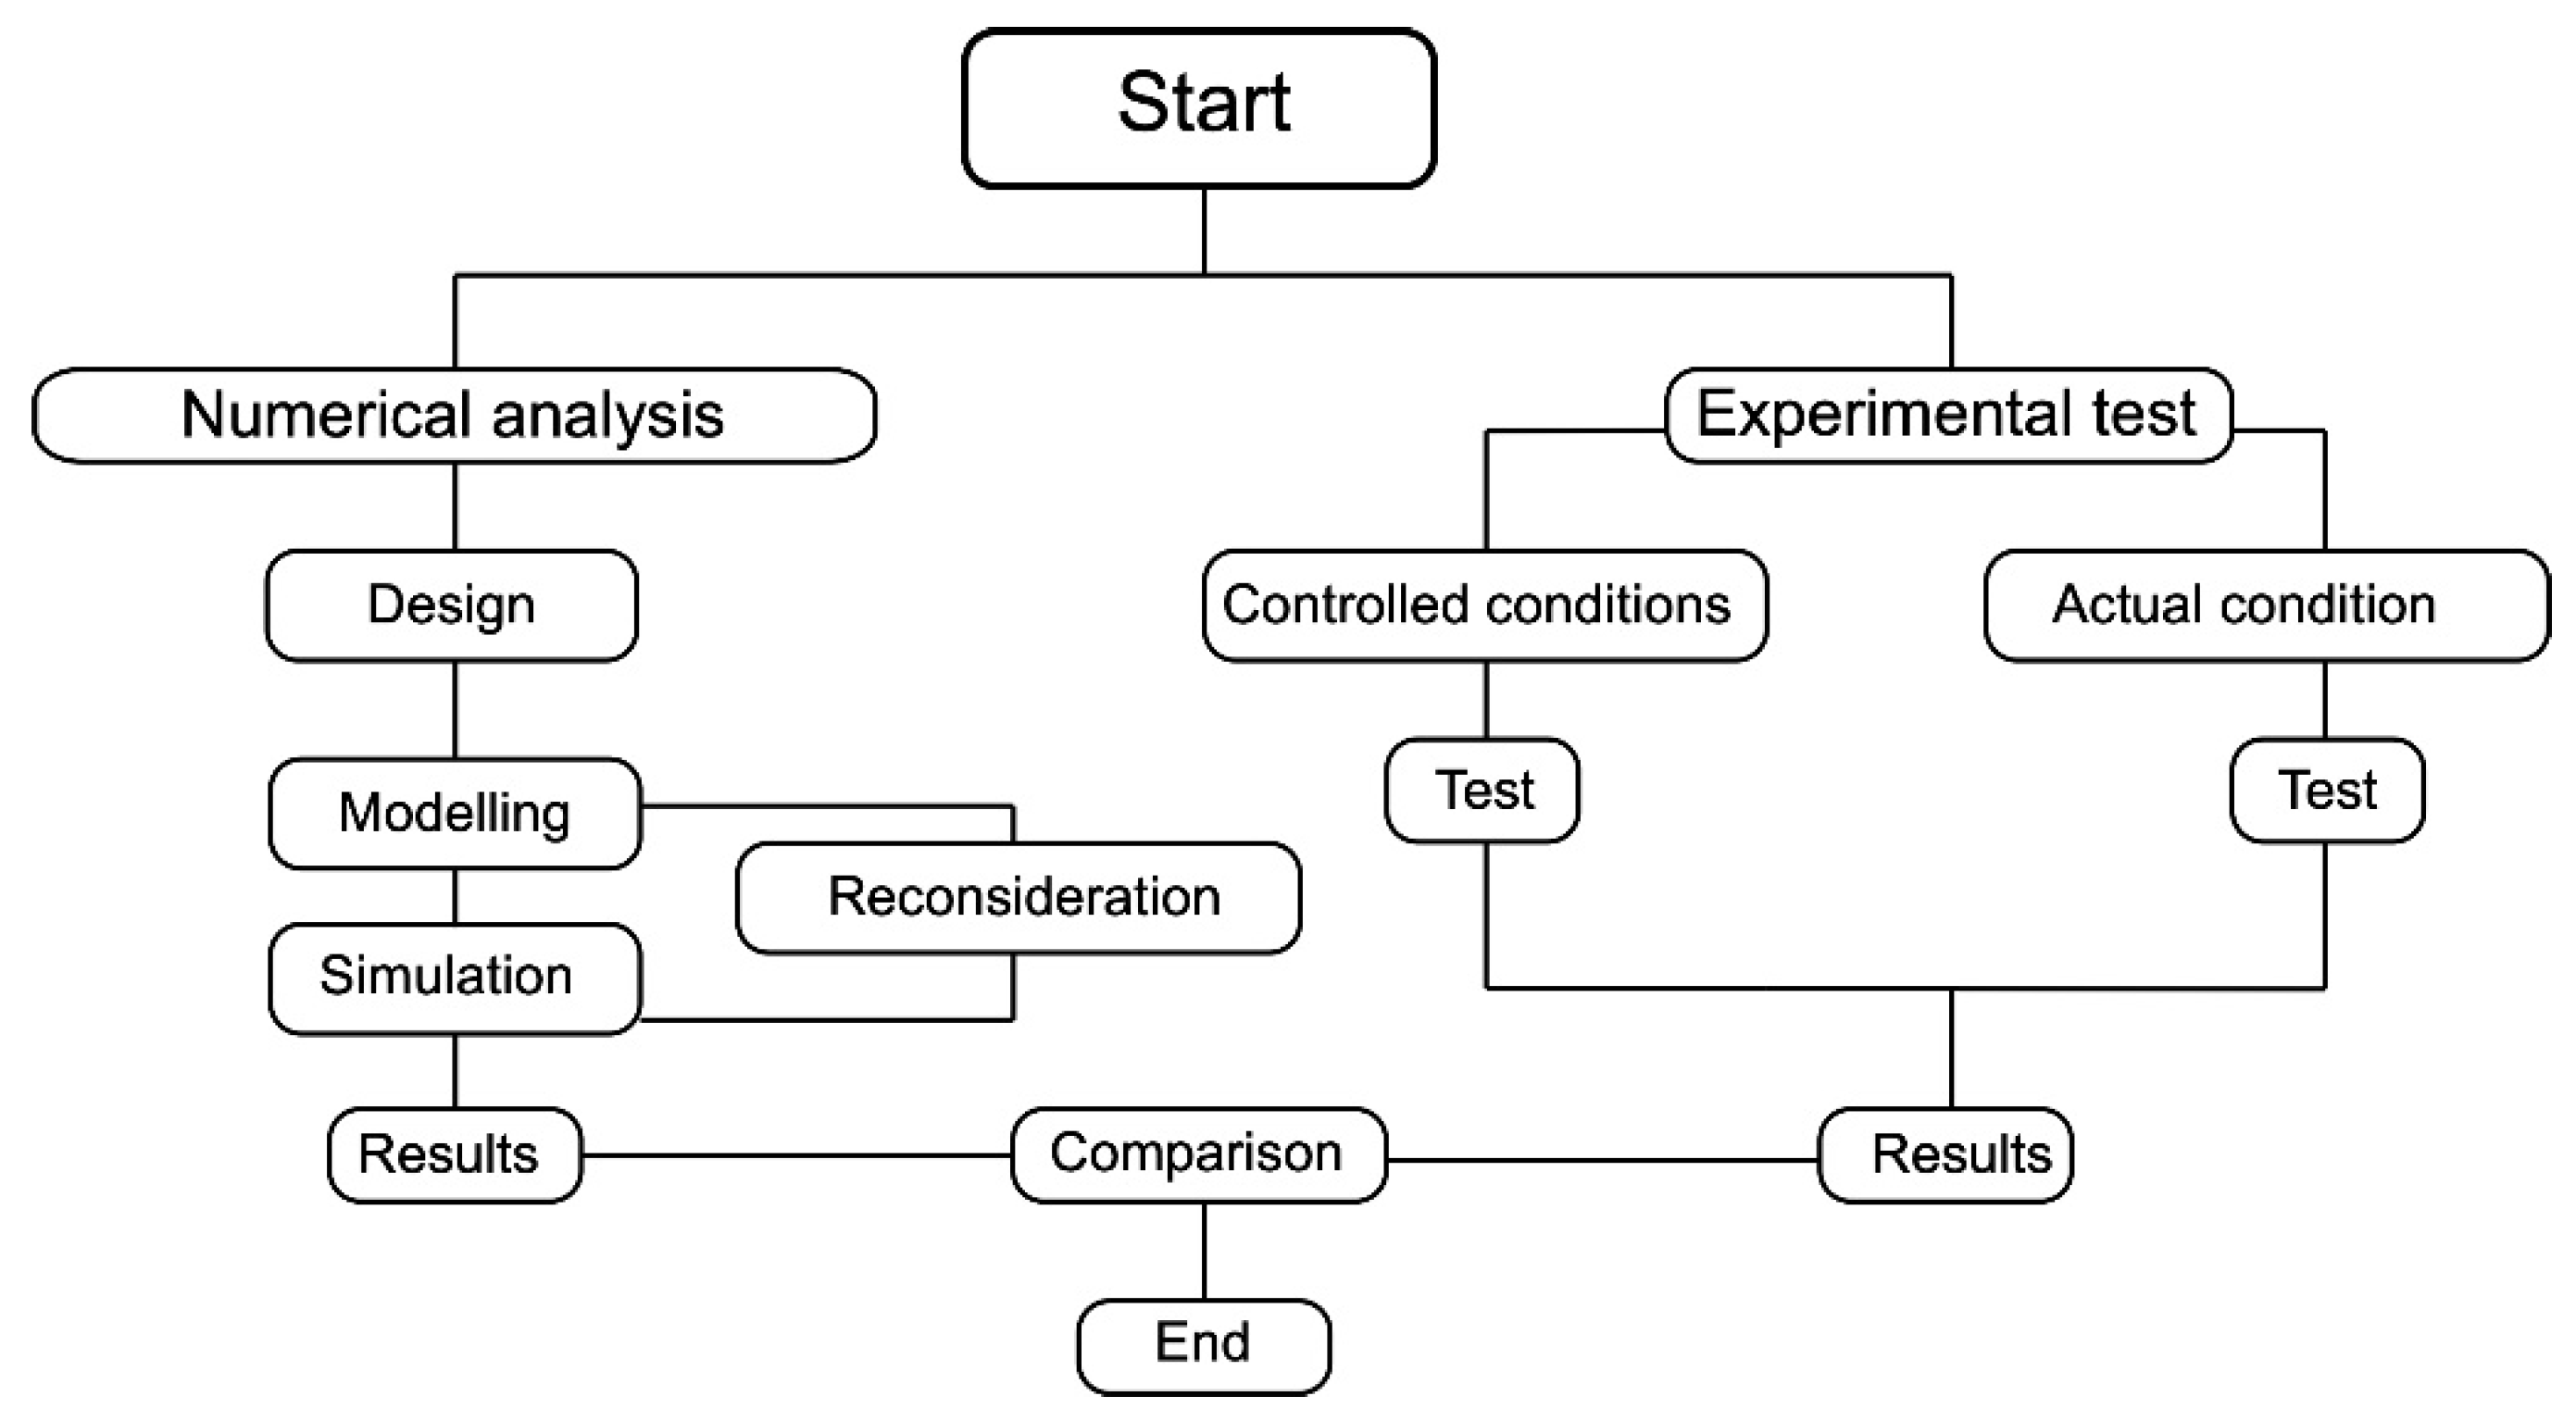
The experimental and numerical tests were conducted separately in this study.
Figure 1 shows A full description of the equipment used, procedures followed, and testing conditions are provided in the subsequent sections. The cost of the atmospheric water harvester was USD 550. This included the fabrication of the body structure, materials, and components such as the Peltier, fans, heatsink, and measurement devices.
A special apparatus in a climate chamber and under actual weather conditions, as shown in
Figure 2, was used to measure the condensation flow parameters, including the inlet air temperature, cooling surface temperature, and water collected during the experiment.
The atmospheric water harvester unit within the apparatus worked by blowing air on the cooling surface, and as the resulting water vapour in the air condensed on the surface, it was collected in the container.
Figure 3 illustrates the procedure followed.
The experiment was conducted under actual weather conditions at various temperatures and humidity values. Another experiment was conducted under controlled conditions inside a climate-controlled chamber, where the temperature was set to 313 K and a relative humidity of 85% was maintained. Performing the experiment under controlled conditions enabled improved results and an easier comparison with the numerical analysis. The input parameters of the experiment are listed in
Table 1.
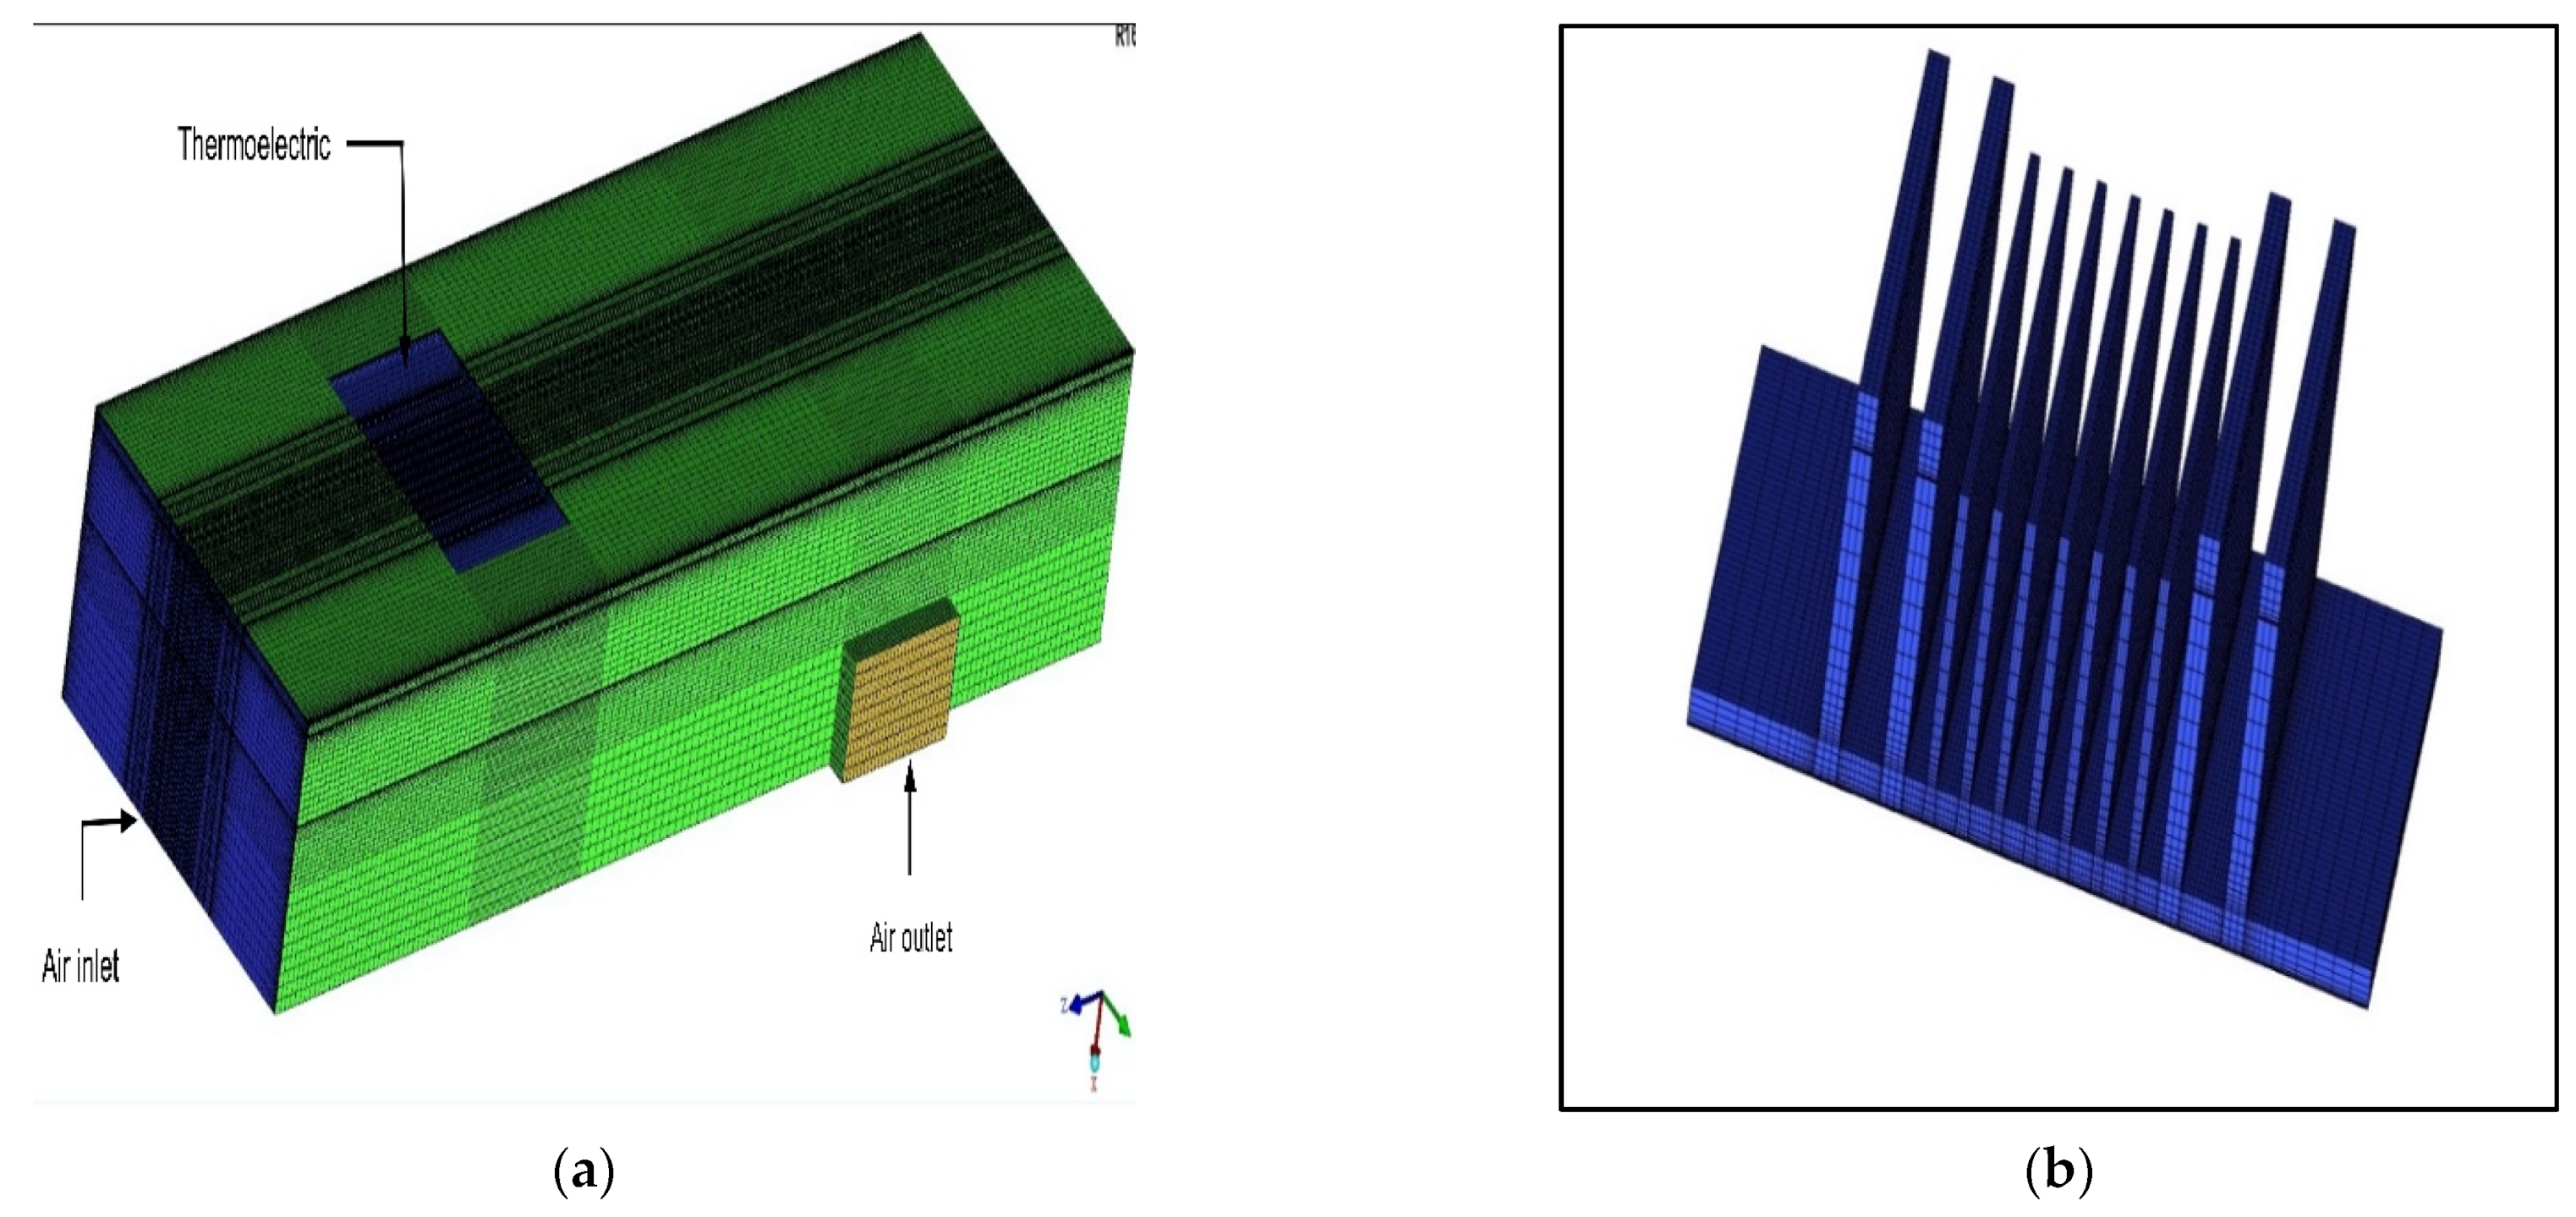
For the numerical tests, a computer-aided design (CAD) model was built using SolidWorks
® software and was subsequently imported to ANSYS R18.1
® for the simulation under the boundary conditions of inlet air temperature, cooling surface temperature, and relative humidity. The simulations tested the condensation of humid air under controlled conditions. A mesh was generated for the exported model using ANSYS ICEM CFD 13.0
®, and the model was separated into very fine areas to simplify the simulation and obtain accurate results. Several completed studies have extensively used this package owing to its ability to produce computational grids precisely for complex geometries and configurations. The CAD model is presented in
Figure 4. The ICEM mesh of the proposed model and the mesh of the cooling surface is presented in
Figure 5. The boundary conditions defined in the prepared model are listed in
Table 2. The velocity at the inlet section area was found to be 4.1 m/s; this depended on the flow rate provided by the fan, which was 0.025 m
3/s.
As shown in
Figure 5 and
Table 3 and
Table 4, dense meshes were applied near both the fin surfaces and fin tips to predict physical phenomena. Coarse grids were applied to the core flow region.
3. Results and Discussion
In the present study, both experiments and numerical simulations were performed considering the condensate rates over the fin surfaces, and the results were compared with those obtained in other studies.
The experimental outcomes under actual and controlled conditions are detailed in this section. The humid air condensed on the cooling surface when it came in contact with the TEC. The moisture in the air condensed when the cooling surface temperature was less than the dew point temperature.
Table 5 and
Table 6 show the different experimental conditions and the amount of water collected.
The results presented in
Table 6 show that the unit exhibited high efficiency at a temperature of 313 K and 85% humidity. A total of 405 mL of water were collected after only 8 h of working, whereas in other tests under actual weather conditions, the device collected only 231 mL of water in 8 h, which was a significant difference.
Figure 6 and
Figure 7 show a comparison of the amount of produced water versus the relative humidity based on the experimental results using the proposed device and results based on another study by Eslami et al. [
18]. The amount of produced water increased as the humidity increased; we clearly can see that the airflow rate and the current affected the amount of water produced along with other parameters such as relative humidity and temperature.
For the numerical analysis, simulations were carried out considering a constant temperature of 313 K and relative humidity of 85% for 8 h.
Figure 8 shows the results of the mass fraction of water under this condition for a vertical flow of air. A higher water concentration at the lower side of the fins can be observed. This high amount and closeness to the other readings indicated that condensation occurred, and the cooling surface was wet. In the figure, the distribution of water over the surface is indicated using different colours. The maximum value, denoted by red, is 98.7%, indicating that 98.7% of the surface was wet. The mass fraction of water was higher at the middle section, which had the lowest temperature. There was less air circulation at the centre of the fins, which resulted in a low mass fraction of air in the middle and, in turn, a high mass fraction of water.
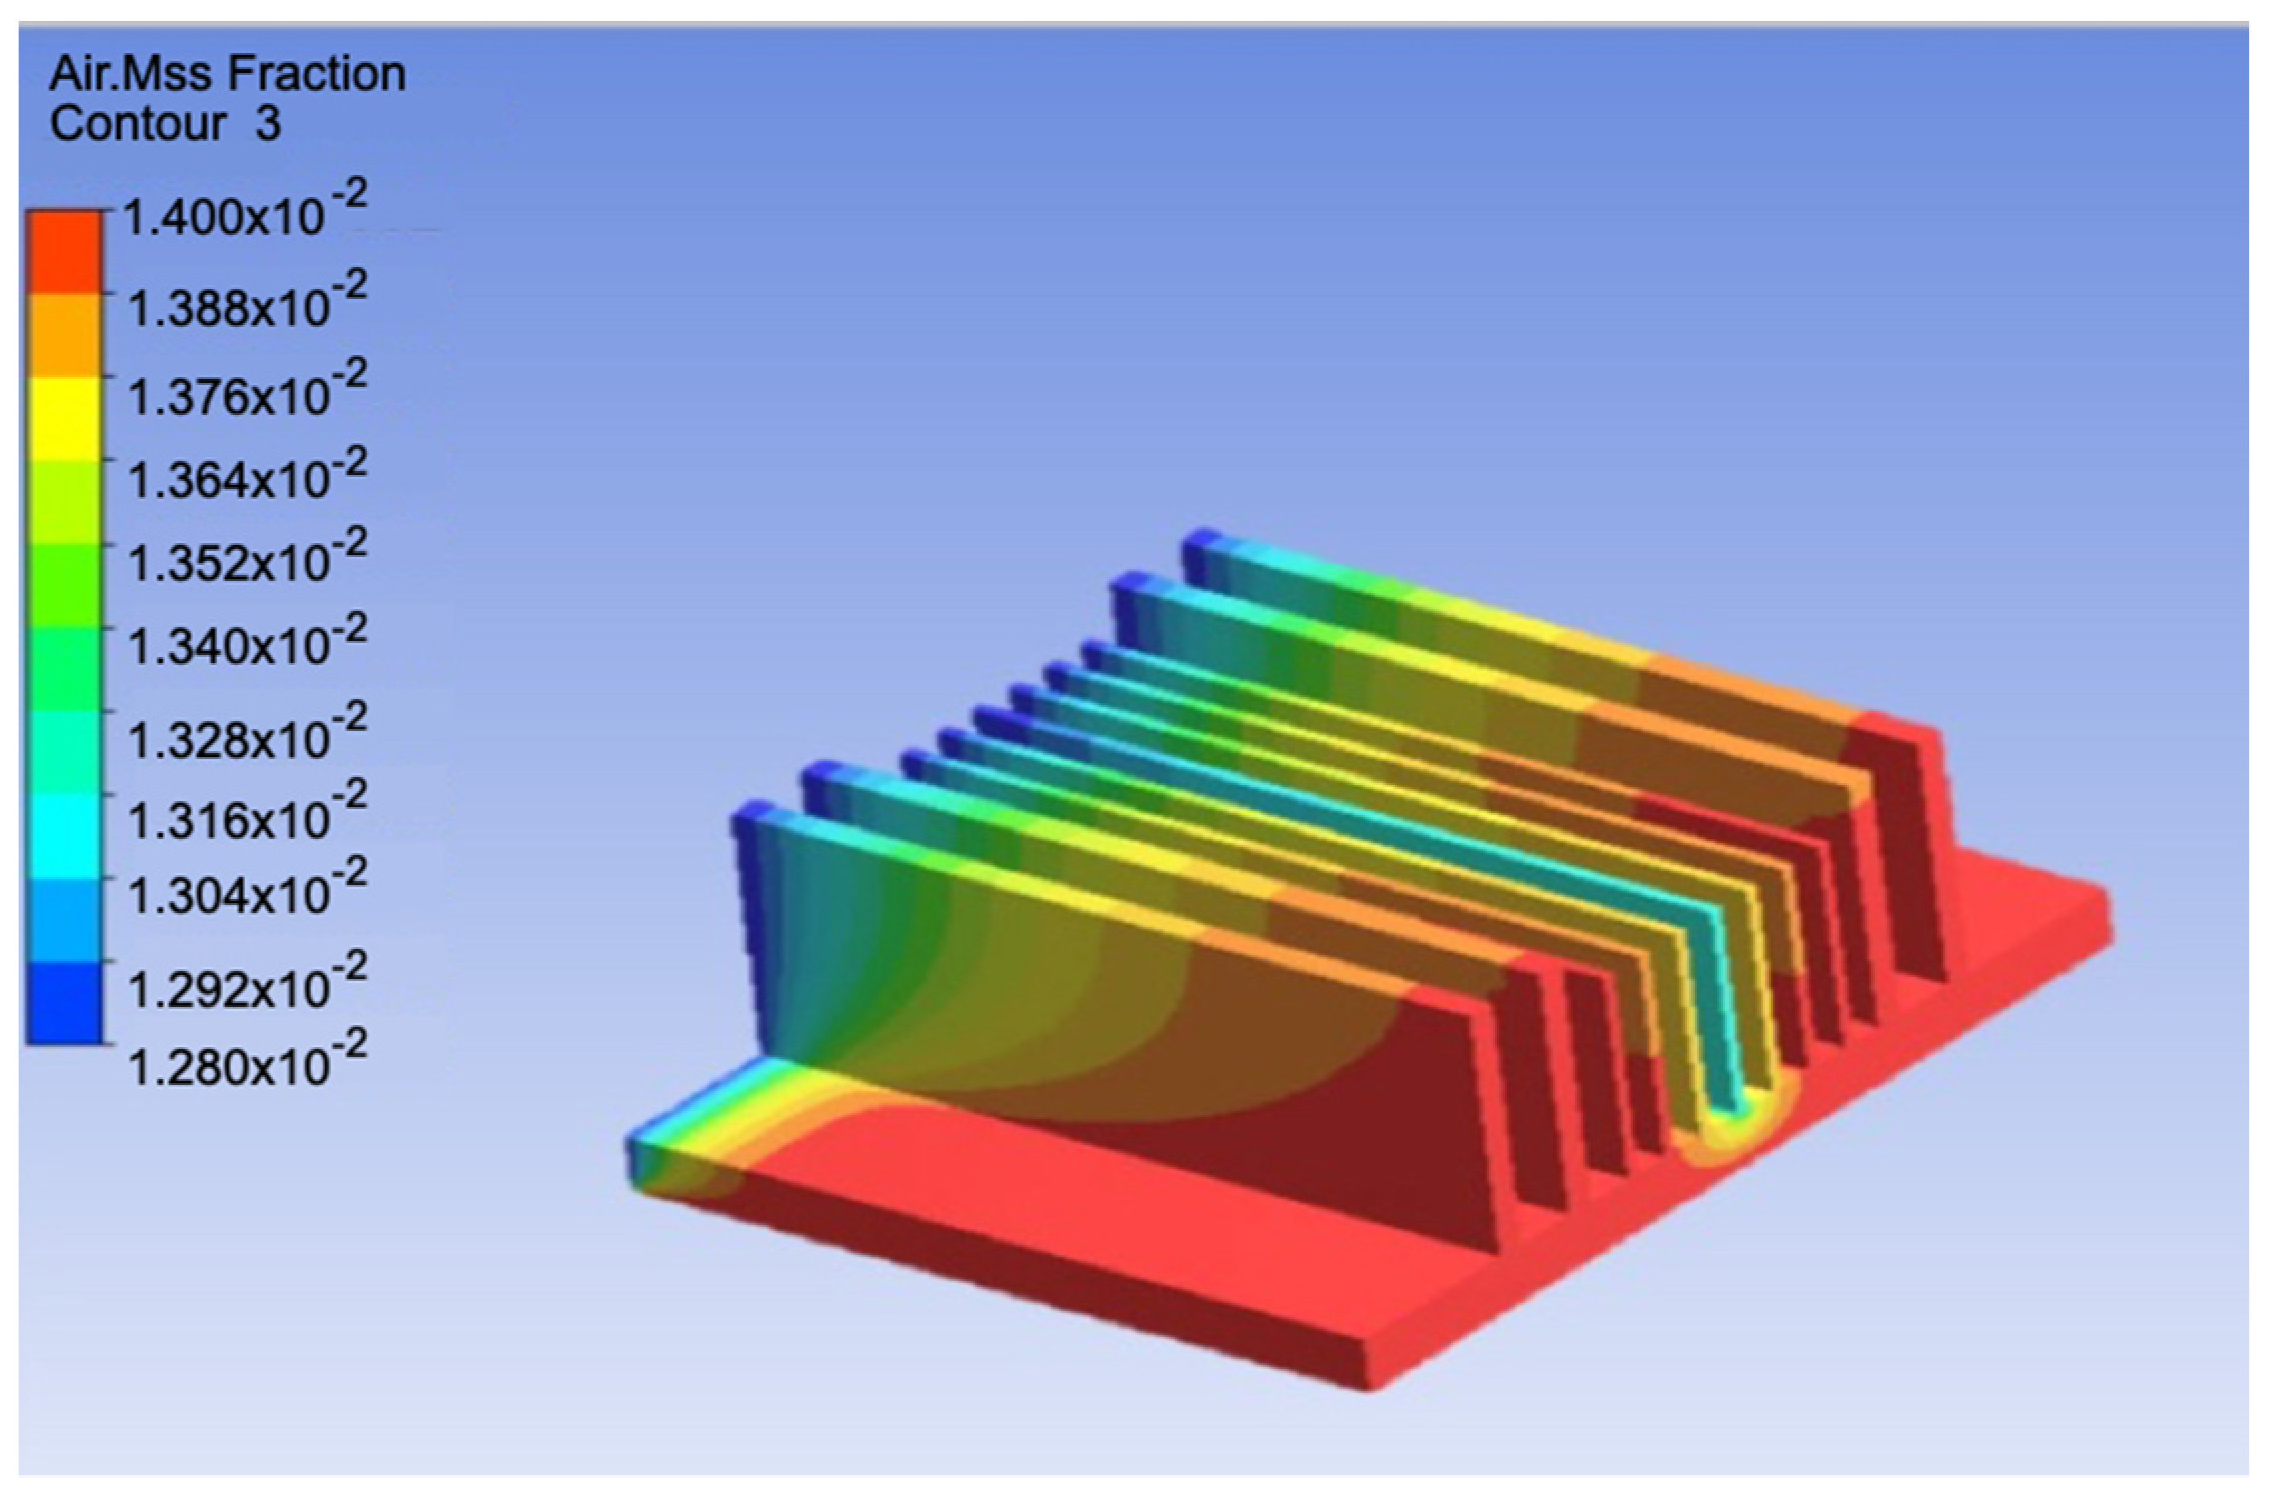
The maximum mass fraction of air was found to be 1.4%, as shown in
Figure 9, indicating that most of the humid air condensed to form water. As the flow was vertical, the concentration of air was higher on the upper side. The temperature in the middle section was the lowest because there was less air circulation in this region compared to the other sides; thus, the sides had higher temperatures as they were closer to the outlet suction fans.
The temperature distribution for the model and surface under controlled conditions is shown in
Figure 10. The temperature decreased from the inlet to the outlet owing to the occurrence of condensation. The temperature was the lowest in the middle of the model with a value of 307.3 K.
Figure 11 shows the velocity distribution at an inlet flow rate of 0.025 m
3/s. The contour plots define the distribution of the air velocity over the condensation surface in different directions. According to the figure, the maximum air velocity was 3.712 m/s, and the velocity at the condensation walls was zero. This means that these walls were fully wetted by a layer of condensed water. The maximum velocities in the z-, x-, and y-directions were 1.563 m/s, 3.221 m/s, and 1.820 m/s, respectively.
A comparison of the amount of water obtained through the two experimental and numerical tests over a period of 8 h indicated remarkable differences, as shown in
Figure 12. Because of the constant temperature and humidity, the numerical results indicated a greater amount of water being produced by the atmospheric water harvester compared to the experimental results.
The numerical analysis indicated that the maximum mass fraction of water over the surface was high. The high relative humidity in the numerical analysis also indicated that most of the surface was wet. These findings are consistent with those of previous studies that characterised condensation dynamics as a function of relative humidity. For instance, when examining the effect of relative humidity on dropwise condensation, Castillo et al. [
24] established that the condensation rate was faster at a higher relative humidity. Similarly, Bhuyan and Giri [
25] noted that the mass concentration of water vapour in a mixture of vapour and air was higher at a higher relative humidity, thereby enabling a faster rate of condensation. Therefore, these findings suggest that a high relative humidity results in a high rate of condensation, irrespective of whether the atmospheric water harvester is tested experimentally or numerically.
The experimental results confirmed a proportional relationship between the cooling surface temperature and air temperature. Specifically, the cooling surface temperature increased with increasing air temperature. The rate of condensation on the cooling surface in humid air is a typical index used to evaluate condensation and is useful for engineers when designing atmospheric water harvesters. A related study was conducted by Saraireh [
26], who examined heat transfer using three different methods. Similar findings were reported via the numerical analysis performed in the present study, where the maximum mass fraction showed a significantly higher amount of humid air being converted to water. Increasing the inlet temperature resulted in an increase in the condensation surface temperature. The flow of air was vertical; therefore, the temperature decreased from the inlet to the outlet. This resulted in a greater amount of water being produced owing to the improved efficiency of the atmospheric water harvester. These findings are consistent with those of previous studies linking the cooling surface temperature to the air temperature and condensation rate. For instance, Xing et al. [
27] noted that the temperature of a radiant terminal exposed to indoor air must be lower than the indoor air temperature to create an active cooling surface; they further noted that dew drops form on a radiant cooling surface when the temperature of the radiant terminal is lower than the dew point temperature. Tang et al. [
28] also asserted that condensation occurs on a radiant cooling surface as long as the temperature of the cooling surface is lower than the dew point temperature. Thus, these findings imply that the simplest way to prevent condensation is to ensure that the temperature of the radiant cooling surface is higher than the dew point temperature of indoor air. It is also clear from these findings that the rate of condensation of the cooling surfaces is important for developing a responsive atmospheric water harvester.
4. Conclusions
This study conducted experimental and numerical tests of an atmospheric water harvester and compared the results obtained. Based on the results of the experiment performed under actual weather conditions, the device was capable of producing 231 mL/8 h, while in controlled conditions at a constant temperature and humidity, the amount of water produced could be doubled to 405 mL/8 h, in numerical analysis the water produced jumped to 437 mL/8 h. It was evident that increasing the relative humidity of the air resulted in a considerable increase in the amount of produced water. The airflow rate and current affected the amount of produced water along with the air temperature.
The numerical analysis also confirmed this finding as the maximum value of the mass fraction of water over the surface was found to be 98.7%. This indicated that 98.7% of the surface was wet. However, the maximum mass fraction of air was found to be only 1.4%. This indicated that a very high amount of humid air was converted to water. Increasing the inlet temperature resulted in an increase in the condensation surface temperature. The flow of air was vertical; thus, the temperature decreased from the inlet to the outlet. The inlet temperature was set as 313 K and the relative humidity was 85%. This result showed a greater amount of water being produced owing to the improved efficiency of the atmospheric water harvester. The condensation surface temperature, in this case, was measured to be 303 K.
In the future, the same analysis can be performed for other techniques, such as plate heat exchangers, to determine which technique can produce more water from air condensation under the same conditions. Two TECs were used in this study. This could be increased to four in future studies to further increase water condensation. However, it should be noted that power consumption can be an obstacle if future studies adopt this direction.
The results of this study are of greater relevance to arid regions, especially those in the remote parts of developing nations. They can be used to enhance the efficiency of devices generating clean and safe drinking water. These results should be applied to the identified areas because there is an urgent need to improve the production of clean and safe water.


