Article

Hotspot Detection and Estimation of Methane Emissions from Landfill Final Cover

1
College of Civil Engineering and Architecture, Jiangsu University of Science and Technology, Zhenjiang 212000, China
2
Jiangsu Province Engineering Research Center of Geoenvironmental Disaster Prevention and Remediation, Jiangsu University of Science and Technology, Zhenjiang 212000, China
3
Key Laboratory of Soft Soils and Geoenvironmental Engineering, Zhejiang University, Hangzhou 310000, China
4
College of Civil and Architectural Engineering, Taizhou University, Taizhou 318000, China
5
State Key Laboratory for Geomechanics & Deep Underground Engineering, School of Mechanics & Civil Engineering, China University of Mining and Technology, Xuzhou 221116, China
6
School of Civil and Environmental Engineering, Ningbo University, Ningbo 315211, China
*
Authors to whom correspondence should be addressed.
Atmosphere 2023, 14(11), 1598; https://doi.org/10.3390/atmos14111598
Submission received: 29 July 2023 / Revised: 17 October 2023 / Accepted: 19 October 2023 / Published: 26 October 2023
(This article belongs to the Section Air Quality)

Abstract

:
The main objectives of this study were to identify methane hotspots through spatial distribution tests of the surface methane concentration above a landfill final cover and to investigate the effects of rainfall, atmospheric pressure, ground temperature, and ambient methane concentration on methane emissions. A portable laser methane detector was used to measure the spatial distribution of methane concentrations. The methane concentration distribution showed a distinct spatial variability. The maximum methane concentration reached 3225 ppm, while 73.0% of the methane concentration values were below 10.0 ppm. Several meteorological factors were found to be associated with the variation in methane emissions. Rainfall limited gas transport in the cover, resulting in more significant methane hotspots. Atmospheric pressure was negatively correlated with methane emission. The ambient methane concentration and methane flux had a significant positive linear correlation. Based on a linear correlation equation, the spatial distribution of methane concentrations in the landfill could be converted into a methane emission distribution. The estimated average value for methane emissions in the test area was approximately 4.3 g m−2 d−1. This study provides an experimental basis for locating methane hotspots and assessing methane emissions in landfill final covers, and proposes supplementary means for detecting geomembrane damage in landfill covers.

1. Introduction

As an economically effective waste disposal method, landfilling is one of the main municipal solid waste treatment methods adopted by most developing countries [1]. The degradable substances in the waste are gradually degraded and landfill gas is continuously released for decades [2]. Methane is one of the main components of landfill gas, accounting for about 40–60% of its volume [3,4]. Correspondingly, municipal solid waste landfill is one of the most important anthropogenic sources of methane emissions [5,6]. Methane has 27.2–29.8 times more global warming potential than carbon dioxide (based on a 100-year time horizon), so fugitive methane emissions have an important impact on environmental, economic, and political issues such as climate warming and the global economy [7,8]. Therefore, to suppress the adverse effects of greenhouse gases, it is necessary to effectively reduce the fugitive emissions of landfill gas that have been generated in landfills [9].
Landfill final cover is a containment technology for the disposal of municipal solid waste that can effectively reduce the fugitive emissions of landfill gas and improve the resource utilization of landfill gas [10]. The final cover system generally consists of four components, including the surface layer, protection layer (geomembrane, GM), barrier layer, and foundation layer. The heterogeneity of the cover system can lead to significant spatial variability in landfill gas emissions [9]. The permeability coefficient of GMs should be less than 1 × 10⁻¹⁴ m/s, with a diffusion coefficient of approximately 1 × 10⁻¹³ m2/s. GMs in final cover systems are effective in preventing fugitive emissions of landfill gas. However, the GM in the final cover may be damaged by factors such as incorrect installation or the uneven settlement of landfill waste, resulting in significant landfill gas emissions through holes in the GM [11]. Bouazza et al. [12] studied the gas leakage rate through a geosynthetic clay liner–GM composite liner due to a circular defect in the GM, and found that the gas permeability coefficient could be higher than 1.5 × 10⁻⁸ m/s. Therefore, if the GM in a landfill final cover is damaged, it must be repaired to prevent environmental pollution. The determination of the location of GM damage has always been a challenge. Electrical leak location methods can accurately screen the location of GM damage, thus becoming one of the most commonly used GM damage detection methods [13]. Gilson [14] pointed out that if the GM used in a final cover is damaged during service, the location of the damage can usually only be detected using electrical leak location methods. Nevertheless, landfills typically cover a large area, which makes it time consuming, labor-intensive, and uneconomical to apply electrical leak location methods to detect GM damage. It is important to develop a detection method that can quickly determine the roughly damaged areas of the GM in landfill covers, so as to reduce the cost and improve the timeliness by greatly reducing the GM damage detection area required by the electrical leak location method.
The continuous degradation of landfilled organics leads to the generation of landfill gas, which exists at a significantly higher gas pressure than atmospheric pressure [15]. The high landfill gas pressure makes the damaged area of the GM a potential hotspot for landfill gas emissions [16,17]. Therefore, determining the location of methane emission hotspots in the final cover can indirectly obtain the approximate location of the damage area of the GM, achieving the purpose of reducing the damage detection area of the GM. The static chamber method is one of the most commonly used techniques for measuring methane emissions from landfill final covers [18,19]. However, due to the inconvenience and time-consuming nature of this method, it cannot meet the needs of large-area field testing. In order to quickly measure the distribution of the methane concentration in a large area, laser absorption spectroscopy has attracted the interest of many scholars [20,21,22]. He et al. [23] proposed a highly effective method to measure methane concentrations in landfill sites based on tunable diode laser absorption spectroscopy (TDLAS), and the field results indicated that the TDLAS method was suitable for detecting methane emissions from landfills on a large scale. Aldhafeeri et al. [24] pointed out that optical sensors based on laser absorption spectroscopy technology have the advantages of fast testing, a low cost and strong immunity to electromagnetic interference. Zhan et al. [21] used a portable laser methane detector to measure the methane emissions from a landfill cover, and the results of indoor verification tests and field tests proved that this method was fast, simple, accurate and reliable.
The detection of GM damage in the landfill final cover is a challenging problem, as traditional electrical leak location methods are uneconomical and time-consuming when applied to large sites. The main objective of the present study was to develop a methane hotspot localization method suitable for large-scale landfill sites based on laser absorption spectroscopy technology. Thus, the potential GM damage areas can be determined according to the location of methane hotspots, reducing the GM damage detection area required by electrical leak location methods. In addition, the effects of rainfall, atmospheric pressure, and ground temperature on methane emissions were studied. The relationship between ambient methane concentrations and methane emissions was analyzed to achieve a rough estimation of the methane emissions generated by the studied landfill site.

2. Materials and Methods

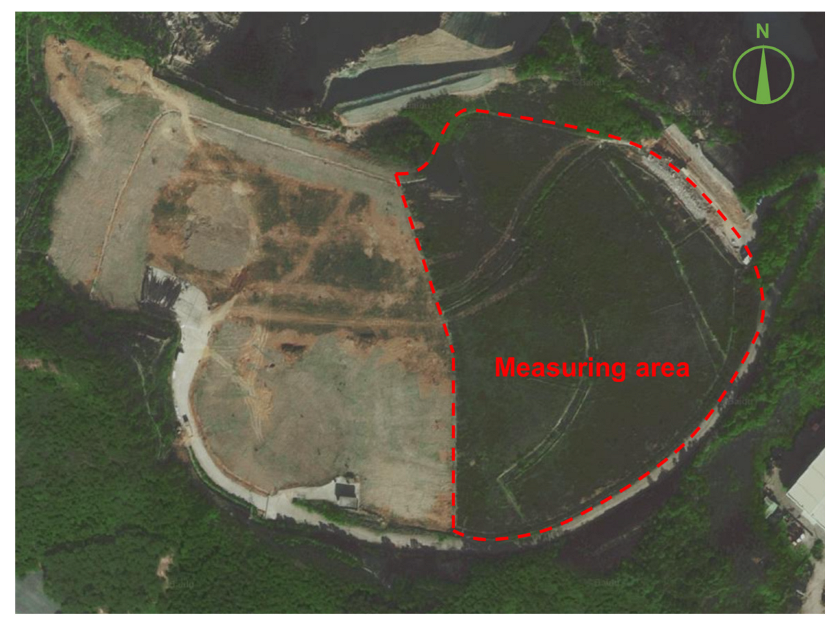
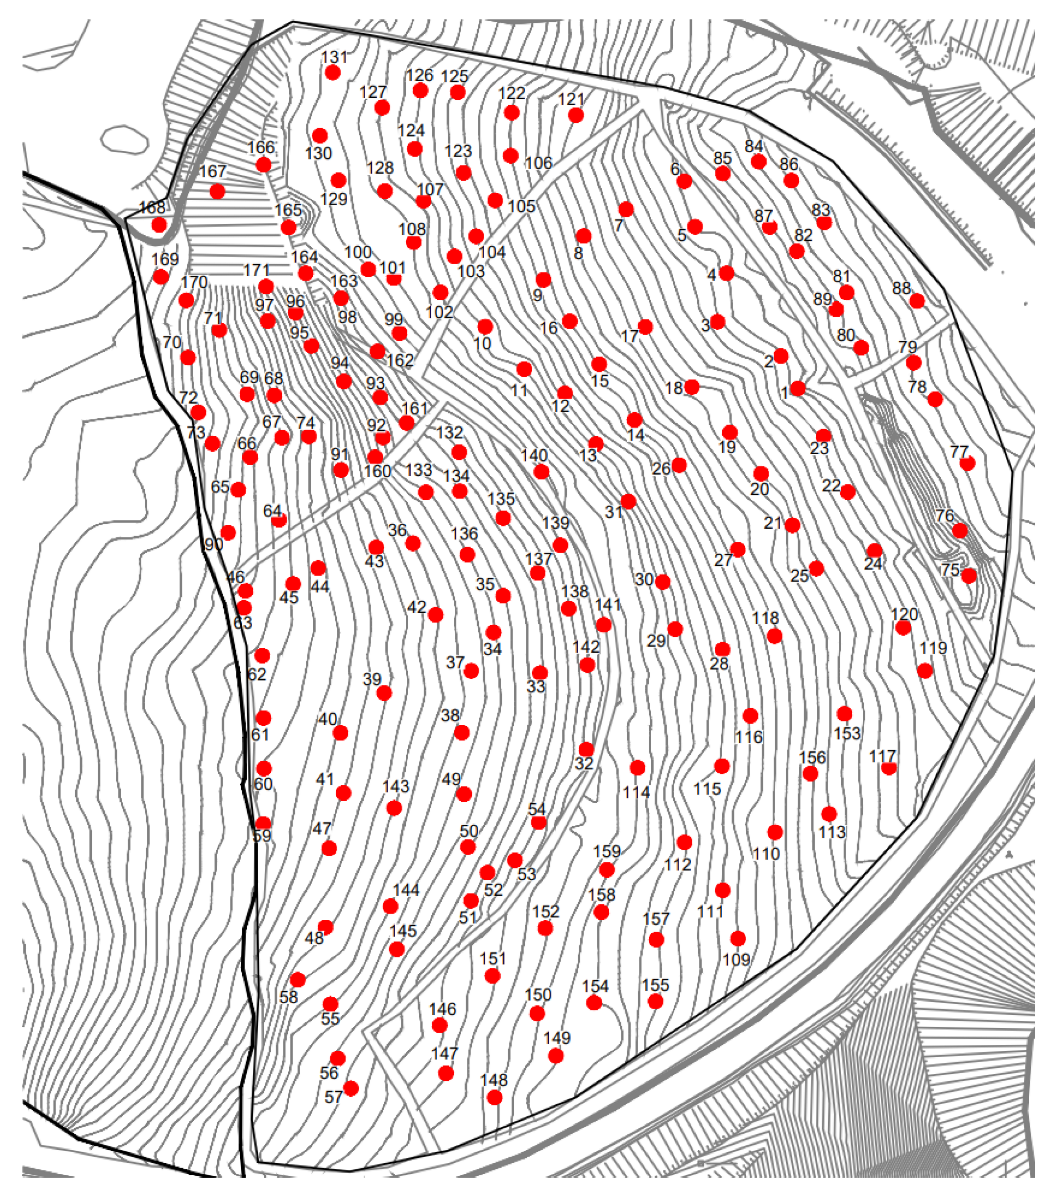
2.1. Field Study Site

The field study area is located in the Phase II landfill area of the Honghualing municipal solid waste landfill in Shenzhen, China (22°46′18″ N, 114°16′9″ E). The Phase II landfill area of the Honghualing municipal solid waste landfill was put into use in August 2013. It covers an area of 72,000 m2 and has a design storage capacity of 1.08 million m3. The Phase II landfill area of the landfill reached the design level and ceased to be landfilled in May 2016, and the closure works were completed in September 2017. The final cover system of the Honghualing municipal solid waste landfill adopted a composite cover, which mainly consisted of a high density polyethylene (HDPE) GM and compacted clay liner. The uneven settlement of the waste area led to cracks in the cover soil and damage to the GM. The Phase II landfill area of the Honghualing municipal solid waste landfill is shown in Figure 1. The western area (37,500 m2) is planned to be recovered, while the eastern area marked by the red dotted line (34,500 m2) will be evaluated for GM damage and repaired.

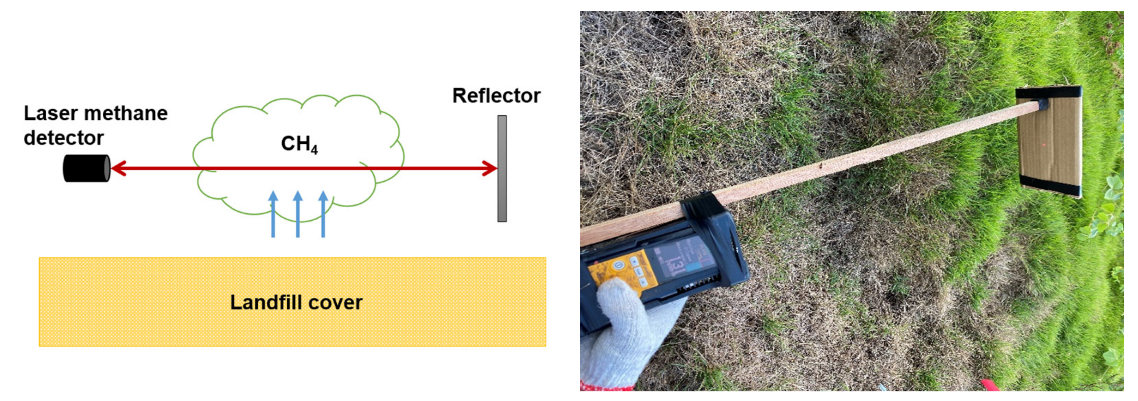
2.2. Methane Concentration Distribution Test

Figure 2 shows the distribution of monitoring points at the landfill site. The methane concentration tests above the landfill surface were conducted on a sampling grid of 15 m × 15 m. The spacing between the monitoring points was flexibly adjusted according to the terrain. A total of 171 monitoring points were arranged throughout the test area. In order to quickly and accurately locate each monitoring point, a portable GPS (Tirmble R8 GNSS; Trimble Navigation Ltd., Sunnyvale, CA, USA) was used to locate the monitoring points. The horizontal positioning accuracy and vertical positioning accuracy of this portable GPS in static measurement mode are 3 mm and 3.5 mm, respectively. The surface methane concentration measurements in the test area were conducted between 12 August and 28 August 2020. Rainfall occurred during the test period, and the methane concentrations were measured on sunny days and after rainfall.
The surface methane concentrations at the landfill site were determined using a portable laser methane detector (TGE-SA3C32A; measurement range of 1–50,000 ppm·m, measurement accuracy of ±10%). The effective detection range of the laser methane detector is 0.5–30 m. The laser methane detector device is based on infrared absorption spectroscopy, uses a semiconductor laser as a collimated excitation source, and employs the second harmonic detection of wavelength modulation spectroscopy to establish the methane concentration [25]. Tanikawa et al. [26] reported that the methane concentration measured with the laser methane detector was approximately equivalent to that measured with a FID (flame ionization detector). The laser methane detector is sensitive to small changes in methane concentration and can quickly obtain detectable concentration differences [21]. The schematic diagram of measuring the surface methane concentration using the portable laser methane detector is shown in Figure 3. The methane concentration can be calculated according to the following equation:
C m = M L
where C m is the methane concentration (ppm); M is the path-integrated methane concentration (ppm·m); and L is the path length (m).

2.3. Methane Emission Test

The static chamber method is one of the most commonly used methods for measuring landfill gas emissions [27]. However, the traditional static chamber method requires gas samples to be collected in the chamber and then transported to the laboratory for the gas components test, making it unsuitable for this study. Zhan et al. [21] proposed a newly developed static-chamber method with a laser methane detector to measure the methane emissions from landfill covers; this was adopted in this study because of its fast and accurate measurements.
A square static chamber was used to measure the methane emissions. The chamber was made of transparent plexiglass with a wall thickness of 5 mm. The length and height of the static chamber were both 50 cm, falling within the effective test range of the laser methane detector. Soil was filled to the interface between the static chamber and the ground, and the static chamber was sealed by wetting the soil. A thermometer (MDG437, Guangzhou Anymetre Instruments Co., Ltd. (Guangzhou, China); accuracy of ± 1.0 °C) was placed in the static chamber to measure the gas temperature. An absolute barometer (HHP360-A, OMEGA Engineering Inc., Norwalk, CT, USA; for measuring absolute gas pressure with resolution of 10 Pa) was used to test the gas pressure inside the chamber. A reflector was attached to the inner wall of one side of the chamber. The methane concentration in the static chamber was measured using the portable laser methane detector on the outer wall of the other side of the chamber. The initial concentration of methane measured in the static chamber was the ambient methane concentration. After completing the methane emissions test, the ground temperature within 10 cm below the surface of the monitoring point was measured using the thermal resistance thermometer Ondotori TR-62 (Shiro Industry Co., Osaka, Japan; accuracy of ± 0.25 °C).
The methane emissions can be calculated using the following equation [21]:
J m = P M m V A R T ( Δ C Δ t )
where J m is the methane emission flux (g m−2 d−1); P is the absolute atmospheric pressure inside the static chamber (Pa); Mm is the molar mass of methane (16 g mol−1); V is the volume of the static chamber (m3); A is the internal cross-sectional area of the static chamber (m2); R is the gas constant (8.314 J K−1 mol−1); T is the chamber temperature (K); and Δ C / Δ t is the slope of methane concentration versus time curve (m3 CH4 m−3 d−1).

3. Results and Discussion

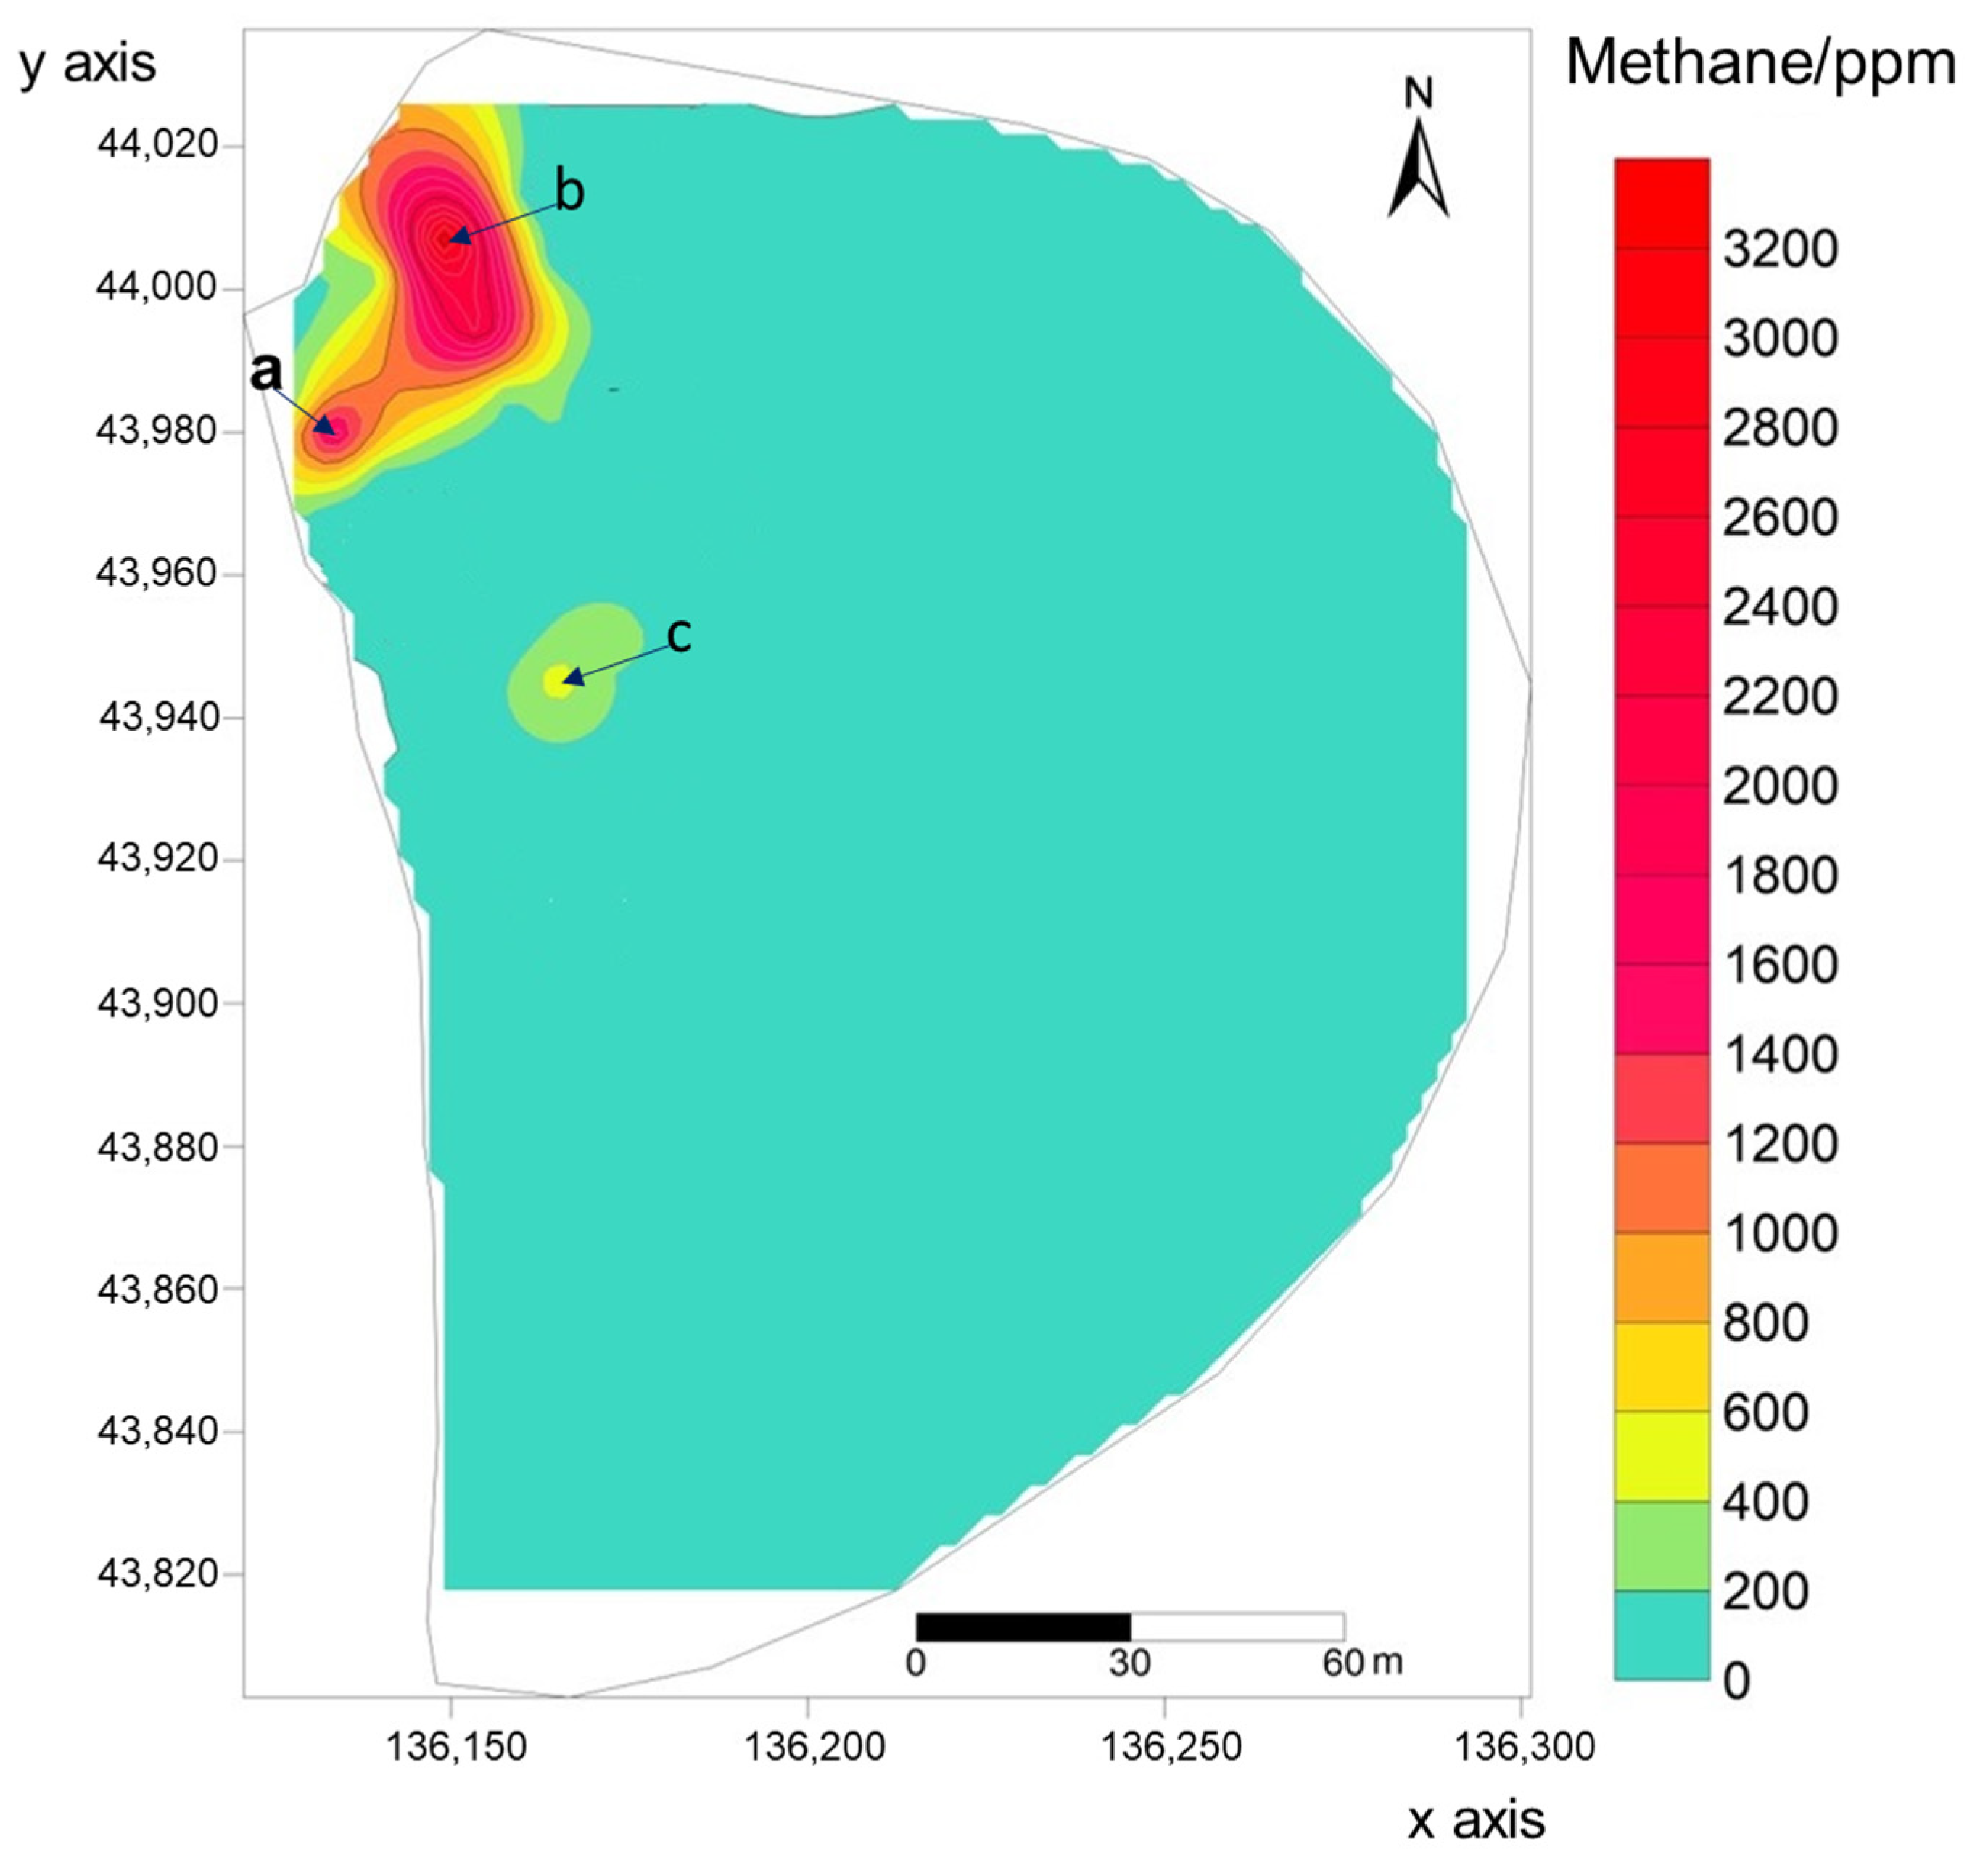
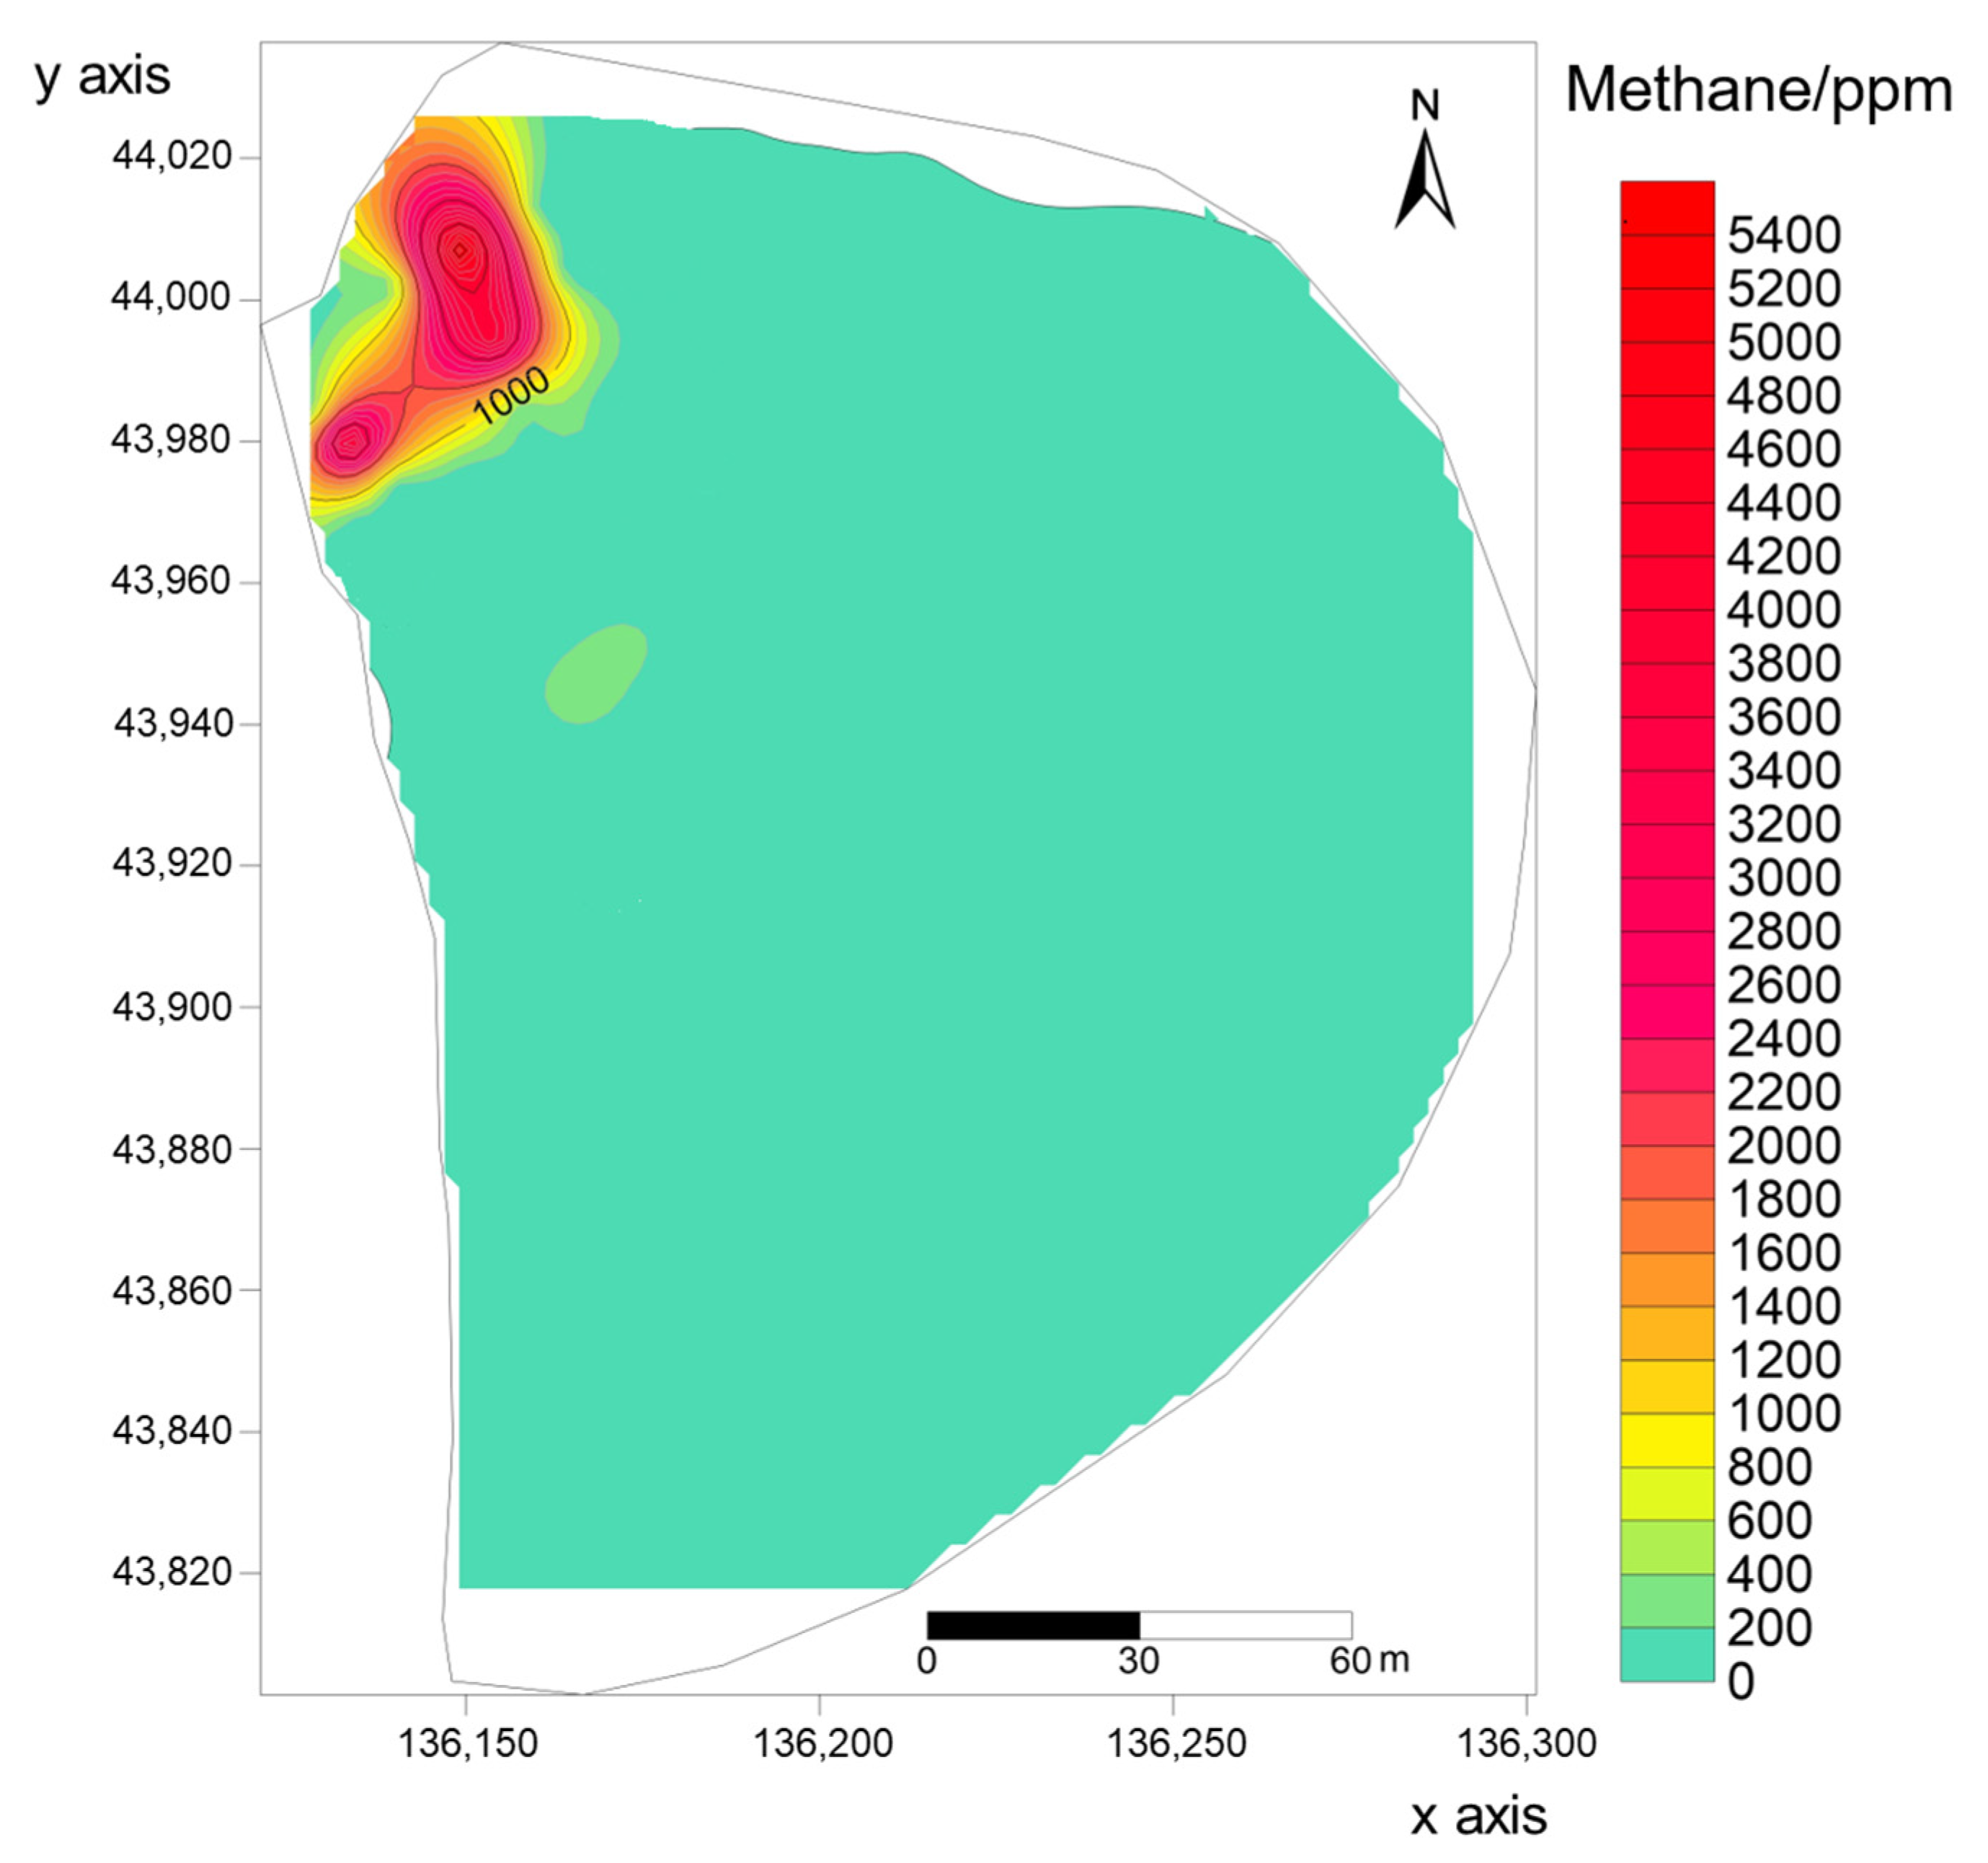
3.1. Locations of Methane Hotspots

The spatial distributions of methane concentrations in this study were determined using Surfer 11 (Golden Software, Inc., Golden, CO, USA). The Kriging method was used as the interpolation method. In the Kriging method, a model of the overall spatial measured variance structure is used to generate the interpolated contours [16]. Based on the methane concentration values measured at the 171 monitoring points in the landfill test area, Figure 4 shows the typical spatial distribution of methane concentrations in the test area measured on sunny days. The values of the horizontal and vertical axes in the figure are the plane coordinate values of the landfill test area, and the bar on the right side of the figure indicates the ambient methane concentration in part per million (ppm). According to the results, the surface methane concentrations measured at the 171 monitoring points in the test area ranged from 1.7 to 3225.3 ppm, with a variation range of about four orders of magnitude. It was observed that approximately 73.0% of the methane concentration values measured at the monitoring points were lower than 10 ppm. The measured results showed that the methane concentration distribution on the surface of the landfill final cover was characterized by high spatial variability. This is consistent with the field test results of Lando et al. [28], who pointed out that the ambient methane concentration can even vary significantly on centimeter scales. The high spatial variability in the methane concentration distribution might be related to the heterogeneity of the landfill cover. The uneven settlement of landfill waste and changes in meteorological conditions could lead to the heterogeneity of the cover soil, which in turn could cause significant changes in the gas conductivity of the landfill cover at different locations [29]. As a consequence, the distribution of the surface methane concentration would be changed.
As can be seen from Figure 4, there are three methane hotspots in the test area, which are highlighted by the letters a–c. The methane concentration values measured at the monitoring points near methane hotspots were significantly higher, which was consistent with the field test results of Shen et al. [16]. Moreover, the influence range of methane hotspots was positively correlated with the measured maximum methane concentration value. In a landfill with a final cover system containing a HDPE GM and gas collection system, the surface methane concentrations should typically be close to 0 ppm due to the low permeability of the GM [12]. The presence of these three methane hotspots in the test area suggested that there was a high probability of GM holes in the three regions of a–c in the figure. The potential damage areas of the GM could be preliminarily identified according to the locations of methane hotspots. Then, the electrical leak location methods could be used to confirm the locations of GM damage near the three methane hotspots.

3.2. Effects of Rainfall on Methane Concentration Distribution

Methane emissions from the landfill final cover are not only related to the structural design of the cover system, but are also affected by meteorological factors [16]. Rainfall can significantly change the distribution of soil moisture content in the landfill cover, making it an important meteorological condition affecting landfill gas emissions from the landfill cover [30]. Figure 5 shows the spatial distribution of methane concentrations in the test area measured after rainfall. Under the influence of rainfall, the surface methane concentrations measured at the 171 monitoring points in the test area ranged from 2.8 to 5428.6 ppm. Approximately 75.9% of the methane concentration values measured at the monitoring points were lower than 10.0 ppm. Compared to the methane concentration distribution measured on the sunny days (see Figure 4), the patterns of methane concentration distribution in the test area before and after rainfall were consistent. However, the maximum surface methane concentration measured at the monitoring points increased by 68.3% due to the effect of rainfall. The results suggested that rainfall might cause methane emissions from the final cover to be more concentrated in methane hotspots. Rainfall infiltration increased the moisture content of the cover soil and encroached on the pores occupied by gases. Thus, the gas conductivity of the final cover decreased when encountering rainfall, which in turn led to more pronounced methane hotspots [31]. Therefore, the impact of rainfall should be considered when assessing the long-term variation in methane emissions from landfill covers.

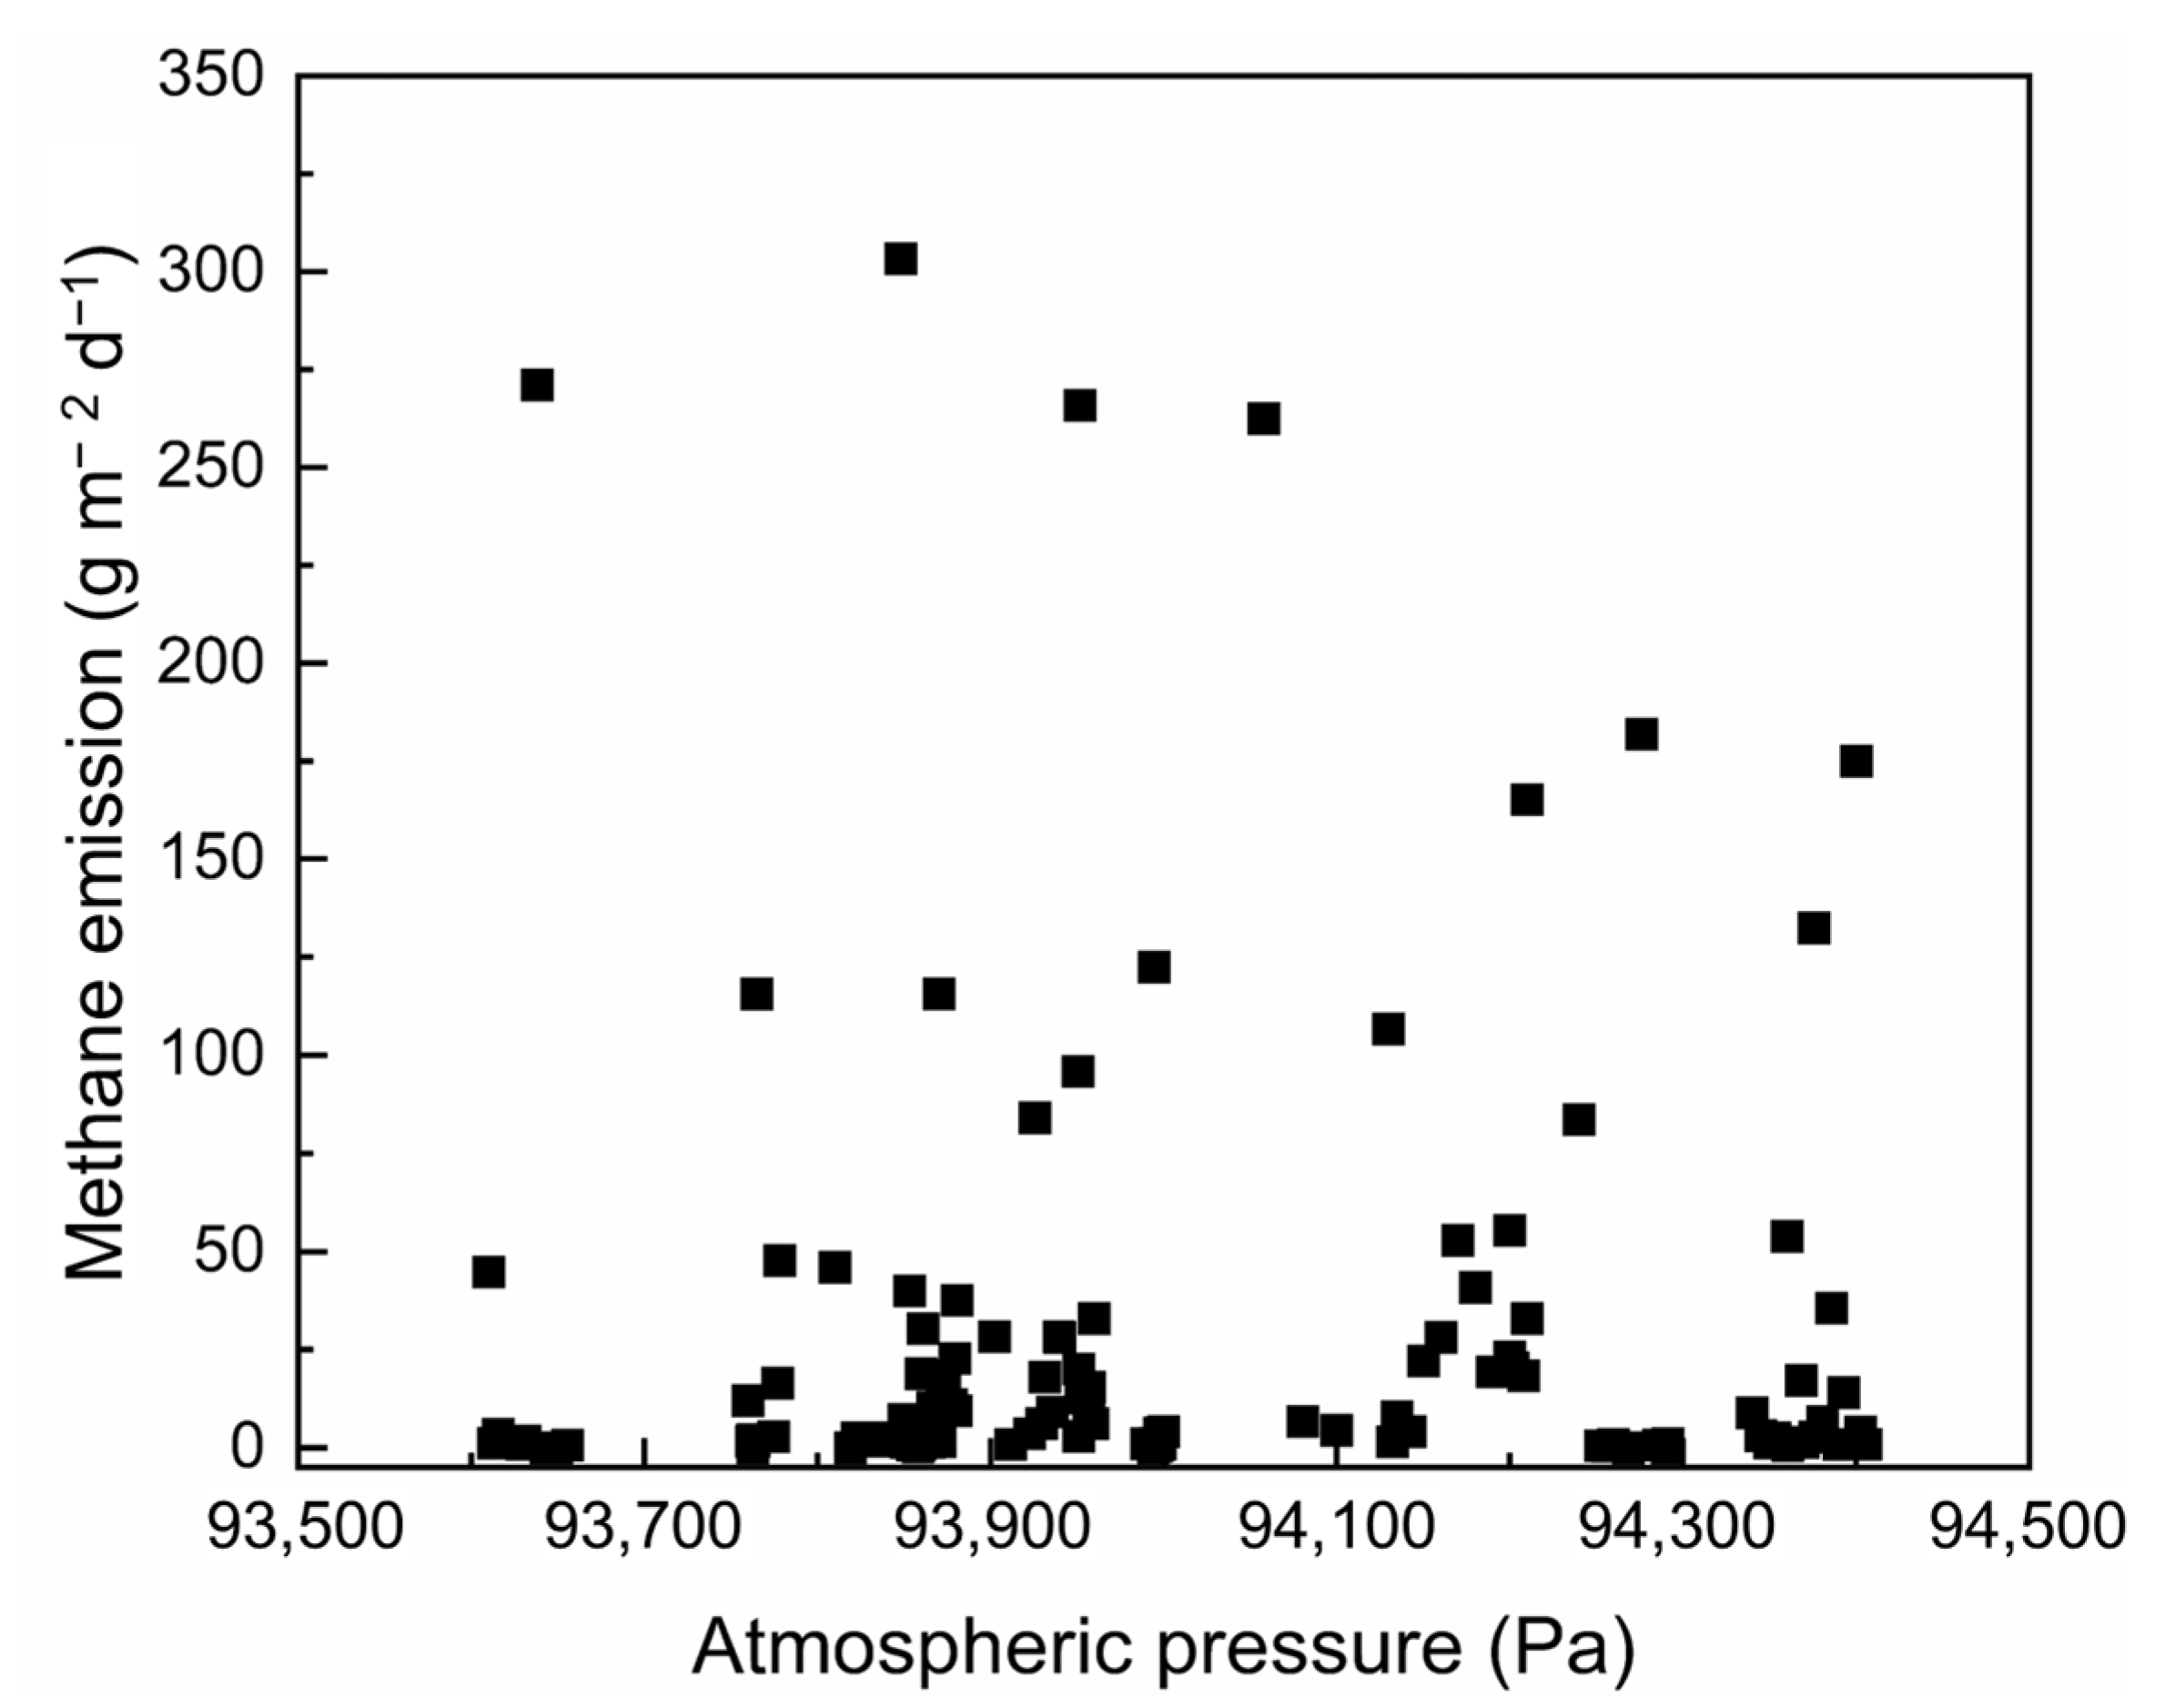
3.3. Effects of Atmospheric Pressure on Methane Emission

Based on the results of the static-chamber tests of methane emissions at the monitoring points, the relationship between atmospheric pressure and the methane emissions from landfill cover is shown in Figure 6. The atmospheric pressure during the test period ranged from 93,610 to 94,406 Pa, while methane emissions varied from 0 to 303.3 g m−2 d−1. Overall, there was no significant linear relationship between the on-site measured methane emissions and atmospheric pressure, but the corresponding maximum methane emissions at different atmospheric pressures were negatively correlated with atmospheric pressure. The results were consistent with those relating to the influence of atmospheric pressure on methane emissions obtained by Wu et al. [32] and Xu et al. [33] in field experiments. When the soil moisture content in the landfill cover and the gas pressure inside the landfill remained stable, changes in the atmospheric pressure altered the gas pressure difference between the top and bottom of the final cover. Changes in the gas pressure distribution in the final cover could, in turn, change the emission of methane gas. Park et al. [25] studied the effects of atmospheric pressure on landfill gas emissions through field experiments, and calculated the methane emissions with linear regression models and atmospheric pressure data. In this study, due to the isolation of the connection between the atmosphere and landfill gas by the GM in most of the testing area, methane emissions measured only in the potential GM damage area (i.e., methane hotspots) showed a significant negative correlation with atmospheric pressure. In covers with GMs, it is unsuitable to estimate methane emissions using atmospheric pressure.

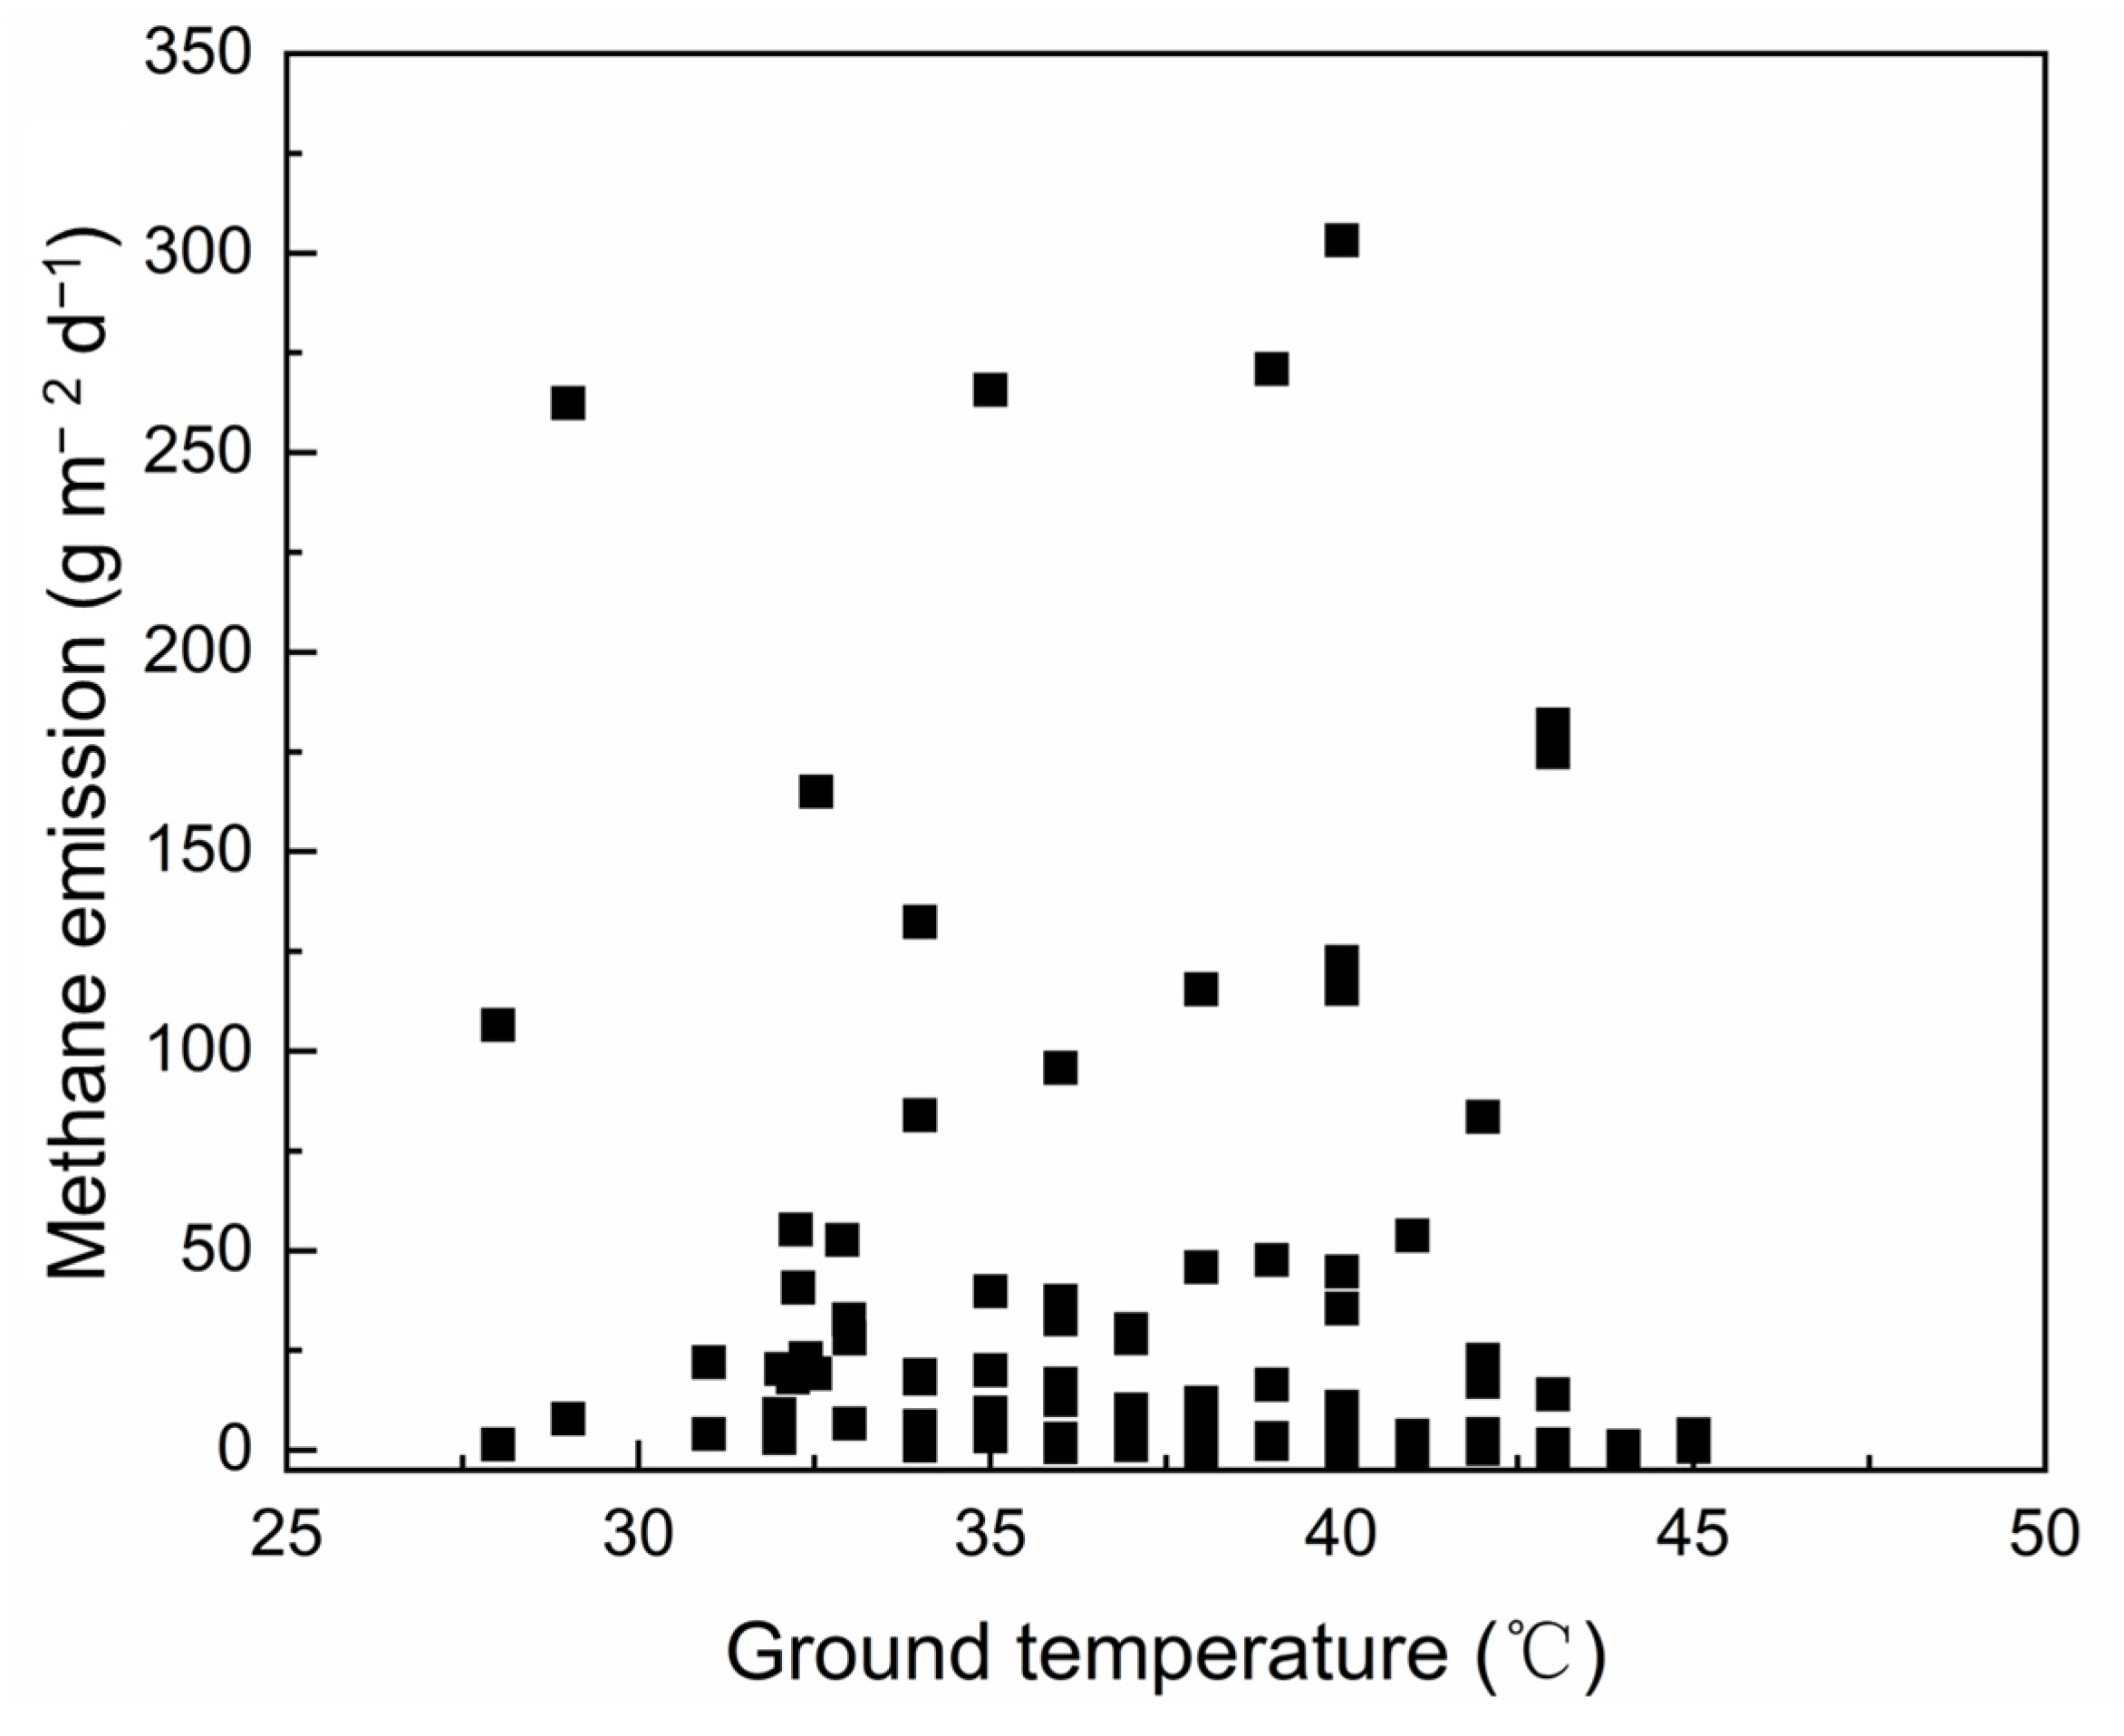
3.4. Influence of Ground Temperature

The ground temperature of the final cover in municipal solid waste landfills may be influenced by climatic conditions, such as humidity, wind, and solar radiation, in addition to the heat conductivity of the landfilled waste and thermal transfer from landfill gas [34]. Furthermore, heat generated by methane-oxidizing microorganisms can also play a role in determining the surface temperature of the cover layer [35]. Figure 7 shows the relationship between the measured methane emissions and ground temperature at the monitoring points. There was no clear correlation between the methane emissions and ground temperature measured at each monitoring point. However, the experimental study conducted by Ishigaki et al. [36] revealed a significant positive correlation between methane emissions and the ground temperature, and they estimated methane emissions using exponential regression models and ground temperature data. The migration of landfill gas and microbial methane oxidation contributed to an increase in the ground temperature [31].
The discrepancy between the results of this study and those reported by Ishigaki et al. [36] may be attributed to two possible factors. On the one hand, most areas of the test site maintained with GMs were in good condition, which effectively prevented the landfill gas from entering the cover. As a result, the thermal transfer of landfill gas and the heat generated by methane oxidation microorganisms in these areas were weak, resulting in a relatively small impact on the ground temperature. The results indicated that GM played an important barrier role in the final cover of the landfill, effectively controlling the release of landfill gas and reducing its impact on the environment [37]. On the other hand, the methane emission test at each monitoring point of the landfill took a long time [21]. Thus, different environmental conditions and the soil conditions of the landfill cover during the test led to the poor regularity of the test results.

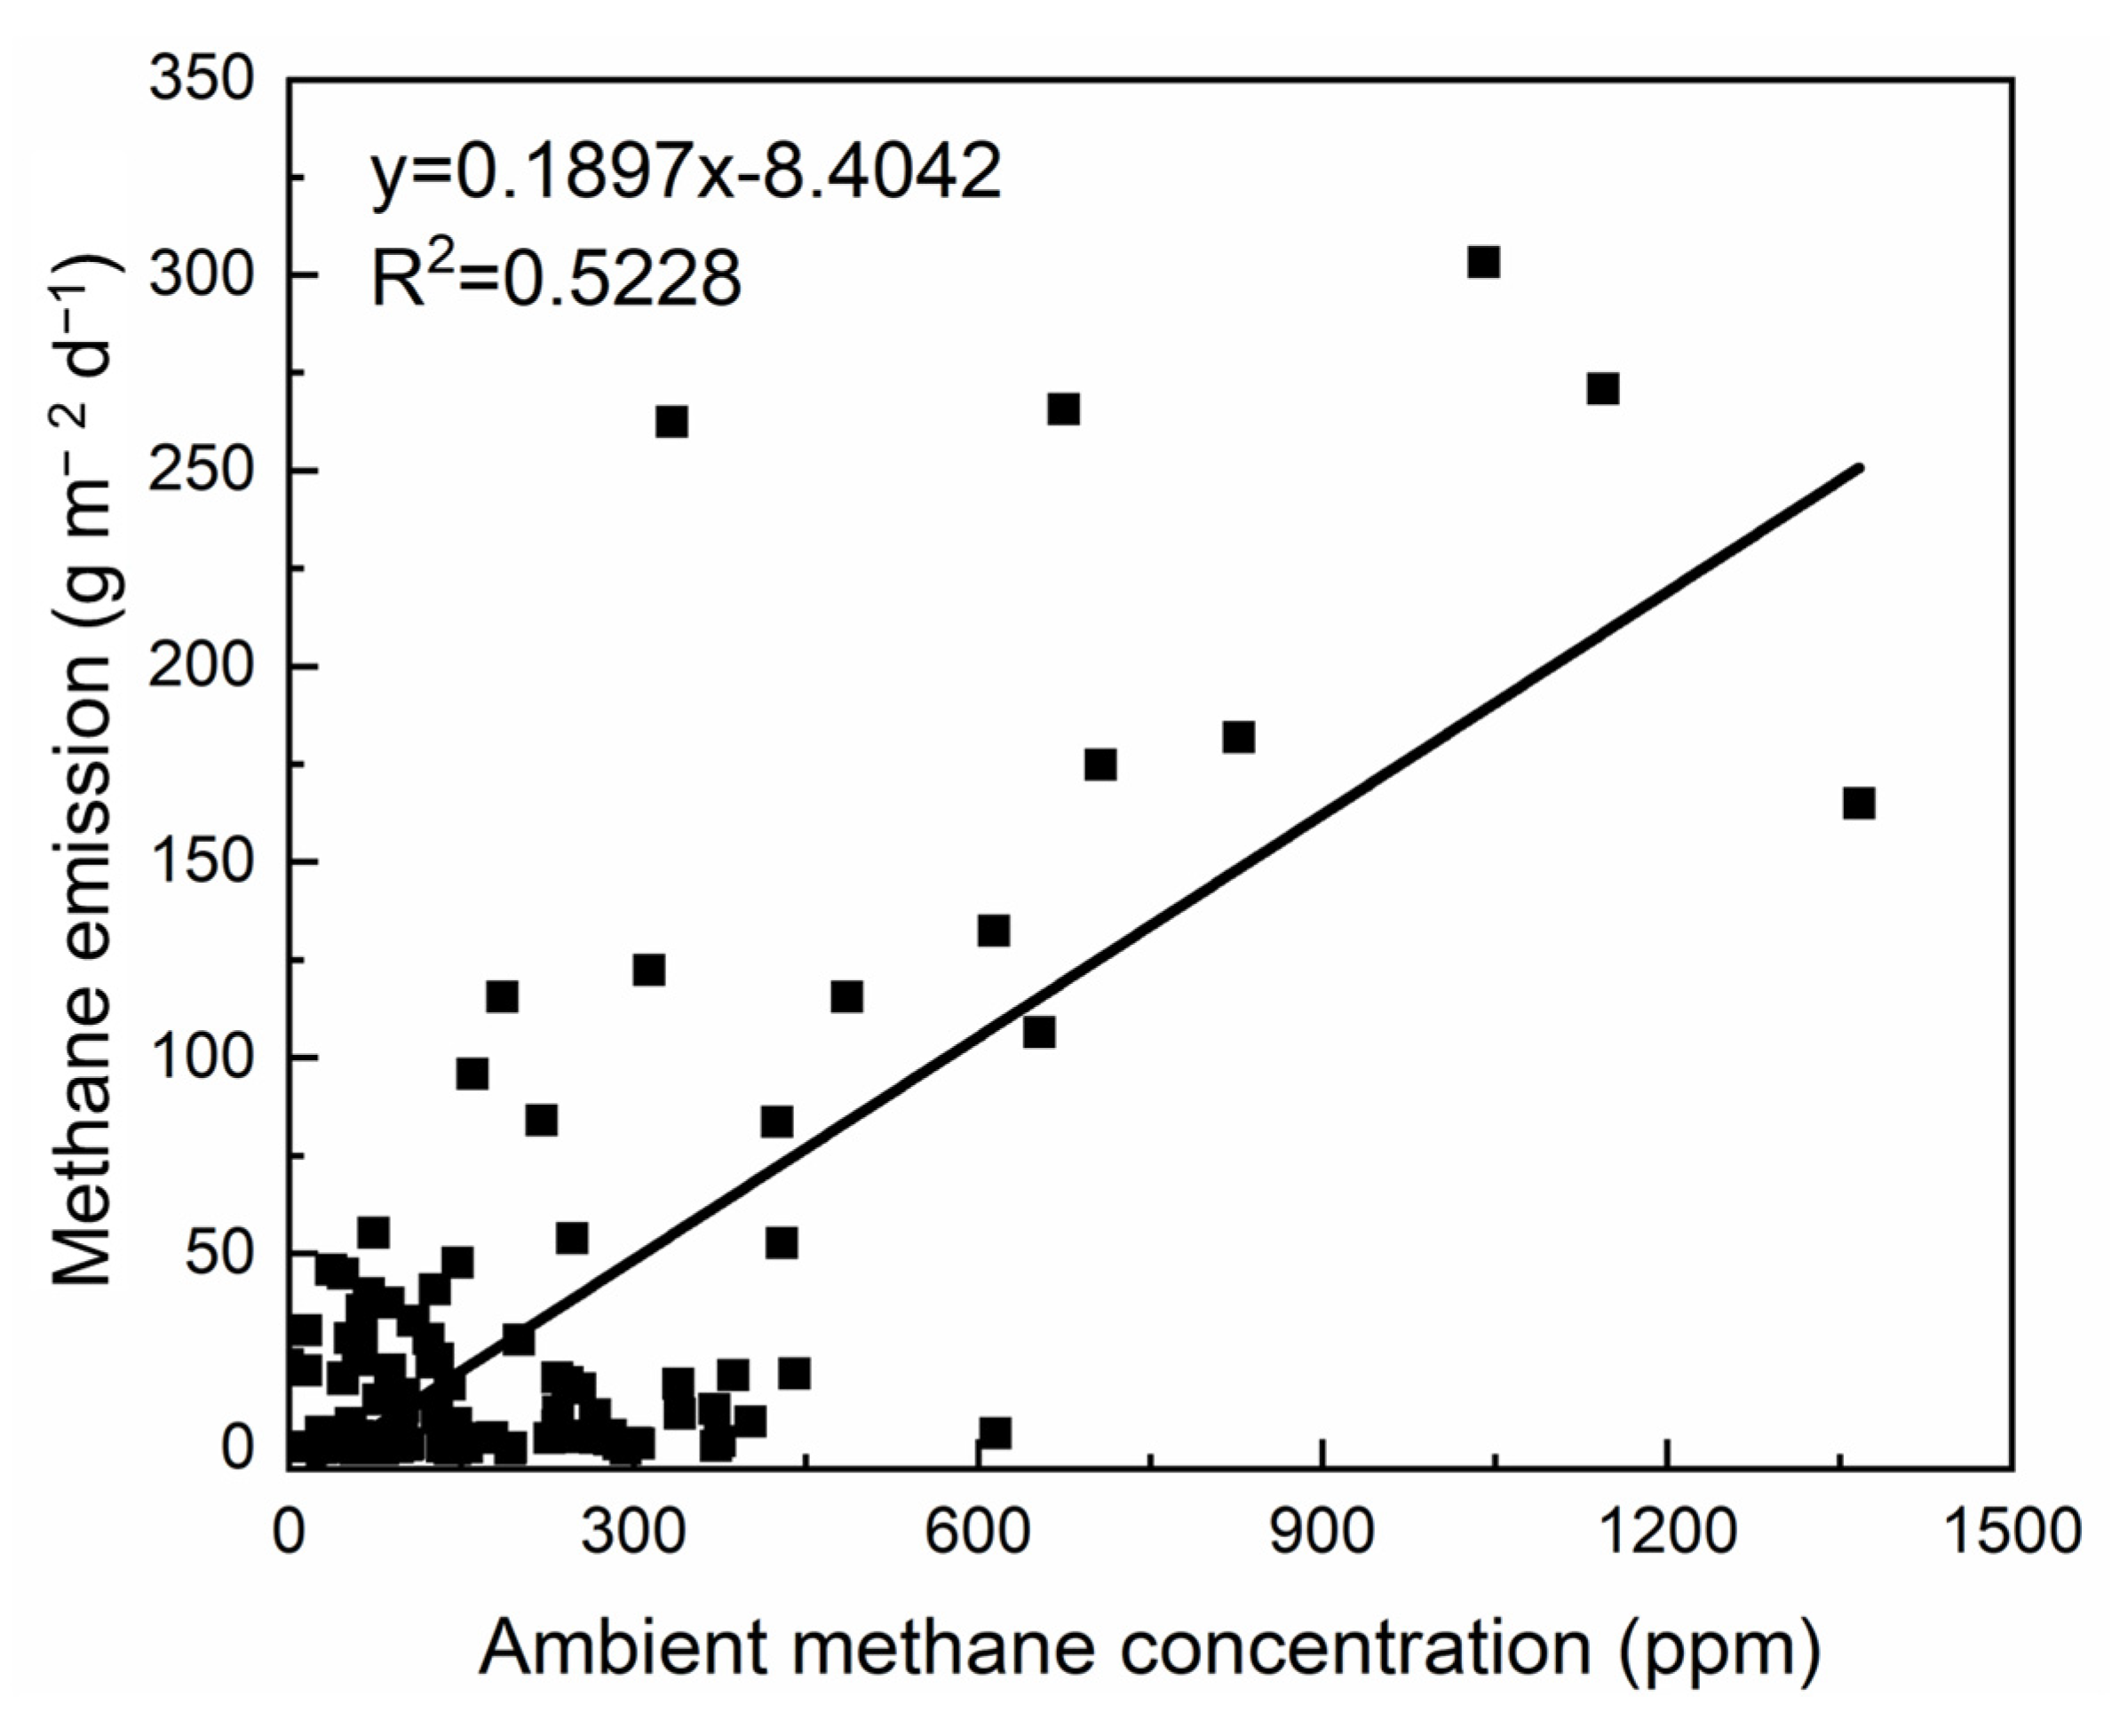
3.5. Relationship between Ambient Methane Concentration and Methane Emission

Figure 8 shows the relationship between the measured ambient methane concentrations and methane emissions. The data were analyzed using a linear function, and the correlation coefficient (R2) was 0.5228. The results indicated a strong positive linear relationship between the measured surface methane emissions and ambient methane concentrations in the test area, which was consistent with the results of Park et al. [25]. Lando et al. [28] reported that the distribution of methane emissions from landfill could be assessed based on the distribution of ambient methane concentrations. According to the data in Figure 8, there was a significant fluctuation in the measured methane emissions corresponding to the same ambient methane concentration. This fluctuation might be related to the gas transport caused by wind, which could lead to variations in methane emission. As wind speed increases, the gas transport speed also increases, leading to a change in methane emissions [38,39]. In addition, environmental factors such as temperature and humidity may also have an impact on methane emissions. He et al. [38] pointed out that wind-induced gas transport can significantly affect the migration and diffusion of landfill gas. Despite the fluctuations in methane emissions measured at the monitoring points, strong correlations between the methane emissions and ambient methane concentrations enable the conversion of ambient methane concentrations into surface methane fluxes [25,28]. This conversion is important for assessing the approximate methane emissions from landfills.
A portable laser methane detector can be used to conduct extensive tests on surface methane concentrations in a short period of time, thereby quickly and accurately obtaining the methane concentration distribution of a large landfill [16]. This method helps to determine the location of methane hotspots and provides a basis for the subsequent arrangement of more representative methane emission monitoring locations. Based on the distribution of methane concentrations in the landfill (as shown in Figure 4) and the fitted relationship between methane emissions and ambient methane concentrations ( y = 0.1897 x 8.4042 ), the maximum value of the estimated methane emission rate can be up to 603.4 g m−2 d−1, while the average methane emission rate of the test area is approximately 4.3 g m−2 d−1. Lando et al. [28] studied methane emissions from exposed working areas and reported that the methane emissions ranged between 0.03 and 155 g m−2 d−1, and that the average value of the estimated methane flux was 38.3 g m−2 d−1. The measured maximum methane emission rate was significantly higher than the result of Lando et al. [28], while the average methane emissions was much lower. This may be due to the difficulty of landfill gas breaking through the blockade of the GM and mainly discharging from GM holes.

4. Conclusions

In this study, a portable methane detector was used to measure the distribution of surface methane concentrations above the landfill final cover, and the methane emissions at each monitoring point were measured in combination with a static chamber. In addition, the effects of rainfall, atmospheric pressure, ground temperature, and the ambient methane concentration on the methane emissions from the final cover were analyzed. This study provides an important reference for landfill gas emission control and environmental protection in landfills.
Due to the influence of multiple factors (such as rainfall, atmospheric pressure, and soil heterogeneity) on the methane emissions from the landfill final cover, the distribution of methane concentrations in the test area showed significant spatial variability, and that the methane concentrations could vary by up to four orders of magnitude. At most of the methane concentration monitoring points (about 73%), the measured methane concentrations were low (<10 ppm). Methane hotspots can roughly indicate the potential areas of GM damage, significantly reducing the GM damage detection area required for subsequent repair.
Meteorological factors could change the methane concentration distribution and emissions in the landfill final cover. Rainfall limited the movement of gases in the final cover, making methane hotspots more pronounced. There was a negative correlation between atmospheric pressure and methane emissions near methane hotspots. Due to the isolation effect of GMs, there was no significant correlation between the ground temperature and methane emissions. Moreover, there was a significant positive linear relationship between the ambient methane concentration and methane emissions. Based on the on-site methane concentration distribution, methane emissions could be estimated using the correlation equation between the ambient methane concentration and methane emissions. The methane concentration test with the laser methane detector is beneficial when aiming to reduce the time and cost of GM damage detection in landfill final covers and can quickly assess methane emissions.

Author Contributions

Conceptualization, S.W. (Shifang Wang), H.X. and T.W.; Methodology, H.H., S.W. (Silin Wu) and T.W.; Validation, T.W., J.C. and G.C.; Formal Analysis, H.H., G.C. and T.W.; Investigation, H.X., J.C. and T.W.; Writing—Original Draft Preparation, T.W.; Writing—Review and Editing, H.H., S.W. (Shifang Wang) and G.C.; Visualization, S.W. (Silin Wu); Funding Acquisition, T.W. and S.W. (Silin Wu). All authors have read and agreed to the published version of the manuscript.

Funding

This research was funded by the “Pioneer” and “Leading Goose” R&D Program of Zhejiang (2022C03051); Project Supported by National Natural Science Foundation of China (42307197); Fundamental Science (Natural Science) Research project of Colleges and Universities in Jiangsu Province (22KJB560003); the Project Supported by the Foundation of Key Laboratory of Soft Soils and Geoenvironmental Engineering (Zhejiang University), Ministry of Education (Grant NO. 2021P05); Exploration Project of the Natural Science Foundation of Zhejiang Province (LQ21E080003, LTZ22D010001); Science and Technology Project of the Ministry of Housing and Urban-Rural Development (2020-K-026, 2021-K-125); the Taizhou Science and Technology Project (22gyb07); and the Jiangsu Fundamental Research Program (Natural Fund Project) (BK20210886).

Institutional Review Board Statement

Not applicable.

Informed Consent Statement

Not applicable.

Data Availability Statement

The data presented in this study are available on request from the corresponding author. The data are not publicly available due to the requirements of the manage- ment department of Honghuagang Landfill.

Conflicts of Interest

The authors declare no conflict of interest.

References

  1. Zarin, R.; Azmat, M.; Naqvi, S.R.; Saddique, Q.; Ullah, S. Landfill site selection by integrating fuzzy logic, AHP, and WLC method based on multi-criteria decision analysis. Environ. Sci. Pollut. Res. 2021, 28, 19726–19741. [Google Scholar] [CrossRef] [PubMed]
  2. Slezak, R.; Krzystek, L.; Ledakowicz, S. Degradation of municipal solid waste in simulated landfill bioreactors under aerobic conditions. Waste Manag. 2015, 43, 293–299. [Google Scholar] [CrossRef] [PubMed]
  3. Amini, H.R.; Reinhart, D.R. Regional prediction of long-term landfill gas to energy potential. Waste Manag. 2011, 31, 2020–2026. [Google Scholar] [CrossRef]
  4. Kashyap, R.K.; Chugh, P.; Nandakumar, T. Opportunities & challenges in capturing landfill gas from an active and un-scientifically managed land fill site—A case study. Procedia Environ. Sci. 2016, 35, 348–367. [Google Scholar]
  5. Ghosh, A.; Kumar, S.; Das, J. Impact of leachate and landfill gas on the ecosystem and health: Research trends and the way forward towards sustainability. J. Environ. Manag. 2023, 336, 117708. [Google Scholar] [CrossRef] [PubMed]
  6. Guo, H.; Xu, H.; Liu, J.; Nie, X.; Li, X.; Shu, T.; Bai, B.; Ma, X.; Yao, Y. Greenhouse Gas Emissions in the Process of Landfill Disposal in China. Energies 2022, 15, 6711. [Google Scholar] [CrossRef]
  7. Rosa, E.A.; Dietz, T. Human drivers of national greenhouse-gas emissions. Nat. Clim. Chang. 2012, 2, 581–586. [Google Scholar] [CrossRef]
  8. IPCC Sixth Assessment Report (Working Group 1 Contribution): Climate Change 2021-The Physical Science Basis|SDG Help Desk. 2021. Available online: http://sdghelpdesk.unescap.org/e-library/ipcc-sixth-assessment-report-working-group-1-contribution-climate-change-2021-physical (accessed on 22 September 2021).
  9. Kriipsalu, M.; Somani, M.; Pehme, K.; Tamm, O.; Truu, J.; Truu, M.; Orupold, K. Performance of biocover in controlling methane emissions from landfill: A decade of full-scale investigation. Process Saf. Environ. Prot. 2023, 172, 486–495. [Google Scholar] [CrossRef]
  10. Barlaz, M.A.; Chanton, J.P.; Green, R.B. Controls on landfill gas collection efficiency: Instantaneous and lifetime performance. J. Air Waste Manag. Assoc. 2009, 59, 1399–1404. [Google Scholar] [CrossRef]
  11. Kavazanjian, E., Jr.; Gutierrez, A. Large scale centrifuge test of a geomembrane-lined landfill subject to waste settlement and seismic loading. Waste Manag. 2017, 68, 252–262. [Google Scholar] [CrossRef]
  12. Bouazza, A.; Vangpaisal, T.; Abuel-Naga, H.; Kodikara, J. Analytical modelling of gas leakage rate through a geosynthetic clay liner–geomembrane composite liner due to a circular defect in the geomembrane. Geotext. Geomembr. 2008, 26, 122–129. [Google Scholar] [CrossRef]
  13. Gilson-Beck, A.; Giroud, J.P. A quantification of the short-term reliability of HDPE geomembrane seaming methods. Geosynth. Int. 2022, 29, 337–341. [Google Scholar] [CrossRef]
  14. Gilson, A. Advancements in field testing for locating geomembrane installation damage. Int. J. Geosynth. Ground Eng. 2021, 7, 72. [Google Scholar] [CrossRef]
  15. Chen, Z.; Gong, H.; Zhang, M.; Wu, W.; Liu, Y.; Feng, J. Impact of using high-density polyethylene geomembrane layer as landfill intermediate cover on landfill gas extraction. Waste Manag. 2011, 31, 1059–1064. [Google Scholar] [CrossRef]
  16. Shen, S.; Chen, Y.; Zhan, L.; Xie, H.; Bouazza, A.; He, F.; Zuo, X. Methane hotspot localization and visualization at a large-scale Xi’an landfill in China: Effective tool for landfill gas management. J. Environ. Manag. 2018, 225, 232–241. [Google Scholar] [CrossRef]
  17. Xie, H.; Fei, S.; He, H.; Zhang, A.; Ni, J.; Chen, Y. Field investigation and numerical modelling of gas extraction in a heterogeneous landfill with high leachate level. Environ. Sci. Pollut. Res. 2022, 29, 76944–76960. [Google Scholar] [CrossRef]
  18. Haro, K.; Ouarma, I.; Nana, B.; Bere, A.; Tubreoumya, G.C.; Kam, S.Z.; Laville, P.; Loubet, B.; Koulidiati, J. Assessment of CH4 and CO2 surface emissions from Polesgo’s landfill (Ouagadougou, Burkina Faso) based on static chamber method. Adv. Clim. Change Res. 2019, 10, 181–191. [Google Scholar] [CrossRef]
  19. Yilmaz, M.; Tinjum, J.M.; Acker, C.; Marten, B. Transport mechanisms and emission of landfill gas through various cover soil configurations in an MSW landfill using a static flux chamber technique. J. Environ. Manag. 2021, 280, 111677. [Google Scholar] [CrossRef] [PubMed]
  20. Giovenali, E.; Coppo, L.; Virgili, G.; Continanza, D.; Minardi, I.; Raco, B. The flux-meter: Implementation of a portable integrated instrumentation for the measurement of CO2 and CH4 diffuse flux from landfill soil cover. In Proceedings of the Fourteenth International Waste Management and Landfill Symposium, S. Margherita di Pula, Cagliari, Italy, 30 September–4 October 2013; Volume 30. [Google Scholar]
  21. Zhan, L.T.; Wu, T.; Feng, S.; Lan, J.W.; Chen, Y.M. A simple and rapid in situ method for measuring landfill gas emissions and methane oxidation rates in landfill covers. Waste Manag. Res. 2020, 38, 588–593. [Google Scholar] [CrossRef]
  22. Bakkaloglu, S.; Lowry, D.; Fisher, R.E.; France, J.L.; Nisbet, E.G. Carbon isotopic characterisation and oxidation of UK landfill methane emissions by atmospheric measurements. Waste Manag. 2021, 132, 162–175. [Google Scholar] [CrossRef]
  23. He, H.; Gao, S.; Hu, J.; Zhang, T.; Wu, T.; Qiu, Z.; Zhang, C.; Sun, Y.; He, S. In-situ testing of methane emissions from landfills using laser absorption spectroscopy. Appl. Sci. 2021, 11, 2117. [Google Scholar] [CrossRef]
  24. Aldhafeeri, T.; Tran, M.K.; Vrolyk, R.; Pope, M.; Fowler, M. A review of methane gas detection sensors: Recent developments and future perspectives. Inventions 2020, 5, 28. [Google Scholar] [CrossRef]
  25. Park, J.K.; Kang, J.Y.; Lee, N.H. Estimation of methane emission flux at landfill surface using laser methane detector: Influence of gauge pressure. Waste Manag. Res. 2016, 34, 784–792. [Google Scholar] [CrossRef] [PubMed]
  26. Tanikawa, N.; Furichi, T.; Ishii, K.; Matsuo, K.; Iseki, T. Development of a convenient method for monitoring of methane in ambient air at landfill sites using a portable open path analyzer, APLAS 2004. In Proceedings of the Third Asia-Pacific Landfill Symposium, Kitakyushu, Japan, 18–20 October 2004; pp. 27–29. [Google Scholar]
  27. Abushammala, M.F.; Basri, N.E.A.; Younes, M.K. Seasonal variation of landfill methane and carbon dioxide emissions in a tropical climate. Int. J. Environ. Sci. Dev. 2016, 7, 586. [Google Scholar] [CrossRef]
  28. Lando, A.T.; Nakayama, H.; Shimaoka, T. Application of portable gas detector in point and scanning method to estimate spatial distribution of methane emission in landfill. Waste Manag. 2017, 59, 255–266. [Google Scholar] [CrossRef] [PubMed]
  29. Zhan, L.T.; Qiu, Q.W.; Xu, W.J.; Chen, Y.M. Field measurement of gas permeability of compacted loess used as an earthen final cover for a municipal solid waste landfill. J. Zhejiang Univ. -Sci. A 2016, 7, 541–552. [Google Scholar] [CrossRef]
  30. Li, G.; Zhan, L.; Zhang, S.; Feng, S.; Zhang, Z. A dual-porosity model for coupled rainwater and landfill gas transport through capillary barrier covers. Comput. Geotech. 2022, 151, 104966. [Google Scholar] [CrossRef]
  31. Zhan, L.T.; Wu, T.; Feng, S.; Li, G.Y.; He, H.J.; Lan, J.W.; Chen, Y.M. Full-scale experimental study of methane emission in a loess-gravel capillary barrier cover under different seasons. Waste Manag. 2020, 107, 54–65. [Google Scholar] [CrossRef]
  32. Wu, T.; Zhan, L.T. Influence of atmospheric pressure on methane emissions from earthen landfill covers. In Proceedings of the 8th International Congress on Environmental Geotechnics Volume 2: Towards a Sustainable Geoenvironment, Hangzhou, China, 28 October–1 November 2018; Springer: Singapore, 2019; pp. 85–92. [Google Scholar]
  33. Xu, L.; Lin, X.; Amen, J.; Welding, K.; McDermitt, D. Impact of changes in barometric pressure on landfill methane emission. Glob. Biogeochem. Cycles 2014, 28, 679–695. [Google Scholar] [CrossRef]
  34. Bian, R.; Xin, D.; Chai, X. Methane emissions from landfill: Influence of vegetation and weather conditions. Environ. Technol. 2019, 40, 2173–2181. [Google Scholar] [CrossRef] [PubMed]
  35. Wu, T.; Zhan, L.; Feng, S.; Chen, P. Numerical analysis of moisture and gas transport in earthen final covers considering effects of vapor and temperature gradient. Soils Found. 2023, 63, 101262. [Google Scholar] [CrossRef]
  36. Ishigaki, T.; Yamada, M.; Nagamori, M.; Ono, Y.; Inoue, Y. Estimation of methane emission from whole waste landfill site using correlation between flux and ground temperature. Environ. Geol. 2005, 48, 845–853. [Google Scholar] [CrossRef]
  37. Wang, Q.; Zuo, X.; Xia, M.; Xie, H.; He, F.; Shen, S.; Bouazza, A.; Zhu, L. Field investigation of temporal variation of volatile organic compounds at a landfill in Hangzhou, China. Environ. Sci. Pollut. Res. 2019, 26, 18162–18180. [Google Scholar] [CrossRef] [PubMed]
  38. He, H.; Wu, T.; Xu, H.; Lu, Y.; Qiu, Z.; Wang, X.; Zhang, P. Investigation on the emission and diffusion of hydrogen sulfide during landfill operations: A case study in Shenzhen. Sustainability 2021, 13, 2886. [Google Scholar] [CrossRef]
  39. Delkash, M.; Zhou, B.; Han, B.; Chow, F.K.; Rella, C.W.; Imhoff, P.T. Short-term landfill methane emissions dependency on wind. Waste Manag. 2016, 55, 288–298. [Google Scholar] [CrossRef]
Figure 1. The Phase II landfill area of the Honghualing municipal solid waste landfill.
Atmosphere 14 01598 g001
Figure 2. Distribution of monitoring points for surface methane concentration in the test area.
Atmosphere 14 01598 g002
Figure 3. Schematic representation of methane concentration measurement using a portable laser methane detector.
Atmosphere 14 01598 g003
Figure 4. Typical distribution of methane concentrations in the test area.
Atmosphere 14 01598 g004
Figure 5. Distribution of methane concentrations in the test area measured after rainfall.
Atmosphere 14 01598 g005
Figure 6. Relationship between atmospheric pressure and methane emissions from the landfill cover.
Atmosphere 14 01598 g006
Figure 7. Relationship between the measured ground temperature and methane emissions.
Atmosphere 14 01598 g007
Figure 8. Relationship between the measured ambient methane concentrations and methane emissions.
Atmosphere 14 01598 g008
Disclaimer/Publisher’s Note: The statements, opinions and data contained in all publications are solely those of the individual author(s) and contributor(s) and not of MDPI and/or the editor(s). MDPI and/or the editor(s) disclaim responsibility for any injury to people or property resulting from any ideas, methods, instructions or products referred to in the content.

