Article

Comparative Analysis of BALSSA and Conventional NWP Methods: A Case Study in Extreme Storm Surge Prediction in Macao

1
Faculty of Applied Sciences, Macao Polytechnic University, R. de Luís Gonzaga Gomes, Macao, China
2
Engineering Research Centre of Applied Technology on Machine Translation and Artificial Intelligence of Ministry of Education, Macao Polytechnic University, R. de Luís Gonzaga Gomes, Macao, China
3
Department of Computer Science and Engineering—DISI, University of Bologna, Via Zamboni, 33, 40126 Bologna, Italy
4
Computer Science Department, UCLA, 404 Westwood Plaza, Westwood, Los Angeles, CA 90095-1596, USA
*
Author to whom correspondence should be addressed.
Atmosphere 2023, 14(11), 1597; https://doi.org/10.3390/atmos14111597
Submission received: 27 September 2023 / Revised: 20 October 2023 / Accepted: 23 October 2023 / Published: 25 October 2023

Abstract

:
In coastal regions, accurate storm surge prediction is crucial for effective disaster management and risk mitigation. This study presents a comparative analysis between BALSSA (Bidirectional Attention-based LSTM for Storm Surge Architecture) and the Japan Meteorological Agency (JMA) numerical storm surge model, focusing on the Saola-induced storm surge in Macao, September 2023. To train and assess the model, we leverage an extensive dataset comprising meteorological and tide level information from more than 80 typhoon occurrences in Macao spanning the period from 2017 to 2023. The results provide evidence of BALSSA’s effectiveness in capturing the complex spatio-temporal dynamics of storm surges, with a lead time of up to 72 h, as reflected by its MAE of 0.019 and RMSE of 0.024. It demonstrates reliable accuracy in predicting storm surge magnitude, timing, and spatial extent, potentially contributing to more precise and timely warnings for coastal communities. Furthermore, the real-time data assimilation feature of BALSSA ensures up-to-date information, aligned with the latest observations, which is essential for effective emergency preparedness and response. The high-resolution grids enhance risk assessment, highlighting BALSSA’s potential for early warnings, emergency planning, and coastal risk management. This study contributes valuable insights to the broader field of storm surge prediction, guiding decision-making processes and supporting the development of effective strategies to enhance coastal resilience.

1. Introduction

Macao, with a population of about 680,000 and an area of 33.3 km2, stands as one of the most densely populated regions in the world. Its vulnerability to storm surge impacts is significantly amplified by the region’s low-lying coastal terrain, particularly in its western and north-western parts [1,2,3]. The occurrence and intensity of tropical cyclones, subject to ongoing scientific debate and influenced by various factors including climate change [4,5,6,7], play a pivotal role in determining the risk of storm surges in the region [8]. Therefore, accurate and timely storm surge prediction methods are crucial for effective risk management and disaster preparedness in this densely populated area [9,10].
In this paper, we aim to compare the performance of BALSSA, a novel bidirectional attention-based long short-term memory (LSTM, a type of recurrent neural network (RNN) architecture commonly used in deep learning for processing sequential data, particularly in tasks involving time series analysis) model, with the conventional forecasting method for the prediction of a storm surge event that took place recently in Macao [11]. By evaluating the performance of BALSSA relative to traditional prediction methods [12], we aim to highlight the significance of advanced machine learning techniques in enhancing storm surge predictions [13,14,15,16,17,18]. The focus of this study is on the extreme storm surge event that occurred on 2 September 2023, as it serves as a compelling case study to demonstrate the capabilities of BALSSA [19].
Through a comprehensive comparative analysis, we present the accuracy, precision, and other relevant metrics of BALSSA. By examining the performance differences, we shed light on the strengths and limitations of each approach, paving the way for improved storm surge prediction [20,21]. The findings of this research have strong implications for decision-makers, coastal communities, and stakeholders involved in risk management, disaster preparedness, and response [22,23]. Overall, this study contributes to the growing body of knowledge on storm surge prediction and highlights the urgent need for advanced forecasting techniques to address the evolving risks faced by densely populated regions [22,24,25,26,27].

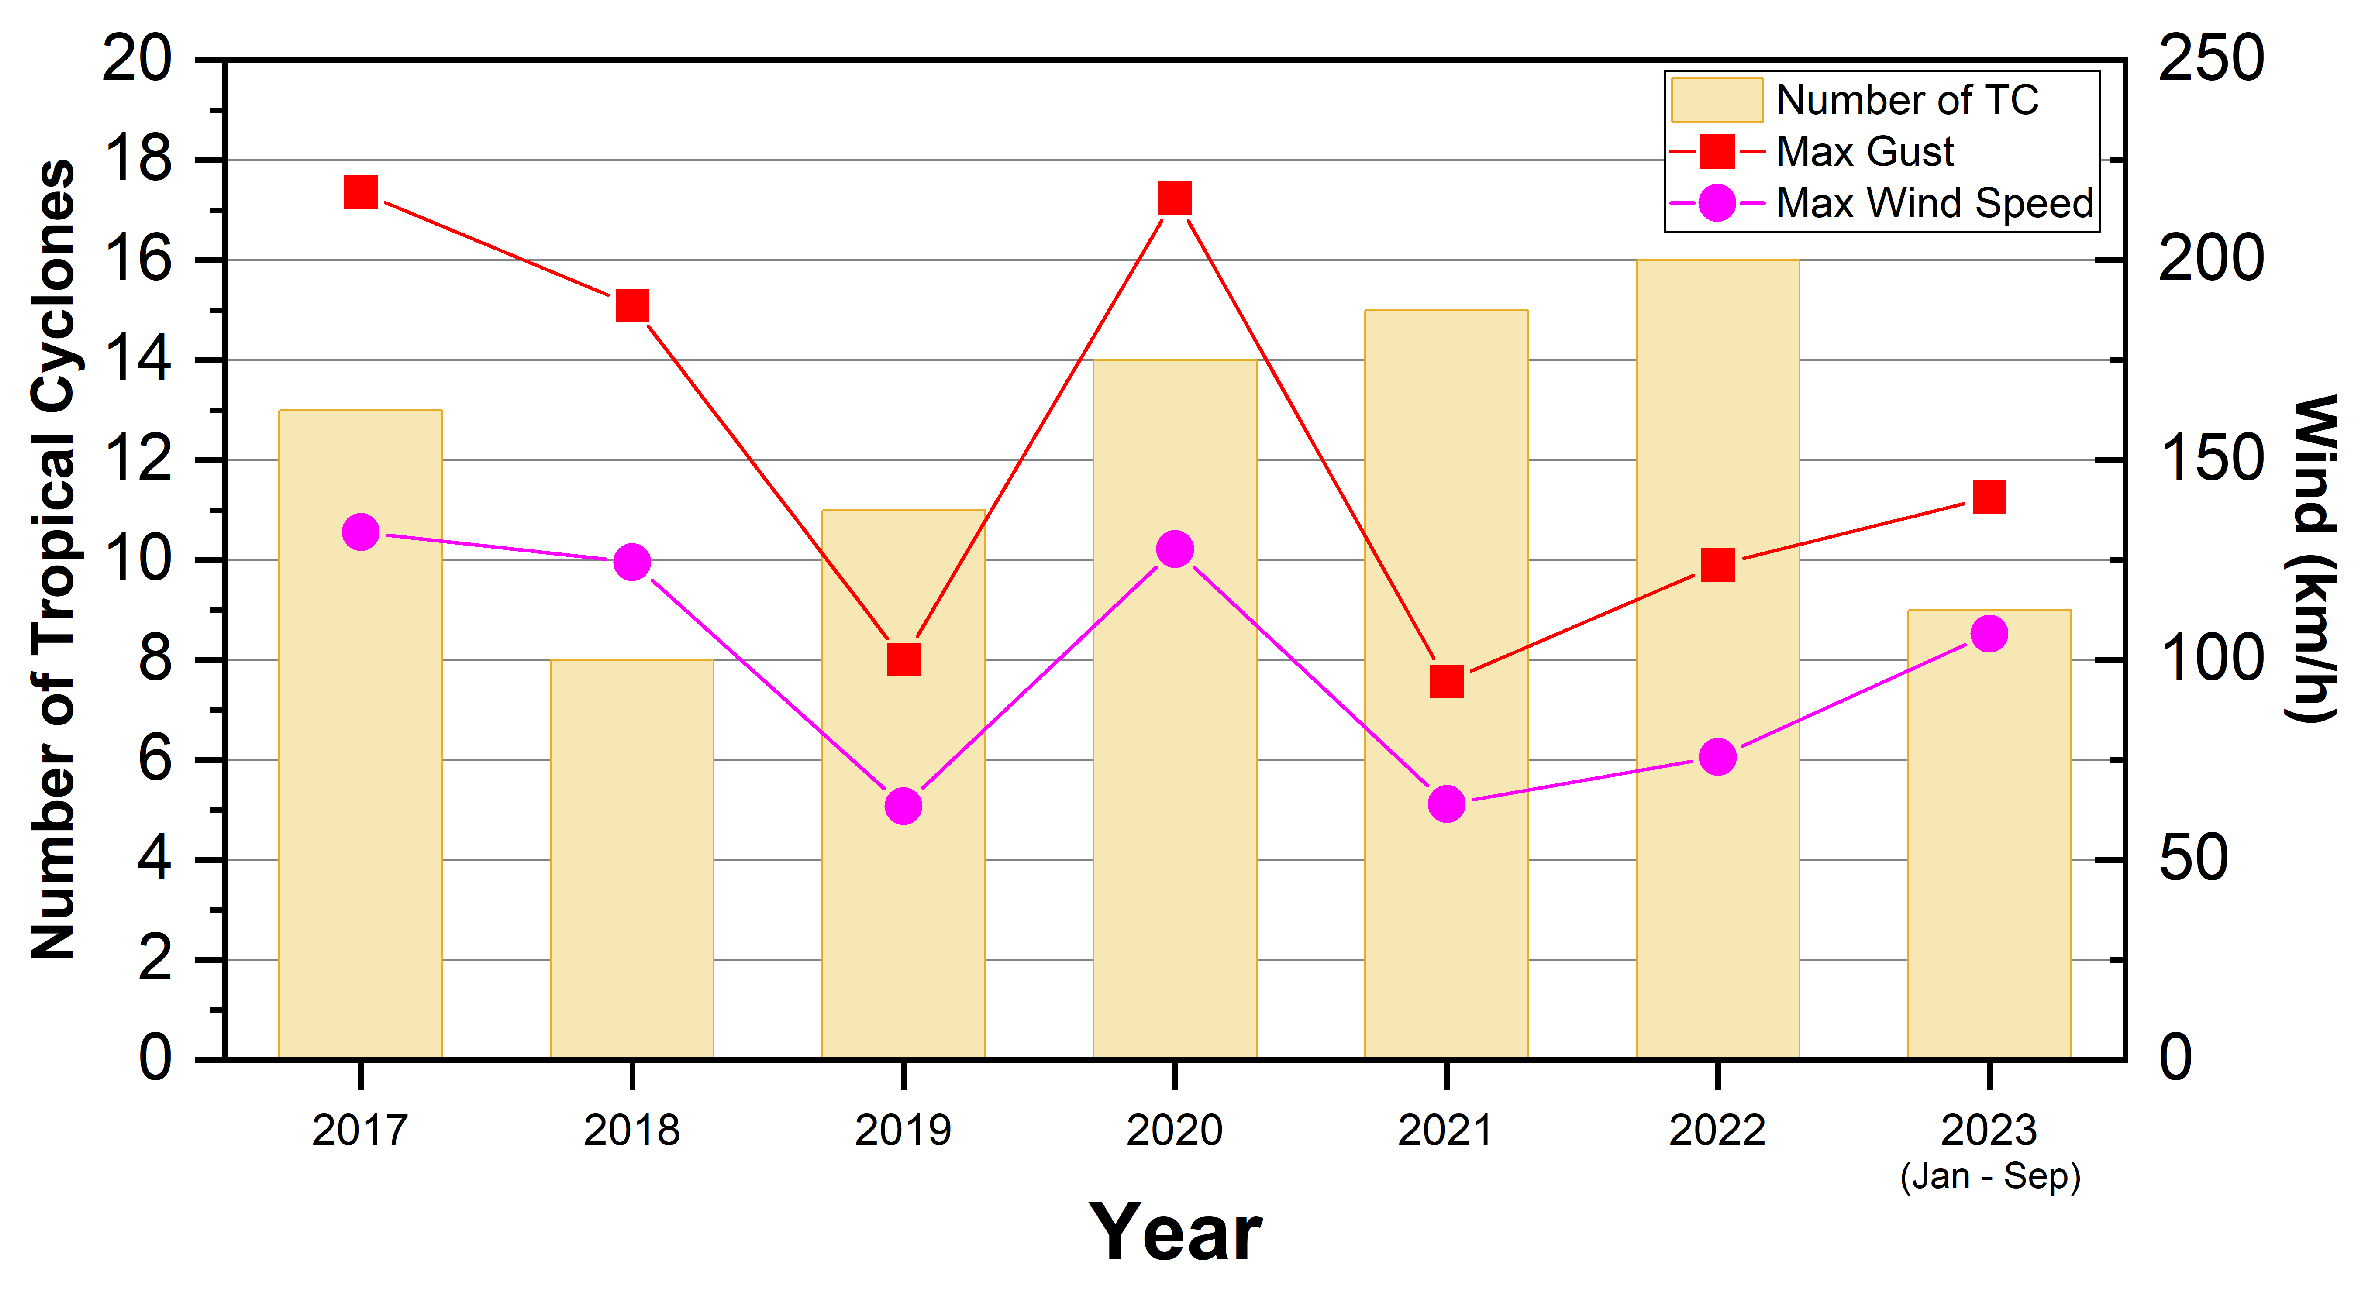
1.1. Analysis of Typhoon Saola

On 24 August 2023, a tropical low-pressure system formed in the Pacific Ocean east of the Philippines. It gradually intensified and became Typhoon Saola. The typhoon was initially located about 720 km northeast of Manila, with maximum winds of 15 m/s and a minimum pressure of 1004 hPa. It was predicted to strengthen further and potentially reach strong or super typhoon levels (maximum winds of 45–52 m/s) as it moved northwest towards the eastern coast of Taiwan. However, there was uncertainty about its exact path. It was expected to approach the coastal areas of Fujian and Guangdong in China after potentially making landfall or passing near the southern part of Taiwan. As of 28 August, Typhoon Saola was a strong typhoon with maximum winds of 48 m per second and a minimum pressure of 945 hPa. It was projected to continue moving northwest, gradually intensify, and potentially brush or make landfall in southern Taiwan before approaching the coasts of Fujian and Guangdong.
Typhoon Saola has intensified into a super typhoon on 29 August 2023. With maximum wind speeds of 16 levels and a minimum pressure of 935 hPa, its center was located southeast of Taiwan. The forecast projected its movement towards the northwest, gradually approaching the coastal areas of Fujian and eastern Guangdong in China. The typhoon was expected to potentially make landfall in eastern Guangdong on 1 or 2 September, bringing strong winds and heavy rainfall to the region. Precautions were advised for maritime activities in the Bashi Strait, east of Taiwan, and the northeastern South China Sea.
On 30 August 2023, at 9:00 a.m., the center of Super Typhoon Saola was located approximately 580 km southeast of Huilai, Guangdong Province, China. The typhoon had maximum wind speeds exceeding 17 levels (62 m/s) and a minimum pressure of 915 hPa. It was projected to move northwestward at a speed of 10–15 km per hour, gradually approaching the northeastern South China Sea and the coastal areas of eastern Guangdong and southern Fujian (Figure 1). There was a possibility of landfall along the aforementioned coastal regions on 1 September, with the typhoon maintaining its intensity as a strong or super typhoon (45–52 m/s, 14–16 levels). Precautions were advised for Guangdong and Fujian, as the typhoon was expected to have a significant impact on these areas, with strong winds and prolonged heavy rainfall (Figure 2).
On 2 September 2023, at around 3:30 a.m., Super Typhoon Saola made landfall in the Jinwan District of Zhuhai, Guangdong Province, China, with maximum near-center wind speeds of 45 m per second and a minimum pressure of 950 hPa classifying it as a strong typhoon. This marked the strongest typhoon to make landfall in Guangdong in 2023. After landfall, Saola gradually moved west–southwest along the coastal areas of Guangdong. Later, around 1:50 p.m. on the same day, Typhoon Saola made a secondary landfall on Hailing Island in Yangjiang, Guangdong, with maximum near-center wind speeds of 10 levels (Figure 3).

1.2. The Induced Storm Surge Event

Typhoon “Saola” was an intensely powerful and compact storm with relatively weak outer winds. Even a small change in its track could have significantly altered weather impacts on Macao. After circling the northwest Pacific, “Saola” entered the South China Sea as a super typhoon approaching Guangdong coastlines. It ultimately passed within 20–30 km south of Macao along an exceptionally close path. Parts of the region experienced winds reaching speeds of up to 104 km/h (65 mph) and gusts exceeding 118 km/h (73 mph) under the influence of the eyewall.
Forecast models initially predicted “Saola” would bring a notable storm surge to Macao and the Pearl River estuary due to meteorological disaster risk considerations. Consequently, the Meteorological Bureau issued a rare red warning, anticipating water levels over 1.5–2.5 m above roads. However, the super typhoon “Saola” underwent a more rapid weakening than initially expected, coupled with a slight increase in forward speed. As a result, the surge that occurred coincided with a period of high tide, but it was weaker than the initial predictions had indicated. The impact of this reduced surge was limited to minor coastal flooding in the southern area of the Inner Harbour. Consequently, instead of warranting a red warning level, the observed conditions only reached the threshold for a yellow warning level, indicating a lower severity than initially estimated.
Alarmingly, “Saola” was the fourth no. 10 signal issued in seven years, which is a stark increase from four such warnings in the prior 49 years. This sharp rise in intense typhoons underscores the climate crisis’ role in exacerbating weather disasters through more powerful storms capable of producing devastating storm surges like those originally forecast for “Saola” [28,29,30]. If left unmitigated, climate change effects may further heighten harmful storm surge risks to low-lying coastal cities like Macao in the future.

2. Methodology

This section delves into the various aspects of storm surge prediction and explores alternative approaches to improve its accuracy. It begins by providing an overview of the concept of storm surge and its significant impacts on coastal regions. The limitations and challenges associated with conventional Numerical Weather Prediction (NWP) methods commonly used in storm surge prediction are then examined [31,32,33,34]. Building upon this understanding, we propose an alternative approach, the BALSSA model, which offers unique features to address the limitations of traditional methods [35,36]. The key features and capabilities of BALSSA are discussed, highlighting its potential to enhance storm surge prediction. By presenting a comprehensive overview of storm surge prediction and introducing an alternative approach, this section aims to provide valuable insights into the current challenges and potential advancements in this critical field.

2.1. Concept of Storm Surge and Potential Impacts on Coastal Regions

Storm surge refers to the abnormal rise in sea level that occurs during storms, particularly those associated with tropical cyclones, hurricanes, or intense extratropical storms [8]. It is caused by a combination of factors, including low atmospheric pressure, strong onshore winds, and the gravitational effects of the moon and sun. Storm surges pose significant risks to coastal regions, as they can result in devastating flooding, erosion, and damage to infrastructure and human lives [1,10,26].
During a storm, the strong winds blowing over the ocean’s surface generate a considerable amount of kinetic energy, pushing the water towards the coast. The low atmospheric pressure associated with the storm exerts an additional upward force on the ocean surface. As a result, sea levels rise above their normal levels, leading to the formation of a dome-shaped bulge of water. When this bulge reaches the coast, it can cause a rapid and significant increase in sea level, resulting in a storm surge [25].
The impacts of storm surges on coastal regions can be severe and wide-ranging. The primary impact is coastal flooding, which can inundate low-lying areas, including residential and commercial areas, infrastructure such as roads and bridges, and critical facilities like hospitals and power plants. The flooding caused by storm surges can also contaminate freshwater sources, leading to additional difficulties for affected communities [2,3,9]. In densely populated coastal areas, storm surges pose a significant threat to human lives. The rapid rise in water levels can leave people trapped, and the strong currents associated with surges can make evacuation and rescue operations challenging. Furthermore, storm surges can cause significant damage to buildings, including homes, businesses, and infrastructure, leading to substantial economic losses for affected regions.
The potential impacts of storm surges are further amplified by climate change and rising sea levels. As global temperatures increase and sea levels rise, storm surges are likely to become more frequent and more severe. The combination of higher baseline sea levels and storm-induced surges can result in a greater extent of coastal flooding, posing long-term challenges for coastal communities and ecosystems [13,27].
Given the potential risks associated with storm surges, accurate prediction and early warning systems are crucial. Timely and reliable forecasts of storm surge events allow for appropriate emergency planning, evacuation measures, and the implementation of coastal defense strategies. Advances in numerical weather prediction models and data-driven approaches, such as BALSSA, offer promising tools for improving storm surge predictions and enhancing coastal resilience [14,22].
By understanding the concept of storm surge and its potential impacts on coastal regions, researchers and policymakers can work towards developing effective mitigation strategies, enhancing infrastructure resilience, and ensuring the safety and well-being of coastal communities in the face of extreme weather events.

2.2. Conventional Numerical Weather Prediction (NWP) Method for Storm Surge Prediction

The conventional approach for storm surge prediction, known as Numerical Weather Prediction (NWP), employs atmospheric and oceanic models to simulate the intricate interactions among the atmosphere, ocean, and land during a storm event [20]. This method integrates observational data, atmospheric conditions, and other pertinent factors to generate forecasts for various meteorological parameters such as wind fields, atmospheric pressure, and precipitation. Subsequently, these meteorological forecasts are combined with hydrodynamic models to estimate the resulting storm surge.
The atmospheric models employed in NWP integrate mathematical equations that capture the dynamic behavior of the atmosphere, encompassing key variables like temperature, humidity, and wind speed [21]. These models heavily rely on initial conditions and boundary data acquired from weather observations, which are assimilated into the model to enhance the precision of the forecasts. The atmospheric model’s output furnishes the atmospheric forcing parameters, including wind fields, which subsequently serve as inputs for the hydrodynamic models.
Hydrodynamic models simulate the response of water to atmospheric forcing, encompassing parameters such as wind stress, atmospheric pressure, and tidal information. These models employ equations governing fluid dynamics to predict the movement and behavior of water, including the formation and propagation of storm surges [12]. Through the integration of outputs from both atmospheric and hydrodynamic models, the conventional NWP method generates predictions concerning storm surge characteristics, including height, duration, and spatial extent.

2.3. Challenges and Limitations of Conventional NWP Methods in Predicting Extreme Storm Surges

While conventional NWP methods have improved storm surge prediction capabilities, they still face several challenges and limitations, particularly when it comes to predicting extreme storm surges:
  • Spatial Resolution: NWP models have limited spatial resolution, hindering the accurate capture of coastal features. Machine learning can enhance resolution by learning from data and generating downscaled predictions that better represent localized coastal dynamics.
  • Uncertainties in Initial Conditions: Sparse observational data can introduce uncertainties in initial conditions, impacting storm surge prediction accuracy in NWP models. Machine learning models leverage diverse data sources, advanced algorithms, and historical data to improve initial condition accuracy and enhance prediction reliability.
  • Parameterization of Physical Processes: Parameterization schemes in NWP models can introduce uncertainties to storm surge predictions. Machine learning approaches leverage data and simulations to develop data-driven parameterizations that capture complex atmospheric and oceanic interactions more effectively [37,38,39].
  • Coastal Boundary Conditions: The accurate representation of coastal features is crucial for precise storm surge predictions. Machine learning can integrate data sources and historical records to improve the characterization of coastal boundary conditions [40,41].
  • Computational Resources and Processing Time: High-resolution NWP models require significant computational resources and time. Machine learning methods, like reduced-order modeling, help streamline computations and accelerate processing for operational storm surge forecasting.
  • Importance of Human Expertise: In NWP, human expertise is crucial for interpreting and analyzing model outputs, identifying biases, ensuring physical consistency, and providing context-specific insights beyond algorithms. While machine learning streamlines the process and reduces human intervention, it also has the potential to enhance accessibility, making storm surge predictions more user-friendly for a wider audience, including those with less technical expertise.
By leveraging machine learning methods to address these challenges and limitations of NWP methods, while also recognizing and incorporating human expertise, it is possible to enhance the accuracy, resolution, computational efficiency and improve preparedness for the “next-generation” of storm surge predictions [15,42].

2.4. Exploring BALSSA: A Bidirectional Attention-Based LSTM for Storm Surge Architecture

BALSSA (Bidirectional Attention-based LSTM for Storm Surge Architecture) is a deep learning approach specifically designed for storm surge prediction [11]. It leverages the power of bidirectional LSTM networks and attention mechanisms to capture temporal dependencies and spatial relationships in storm-surge-related data, as shown in Figure 4. The bidirectional LSTM layer played a pivotal role in transforming the input data, denoted as x1…n, into a sequence of output vectors O1…n. These vectors contained essential information about the historical sea water levels. Subsequently, this output sequence was passed to the attention layer, which assigned adaptive weights W1…n to the input features, emphasizing their importance. The outputs of both layers were then employed to predict abnormalities in sea water levels, specifically forecasting the sea level at time t + 1 based on past information (t) and the attention weights.
The bidirectional LSTM layer, an integral component of BALSSA, is a type of recurrent neural network (RNN) layer widely adopted in deep learning models for time series data. Its distinctive characteristic lies in its ability to capture both past and future contexts by leveraging the advantages of both forward and backward processing of inputs. This capability facilitates the extraction of more meaningful representations from the input data. To achieve bidirectional processing, we employed two separate LSTM layers that processed the input sequence in opposing directions. One layer operated in the forward direction, from the first time step to the last, while the other layer operated in the backward direction, from the last time step to the first. This arrangement enabled the model to capture both the past and future contexts, thereby supporting predictions of future events and capturing long-range dependencies and intricate patterns within the input sequence. At each time step, each LSTM layer maintained a hidden state vector that preserved the previous context of the input sequence. Finally, the outputs of the forward and backward layers were concatenated to form a unified output vector:
h t = [ h t ; h t ]
where h t represents the hidden state vector of the forward LSTM layer at time step t, and h t denotes the hidden state vector of the backward LSTM layer at the same time step.
The attention layer is a pivotal component that allows us to assign variable weights, denoted as w1…n, to different input features instead of treating them equally. This dynamic weighting mechanism enables a more nuanced representation of the input data, where certain parts are prioritized while others are disregarded. As a result, the model achieves improved accuracy and faster convergence. To compute the attention weights, the input is first passed through a dense layer, transforming the features into a set of representations. These representations are then processed by a softmax layer to calculate the attention weights based on their values. The attention weights, w1…n, are trainable parameters that capture the relationships between the features. By multiplying the attention weights with their corresponding feature representations, we obtain a weighted sum that represents the output of the attention layer.
The use of the attention layer allows us to effectively capture the significance of different input features. For example, in the context of this research, sudden changes in wind velocity and pressure may carry different weights based on their relative magnitudes. Analyzing and visualizing the attention weights provides insights into the model’s decision-making process and highlights the most important parts of the input. By fine-tuning the weights and parameters of the attention layer through backpropagation, we can enhance the model’s accuracy and better utilize the available data.
Key features of BALSSA include:
  • Bidirectional LSTM: This incorporates bidirectional LSTM layers, which process input data in both forward and backward directions. This enables the model to capture dependencies and patterns from past and future time steps, enhancing its ability to learn complex temporal relationships in storm surge data.
  • Attention Mechanism: BALSSA employs attention mechanisms to assign varying weights to distinct segments of the input sequence. This enables the model to concentrate on pertinent spatial and temporal features that provide the most informative insights for storm surge prediction. By prioritizing crucial features, the model can proficiently extract and integrate the most relevant information from the input data.
  • Long Short-Term Memory (LSTM): LSTMs excel at modeling long-term dependencies in sequential data. BALSSA employs LSTM to capture the data’s temporal dynamics, facilitating the learning and prediction of intricate patterns over time.
  • Spatial–Temporal Fusion: BALSSA integrates spatial and temporal information by combining coastal topography with historical storm surge data and meteorological variables. This fusion allows the model to capture local coastal dynamics and the influence of meteorological conditions on storm surge generation.
  • Interpretability: The attention mechanism in BALSSA offers interpretability, revealing the input features that contribute most significantly to the model’s predictions. This interpretability aids in understanding the underlying physical processes and validating the model’s performance against domain knowledge, fostering valuable insights.
BALSSA presents a promising alternative for storm surge prediction, incorporating bidirectional LSTM layers and attention mechanisms to capture temporal dependencies and spatial relationships in storm surge data [11]. This integration of spatial and temporal information, along with the interpretability provided by attention mechanisms, enhances predictive capabilities and offers insights into the underlying physical processes. These qualities make it a valuable tool for decision-making, risk assessment, and disaster preparedness in storm-surge-prone areas. In summary, BALSSA’s combination of bidirectional LSTM layers, attention mechanisms, and integration of spatial and temporal information positions it as a promising approach for storm surge prediction, supporting informed decision-making and preparedness efforts [34,43,44].

3. Experimental Framework

3.1. Data Collection

The coastal region of the Pearl River Delta faces significant risks from natural disasters, particularly typhoons and storm surges. Accurate and timely forecasting of these events is vital for protecting coastal communities. To ensure reliable training data for modeling, we collect information from the Macao Meteorological and Geophysical Bureau, the official weather department of the city [45]. Our training dataset spans from 2017 to 2023 and includes meteorological ground station and tidal gauge data, covering numerous typhoons and resulting storm surge incidents. This comprehensive dataset comprises 690,000 records collected at five-minute intervals, along with observation data for tropical cyclones during the same period. Figure 5 displays the annual frequency of typhoon incidents, ranging from 8 to 16, along with their maximum wind speed and gust. The landfall locations of these typhoons, which caused significant storm surge incidents, primarily concentrate along China’s southeastern coast. Notably, the super typhoons Hato (2017) and Manghut (2018) inflicted severe storm surges, making landfall in Zhuhai’s southern coast and the Taishan coast of Jiangmen, Guangdong Province, respectively. These two typhoons resulted in substantial economic losses in Macao, amounting to billions of dollars [2,3,12,46].
BALSSA’s training incorporates crucial parameters (Table 1), such as sea tidal level, sea temperature, wind velocity, wind direction, and atmospheric pressure, along with their corresponding tendency changes [47,48,49,50]. An innovative aspect of this study is the inclusion of tendency fluctuations in air pressure and wind velocity as additional features for model training, providing insights into short-term variations and improving accuracy and responsiveness. This comprehensive dataset allows for evaluating the model’s effectiveness across diverse typhoon conditions [51]. For instance, the storm surge caused by typhoon Saola in September 2023 reveals correlations between surge level increments, changes in wind velocity tendency, and atmospheric pressure tendencies (Figure 6). The shaded area in both Figure 6a,b represents abnormal water level increases. Notably, a strong positive correlation is observed between the surge level increments and changes in wind velocity tendency (Figure 6a). Similarly, a significant inverse relationship is evident between water level anomalies and variations in atmospheric pressure tendencies (Figure 6b). These correlations offer valuable insights into the complex dynamics of storm surges, highlighting the interrelationships between wind changes, surge levels, and the inverse association with atmospheric pressure tendencies.
Incorporating trend fluctuations in atmospheric pressure and wind velocity as additional features significantly enhances performance [52,53,54]. Independent tests with various machine learning models demonstrate that integrating these tendency variations enhances the predictive capabilities (Figure 7). This enables the models to capture temporal patterns and relationships more accurately, resulting in improved storm surge predictions and proactive decision-making. By incorporating tendency features in wind velocity and atmospheric pressure, BALSSA’s predictive capabilities are enhanced, providing insights into their dynamic behavior and their impact on surge formation. This empowers decision-makers and coastal communities to better prepare for and respond to storm surge events [44].

3.2. Data Preprocessing

Addressing the challenge of limited and inconsistent data availability in predicting storm surge events, data imputation strategies like mean interpolation have been utilized to fill in missing information and improve machine learning model training [55,56]. In our study, we conducted preprocessing steps, including data normalization, mean interpolation, and identifying meteorological parameters strongly correlated with storm surges [57]. Data normalization (Equation (1), where e ¯ represents the mean value, and S d denotes the standard deviation) involved standardizing the data by subtracting the mean value and dividing it by the standard deviation (Equation (2), where N represents the total number of data points, x i represents each individual data point, and x ¯ represents the mean value). This process facilitated data correlation analysis and model training, revealing meaningful relationships between meteorological elements and storm surge dynamics. Handling missing data posed challenges due to the complex interactions between meteorological and tidal factors. To overcome these challenges, we employed appropriate metrics and validation methodologies that effectively addressed the complexities associated with missing data, utilizing mean imputation, median imputation, and regression imputation techniques.
Normalized Value = Original Value e ¯ S d
S d = 1 N i = 1 N ( x i x ¯ ) 2
The dataset was partitioned into three distinct sets: training, validation, and testing. The training set, which represented 70% of the data, consisted of approximately 483,000 entries or 1670 days. Its main purpose was to train the model and capture underlying patterns. The validation set accounted for 20% of the data, with around 138,000 entries or 480 days. This set played a critical role in validating the model’s predictions, assessing its generalization capabilities, and fine-tuning parameters if necessary. The remaining 10% of the data, comprising approximately 69,000 entries or 240 days, formed the testing set. Its purpose was to thoroughly evaluate the model’s performance and accuracy in real-world scenarios using previously unseen data.

3.3. Model Training and Calibration

The architecture of BALSSA facilitates the capture of temporal patterns and spatial dependencies within the collected data. The bidirectional LSTM component enables the model to consider both past and future information, while the attention mechanisms prioritize relevant features and enhance prediction accuracy. The training process involves using a labeled dataset comprising historical meteorological, tide, and corresponding typhoon data in Macao. To evaluate the model’s performance, we employ K-Fold cross-validation, which partitions the dataset into K subsets and performs training and validation K times, ensuring robustness in accuracy assessment. During the training phase, the BALSSA model leverages the Adam optimization algorithm, which dynamically adjusts the learning rate to enhance convergence. To quantify the discrepancy between predicted and actual impact values, we adopt the mean squared error (MSE) as the chosen loss function. To mitigate overfitting, regularization techniques like dropout and L2 regularization are implemented. Additionally, hyperparameter tuning is performed using grid search to identify the optimal values for crucial parameters, including the number of hidden layers, hidden units, and the learning rate.
To mitigate concerns pertaining to model bias, we adopt a Bayesian model calibration approach. This methodology encompasses the estimation of the model’s parameters by leveraging prior knowledge and the integration of observed data to refine the parameter estimates. By accounting for uncertainties associated with the input data and model parameters, we generate probabilistic forecasts that offer a more comprehensive depiction of the predicted impacts. Through this calibration process, the reliability and interpretability of BALSSA’s results are assured.

3.4. Evaluation Metrics for Model Assessment

In the evaluation of model performance, several metrics are employed to assess the accuracy and reliability of the predictions. Three commonly used metrics in this study, including Mean Absolute Error (MAE, Equation (3)), Mean Squared Error (MSE, Equation (4)), and Root Mean Squared Error (RMSE, Equation (5)), are utilized to quantify the performance of the models in estimating storm surge magnitudes.
MAE = 1 N i = 1 N | a i a ^ i |
MSE = 1 N i = 1 N ( a i a ^ i ) 2
RMSE = 1 N i = 1 N ( a i a ^ i ) 2
where N represents the total number of samples, a i represents the observed values, and a ^ i represents the predicted values. These metrics collectively offer comprehensive insights into the model’s ability to accurately estimate storm surge magnitudes and provide quantitative measures for evaluating the performance of the models. By calculating and comparing these metrics, we can assess the accuracy and reliability of the storm surge predictions generated by the models under consideration.

4. Comparative Analysis Results

In this section, we provide an in-depth analysis of the comparative results obtained from storm surge prediction using the BALSSA model. Our evaluation focuses on assessing the accuracy and performance metrics of BALSSA in predicting the storm surge events induced by super typhoon Saola (Figure 8). By conducting a comprehensive comparison with the JMA numerical storm surge model, we gain valuable insights into the prediction accuracy and performance of BALSSA. The subsequent subsections delve into the detailed findings, presenting compelling evidence to underscore the robustness and reliability of BALSSA in storm surge prediction in this case.
We present a comprehensive analysis of the BALSSA model’s efficacy by evaluating its performance during the occurrence of thee super typhoon Saola in Macao, which took place from 30 August to 3 September 2023. Our analysis includes a detailed comparison of BALSSA with regular LSTM and the JMA storm surge model, providing insights into their respective performance for time series prediction. To evaluate performance, we conducted an analysis of surge anomalies and compared the results obtained from BALSSA. The average MAE and RMSE for BALSSA are impressively low, measuring 0.015 and 0.026, respectively, as shown in Figure 9. In contrast, the regular LSTM model exhibits higher values with an MAE of 0.04839 and RMSE of 0.05597. Additionally, the JMA storm surge model yields even higher values, with an MAE of 0.71 and RMSE of 0.81. These findings unequivocally demonstrate the superior performance of BALSSA in storm surge prediction in the Saola case. This advantage can be attributed to the inherent capabilities of LSTM-based models, which adeptly capture the intricate non-linear interactions and enduring dependencies present in time series data.
Our proposed BALSSA model exhibits enhanced performance compared to the regular LSTM model, as depicted in Figure 10. The BALSSA models are named using the convention of BALSSA + suffix to indicate different hyperparameter configurations. The suffixes (−128, −256, −128–256, etc.) represent variations in the number of LSTM units, layers, and other relevant factors. This naming convention promotes transparency and distinguishes between different models, highlighting the diverse hyperparameter combinations employed in the BALSSA architecture. To assess their predictive abilities across various lead times, we evaluated the testing set using MAE and RMSE, with prediction times ranging from 1 h to 72 h, as presented in Figure 10a,b, respectively. Analyzing the trends, we observe a slight increase in the evaluation metrics of MAE and RMSE for different variations of BALSSA from 1 h to 24 h, followed by a moderate increase from 24 h to 48 h. Subsequently, the values stabilize or exhibit slight improvements towards the 72 h forecast lead time [58]. Of particular significance, the dotted purple line representing the regular LSTM model stands apart from the other models in Figure 10, indicating its inferior predictive performance. The regular LSTM model exhibits a decline in performance as the forecast horizon extends. However, this drawback is entirely addressed in our BALSSA architectures, rendering them immune to this issue. It is important to note that our models maintain high accuracy up to 24 h ahead, which is crucial for disaster risk preparation and timely evacuation, if necessary.
Across the seven prediction leading times, BALSSA demonstrates impressive performance, with average MAE and RMSE values of 0.019 and 0.024, respectively. These results highlight the robustness and accuracy of BALSSA in this specific storm surge prediction scenario, reinforcing its reliability as a predictive model.

4.1. Enhancing Storm Surge Prediction Accuracy through Improved Wind Velocity Forecasting

Storm surge, the abnormal rise of seawater along coastal areas during a severe weather event, poses a significant threat to coastal communities. While various factors contribute to storm surge, wind velocity plays a vital role in its formation and intensity [59]. Erroneous wind velocity forecasts can lead to overestimation or underestimation of surge anomalies, impacting the reliability of surge predictions. To address this challenge, we propose utilizing BALSSA to predict wind velocity and subsequently improve storm surge predictions. By assimilating real-time observational data, historical records, and atmospheric conditions, BALSSA generates forecasts for wind velocity with improved accuracy. By incorporating more precise wind velocity predictions into storm surge modeling, we can enhance the accuracy of surge predictions and reduce the potential for overestimation or underestimation [27,60,61]. When the predicted wind velocity aligns closely with the actual conditions, the storm surge forecasts become more reliable, enabling authorities and communities to make informed decisions regarding evacuation, infrastructure protection, and emergency response [62].
BALSSA utilizes several key parameters to predict wind speed accurately, as shown in Table 2. These parameters include temperature, wind speed, air pressure, humidity, time of day/seasonal factors, and tendency changes in wind velocity and atmospheric pressure. Each of these factors plays a crucial role in influencing wind patterns and their subsequent impact on wind speed. Temperature affects air density, which in turn affects wind circulation. Wind speed, both historical and current, provides valuable information about wind behavior and trends. Air pressure influences atmospheric stability and the movement of air masses. Humidity affects the moisture content in the air, which can impact wind speed. The time of day and seasonal changes introduce temporal dependencies and are significant as they contribute to variations in solar radiation and temperature gradients, leading to changes in wind patterns. These factors capture the influence of diurnal and seasonal patterns on wind behavior. Lastly, monitoring tendency changes in wind velocity and atmospheric pressure helps detect shifts in weather systems that can influence wind speed. By considering and analyzing these key parameters, BALSSA can effectively predict wind speed with improved accuracy and reliability.
The analysis presented in Figure 11 demonstrates consistent prediction patterns for wind velocity across the seven leading time predictions. Notably, we observe a slight increase in the performance of MAE (Figure 11a) and RMSE (Figure 11b) for different variations of BALSSA from 1 h to 24 h. This is followed by a moderate increase in these metrics from 24 h to 48 h. However, beyond the 48 h mark, the performance stabilizes and exhibits further improvements towards the 72 h forecast lead time.
The comparison between the predicted wind velocity from BALSSA, the actual observations, and the forecasted wind speed from the numerical model, as shown in Figure 12, provides valuable insights into BALSSA’s performance and ability to accurately capture wind intensity, highlighting its effectiveness in closely aligning with the observed wind data. The figure clearly illustrates BALSSA’s precision by demonstrating its proximity to the actual observations, emphasizing its notable accuracy in capturing wind intensity. Accurate wind prediction is crucial for estimating storm surges induced by weather events. Overestimation of the wind velocity in predictions can directly impact the accuracy of storm surge forecasts, leading to deviations and lower overall forecast accuracy. Therefore, the successful modeling of the wind velocity by BALSSA plays a critical role in estimating storm surge with enhanced precision. By closely aligning with actual wind observations, BALSSA provides a reliable foundation for generating more accurate storm surge predictions, facilitating better preparedness and response to coastal hazards [17].

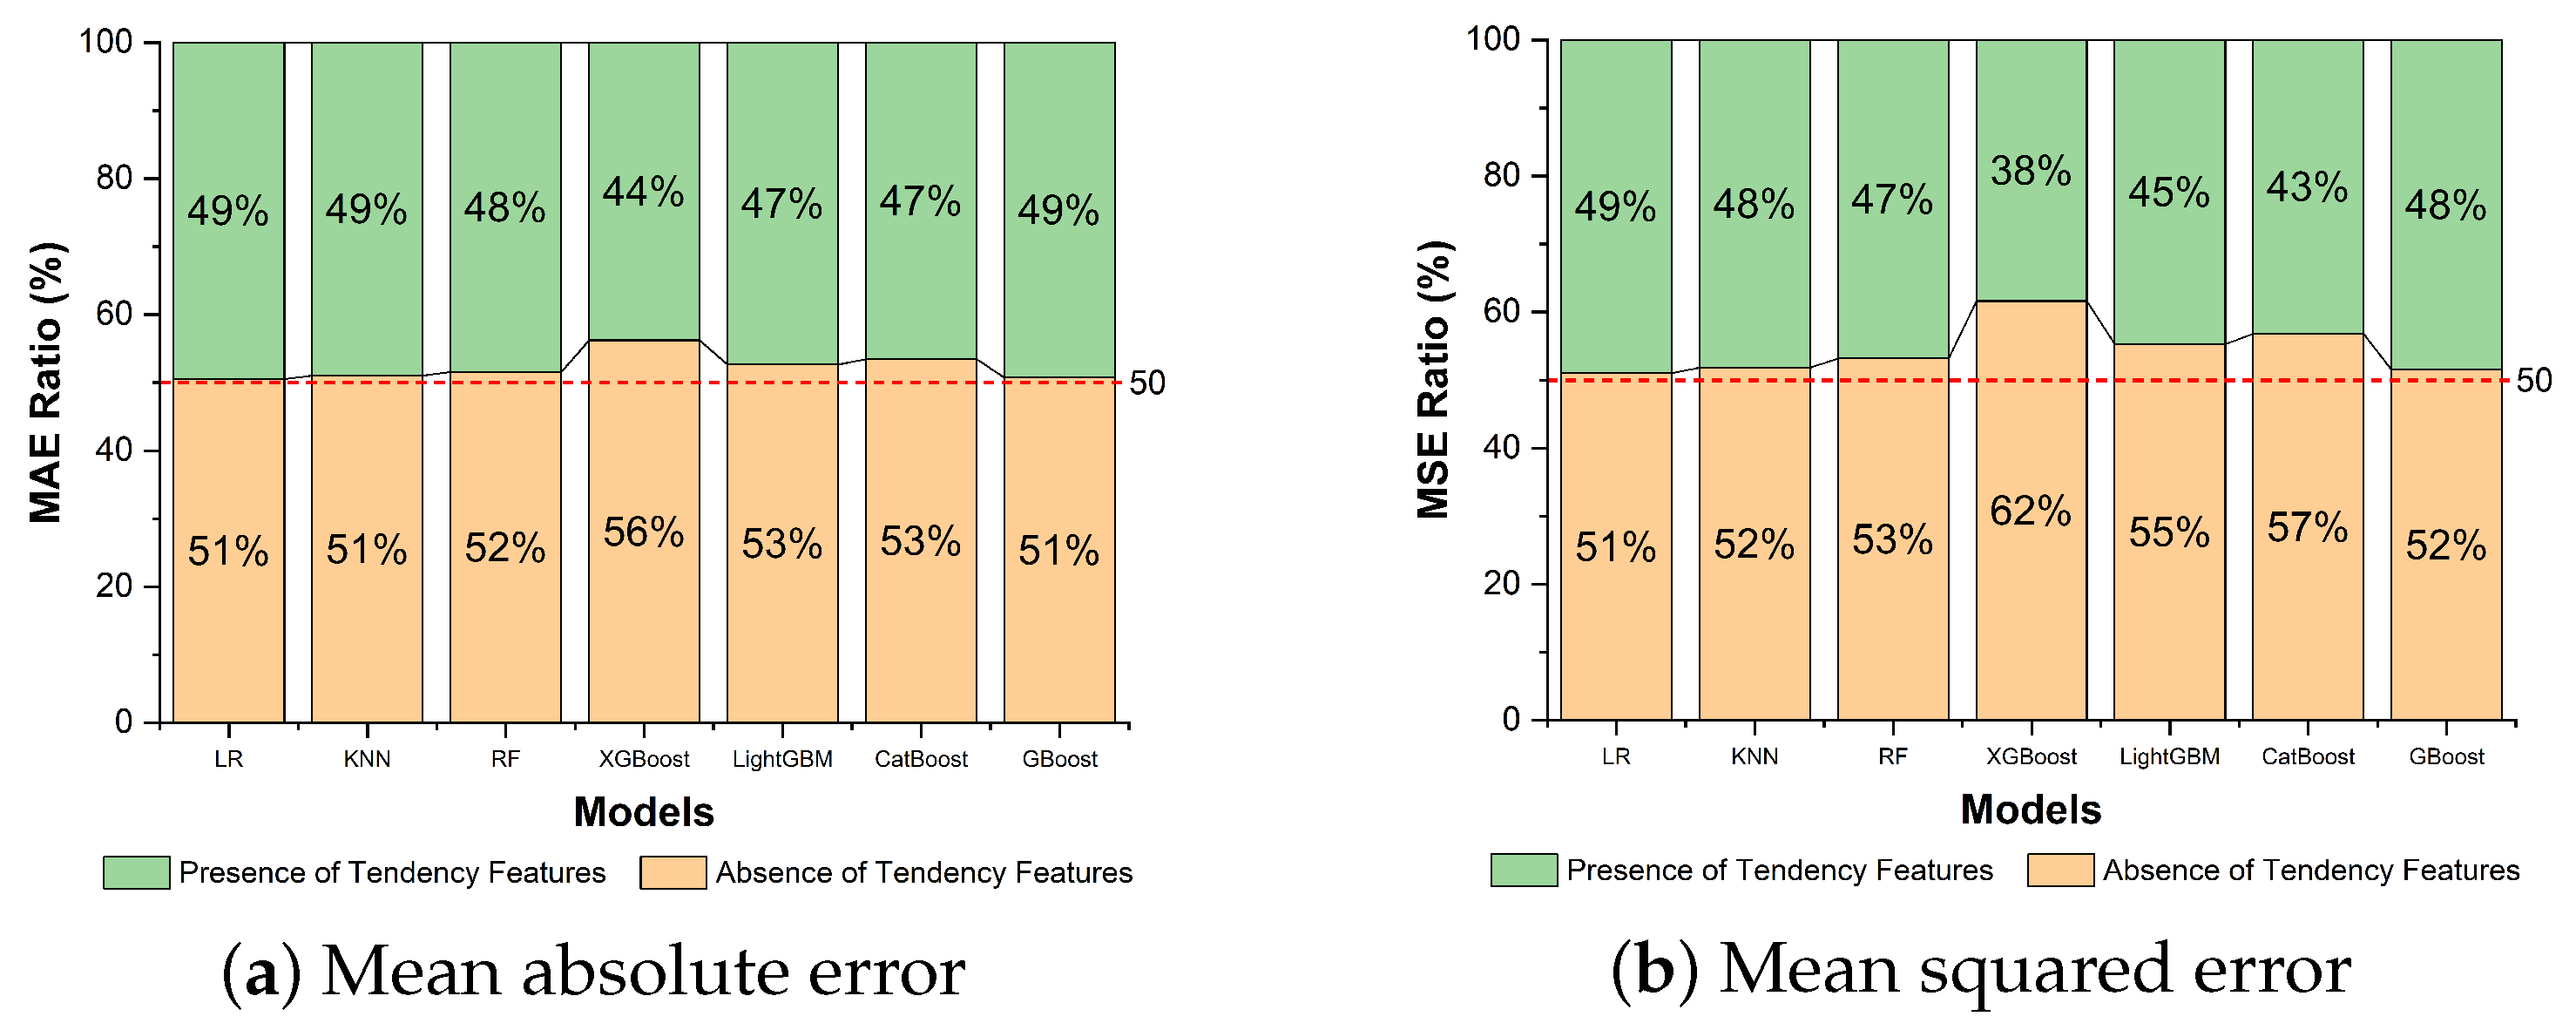
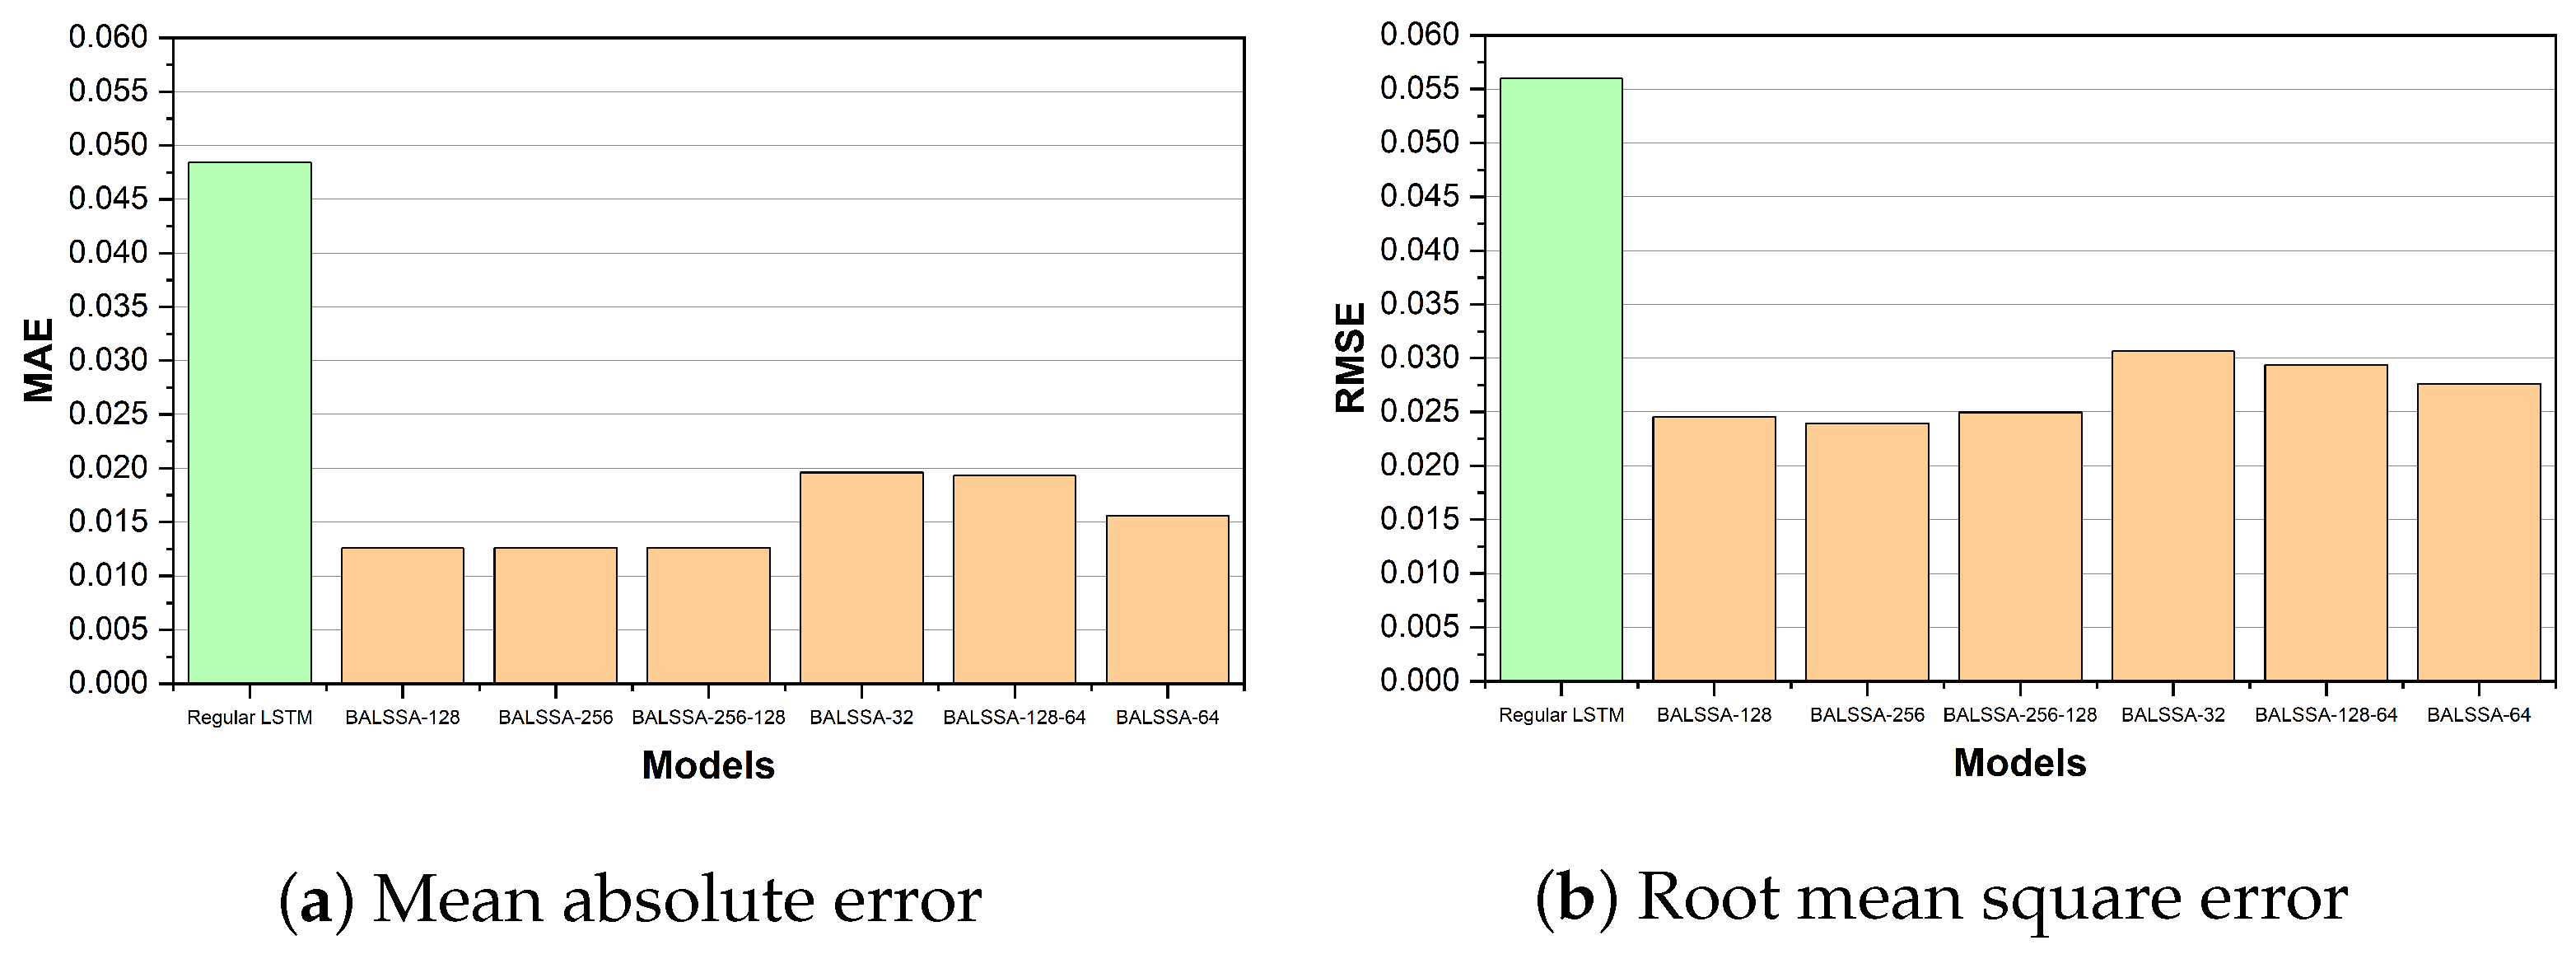
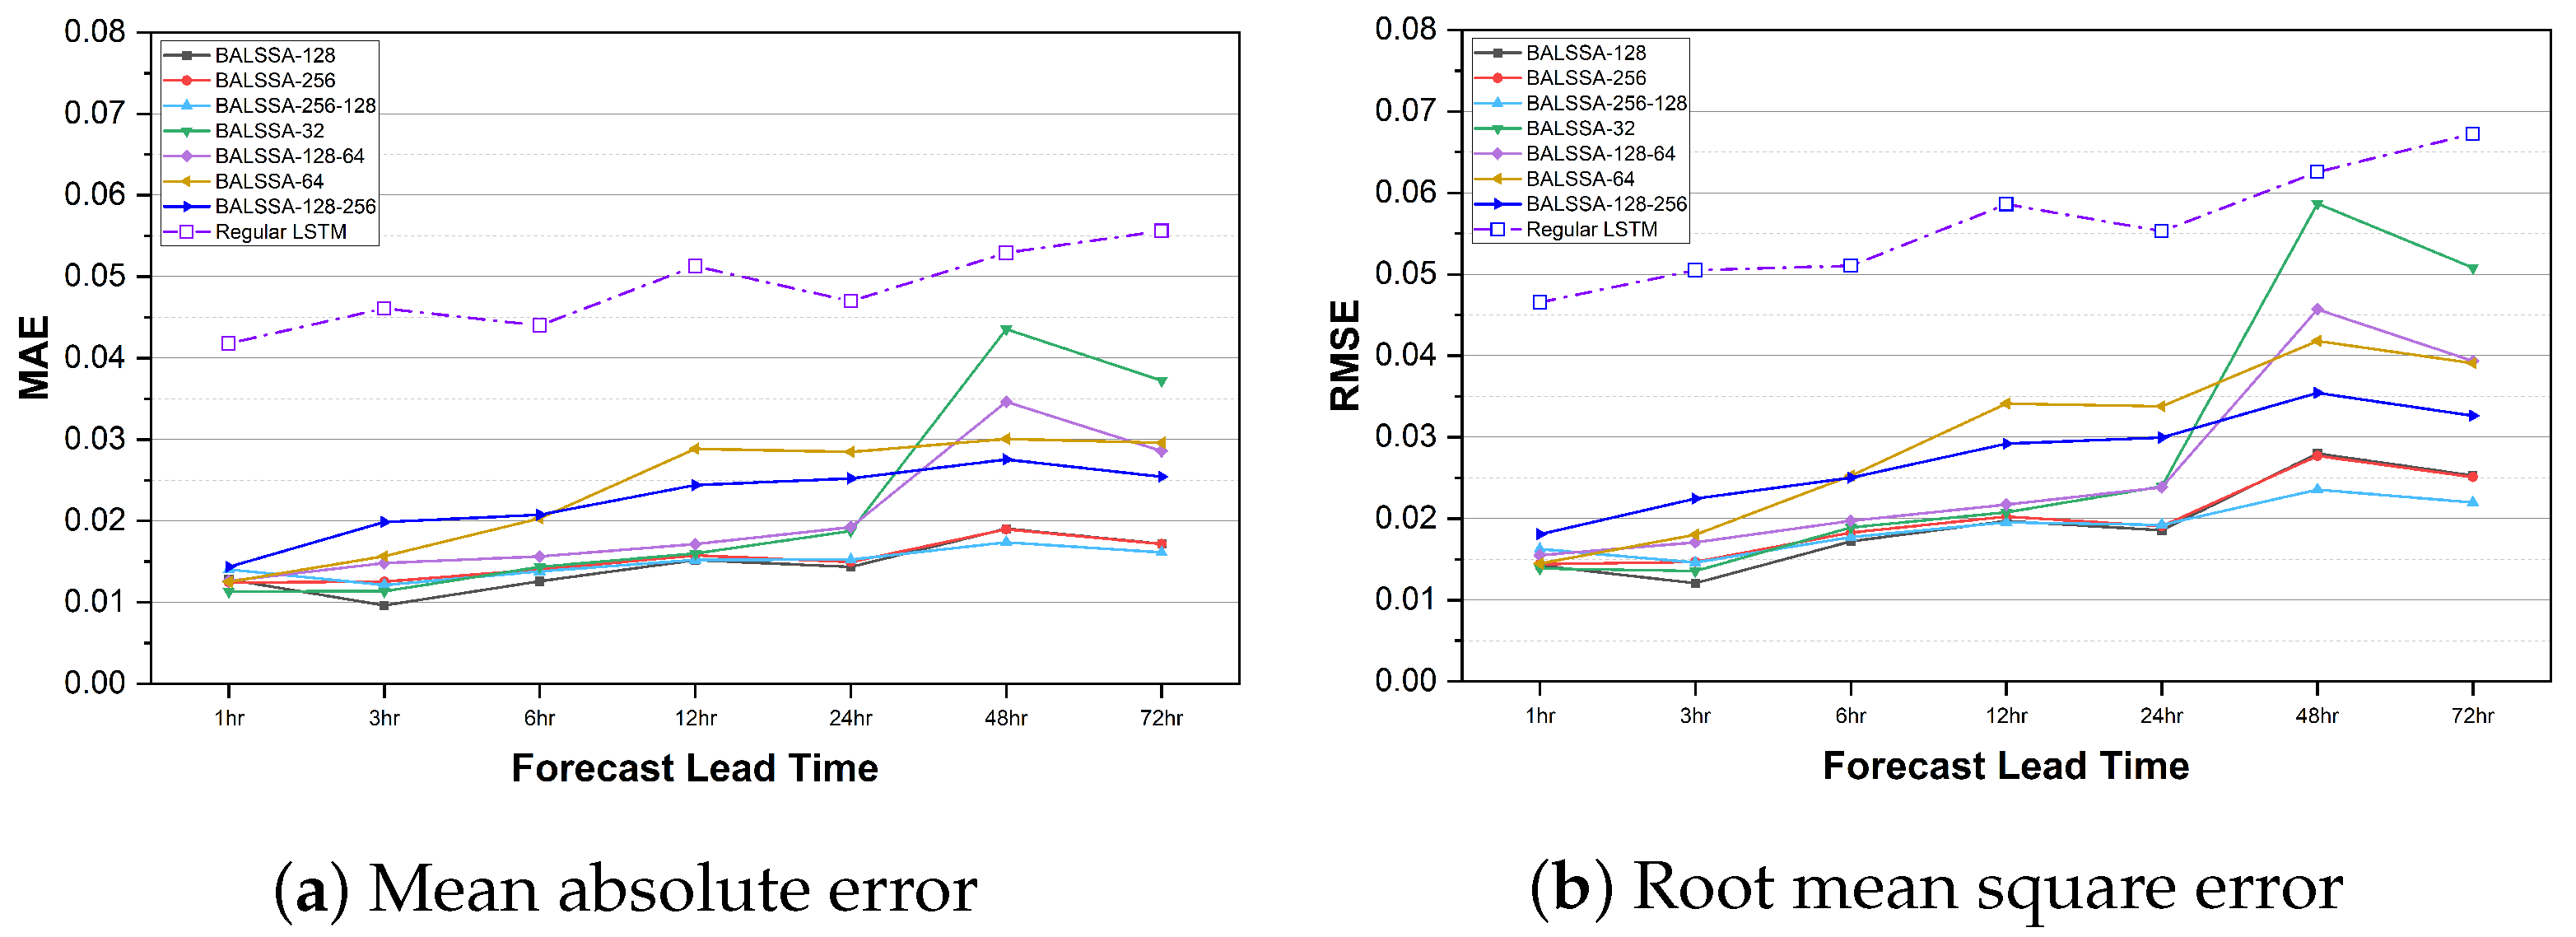
4.2. Results Analysis

To assess the effectiveness and accuracy of BALSSA in tide level prediction, a comprehensive comparison was conducted using the case of super typhoon Saola. Multiple implementations, including different variations of BALSSA and the compared numerical storm surge model, were examined, and the results are presented in Figure 13. The comparison highlights the differences between the actual tide level measurements and the predicted values obtained from these models.
The results obtained from BALSSA demonstrate a promising and satisfactory performance. The surge patterns, including the rising and falling phases, exhibit similarities in both BALSSA and the numerical storm surge model. However, the predictions from the numerical model show significant overestimation of surge anomalies, which can be attributed to exaggerated wind velocity forecasts. When combined with the normal astronomical tide, these surge anomalies contribute to the formation of tide levels. Figure 14 specifically illustrates this phenomenon in the case of Saola. The analysis reveals deviations in the peak tidal levels ranging from 0.015 m to 0.03 m. Importantly, the predictions generated by BALSSA closely align with the curve of the observed data, indicating a strong agreement between predicted and observed tide levels. It is worth noting that there is a minor time lag in the predictions and inherent limitations in consistently capturing extreme weather conditions and sudden changes in wind velocity.
In summary, the comprehensive comparison of different implementations of BALSSA, specifically in the Saola case study, confirms its high prediction accuracy and effectiveness. The results are promising, showing minimal deviations between the predictions and actual tide level measurements. However, it is important to acknowledge the minor time lag in the predictions and the potential for improved sensitivity to extreme weather conditions, which could be areas for future research exploration.

4.3. Success and Contribution of BALSSA

The incorporation of the attention mechanism in BALSSA can result in improvements in storm surge forecast accuracy. By selectively attending to and weighting relevant input features, this approach captures dependencies and temporal patterns in meteorological factors such as wind velocity, atmospheric pressure, tidal level, and changes in meteorological features. This refined modeling allows BALSSA to closely align with atmospheric dynamics, resulting in effective performance in time series forecasting tasks. In contrast, conventional LSTM models show diminishing forecasting performance with longer prediction horizons [11]. BALSSA overcomes this limitation by effectively mitigating performance degradation. By attending to relevant spatiotemporal features, BALSSA maintains high forecasting accuracy even for extended prediction horizons, providing reliable predictions up to 24 h ahead in this case. This extended forecasting capability is crucial for critical applications such as disaster risk preparation and timely evacuation [58].
BALSSA’s potential advancements in accuracy and long-term forecasting make it an invaluable tool for weather prediction and decision-making. Its integration of the attention mechanism captures relevant input features and overcomes the performance decline in regular LSTM models [18]. This can contribute significantly to proactive measures for risk mitigation, disaster management, and ensuring population safety.

5. Discussion

This section presents a comprehensive analysis assessing the storm surge prediction capabilities of BALSSA with the selected storm surge model for comparison. It also explores the factors that contribute to the performance of BALSSA and highlights its strengths and limitations as an alternative approach for storm surge prediction in this case, specifically focusing on the studied storm. The objective is to provide a thorough understanding of the significance and effectiveness of BALSSA in storm surge prediction. This analysis offers valuable insights into the advantages of BALSSA and identifies potential areas for further improvement and refinement.

5.1. Interpretation and Analysis of the Comparative Analysis Results

The comparative analysis of the results reveals several key findings that highlight the potential of BALSSA as an effective alternative for storm surge prediction, demonstrating favorable performance in comparison to the selected NWP storm surge model.
  • The comparison between BALSSA and the JMA numerical storm surge model reveals a notable overestimation of wind velocity by the latter. In contrast, BALSSA exhibits precise wind velocity predictions, capturing the intricate dynamics of local wind patterns, which are crucial for accurately forecasting storm surge behavior. This accurate prediction of wind velocity plays a pivotal role in achieving more precise estimates of surge anomalies and the resultant tide levels. Comparing the predicted surge anomalies from BALSSA with the JMA storm surge model, it becomes evident that the JMA model tends to overestimate surge anomalies due to exaggerated wind velocity forecasts. In contrast, BALSSA effectively captures wind velocity dynamics, resulting in surge predictions that closely align with actual measurements and observations.
  • BALSSA demonstrates the potential to contribute to storm surge forecasting by providing reasonably accurate predictions that align closely with real-world data. Addressing challenges related to wind velocity estimation, BALSSA emerges as a tool with reliability for forecasting storm surge anomalies and subsequent tide levels. The pursuit of improved accuracy within the context of storm surge prediction for this case contributes to the overall objective of facilitating more precise risk assessment, bolstering disaster preparedness efforts, and aiding informed decision-making in coastal areas susceptible to storm surge events.
The results of the comparative analysis highlight BALSSA’s effectiveness in predicting storm surges, particularly in this case, and emphasize its performance relative to the numerical storm surge model considered in the study. BALSSA’s accurate forecasting of wind velocity and surge anomalies enables it to provide more reliable and precise predictions of resulting tide levels. These advancements establish BALSSA as an effective alternative for storm surge prediction, offering improved capabilities for risk mitigation in coastal flooding and facilitating the development of proactive measures to ensure the safety and resilience of coastal communities.

5.2. Factors Contributing to the Performance of BALSSA

The effectiveness of BALSSA in storm surge prediction can be attributed to several key factors that contribute to its significant performance.
  • Bidirectional LSTM: BALSSA utilizes a bidirectional LSTM network that allows it to capture both past and future temporal dependencies in the input data. By considering the context from both directions, BALSSA can effectively model and predict the complex temporal dynamics of storm surge phenomena.
  • Attention-Based Mechanism: BALSSA incorporates an attention mechanism, which enables the model to focus on the most relevant information within the input sequences. This mechanism allows BALSSA to assign different weights to different parts of the input data, emphasizing the most important features for accurate prediction. By attending to critical temporal and spatial patterns, BALSSA can capture the key factors influencing storm surge behavior and improve the precision of its forecasts.
  • Feature Representation: BALSSA employs a comprehensive set of input features that describe the atmospheric and oceanic conditions relevant to storm surge prediction. These features include wind velocity, atmospheric pressure, water levels, and storm characteristics. By incorporating these diverse features into its model, BALSSA can capture the complex interactions and dependencies between various factors, leading to more accurate predictions.
  • Training and Optimization: BALSSA undergoes rigorous training and optimization processes using historical storm surge data. This allows the model to learn from past storm events and fine-tune its parameters to better align with actual observations. By leveraging historical data, BALSSA can improve its predictive capabilities and adapt to different coastal regions and storm characteristics.
  • Accurate Wind Velocity Prediction: A crucial strength lies in BALSSA’s ability to predict wind velocity with precision. In contrast to the JMA numerical storm surge model, which may at times face difficulties leading to occasional overestimation, BALSSA excels in capturing the subtleties of wind velocity dynamics. This proficiency enhances the model’s capacity for providing nuanced and accurate forecasts of surge anomalies and subsequent tide levels.
  • Improved Modeling Techniques: BALSSA utilizes advanced modeling techniques that take into account a wide range of atmospheric and oceanic variables. By incorporating a more comprehensive set of parameters, including pressure gradients, water levels, and storm characteristics, BALSSA enhances the accuracy of storm surge predictions. This comprehensive approach provides a more realistic representation of the complex interactions between the atmosphere and the ocean.
  • Data Assimilation and Calibration: BALSSA integrates data assimilation techniques, refining initial conditions and enhancing prediction accuracy by assimilating real-time observations. Calibration with historical storm surge data further improves its performance by incorporating past storm events and their impacts.
  • High-Resolution Spatial and Temporal Grids: BALSSA employs high-resolution spatial and temporal grids, enabling finer-scale modeling of storm surge dynamics. This granularity allows for a more detailed representation of localized features, resulting in more accurate predictions of surge behavior in specific coastal regions.
The architectural features and design choices of BALSSA contribute to its effective performance in storm surge prediction. By using bidirectional LSTM and attention mechanisms, BALSSA effectively captures temporal dynamics and focuses on relevant information, modeling complex interactions in storm surge phenomena. It incorporates a comprehensive set of features to represent atmospheric and oceanic conditions, enhancing its holistic understanding of factors influencing storm surge behavior. Through data-driven training, BALSSA fine-tunes its parameters based on historical storm surge data, further improving its predictive capabilities. As a result, BALSSA can be a valuable and accurate tool for storm surge prediction, benefiting coastal risk management and decision-making processes. It predicts wind velocity accurately, employs advanced modeling techniques, assimilates real-time data, and uses high-resolution grids to provide reliable and precise forecasts of storm surge behavior. These advancements enable BALSSA to support coastal risk management by facilitating preparedness, mitigation strategies, and informed decision-making for impending storm surge events.

5.3. Strengths and Limitations of BALSSA

The comprehensive analysis of the strengths and limitations of BALSSA serves to illuminate its capabilities as a robust and innovative approach in the realm of storm surge prediction. By delving into the various factors that contribute to its effectiveness, we gain valuable insights into the unique advantages that BALSSA offers as an alternative method. Additionally, by exploring the potential challenges and limitations it faces, we gain a deeper understanding of the considerations and constraints that need to be taken into account when utilizing BALSSA for storm surge prediction. This in-depth examination enables us to appreciate the broader implications and significance of BALSSA in the context of storm surge forecasting and its potential for advancing coastal risk management practices.
Strengths of BALSSA in storm surge prediction:
  • Improved Accuracy: In this case of storm surge prediction, BALSSA exhibits enhanced accuracy compared to a traditional NWP model. By leveraging advanced modeling techniques, incorporating comprehensive features, and employing sophisticated neural network architectures such as bidirectional LSTM and attention mechanisms, BALSSA effectively captures the complex dynamics and interactions involved in storm surge phenomena. This can enhance the reliability of storm surge forecasts, enabling better preparedness and decision-making.
  • Real-time Data Assimilation: BALSSA incorporates real-time observations through data assimilation, allowing it to continuously update and refine its predictions based on the latest information. This capability improves the model’s adaptability to changing conditions and enhances the timeliness and accuracy of storm surge forecasts.
  • Potential for Scalability and Efficiency: The architecture of our model holds the potential for scalability and computational efficiency. This scalability allows for the incorporation of larger datasets and the handling of more complex models, while computational efficiency enables faster processing times, making BALSSA a viable tool for real-time storm surge prediction applications.
Limitations of BALSSA in storm surge prediction:
  • Data Requirements and Availability: BALSSA relies heavily on data inputs, including historical storm surge data, atmospheric and oceanic observations, and real-time measurements. The availability and accessibility of such data can pose challenges, particularly in regions with limited data coverage or gaps in historical records. Insufficient or inaccurate data can impact the model’s performance and introduce uncertainties into the predictions.
  • Sensitivity to Input Quality: BALSSA’s predictive precision is intricately tied to the quality and accuracy of its input data. It is essential to note that forecasted parameters, if incorporated as inputs, can introduce uncertainties and potentially impact the accuracy of storm surge predictions. Errors or biases within the input data, including inaccuracies in observational measurements or uncertainties in key parameters, may propagate through the model, underscoring the importance of utilizing reliable and validated data for optimal prediction accuracy.
  • Generalization to Diverse Coastal Environments: While BALSSA demonstrates notable performance in certain coastal regions in this case, its generalization to diverse coastal environments with unique characteristics and dynamics may be challenging. Variations in coastal topography and other localized factors can introduce uncertainties and limitations in the model’s predictions, requiring careful evaluation and adaptation when applying BALSSA to different coastal settings.

6. Implications and Conclusions

This section delves into the practical implications and potential impact of the findings on storm surge prediction, specifically emphasizing the context of Macao. By exploring how the advanced capabilities of BALSSA can be applied in real-world scenarios, we can uncover valuable insights into its practical applications for coastal risk management. Furthermore, this section summarizes the key findings and contributions of the study, highlighting the advancements offered by BALSSA and its potential to significantly enhance the accuracy of storm surge predictions. Through a thorough examination of the implications, this section aims to provide actionable insights and a comprehensive understanding of the practical significance of the research findings.

6.1. Implications of the Findings for Storm Surge Prediction in Macao

The study findings have these implications for storm surge prediction in Macao:
  • Enhanced Accuracy: The advanced modeling techniques and neural network architectures employed by BALSSA have the potential to improve the accuracy of storm surge predictions in Macao. This can enable more precise and reliable forecasts, allowing authorities and stakeholders to make better-informed decisions regarding coastal risk management and emergency preparedness.
  • Timely and Real-time Updates: BALSSA’s ability to assimilate real-time data enables continuous updates to the storm surge predictions. This ensures that the latest observations and measurements are considered, leading to more up-to-date and potentially more accurate forecasts. Such timely updates can support efficient evacuation planning, early warning systems, and response strategies.
  • Tailored Predictions: With the use of high-resolution spatial and temporal grids, BALSSA can provide tailored storm surge predictions for specific areas within the region. This enables a more localized understanding of potential flood risks, allowing for targeted mitigation measures and resource allocation in vulnerable regions.
  • Improved Risk Assessment: The potentially more accurate storm surge predictions facilitated by BALSSA could contribute to improved risk assessment in Macao. Understanding storm surge magnitudes and extents enables decision-makers to prioritize flood-prone areas and vulnerable infrastructure, aiding the development of effective coastal protection and resilience strategies.
  • Long-term Planning: By analyzing historical storm surge data and utilizing BALSSA’s predictive capabilities, stakeholders can gain insights into long-term trends and patterns, aiding in the development of sustainable coastal development plans and infrastructure design that account for future storm surge risks.

6.2. Practical Applications and Potential Impact of BALSSA

BALSSA holds practical applications and possesses the potential to make a substantial impact in the field of storm surge prediction. These impacts extend beyond the realm of storm surge prediction, influencing various areas including emergency management practices, coastal infrastructure development, climate change adaptation strategies, urban planning, and further scientific advancements in the field, such as:
  • Improved Emergency Preparedness: More accurate and timely storm surge predictions can enhance emergency preparedness efforts. Authorities can use these predictions to issue timely warnings, activate evacuation plans, allocate resources effectively, and ensure the safety of residents.
  • Coastal Risk Management: Our proposed model’s advanced modeling techniques and high-resolution spatial and temporal grids enable better understanding and assessment of coastal risks. This information can guide the development of robust coastal risk management strategies, such as the design and placement of coastal infrastructure, land-use planning, and flood control measures.
  • Infrastructure Planning and Design: The predictions offered can inform the planning and design of critical coastal infrastructure, such as ports, seawalls, and flood protection systems. By incorporating the predicted storm surge magnitudes and extents, engineers and designers can develop infrastructure that is better equipped to withstand and mitigate the impacts of storm surges.
  • Climate Change Adaptation: As climate change continues to influence sea levels and intensify storm events, our model could play a role in climate change adaptation efforts. It provides valuable insights into the changing coastal dynamics, enabling policymakers and stakeholders to develop adaptive strategies and policies to mitigate the risks posed by climate change.
  • Resilient Urban Planning: The predictions identify storm-surge-prone areas, guiding decision-makers in implementing zoning regulations, designing resilient neighborhoods, and incorporating nature-based solutions for enhanced urban resilience and reduced vulnerability to storm surges.
  • Research and Development: Our innovative approach to storm surge prediction serves as a foundation for further research and development in the field. The insights gained from utilizing our model could inspire the development of novel modeling techniques, data assimilation methods, and predictive analytics, fostering advancements in storm surge prediction capabilities.

6.3. Conclusions

This study underscores the significant advancements brought forth by BALSSA in the realm of storm surge prediction. Employing advanced modeling techniques and neural network architectures, BALSSA has shown potential for heightened prediction accuracy, adeptly capturing intricate dynamics and interactions for precise forecasts. The real-time data assimilation feature ensures the incorporation of up-to-date information aligned with the latest observations, proving invaluable for emergency preparedness and response initiatives. Furthermore, the application of BALSSA in the case of Typhoon Saola stands out, showcasing its superior performance when compared to a traditional method. By accurately forecasting Saola’s storm surge characteristics, including magnitude, timing, and spatial extent, BALSSA affirms its advanced capabilities in capturing the complex dynamics of tropical cyclones and their associated storm surges. This compelling demonstration positions BALSSA as a reliable tool for early warning systems, emergency response planning, and coastal risk management.
In summary, BALSSA emerges as a valuable asset for improving storm surge prediction accuracy and strengthening coastal resilience. Its applications extend beyond prediction, encompassing emergency preparedness, coastal risk management, infrastructure planning, and climate change adaptation. The findings of this study contribute to the broader field of storm surge prediction, guiding decision-making processes and supporting the development of effective strategies. While BALSSA’s commendable performance in the context of Typhoon Saola underscores its effectiveness, further research and development are imperative to fully unlock its potential and address any prevailing challenges and limitations.

Author Contributions

Conceptualization, V.-K.I., S.-K.T. and G.P.; Data curation, V.-K.I.; Formal analysis, V.-K.I.; Investigation, V.-K.I., S.-K.T. and G.P.; Methodology, V.-K.I., S.-K.T. and G.P.; Project administration, S.-K.T. and G.P.; Resources, V.-K.I.; Software, V.-K.I.; Supervision, S.-K.T. and G.P.; Validation, V.-K.I., S.-K.T. and G.P.; Visualization, V.-K.I.; Writing—original draft, V.-K.I.; Writing—review & editing, V.-K.I., S.-K.T. and G.P. All authors have read and agreed to the published version of the manuscript.

Funding

This research received no external funding.

Institutional Review Board Statement

Not applicable.

Informed Consent Statement

Not applicable.

Data Availability Statement

Not applicable.

Conflicts of Interest

The authors declare no conflict of interest.

References

  1. Emanuel, K. Increasing destructiveness of tropical cyclones over the past 30 years. Nature 2005, 436, 686–688. [Google Scholar] [CrossRef] [PubMed]
  2. Marsooli, R.; Lin, N. Numerical modeling of historical storm tides and waves and their interactions along the US East and Gulf Coasts. J. Geophys. Res. Ocean. 2018, 123, 3844–3874. [Google Scholar] [CrossRef]
  3. Jin, X.; Shi, X.; Gao, J.; Xu, T.; Yin, K. Evaluation of loss due to storm surge disasters in China based on econometric model groups. Int. J. Environ. Res. Public Health 2018, 15, 604. [Google Scholar] [CrossRef] [PubMed]
  4. Andrée, E.; Su, J.; Larsen, M.A.D.; Madsen, K.S.; Drews, M. Simulating major storm surge events in a complex coastal region. Ocean Model. 2021, 162, 101802. [Google Scholar] [CrossRef]
  5. Camelo, J.; Mayo, T.L.; Gutmann, E.D. Projected climate change impacts on hurricane storm surge inundation in the coastal United States. Front. Built Environ. 2020, 6, 588049. [Google Scholar] [CrossRef]
  6. Li, M.; Zhang, F.; Barnes, S.; Wang, X. Assessing storm surge impacts on coastal inundation due to climate change: Case studies of Baltimore and Dorchester County in Maryland. Nat. Hazards 2020, 103, 2561–2588. [Google Scholar] [CrossRef]
  7. Ruiz-Salcines, P.; Appendini, C.M.; Salles, P.; Rey, W.; Vigh, J.L. On the use of synthetic tropical cyclones and hypothetical events for storm surge assessment under climate change. Nat. Hazards 2021, 105, 431–459. [Google Scholar] [CrossRef]
  8. Conner, W.; Kraft, R.; Harris, D.L. Empirical methods for forecasting the maximum storm tide due to hurricanes and other tropical storms. Mon. Weather Rev. 1957, 85, 113–116. [Google Scholar] [CrossRef]
  9. Heaps, N. Storm surges, 1967–1982. Geophys. J. Int. 1983, 74, 331–376. [Google Scholar] [CrossRef]
  10. Nicholls, R.J.; Cazenave, A. Sea-level rise and its impact on coastal zones. Science 2010, 328, 1517–1520. [Google Scholar] [CrossRef]
  11. Ian, V.K.; Tse, R.; Tang, S.K.; Pau, G. Bridging the Gap: Enhancing Storm Surge Prediction and Decision Support with Bidirectional Attention-Based LSTM. Atmosphere 2023, 14, 1082. [Google Scholar] [CrossRef]
  12. Kohno, N.; Dube, S.K.; Entel, M.; Fakhruddin, S.; Greenslade, D.; Leroux, M.D.; Rhome, J.; Thuy, N.B. Recent progress in storm surge forecasting. Trop. Cyclone Res. Rev. 2018, 7, 128–139. [Google Scholar]
  13. Lee, T.L. Neural network prediction of a storm surge. Ocean Eng. 2006, 33, 483–494. [Google Scholar] [CrossRef]
  14. Jan, C.D.; Tseng, C.M.; Wang, J.S.; Cheng, Y.H. Empirical relation between the typhoon surge deviation and the corresponding typhoon characteristics: A case study in Taiwan. J. Mar. Sci. Technol. 2006, 11, 193–200. [Google Scholar] [CrossRef]
  15. Li, Q.; Jia, H.; Zhang, J.; Mao, J.; Fan, W.; Huang, M.; Zheng, B. Typhoon loss assessment in rural housing in Ningbo based on township-level resolution. Appl. Sci. 2022, 12, 3463. [Google Scholar] [CrossRef]
  16. Li, Q.; Fan, W.; Huang, M.; Jin, H.; Zhang, J.; Ma, J. Machine Learning-Based Prediction of Dynamic Responses of a Tower Crane under Strong Coastal Winds. J. Mar. Sci. Eng. 2023, 11, 803. [Google Scholar] [CrossRef]
  17. Ian, V.K.; Tse, R.; Tang, S.K.; Pau, G. Transforming from Mathematical Model to ML Model for Meteorology in Macao’s Smart City Planning. In Proceedings of the 2023 7th International Conference on E-Commerce, E-Business and E-Government, Plymouth, UK, 27–29 April 2023; pp. 72–78. [Google Scholar]
  18. Ian, V.K.; Tse, R.; Tang, S.K.; Pau, G. Performance Analysis of Machine Learning Algorithms in Storm Surge Prediction. In Proceedings of the 7th International Conference on Internet of Things, Big Data and Security (IoTBDS 2022), Online, 22–24 April 2022; pp. 297–303. [Google Scholar]
  19. Ribeiro, R.B.; Sampaio, A.F.P.; Ruiz, M.S.; Leitão, J.C.; Leitão, P.C. First approach of a storm surge early warning system for Santos region. Clim. Change Santos Braz. Proj. Impacts Adapt. Options 2019, 135–157. [Google Scholar]
  20. Hoover, R.A. Empirical relationships of the central pressures in hurricanes to the maximum surge and storm tide. Mon. Weather Rev. 1957, 85, 167–174. [Google Scholar] [CrossRef]
  21. Welander, P. Numerical prediction of storm surges. Adv. Geophys. 1961, 8, 315–379. [Google Scholar]
  22. Wu, G.; Shi, F.; Kirby, J.T.; Liang, B.; Shi, J. Modeling wave effects on storm surge and coastal inundation. Coast. Eng. 2018, 140, 371–382. [Google Scholar] [CrossRef]
  23. Fisher, R.; Petit, F.; Porod, C. Early Warning Systems to Strengthen the Resilience of Communities to Extreme Events. In Handbook of Disaster Risk Reduction for Resilience: New Frameworks for Building Resilience to Disasters; Springer: Berlin/Heidelberg, Germany, 2021; pp. 239–259. [Google Scholar]
  24. Xie, K.; Ozbay, K.; Zhu, Y.; Yang, H. Evacuation zone modeling under climate change: A data-driven method. J. Infrastruct. Syst. 2017, 23, 04017013. [Google Scholar] [CrossRef]
  25. Suleman, M.A.R.; Shridevi, S. Short-Term Weather Forecasting Using Spatial Feature Attention Based LSTM Model. IEEE Access 2022, 10, 82456–82468. [Google Scholar] [CrossRef]
  26. Wang, Z.; Zhou, L.; Li, Q.; Sun, X. Storm surge along the Yellow River Delta under directional extreme wind conditions. J. Coast. Res. 2017, 9, 86–91. [Google Scholar] [CrossRef]
  27. Kim, S.; Matsumi, Y.; Pan, S.; Mase, H. A real-time forecast model using artificial neural network for after-runner storm surges on the Tottori coast, Japan. Ocean Eng. 2016, 122, 44–53. [Google Scholar] [CrossRef]
  28. Suh, S.W.; Lee, H.Y.; Kim, H.J.; Fleming, J.G. An efficient early warning system for typhoon storm surge based on time-varying advisories by coupled ADCIRC and SWAN. Ocean Dyn. 2015, 65, 617–646. [Google Scholar] [CrossRef]
  29. Lamsal, R.; Vijay Kumar, T. Artificial Intelligence Based Early Warning System for Coastal Disasters. Dev. Coast. Zones Disaster Manag. 2020, 305–320. [Google Scholar]
  30. Walsh, K.J.; Camargo, S.J.; Knutson, T.R.; Kossin, J.; Lee, T.C.; Murakami, H.; Patricola, C. Tropical cyclones and climate change. Trop. Cyclone Res. Rev. 2019, 8, 240–250. [Google Scholar] [CrossRef]
  31. Toyoda, M.; Fukui, N.; Miyashita, T.; Shimura, T.; Mori, N. Uncertainty of storm surge forecast using integrated atmospheric and storm surge model: A case study on Typhoon Haishen 2020. Coast. Eng. J. 2022, 64, 135–150. [Google Scholar] [CrossRef]
  32. De Oliveira, M.M.; Ebecken, N.F.F.; De Oliveira, J.L.F.; de Azevedo Santos, I. Neural network model to predict a storm surge. J. Appl. Meteorol. Climatol. 2009, 48, 143–155. [Google Scholar] [CrossRef]
  33. Lee, T.L. Back-propagation neural network for long-term tidal predictions. Ocean Eng. 2004, 31, 225–238. [Google Scholar] [CrossRef]
  34. Sztobryn, M. Forecast of storm surge by means of artificial neural network. J. Sea Res. 2003, 49, 317–322. [Google Scholar] [CrossRef]
  35. Ali, M.I.; Imran, A.; Syed, I.; Islam, M.J.; Mallik, M. A comparative study of storm surge phenomenon associated with the tropical cyclone Aila over the Bay Of Bengal using NWP models. J. Eng. 2018, 9, 33–40. [Google Scholar]
  36. Faisal, Q.A.; Rashid, T.; Hossain, M.A.; Hassan, S.; Meandad, J. Simulation of Storm Surges in Bangladesh Using NWP Models. Dhaka Univ. J. Earth Environ. Sci. 2021, 9, 31–38. [Google Scholar] [CrossRef]
  37. Chattopadhyay, A.; Subel, A.; Hassanzadeh, P. Data-driven super-parameterization using deep learning: Experimentation with multiscale Lorenz 96 systems and transfer learning. J. Adv. Model. Earth Syst. 2020, 12, e2020MS002084. [Google Scholar] [CrossRef]
  38. Brajard, J.; Carrassi, A.; Bocquet, M.; Bertino, L. Combining data assimilation and machine learning to infer unresolved scale parametrization. Philos. Trans. R. Soc. A 2021, 379, 20200086. [Google Scholar] [CrossRef]
  39. Zanna, L.; Bolton, T. Data-driven equation discovery of ocean mesoscale closures. Geophys. Res. Lett. 2020, 47, e2020GL088376. [Google Scholar] [CrossRef]
  40. Krassakis, P.; Karavias, A.; Nomikou, P.; Karantzalos, K.; Koukouzas, N.; Kazana, S.; Parcharidis, I. Geospatial Intelligence and Machine Learning Technique for Urban Mapping in Coastal Regions of South Aegean Volcanic Arc Islands. Geomatics 2022, 2, 297–322. [Google Scholar] [CrossRef]
  41. Dickens, K.; Armstrong, A. Application of machine learning in satellite derived bathymetry and coastline detection. SMU Data Sci. Rev. 2019, 2, 4. [Google Scholar]
  42. Ian, V.K.; Tse, R.; Tang, S.K.; Pau, G. Novel Prediction in Storm Surge Using Ensemble Machine Learning Algorithms. In Proceedings of the 2022 5th International Conference on Pattern Recognition and Artificial Intelligence (PRAI), Chengdu, China, 19–21 August 2022; pp. 1229–1234. [Google Scholar]
  43. Kim, S.; Pan, S.; Mase, H. Artificial neural network-based storm surge forecast model: Practical application to Sakai Minato, Japan. Appl. Ocean Res. 2019, 91, 101871. [Google Scholar] [CrossRef]
  44. Tseng, C.M.; Jan, C.D.; Wang, J.S.; Wang, C. Application of artificial neural networks in typhoon surge forecasting. Ocean Eng. 2007, 34, 1757–1768. [Google Scholar] [CrossRef]
  45. SMG. Macao Meteorological and Geophysical Bureau. Available online: https://www.smg.gov.mo/en (accessed on 15 September 2023).
  46. Huang, Y.H.; Wu, C.C.; Wang, Y. The influence of island topography on typhoon track deflection. Mon. Weather Rev. 2011, 139, 1708–1727. [Google Scholar] [CrossRef]
  47. Westerink, J.J.; Luettich, R.A.; Baptists, A.; Scheffner, N.W.; Farrar, P. Tide and storm surge predictions using finite element model. J. Hydraul. Eng. 1992, 118, 1373–1390. [Google Scholar] [CrossRef]
  48. Liu, W.C.; Huang, W.C.; Chen, W.B. Modeling the interaction between tides and storm surges for the Taiwan coast. Environ. Fluid Mech. 2016, 16, 721–745. [Google Scholar] [CrossRef]
  49. Lin, N.; Chavas, D. On hurricane parametric wind and applications in storm surge modeling. J. Geophys. Res. Atmos. 2012, 117. [Google Scholar] [CrossRef]
  50. Olfateh, M.; Callaghan, D.P.; Nielsen, P.; Baldock, T.E. Tropical cyclone wind field asymmetry—Development and evaluation of a new parametric model. J. Geophys. Res. Ocean. 2017, 122, 458–469. [Google Scholar] [CrossRef]
  51. Jones, J.E.; Davies, A.M. Influence of non-linear effects upon surge elevations along the west coast of Britain. Ocean Dyn. 2007, 57, 401–416. [Google Scholar] [CrossRef]
  52. Lee, T.L. Predictions of typhoon storm surge in Taiwan using artificial neural networks. Adv. Eng. Softw. 2009, 40, 1200–1206. [Google Scholar] [CrossRef]
  53. Bajo, M.; Umgiesser, G. Storm surge forecast through a combination of dynamic and neural network models. Ocean Model. 2010, 33, 1–9. [Google Scholar] [CrossRef]
  54. Erdil, A.; Arcaklioglu, E. The prediction of meteorological variables using artificial neural network. Neural Comput. Appl. 2013, 22, 1677–1683. [Google Scholar] [CrossRef]
  55. Chen, W.B.; Liu, W.C.; Hsu, M.H. Computational investigation of typhoon-induced storm surges along the coast of Taiwan. Nat. Hazards 2012, 64, 1161–1185. [Google Scholar] [CrossRef]
  56. Chen, W.B.; Lin, L.Y.; Jang, J.H.; Chang, C.H. Simulation of typhoon-induced storm tides and wind waves for the northeastern coast of Taiwan using a tide–surge–wave coupled model. Water 2017, 9, 549. [Google Scholar] [CrossRef]
  57. Dietrich, J.; Muhammad, A.; Curcic, M.; Fathi, A.; Dawson, C.; Chen, S.S.; Luettich Jr, R. Sensitivity of storm surge predictions to atmospheric forcing during Hurricane Isaac. J. Waterw. Port Coastal Ocean Eng. 2018, 144, 04017035. [Google Scholar] [CrossRef]
  58. Liu, Q.; Ruan, C.; Zhong, S.; Li, J.; Yin, Z.; Lian, X. Risk assessment of storm surge disaster based on numerical models and remote sensing. Int. J. Appl. Earth Obs. Geoinf. 2018, 68, 20–30. [Google Scholar] [CrossRef]
  59. Quinn, N.; Lewis, M.; Wadey, M.; Haigh, I. Assessing the temporal variability in extreme storm-tide time series for coastal flood risk assessment. J. Geophys. Res. Ocean. 2014, 119, 4983–4998. [Google Scholar] [CrossRef]
  60. Kim, G.; Barros, A.P. Quantitative flood forecasting using multisensor data and neural networks. J. Hydrol. 2001, 246, 45–62. [Google Scholar] [CrossRef]
  61. Fleming, S.W.; Bourdin, D.R.; Campbell, D.; Stull, R.B.; Gardner, T. Development and operational testing of a super-ensemble artificial intelligence flood-forecast model for a Pacific Northwest river. JAWRA J. Am. Water Resour. Assoc. 2015, 51, 502–512. [Google Scholar] [CrossRef]
  62. Wang, B.; Liu, S.; Wang, B.; Wu, W.; Wang, J.; Shen, D. Multi-step ahead short-term predictions of storm surge level using CNN and LSTM network. Acta Oceanol. Sin. 2021, 40, 104–118. [Google Scholar] [CrossRef]
Figure 1. Satellite images of super typhoon Saola, dated 31 August 2023.
Atmosphere 14 01597 g001
Figure 2. Radar (CAPPI, R) for super typhoon Saola, dated 1–2 September 2023.
Atmosphere 14 01597 g002
Figure 3. Route taken by super typhoon Saola during September 2023 in Macao.
Atmosphere 14 01597 g003
Figure 4. The unfolded architecture of BALSSA, a bidirectional attention-based LSTM model.
Atmosphere 14 01597 g004
Figure 5. Statistics for tropical cyclones occurred between 2017 and 2023.
Atmosphere 14 01597 g005
Figure 6. Correlation between surge level and wind velocity and pressure tendencies.
Atmosphere 14 01597 g006
Figure 7. Significance of wind and atmospheric pressure tendencies in ML models.
Atmosphere 14 01597 g007
Figure 8. Historical and forecasted track of super typhoon Saola on 31 August 2023, 00:00 UTC.
Atmosphere 14 01597 g008
Figure 9. Comparison of performance metrics for surge anomalies predictions of super typhoon Saola using different variations of BALSSA and regular LSTM models.
Atmosphere 14 01597 g009
Figure 10. Prediction leading times ranging from 1 to 72 h for surge predictions.
Atmosphere 14 01597 g010
Figure 11. Prediction leading times ranging from 1 to 72 h for wind velocity predictions.
Atmosphere 14 01597 g011
Figure 12. Prediction of wind velocity for the arrival of Saola on 2 September 2023.
Atmosphere 14 01597 g012
Figure 13. Comparison of surge anomalies between variations of BALSSA and the compared numerical storm surge model.
Atmosphere 14 01597 g013
Figure 14. Tide level prediction for Typhoon Saola on 2 September 2023, using the BALSSA model.
Atmosphere 14 01597 g014
Table 1. Snapshot of the collected meteorological and tide data in the dataset.
Date TimeAst Tide + (m)Tide Obs $ (m)Sea Temp (°C)WS * (km/h)WS *  Δ  = 1 h (km/h)WS *  Δ  = 3 h (km/h)# (hPa)#  Δ  = 1 h (hPa)#  Δ  = 3 h (hPa)
2 September 2023 0:302.333.14030.694.6837.4456.16971.9−2.6−7.9
2 September 2023 0:452.303.28930.778.1218.0023.04974.40.8−4.7
2 September 2023 1:002.273.33730.668.40−10.0822.68974.61.3−4.3
2 September 2023 1:152.233.15530.661.56−18.3610.80975.72.3−2.6
2 September 2023 1:302.183.03530.654.72−39.962.88976.64.7−1.2
2 September 2023 1:452.132.99230.560.12−18.0018.00976.82.4−0.6
2 September 2023 2:002.062.93830.455.44−12.96−7.20977.12.50.8
+ Ast Tide: Astronomical Tide; $ Tide Obs: Tide Observation; * WS: Wind Speed; # P: Atmospheric Pressure.
Table 2. Key factors influencing wind velocity prediction in BALSSA.
Key ParametersInfluencesExplanation
TemperatureAir DensityTemperature affects air density, which, in turn, influences wind speed. Warmer air tends to be less dense, impacting atmospheric pressure and wind patterns.
Wind SpeedHistorical TrendsPast wind speed data serve as a foundational input, enabling the model to recognize patterns and trends. It forms the basis for understanding how wind velocity has behaved over time.
Air PressureAtmospheric ConditionsChanges in air pressure signify shifts in atmospheric conditions. Monitoring air pressure is crucial for predicting wind velocity as it reflects the movement of air masses.
HumidityAtmospheric StabilityHumidity levels influence atmospheric stability. Moist air is less stable, potentially leading to changes in wind patterns. Incorporating humidity adds a layer of complexity to the model’s understanding.
Time of Day/Seasonal FactorsTemporal DependenciesTime of day and seasonal changes introduce temporal dependencies. For instance, coastal areas may experience different wind patterns during the day compared to night. Seasonal variations also impact wind behavior.
Tendency Changes in Wind Velocity ( Δ Hour = 1, 3 and 6)Directional TrendsUnderstanding the tendency changes in wind velocity provides insights into the directional shifts over time. Recognizing these trends aids the model in capturing the dynamic nature of wind patterns.
Tendency Changes in Atmospheric Pressure ( Δ Hour = 1, 3 and 6)Pressure GradientsChanges in atmospheric pressure tendencies contribute to pressure gradients, influencing wind flow. This parameter helps the model discern how pressure variations impact wind velocity.
Disclaimer/Publisher’s Note: The statements, opinions and data contained in all publications are solely those of the individual author(s) and contributor(s) and not of MDPI and/or the editor(s). MDPI and/or the editor(s) disclaim responsibility for any injury to people or property resulting from any ideas, methods, instructions or products referred to in the content.

