
Gaseous and Particulate Pollution in the Wu-Chang-Shi Urban Agglomeration on the Northern Slope of Tianshan Mountains from 2017 to 2021
 ,
,
Abstract
:1. Introduction
2. Data and Methods
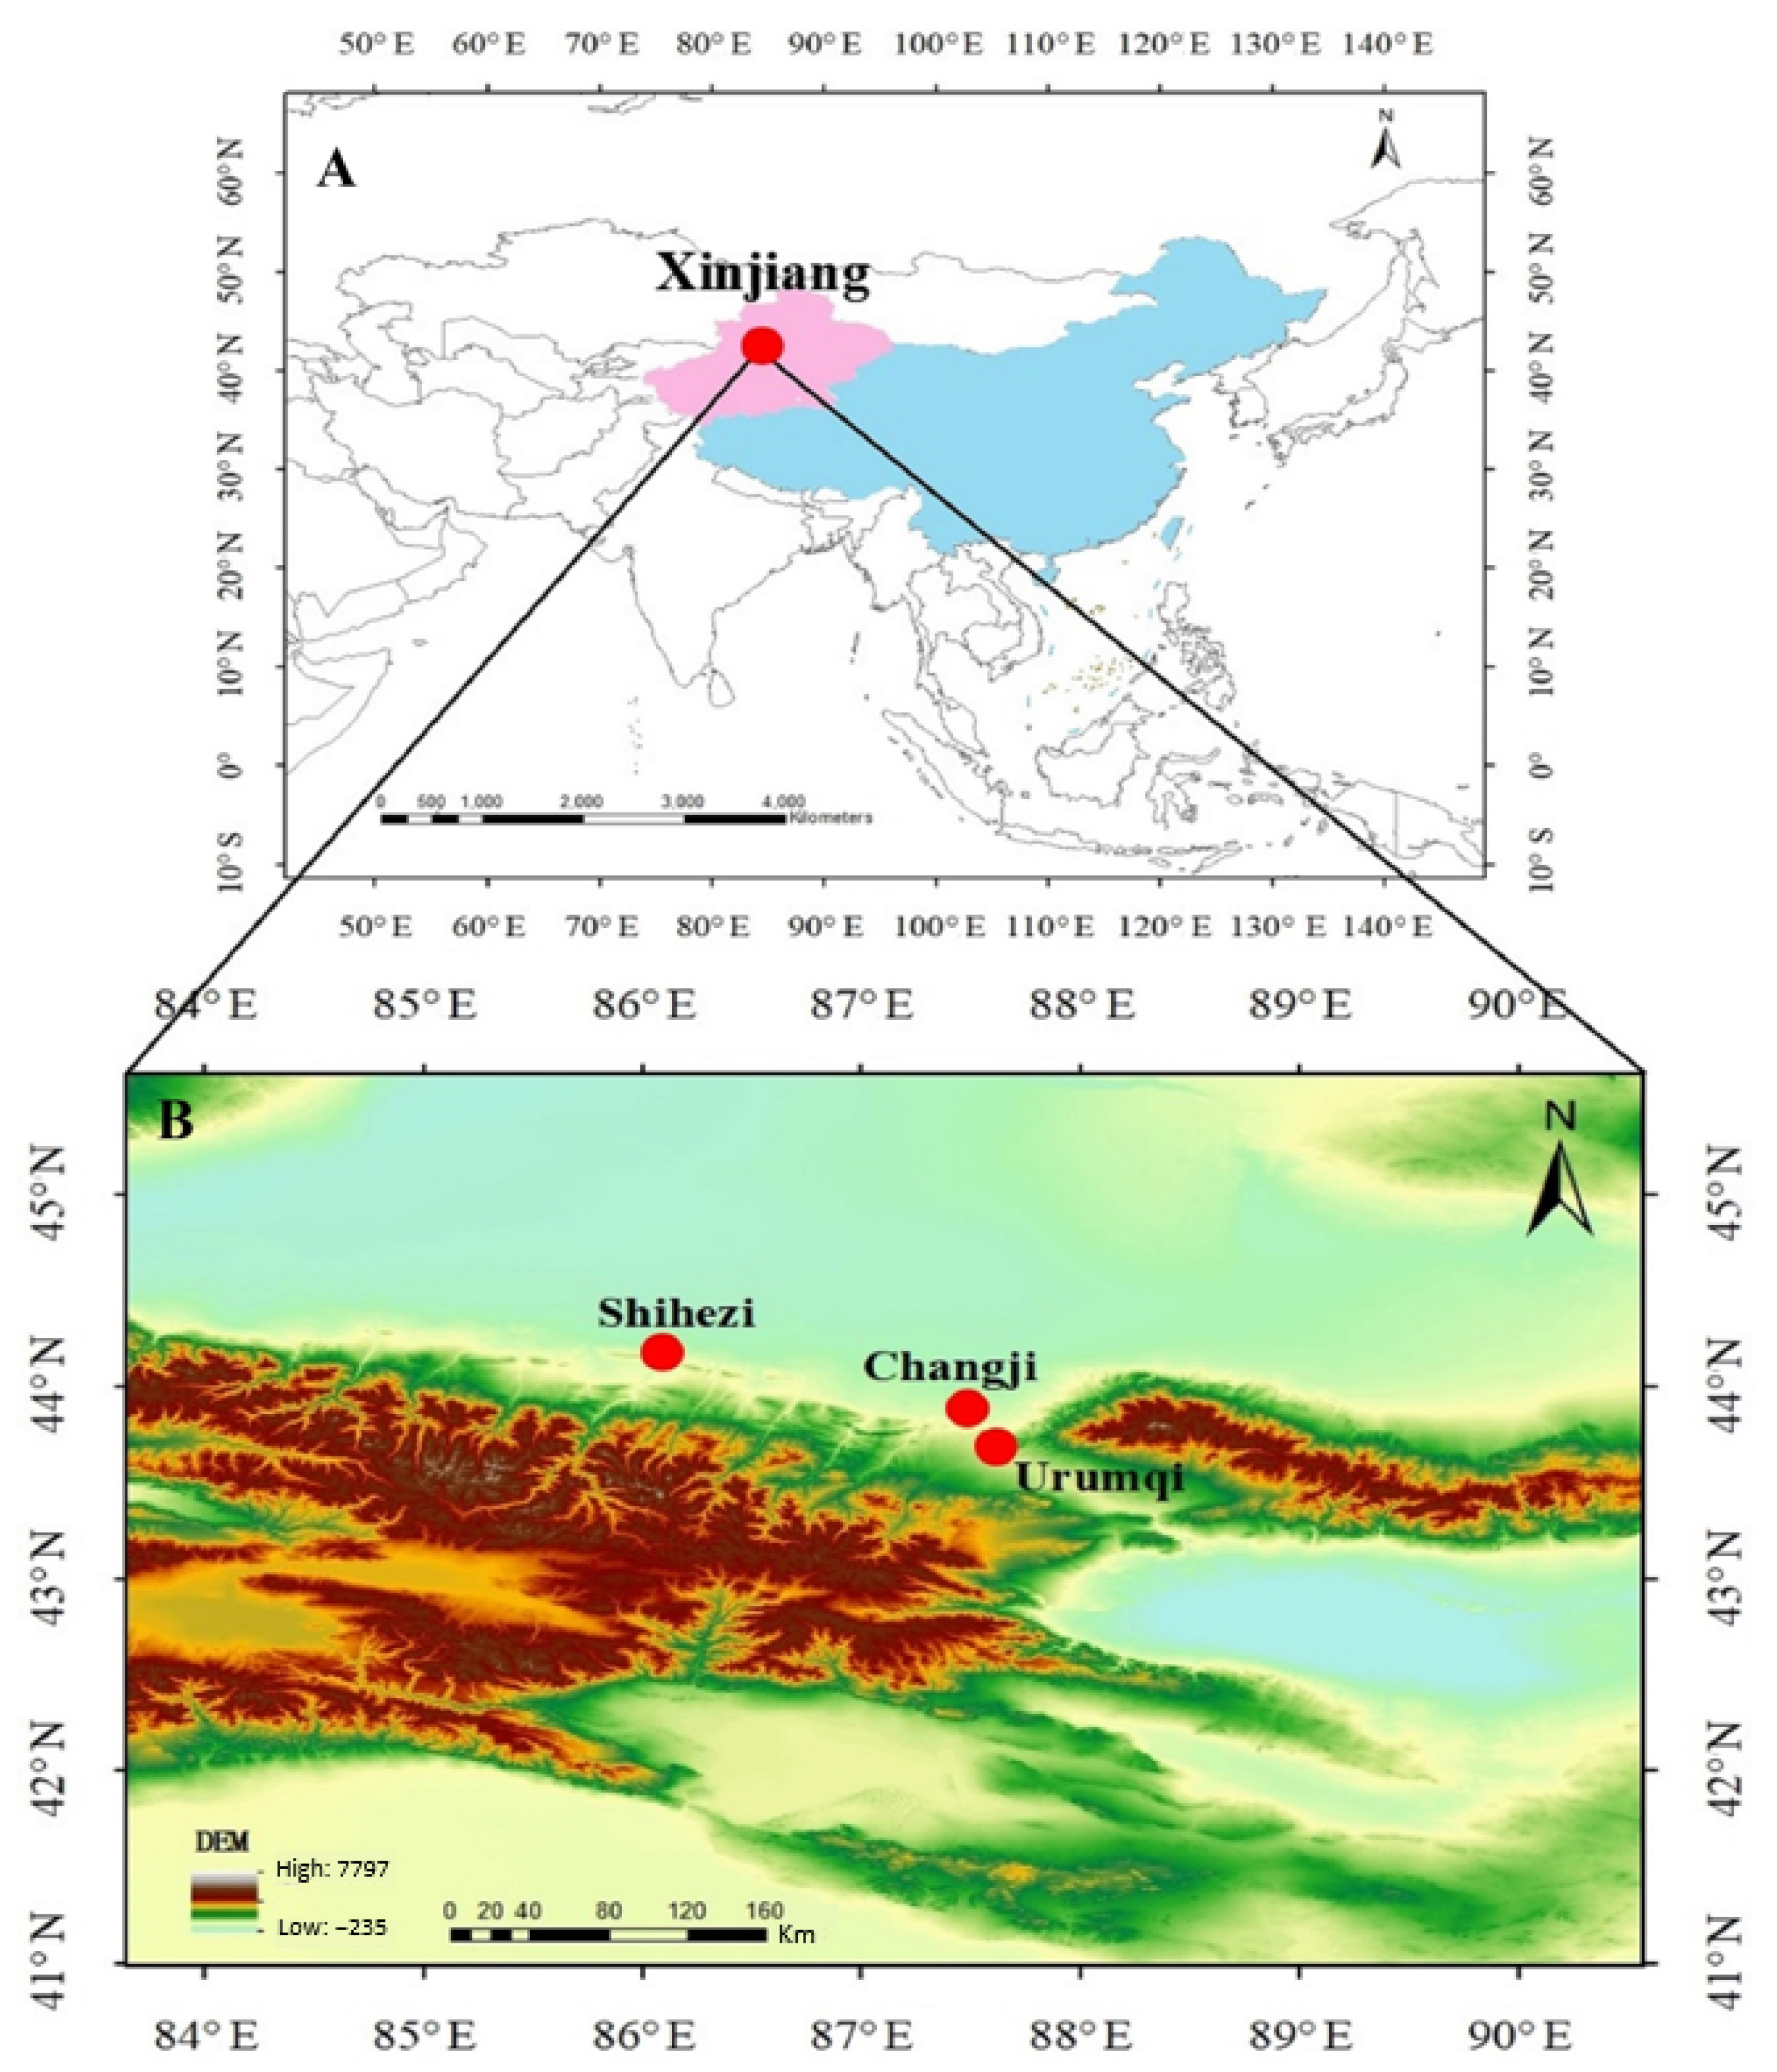
2.1. Studying urban
2.2. Data Collection and Data Analyses
2.2.1. Data Collection
2.2.2. Data Analyses
HYSPLIT Model and Backward Trajectory
Cluster Analysis
Potential Source Contribution Function
Concentration Weighted Trajectory Analysis
3. Results and Discussions
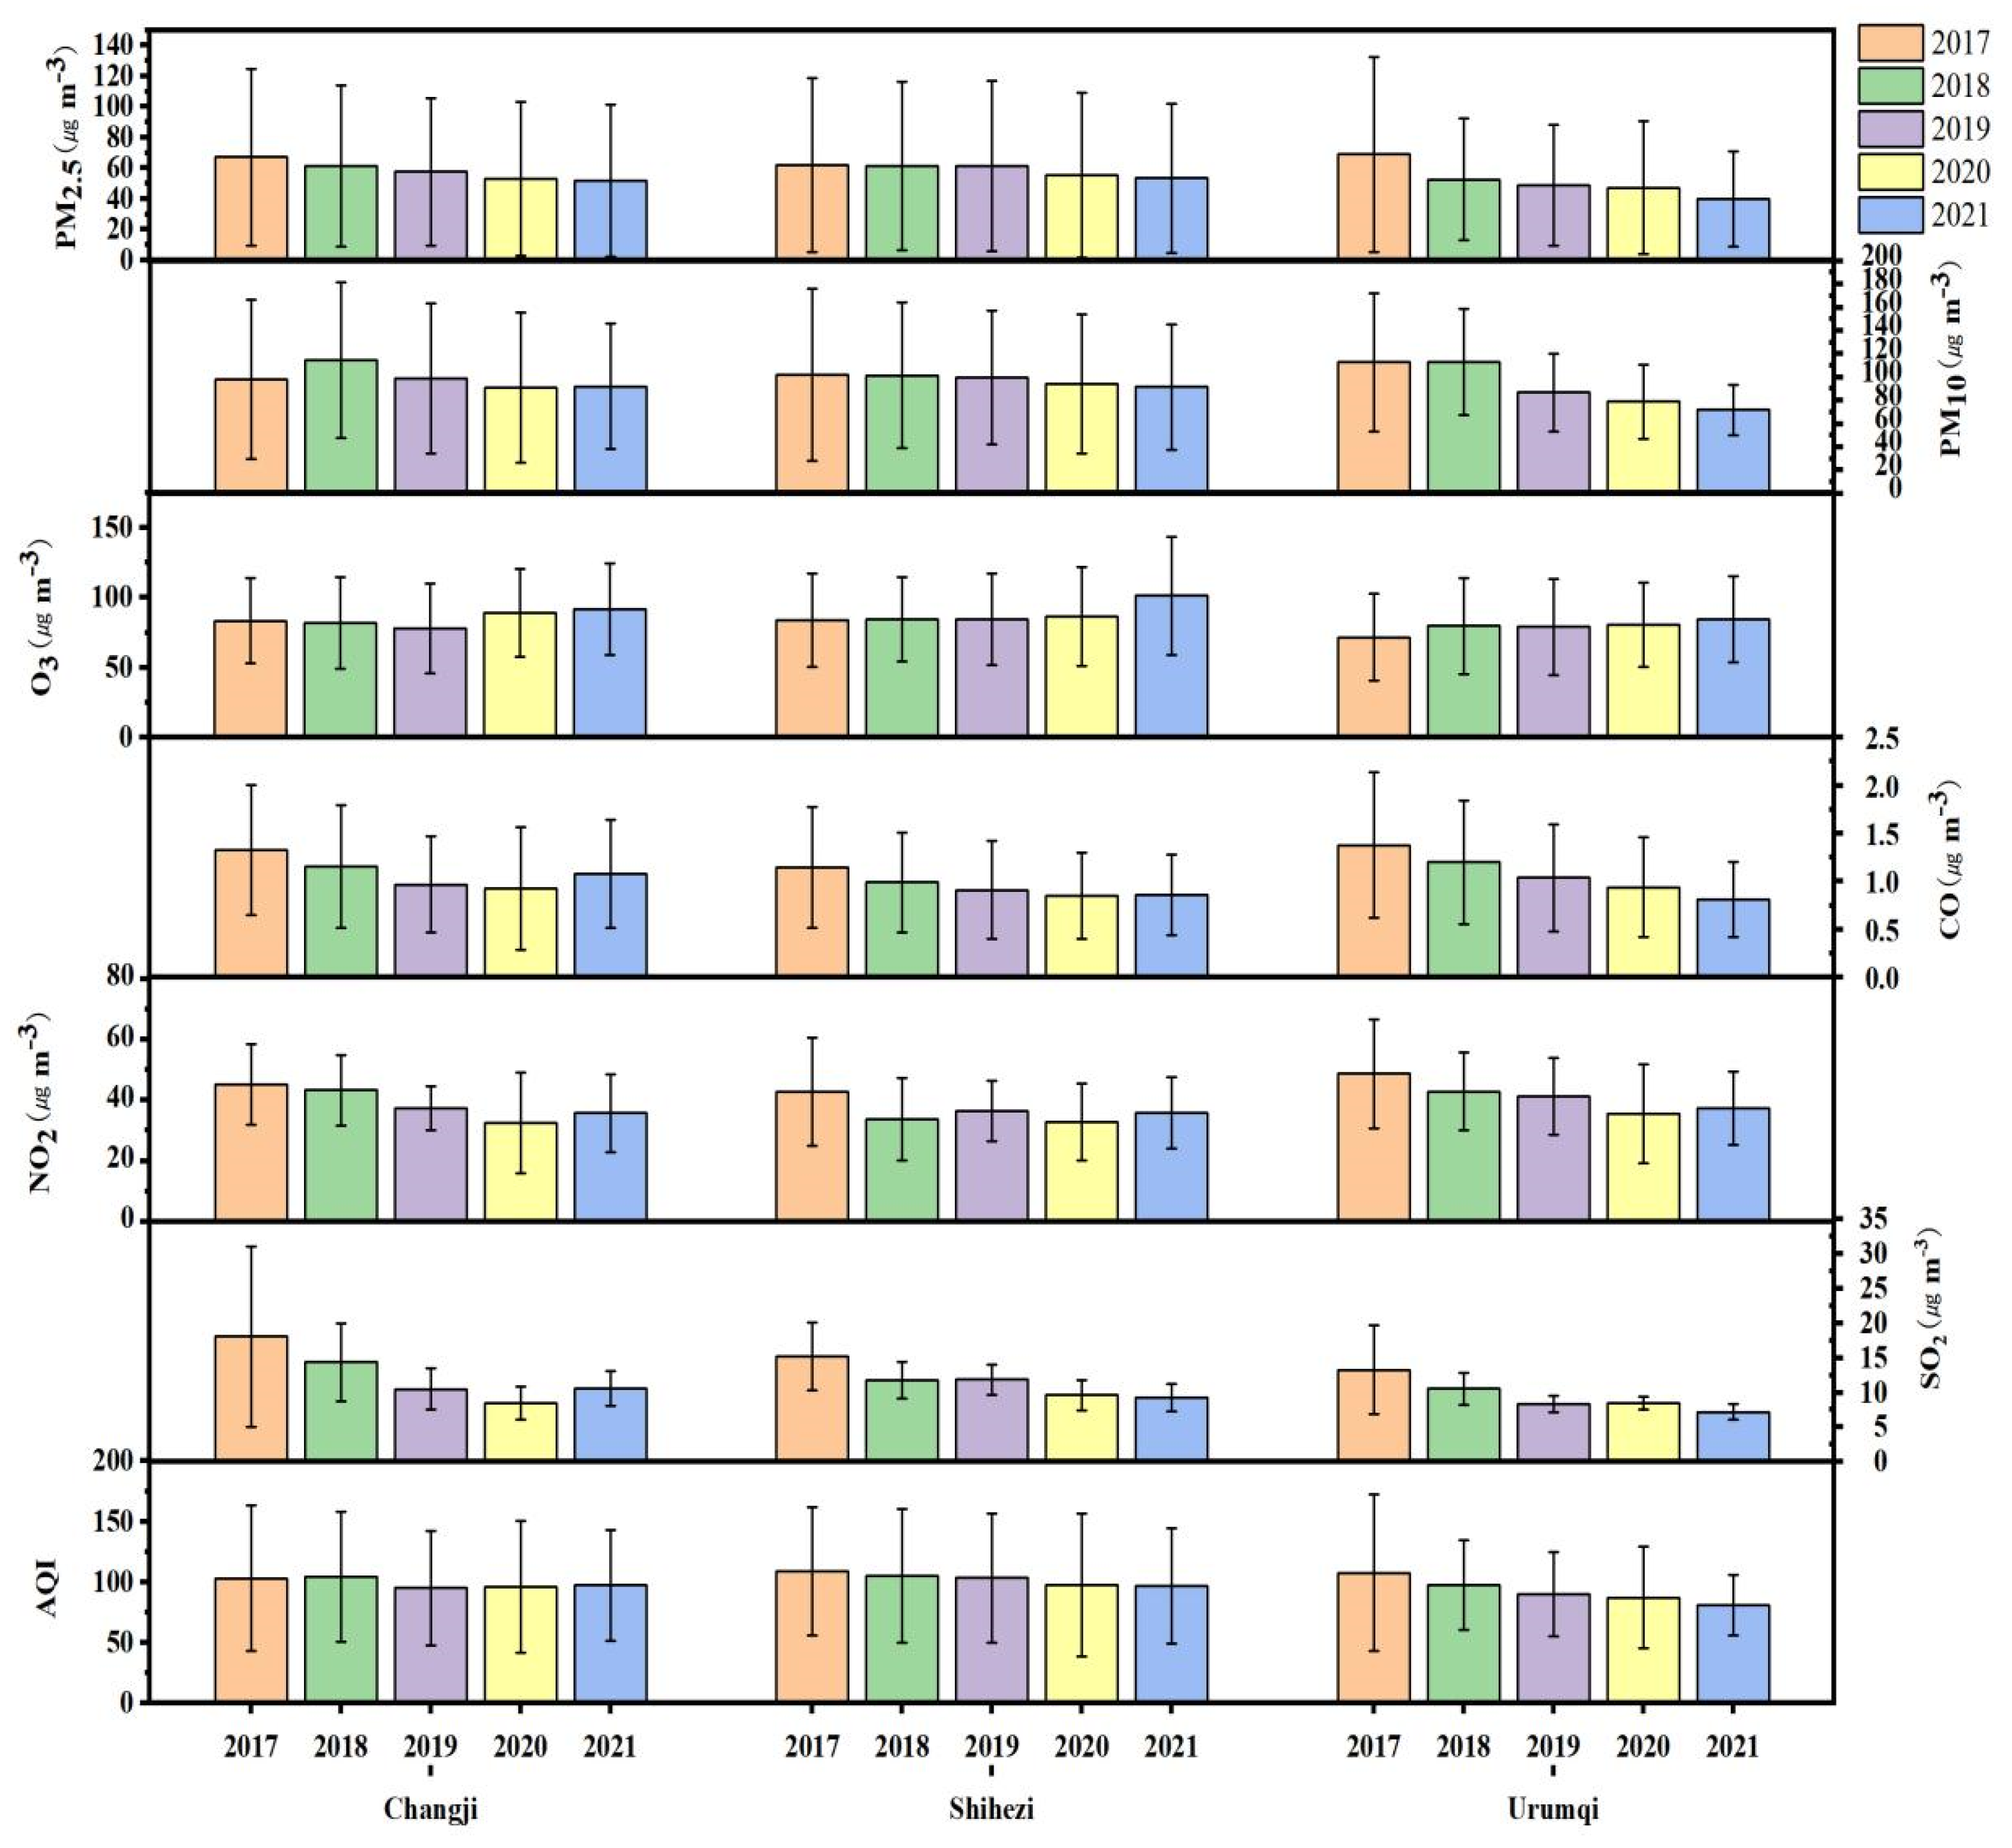
3.1. Urban Gaseous and Particulate Pollutants Profiles
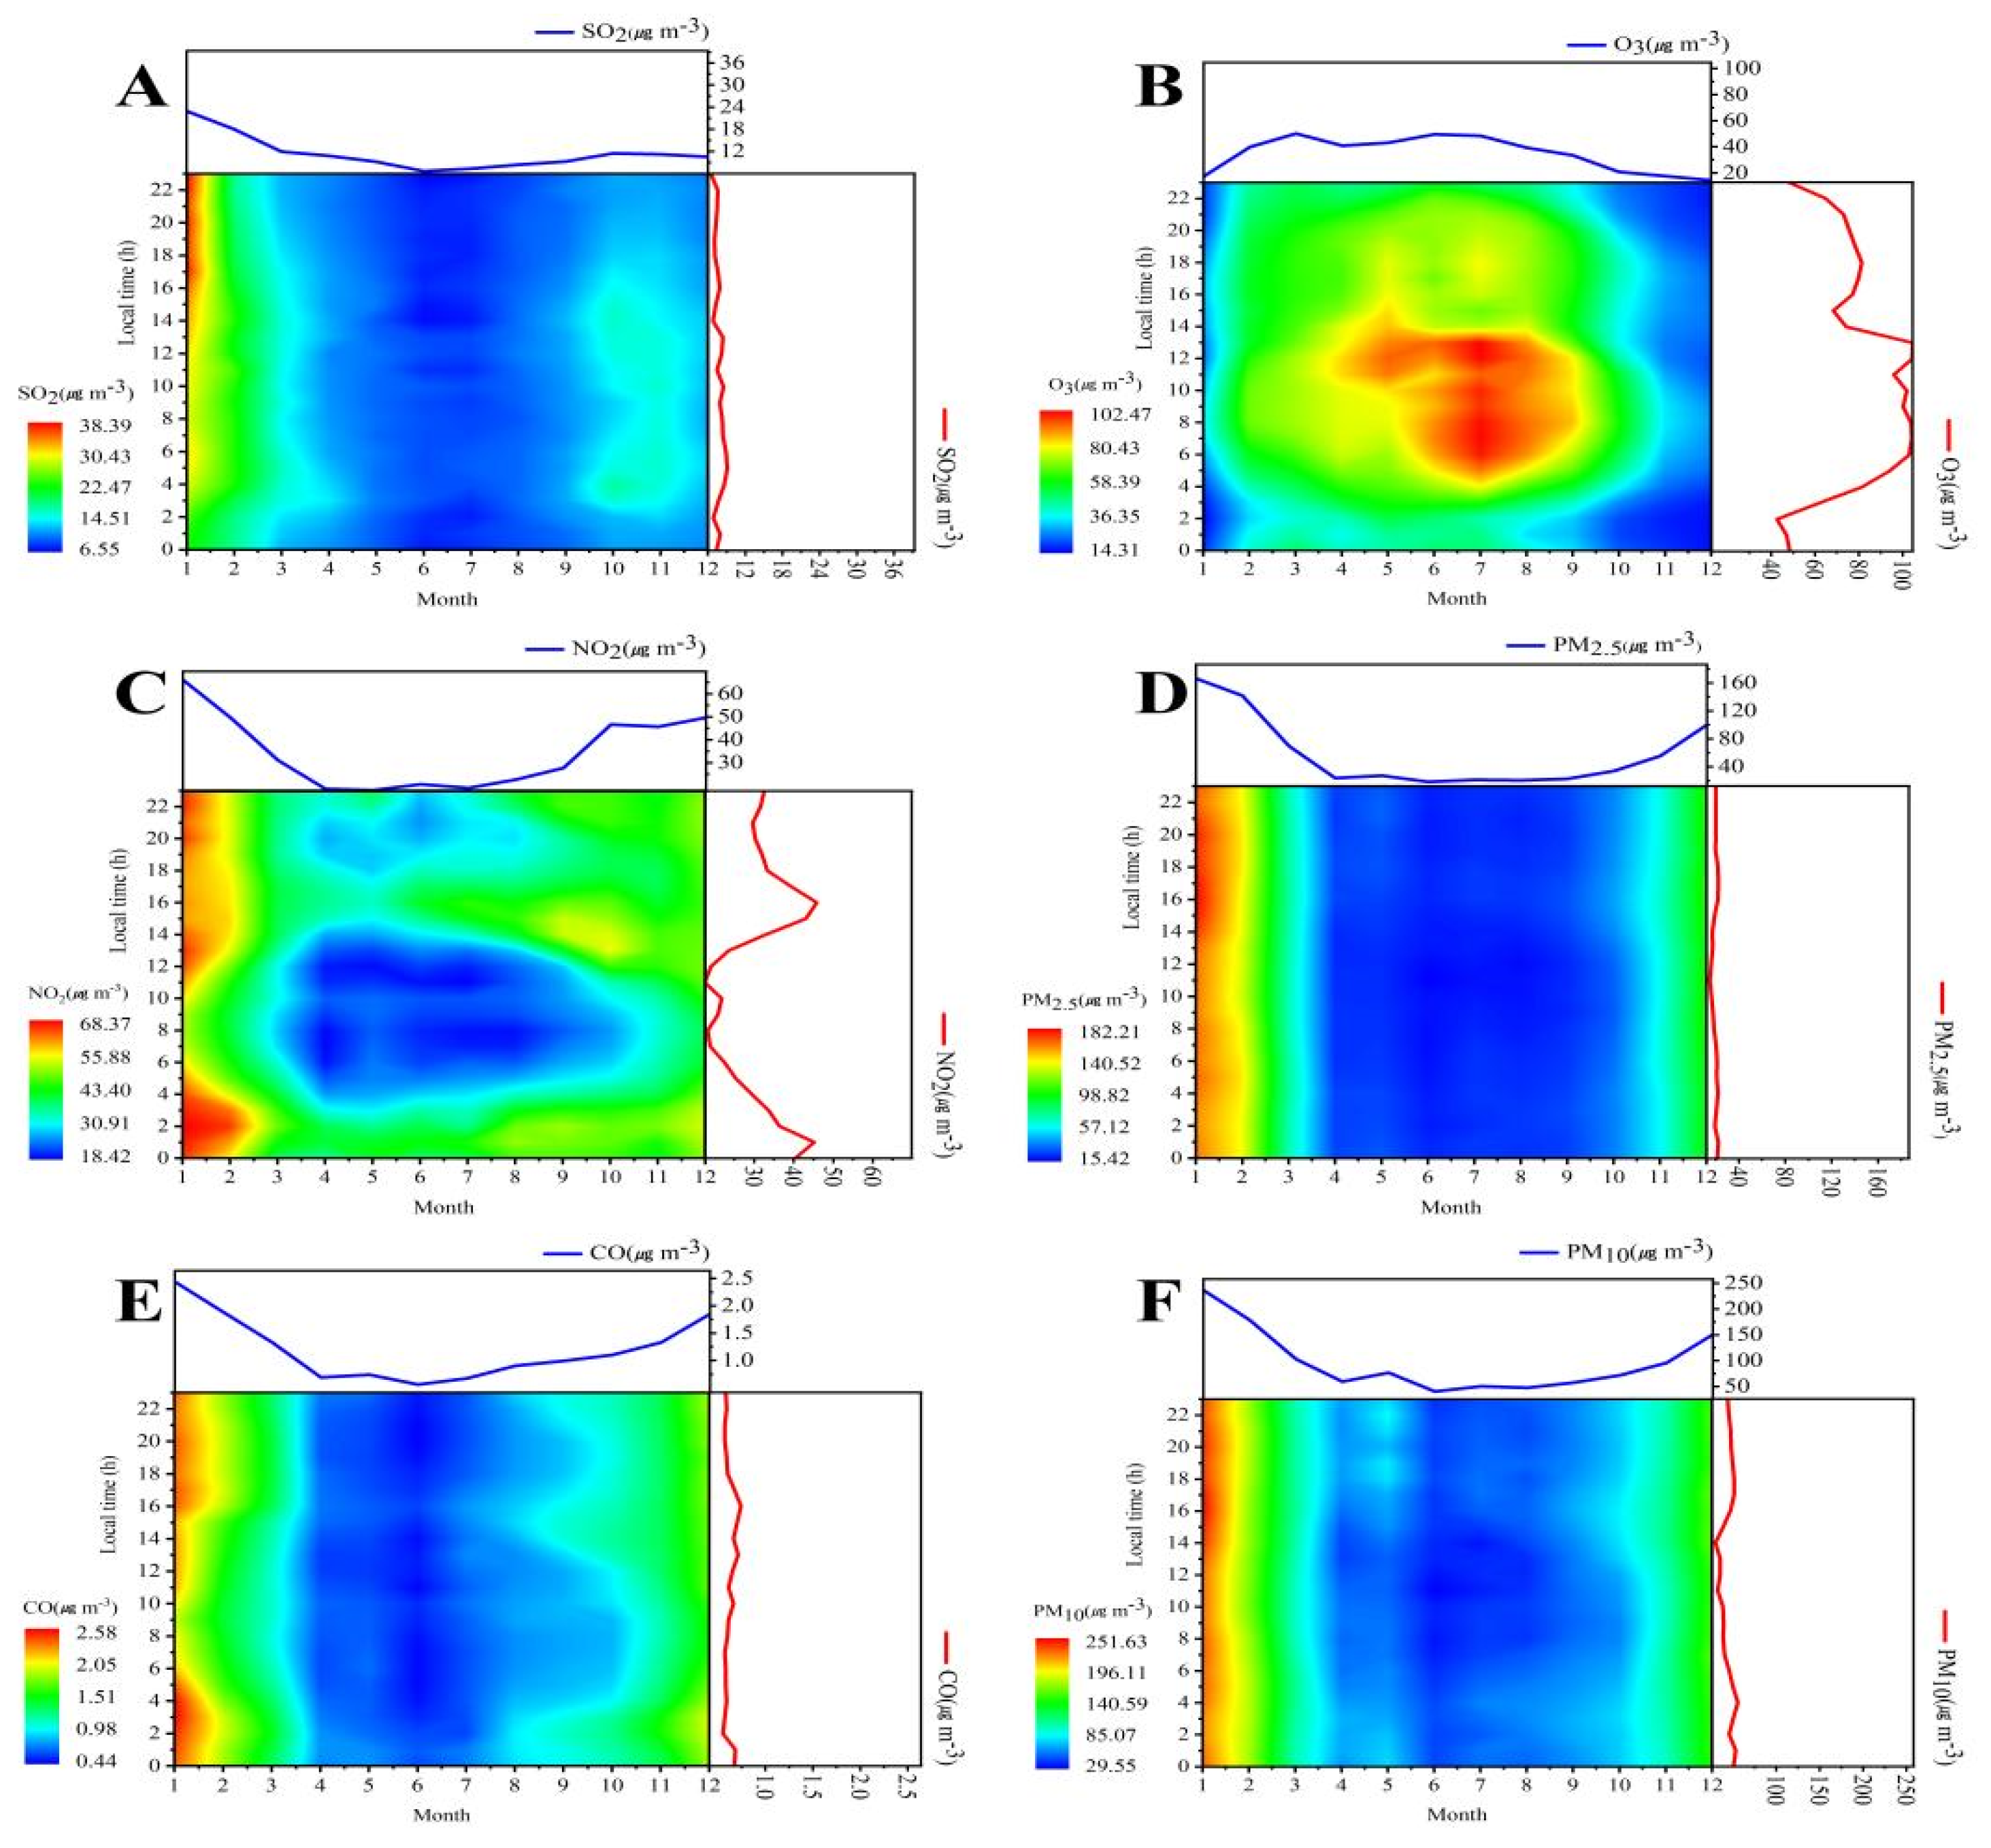
3.2. Seasonal Variation
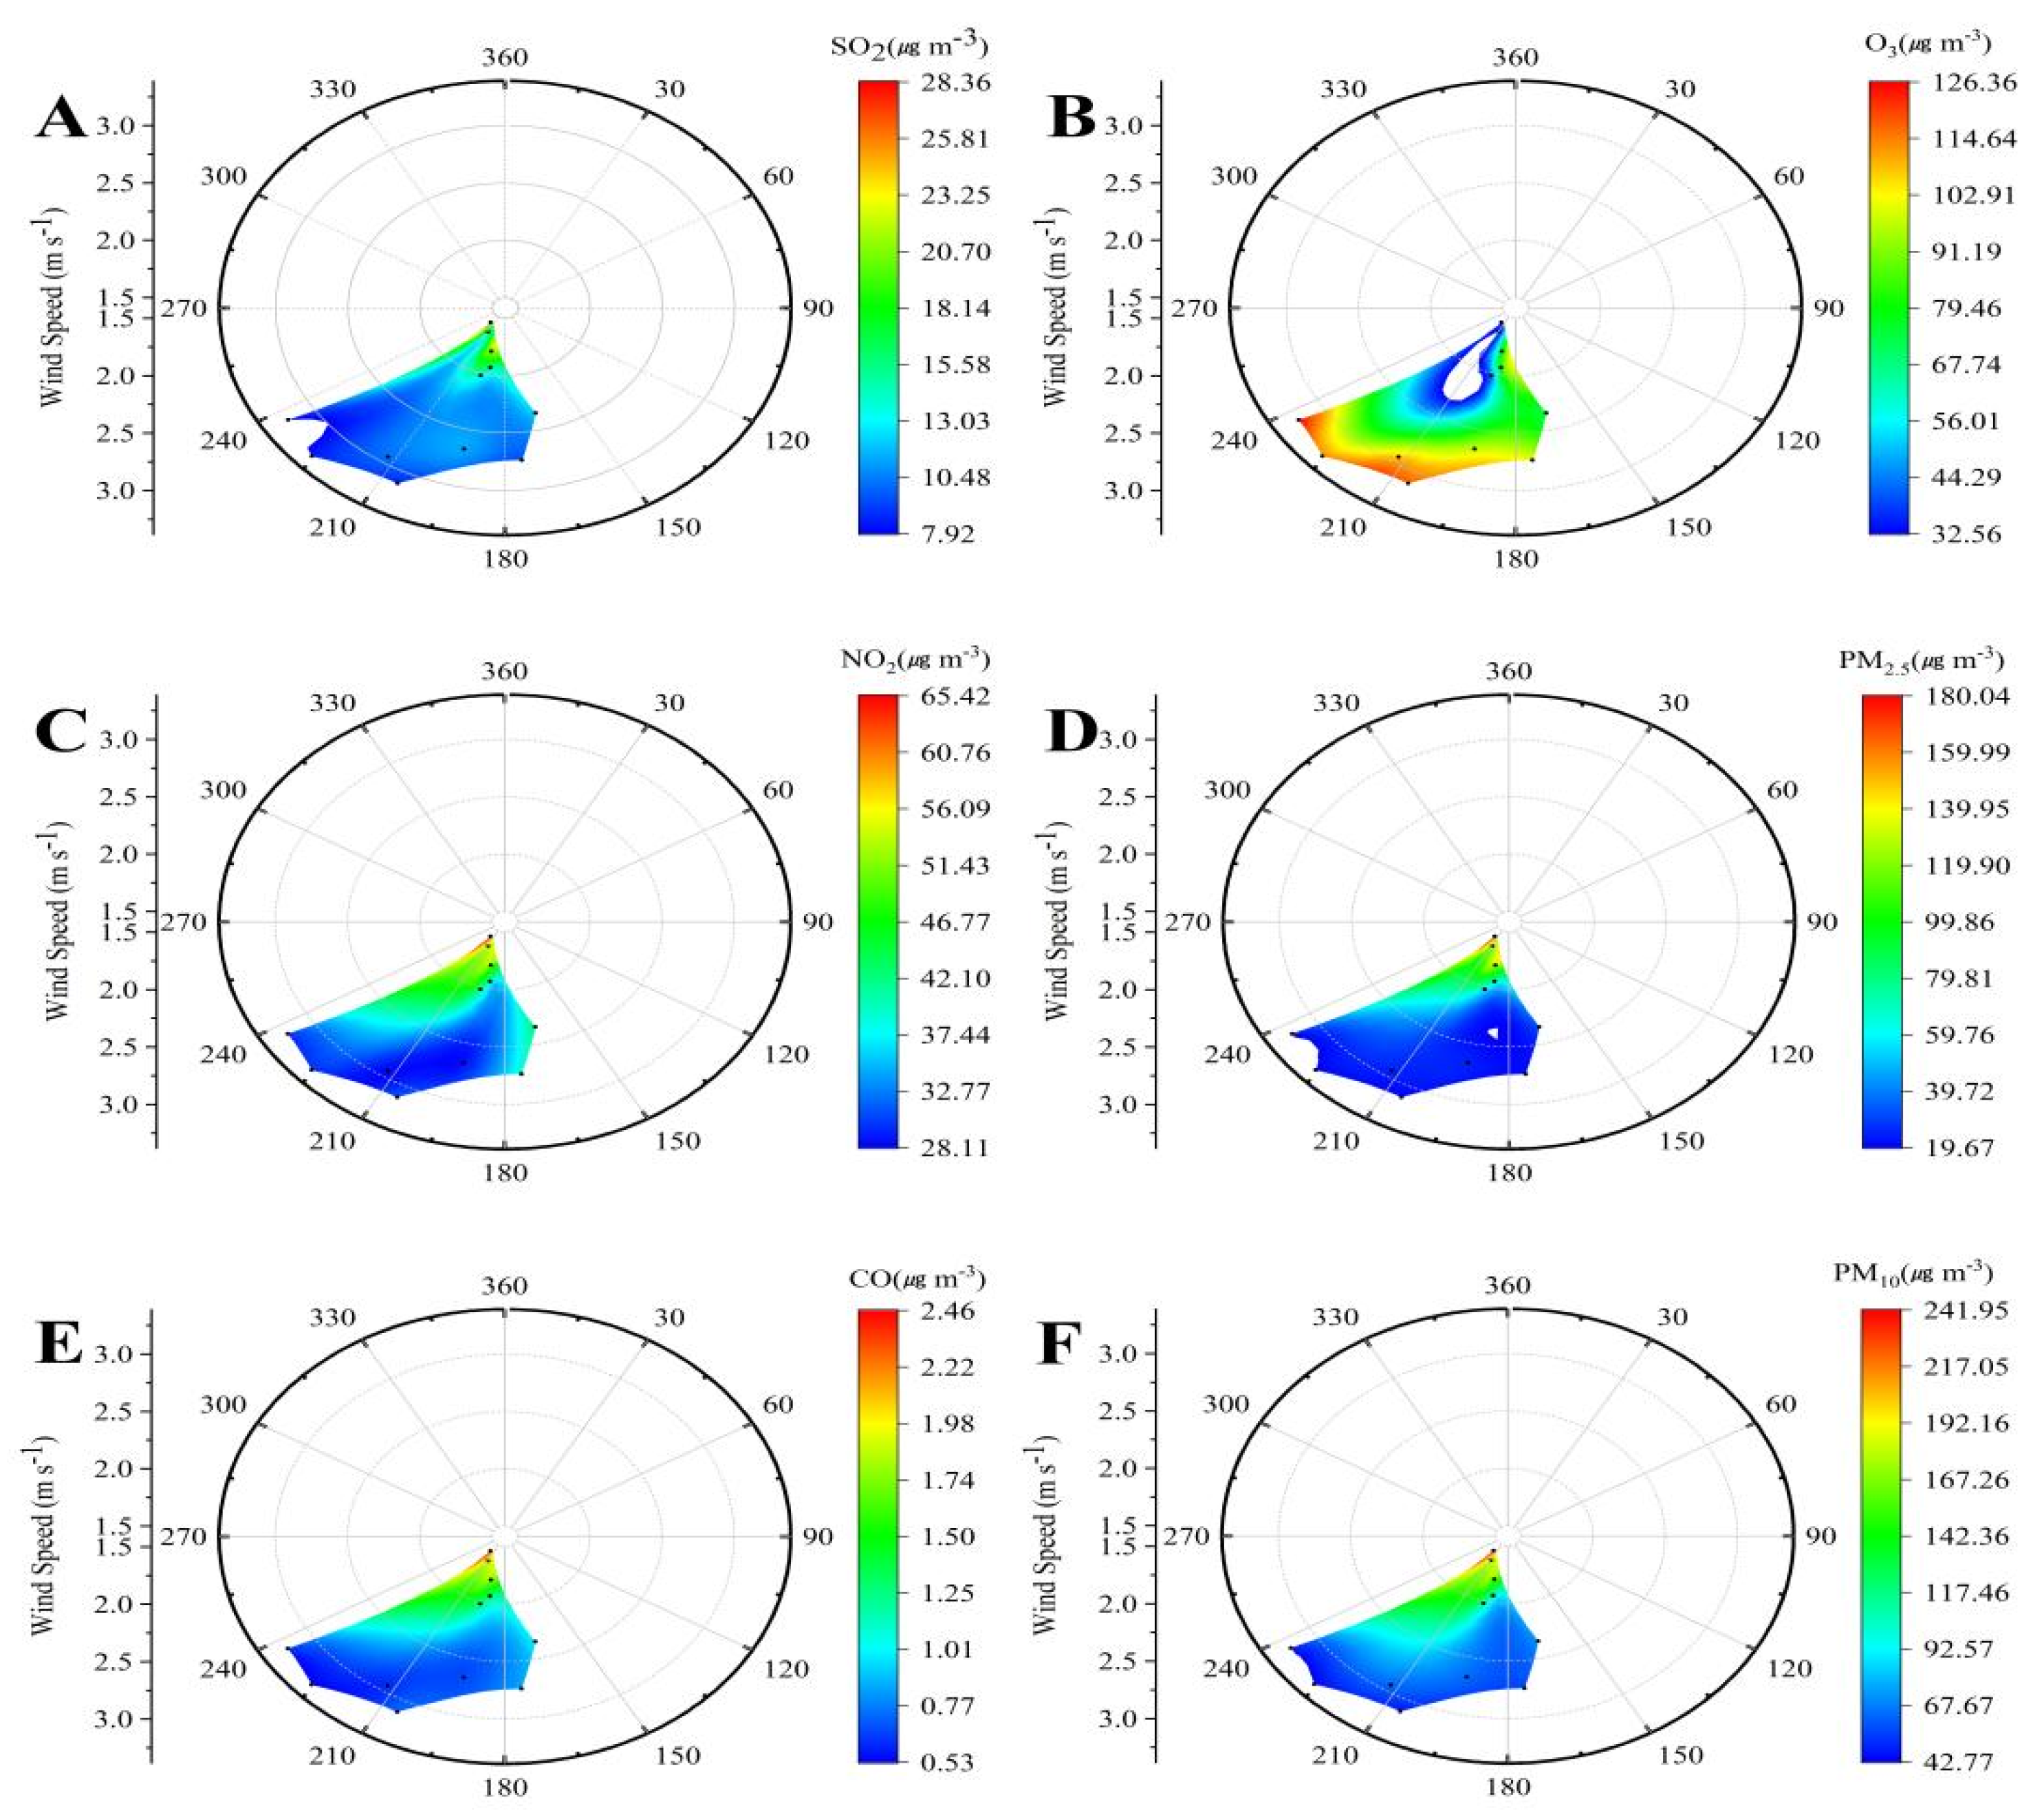
3.3. Influence of Meteorological Factor on Pollutants Concentration
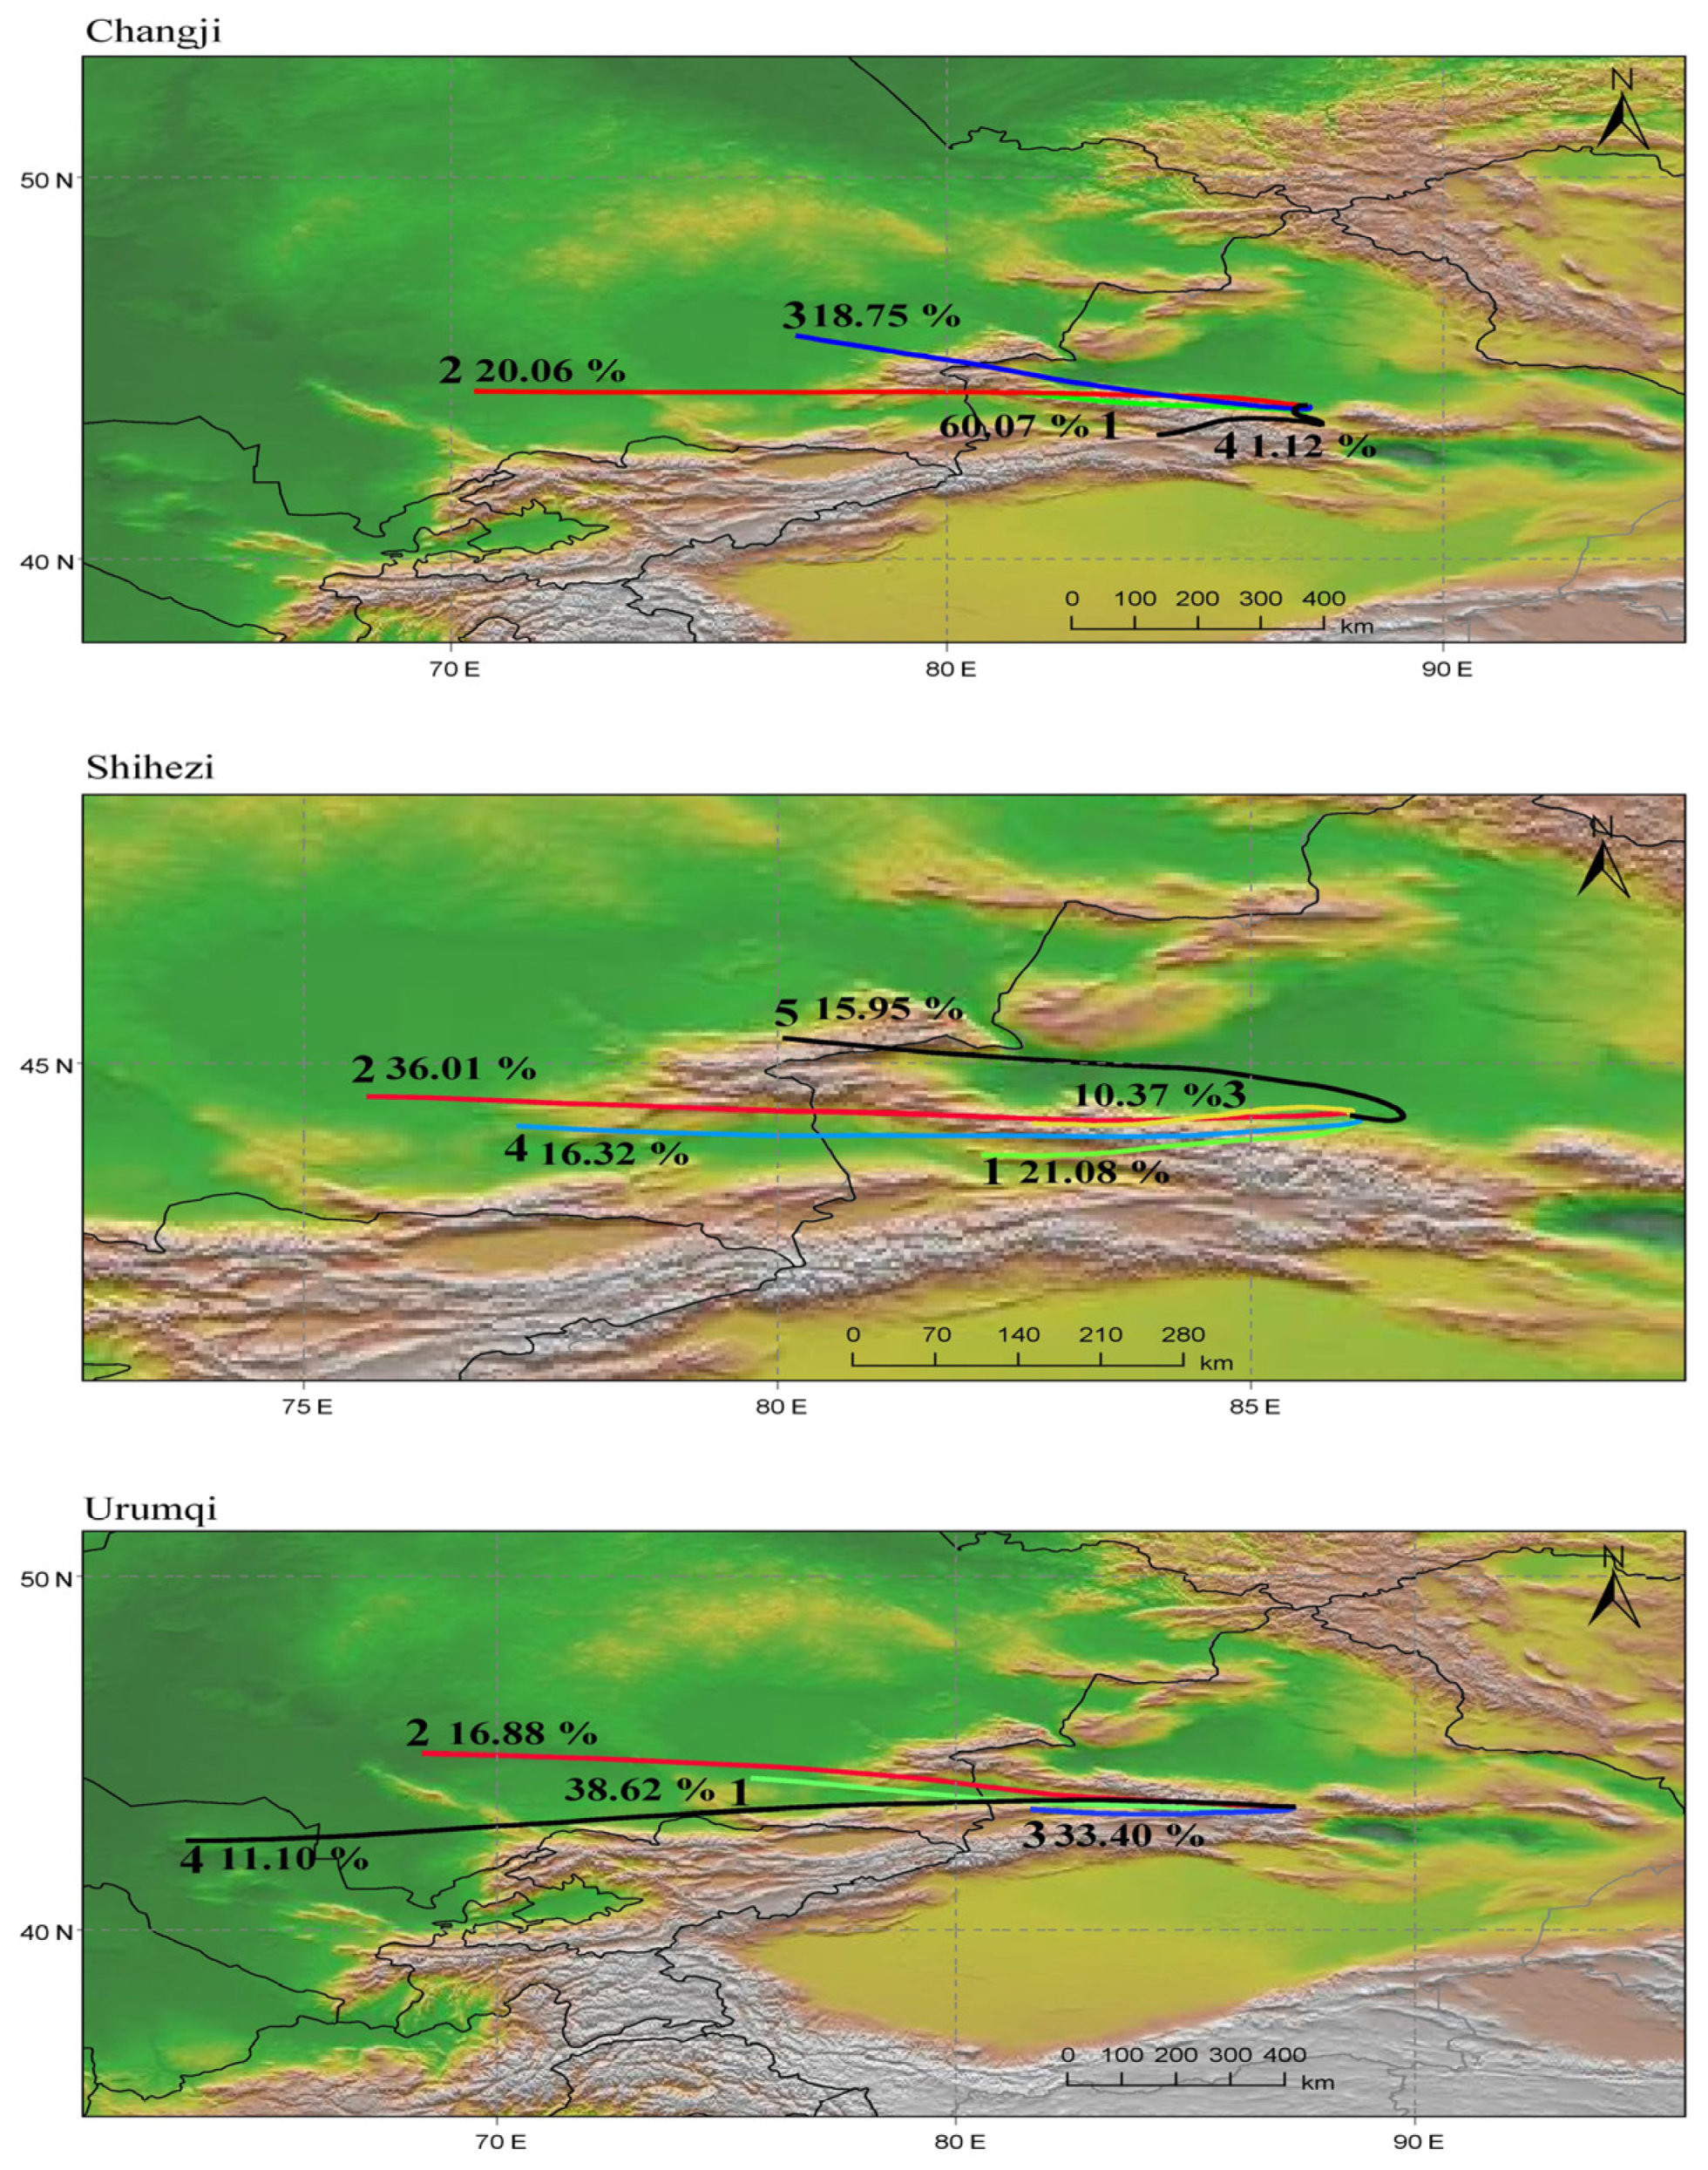
3.4. Backward Trajectory Clustering Analysis during Winter
3.5. Potential Source Area Analysis
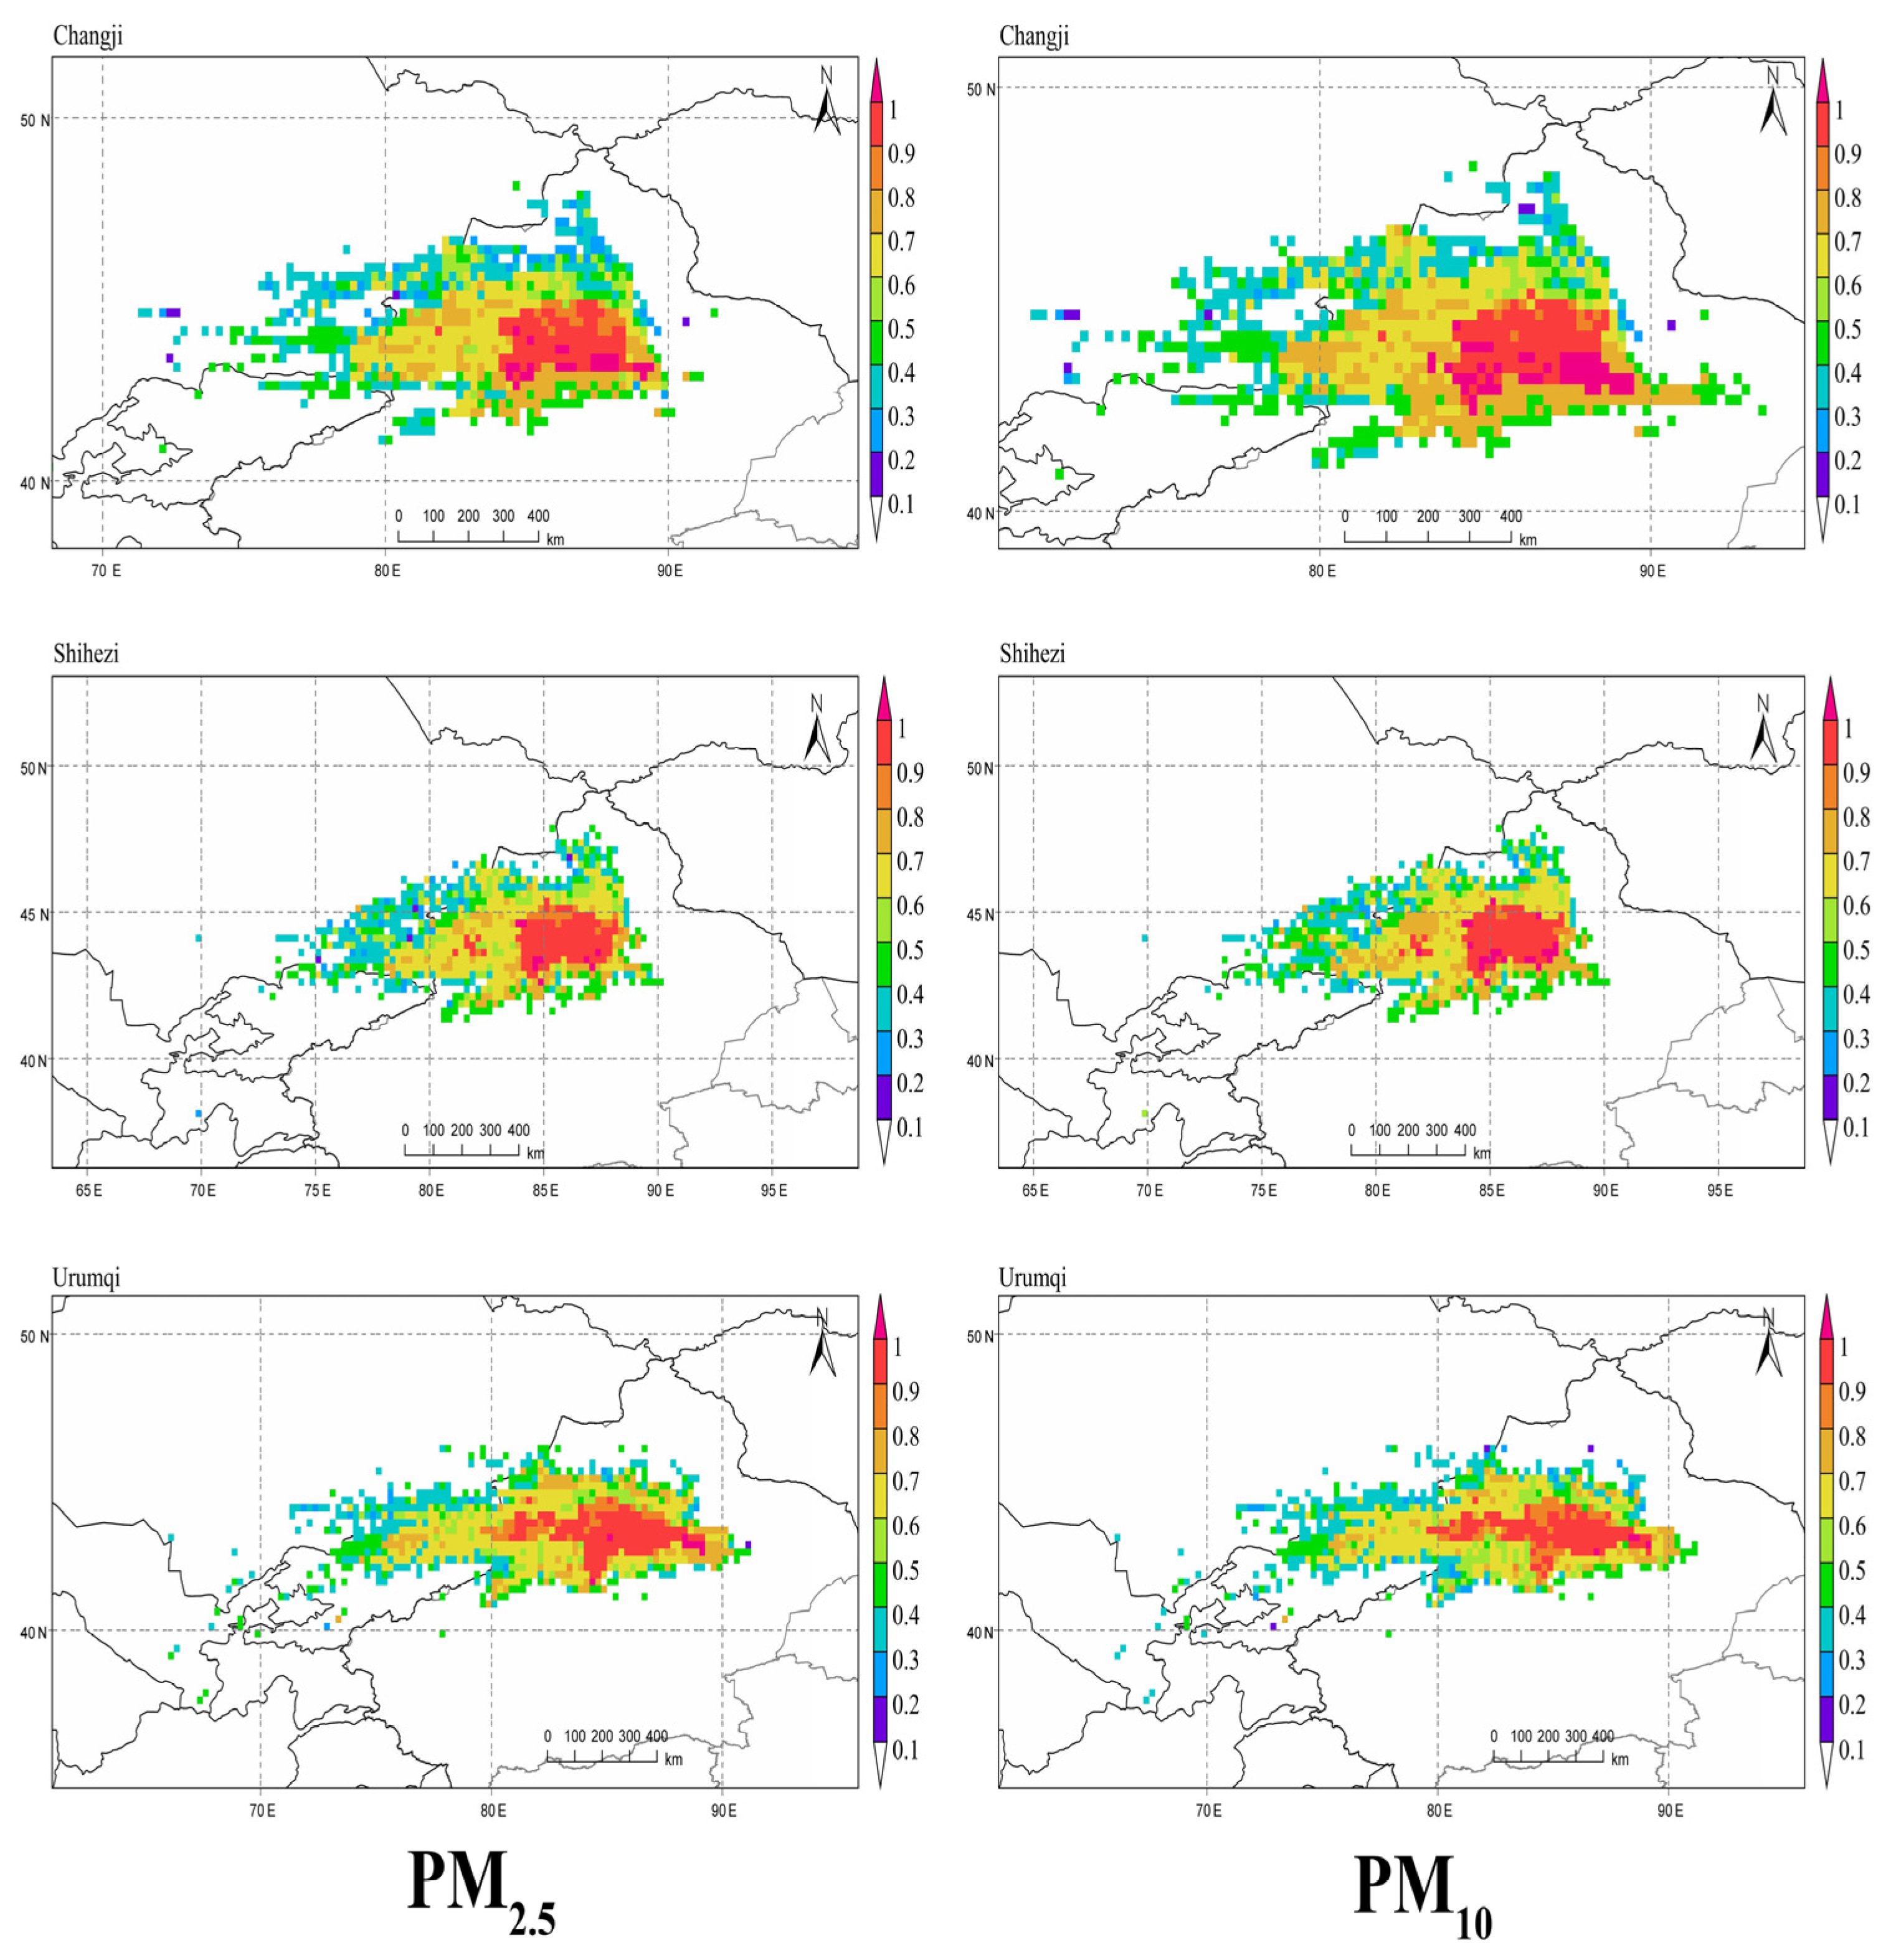
3.5.1. PSCF Analysis
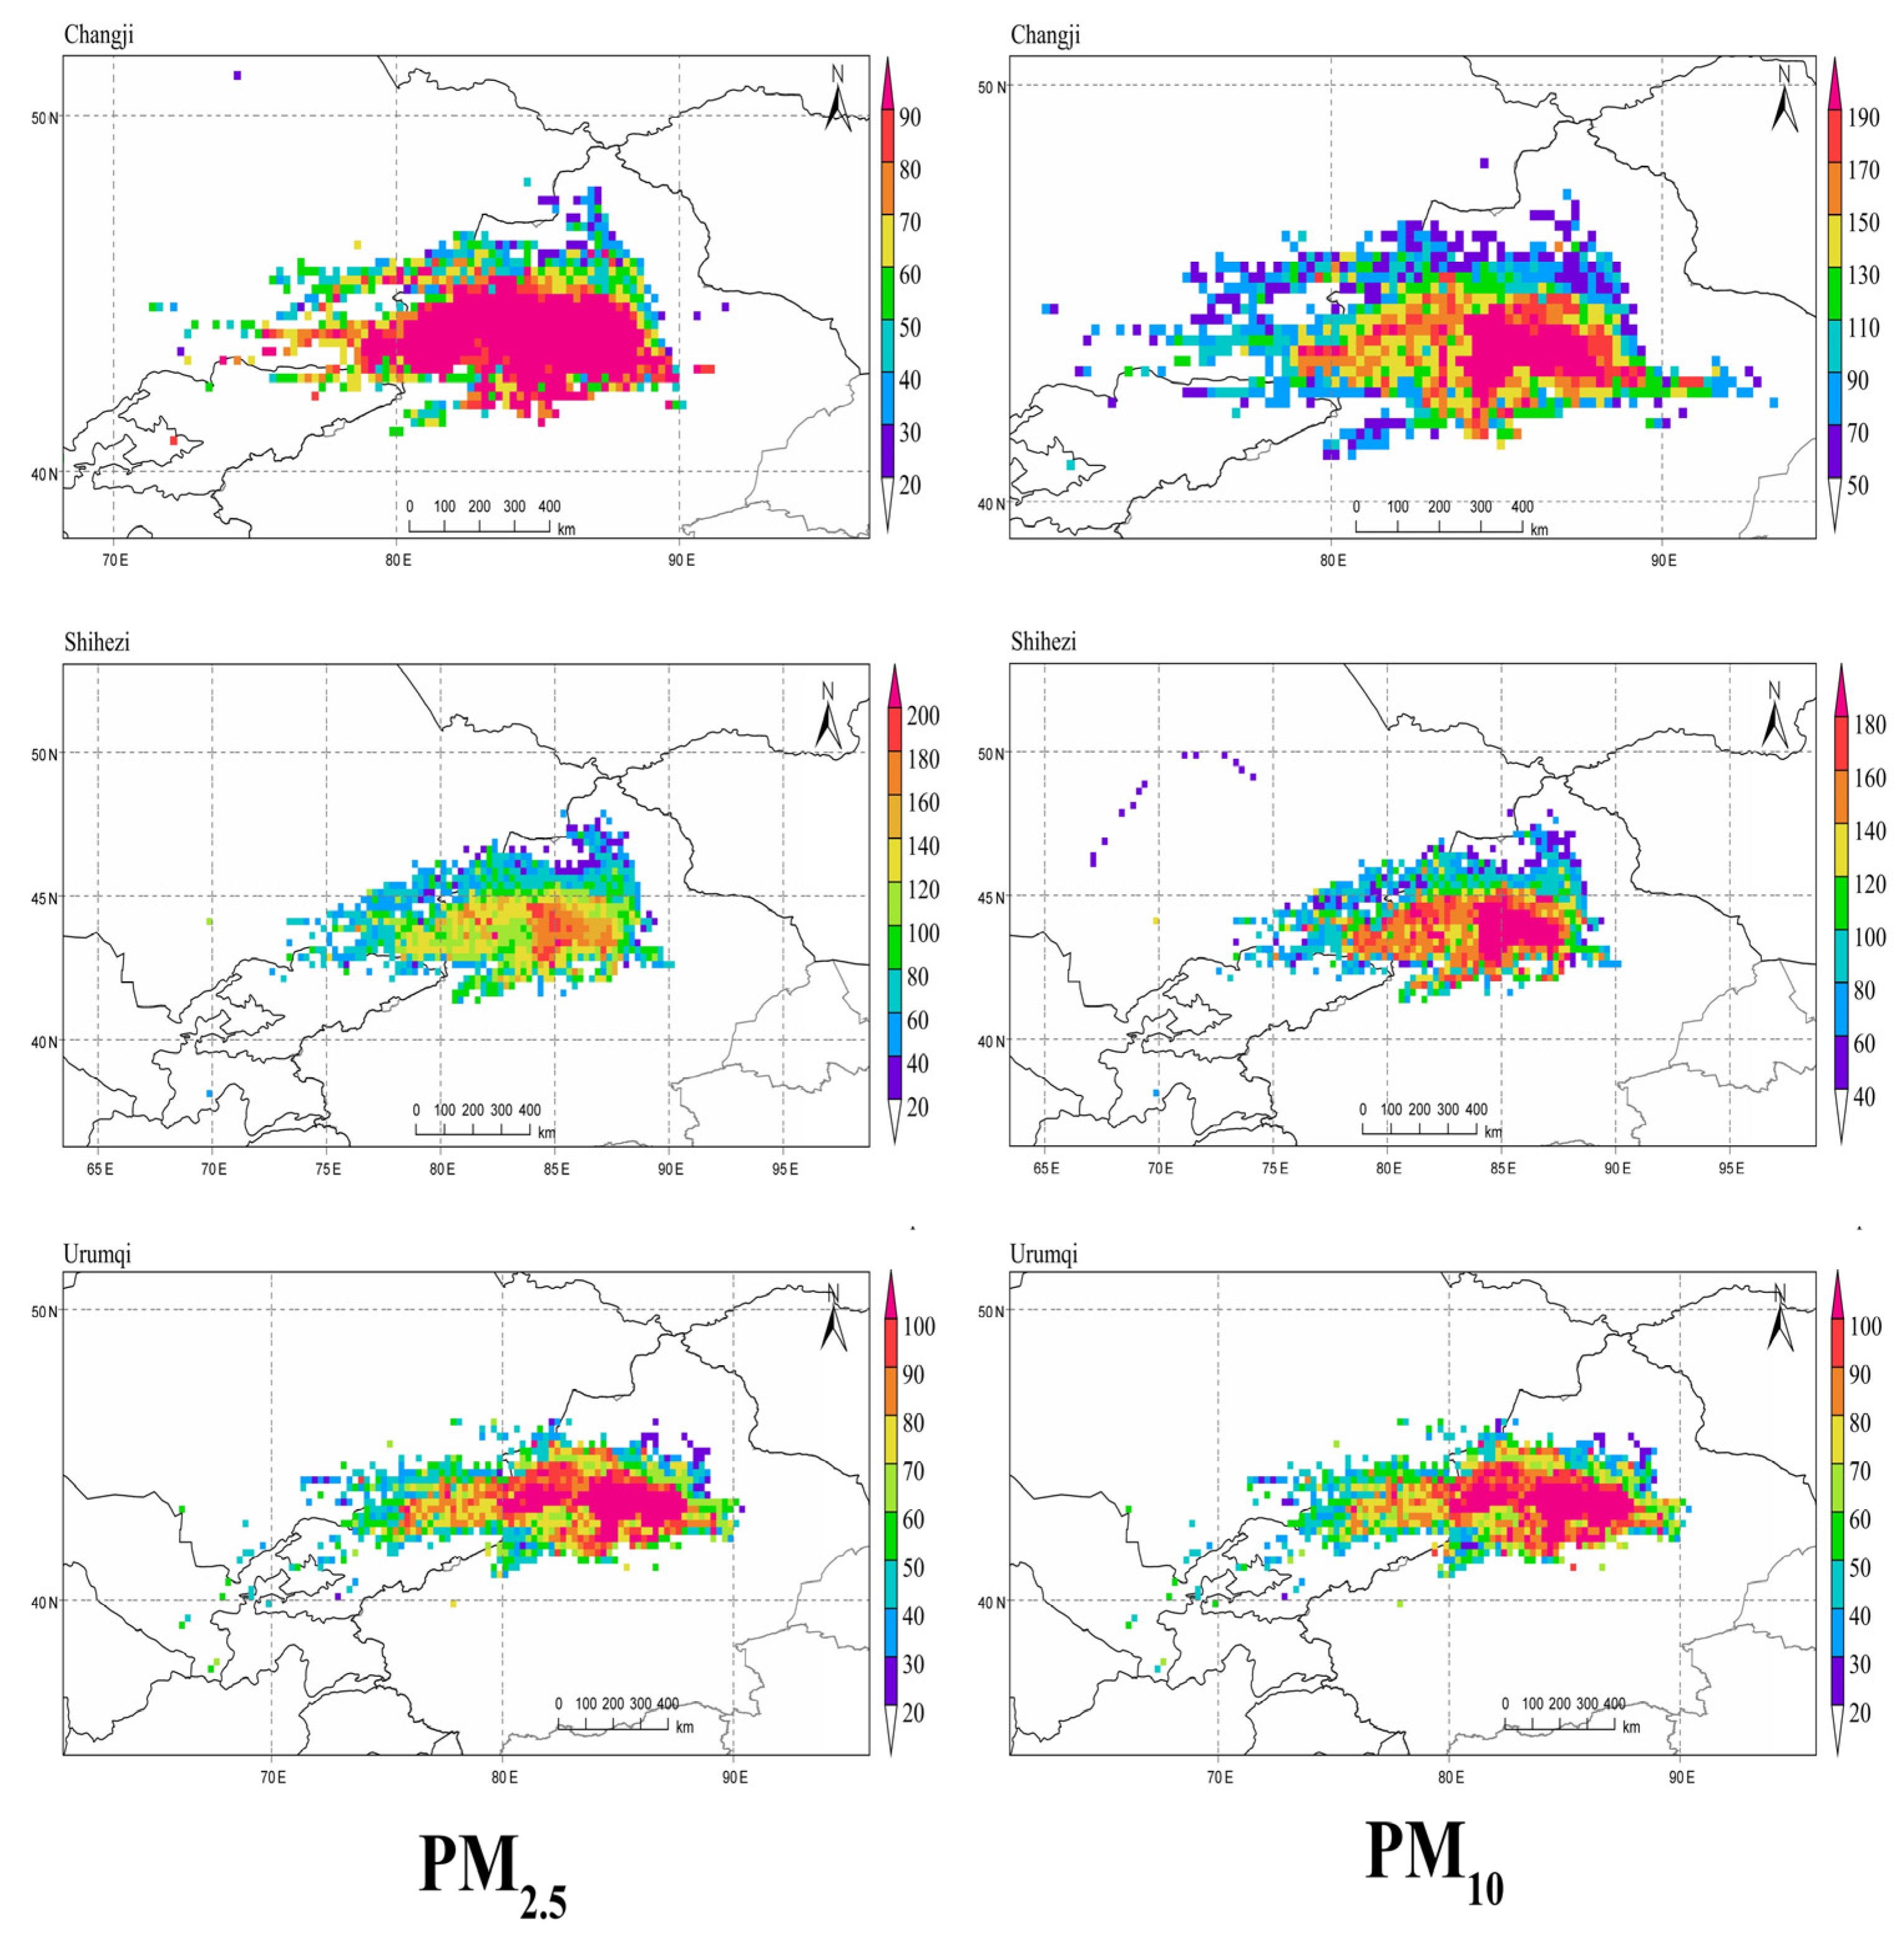
3.5.2. CWT Analyse
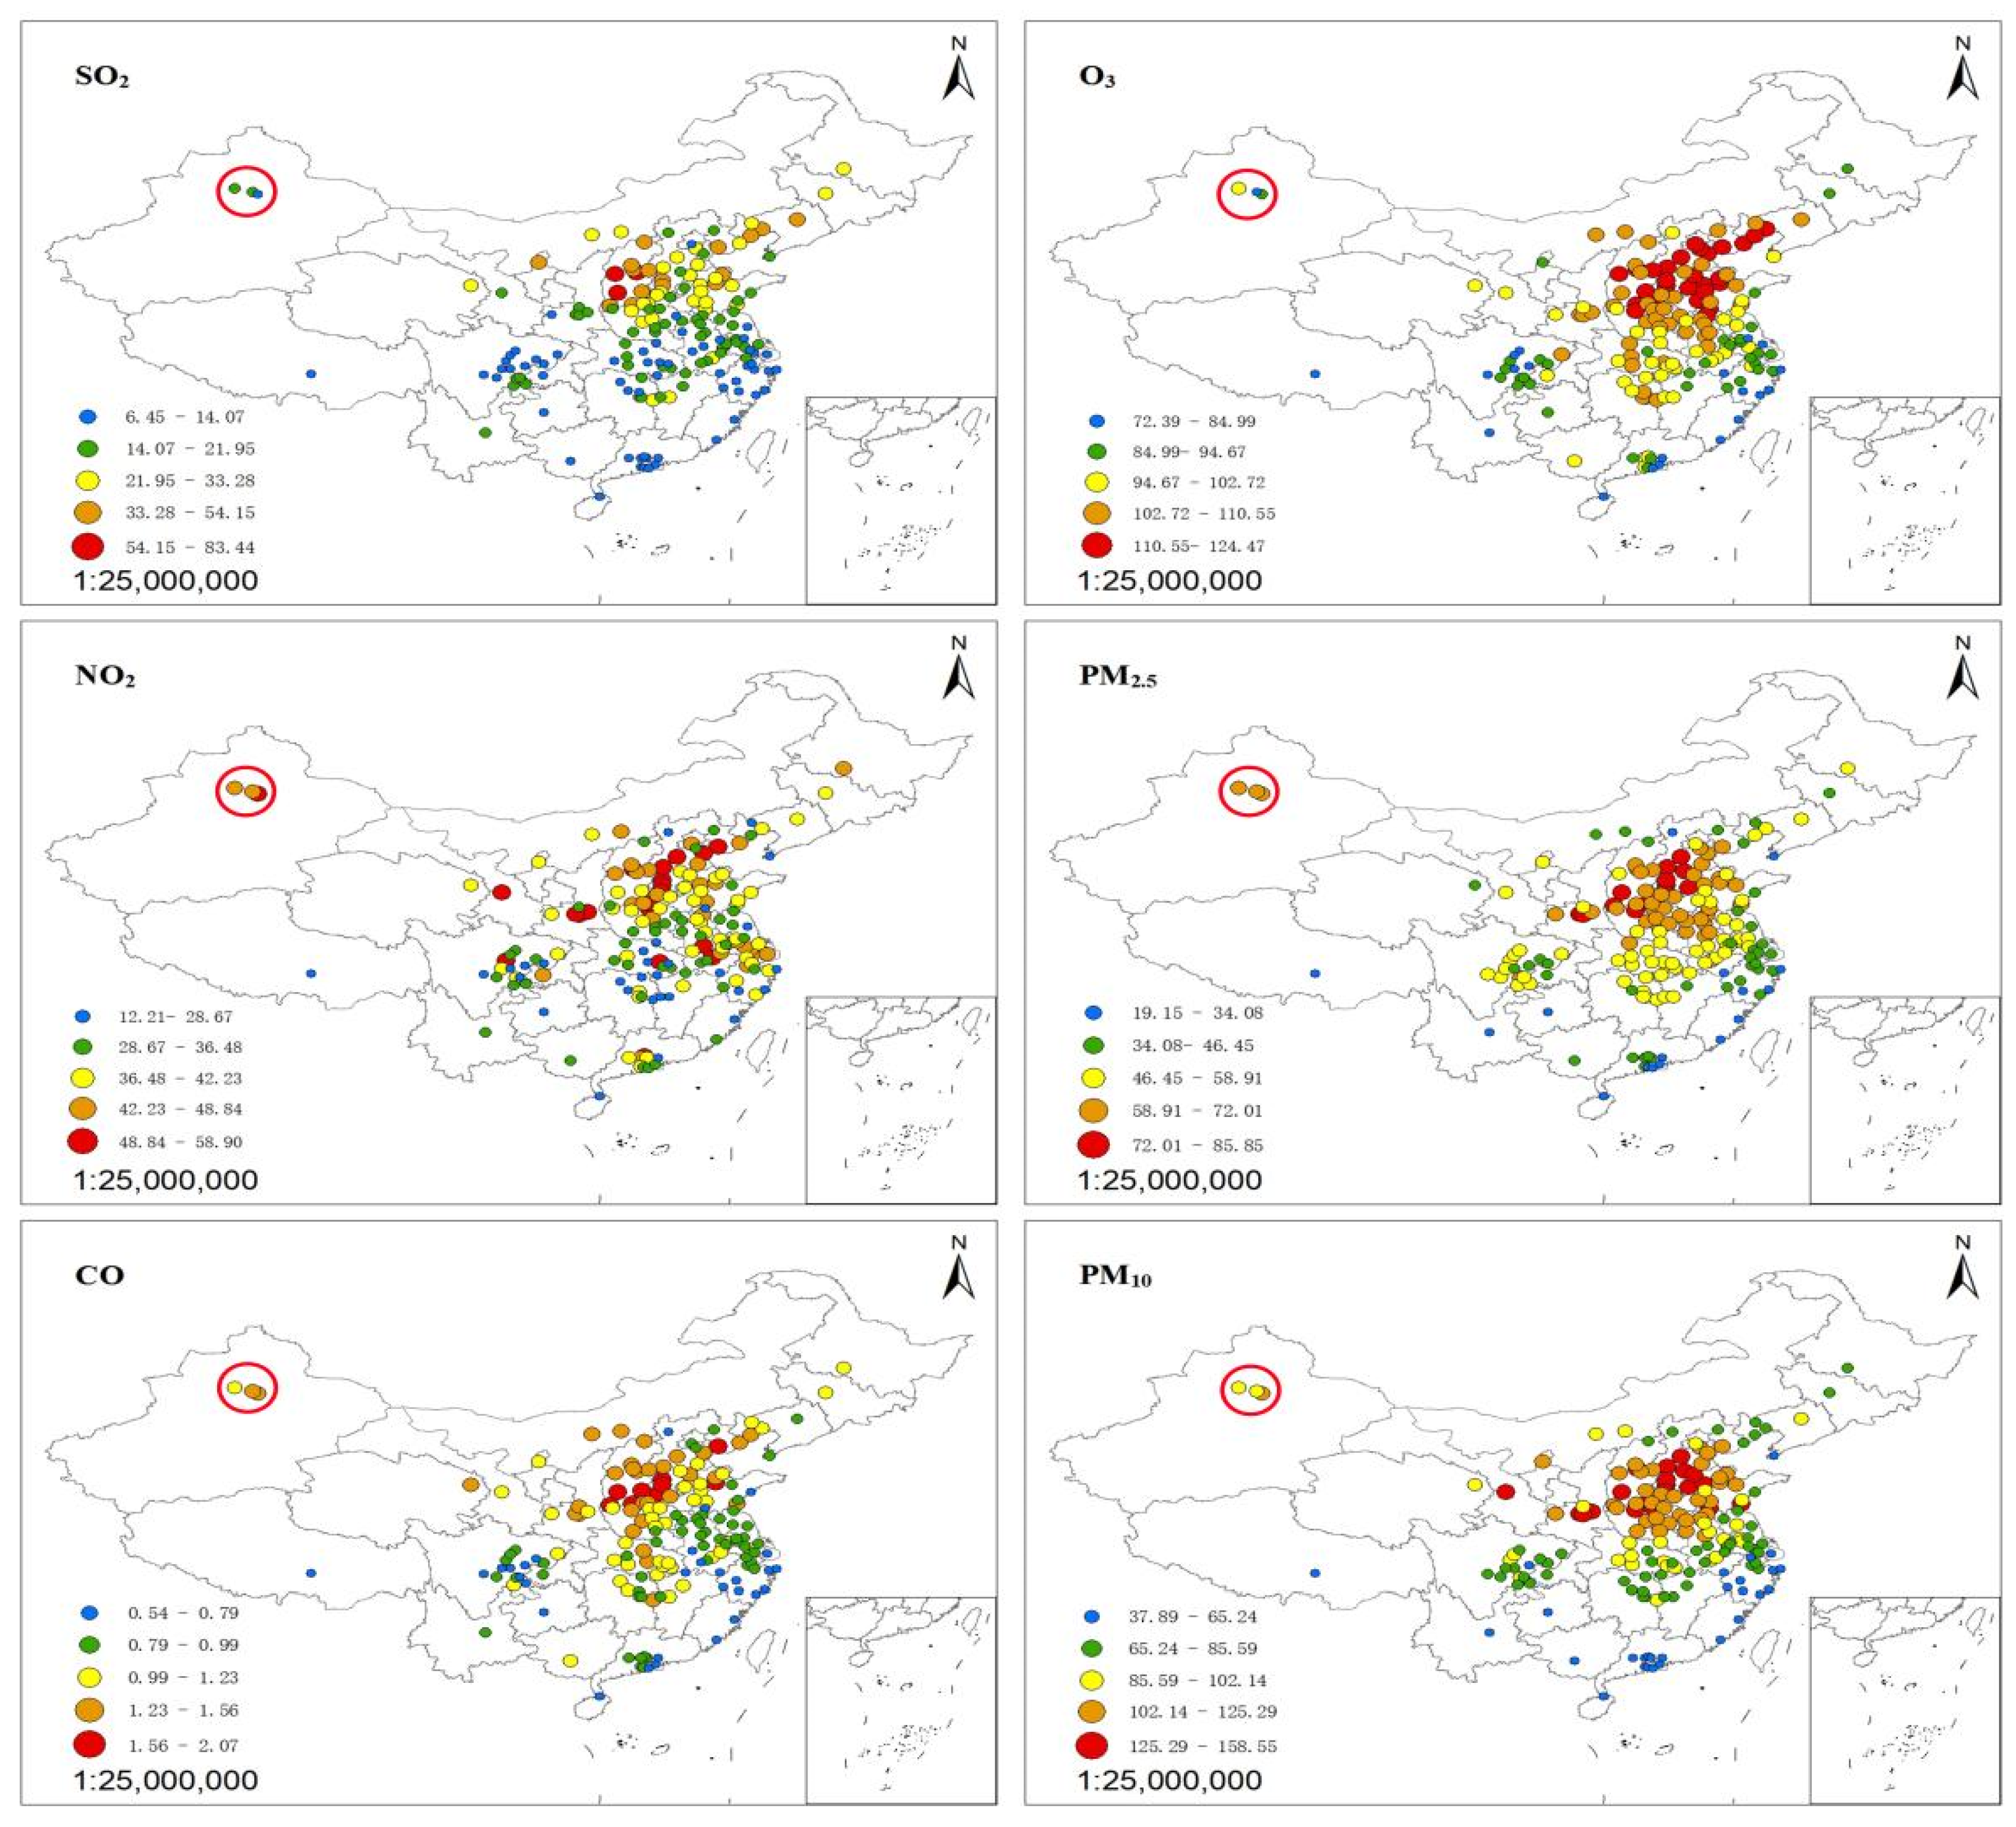
3.6. Comparisons with Other Chinese Cities
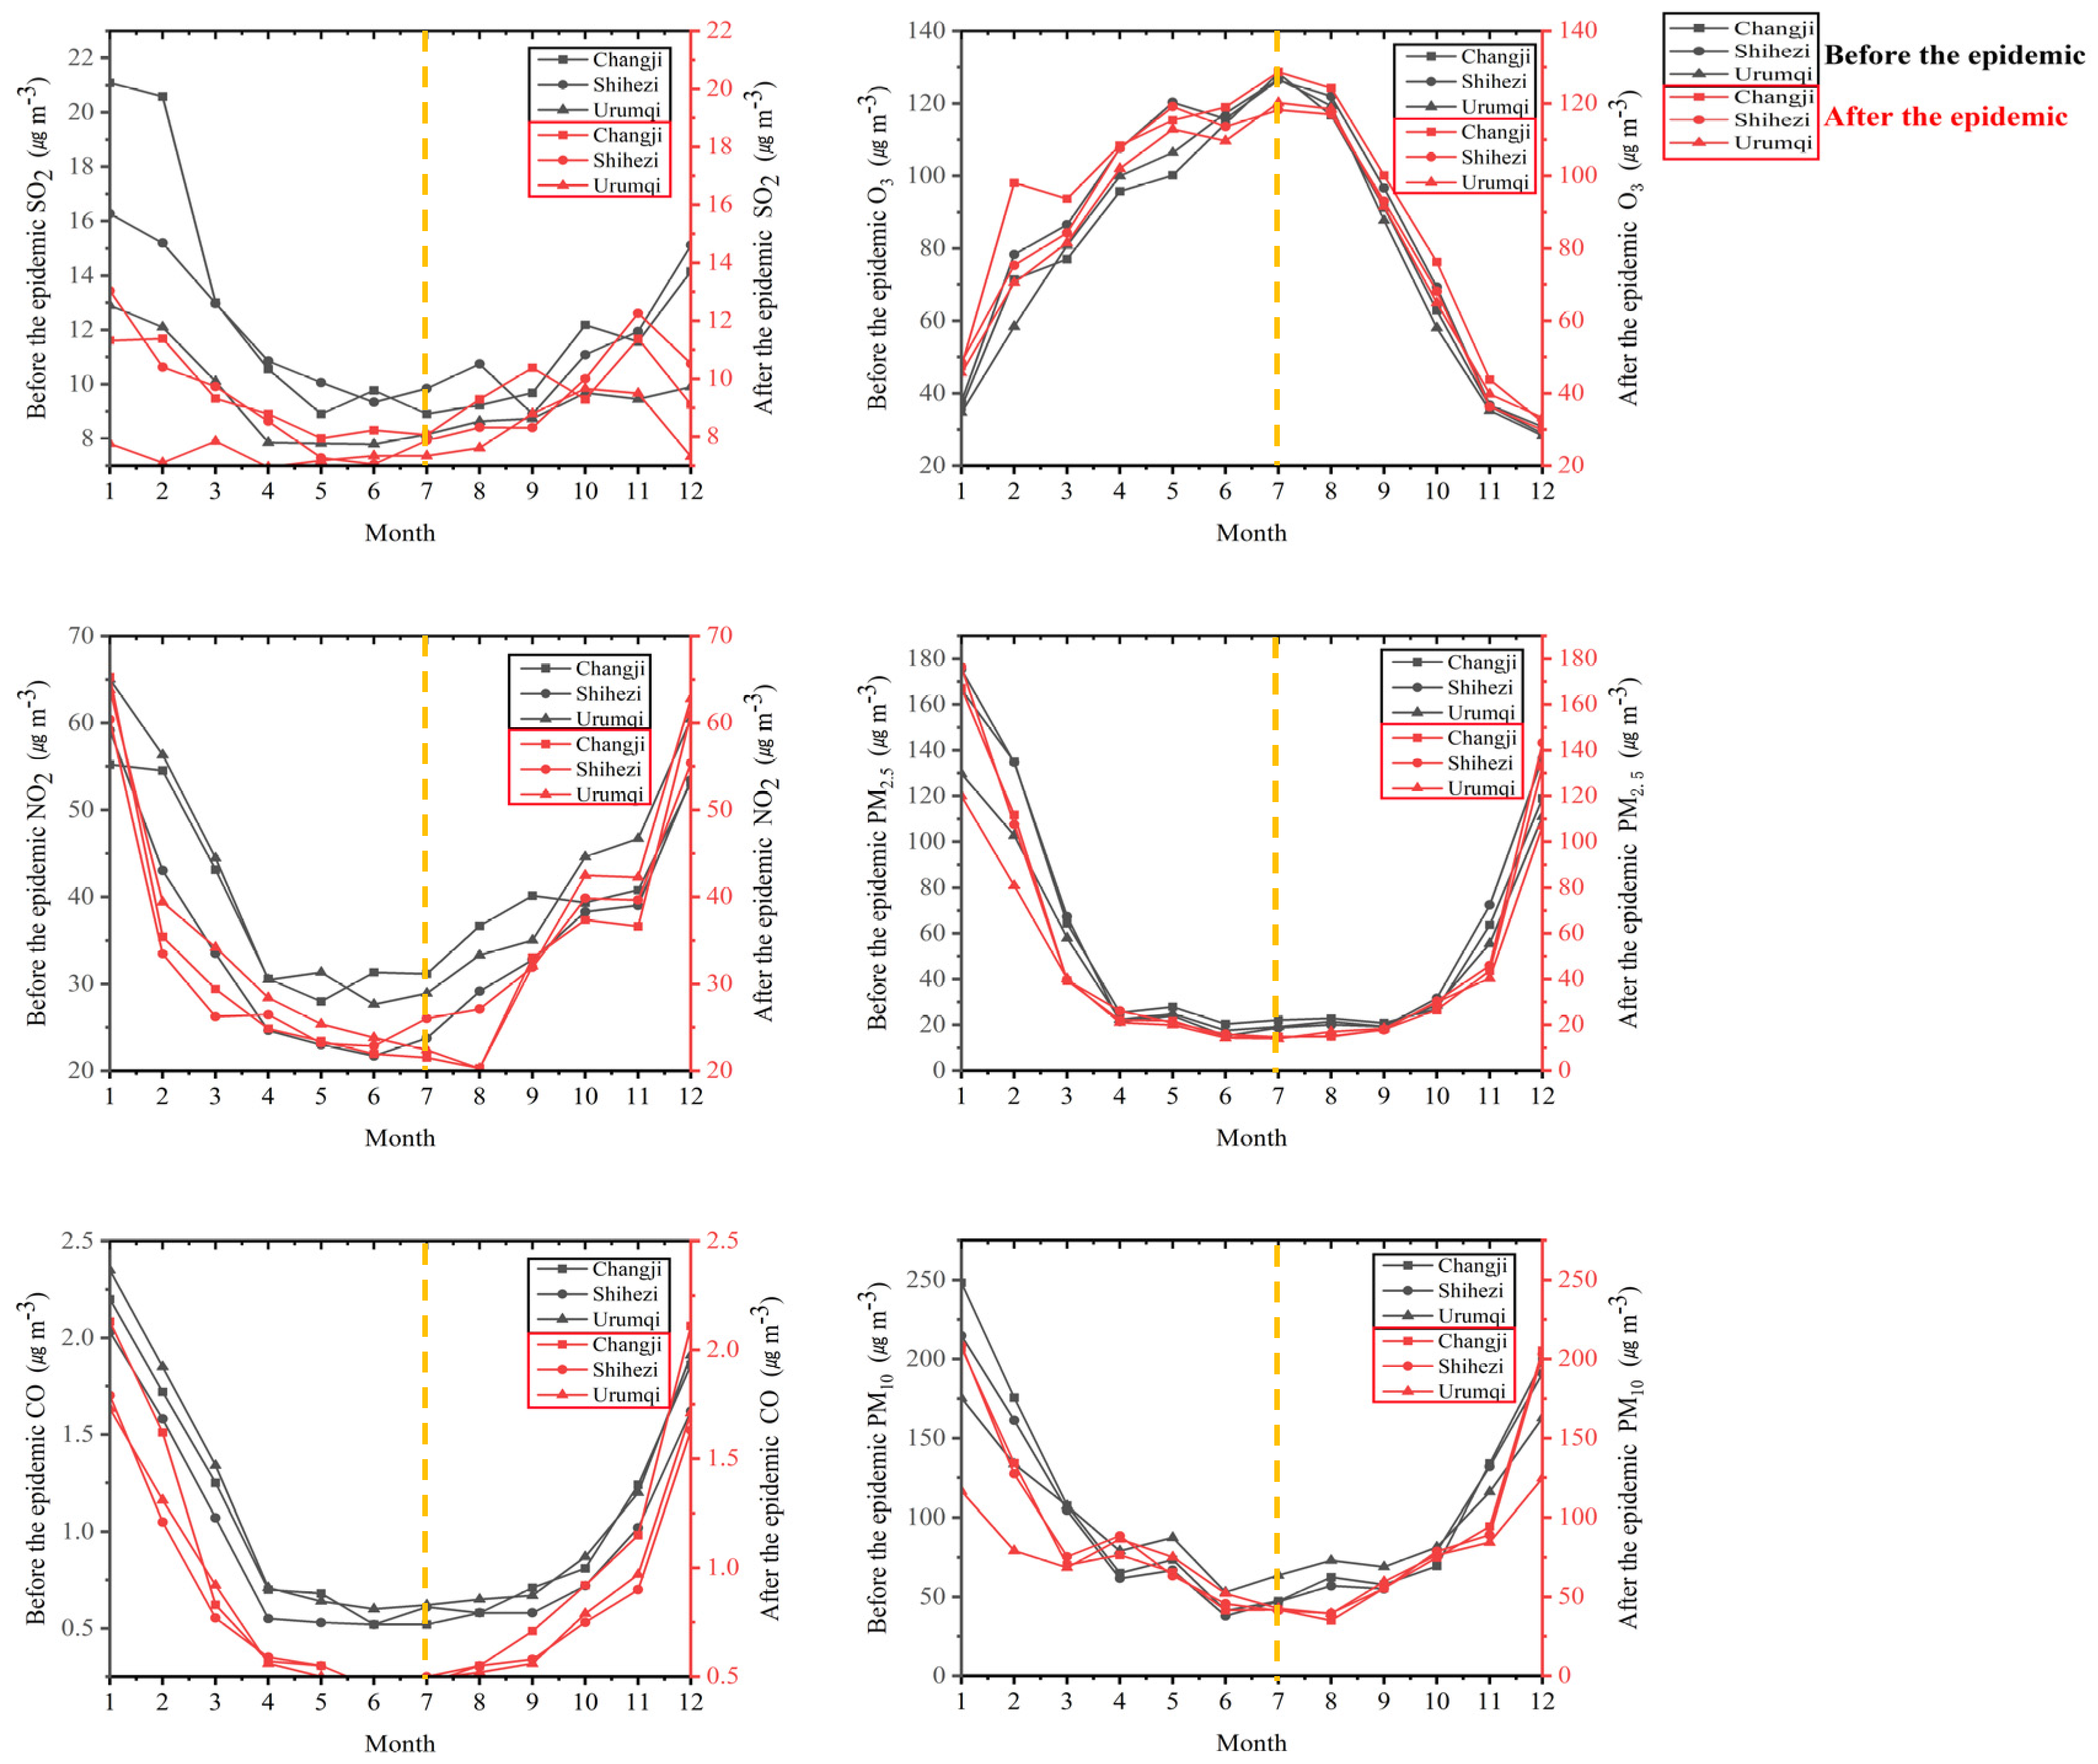
3.7. Characteristics of Changes in Air Pollutant Concentrations before and after the New Coronary Pneumonia Outbreak
4. Conclusions
Supplementary Materials
Author Contributions
Funding
Institutional Review Board Statement
Informed Consent Statement
Data Availability Statement
Acknowledgments
Conflicts of Interest
References
- Han, R.; Wang, S.; Shen, W.; Wang, J.; Wu, K.; Ren, Z.; Feng, M. Spatial and temporal variation of haze in China from 1961 to 2012. Environ. Sci. 2016, 46, 134–146. [Google Scholar] [CrossRef] [PubMed]
- Song, M.-Y.; Li, Z.-Q.; Xia, D.-S.; Jin, S.; Zhang, X. Isotopic evidence for the moisture origin and influencing factors at Urumqi Glacier No.1 in upstream Urumqi River Basin, eastern Tianshan Mountains. J. Mt. Sci. 2019, 16, 1802–1815. [Google Scholar] [CrossRef]
- IPCC. Climate Change: The Physical Science Basis. Contribution of Workinggroup I to the Fourth Assessment Report of the Intergovernmental Panel Onclimate Change. Master’s Thesis, Cambridge University, Cambridge, UK, University Press, Cambridge, UK, 2007. [Google Scholar]
- Wang, Y.; Ying, Q.; Hu, J.; Zhang, H. Spatial and temporal variations of six criteria air pollutants in 31 provincial capital cities in China during 2013–2014. Environ. Int. 2014, 73, 413–422. [Google Scholar] [CrossRef] [PubMed]
- Lim, S.S.; Vos, T.; Flaxman, A.D.; Danaei, G.; Shibuya, K.; Adair-Rohani, H.; AlMazroa, M.A.; Amann, M.; Anderson, H.R.; Andrews, K.G.; et al. A comparative risk assessment of burden of disease and injuryattributable to 67 risk factors and risk factor clusters in 21 regions, 1990–2010: A systematic analysis for the global burden of disease study2010. Lancet 2013, 380, 2224–2260. [Google Scholar] [CrossRef] [Green Version]
- WHO. Public Health, Environmental and Social Determinants of Health (PHE). 2016. Available online: http://www.who.int/phe/health_topics/outdoorair/databases/en, (accessed on 5 April 2022).
- Zhang, Q.; Crooks, R. Toward an Environmentally Sustainable Future: Country Environmental Analysis of the People’s Republic of China. Adb Reports. 2014. Available online: http://www.adb.org/sites/default/files/pub/2012/toward-environmentally-sustainable-future-prc.pdf (accessed on 5 April 2022).
- Yu, X.; Lü, R.; Liu, C.; Yuan, L.; Shao, Y.; Zhu, B.; Lei, L. Seasonal variation of columnar aerosol optical properties and radiative forcing over Beijing, China. Atmos. Environ. 2017, 166, 340–350. [Google Scholar] [CrossRef]
- Zhao, S.; Yu, Y.; Yin, D.; Qin, D.; He, J.; Dong, L. Spatial patterns and temporal variations of six criteria air pollutants during 2015 to 2017 in the city clusters of Sichuan Basin, China. Sci. Total Environ. 2018, 624, 540–557. [Google Scholar] [CrossRef]
- Forouzanfar, M.H.; Afshin, A.; Alexander, L.T.; Anderson, H.R.; Bhutta, Z.A.; Biryukov, S.; Brauer, M.; Burnett, R.; Cercy, K.; Charlson, F.J.; et al. Global, regional, and national comparative risk assessment of 79 behavioural, environmental and occupational, and metabolic risks or clusters of risks, 1990–2015: A systematic analysis for the global burden of disease Study 2015. Lancet 2016, 388, 1659–1724. [Google Scholar] [CrossRef] [Green Version]
- Landrigan, P.J. Air pollution and health. Lancet Public Health 2016, 2, e4–e5. [Google Scholar] [CrossRef] [Green Version]
- Kumar, P.; Morawska, L.; Birmiliw, W.; Paasonen, P.; Hu, M.; Kulmala, M.; Harrison, R.M.; Norford, L.; Britter, R. Ultrafine particles in cities. Environ. Int. 2014, 66, 1–10. [Google Scholar] [CrossRef] [Green Version]
- Chai, F.; Gao, J.; Chen, Z.; Wang, S.; Zhang, Y.; Zhang, J.; Zhang, H.; Yun, Y.; Ren, C. Spatial and temporal variation of particulate matter and gaseous pollutants in 26 cities in China. J. Environ. Sci. 2014, 26, 75–82. [Google Scholar] [CrossRef]
- Zhang, Y.H.; Hu, M.; Zhong, L.J.; Wiedensohler, A.; Liu, S.C.; Andreae, M.O.; Wang, W.; Fan, S. Regional integrated experiments on air quality over Pearl RiverDelta 2004 (PRIDE-PRD2004): Overview. Atmos. Environ. 2008, 42, 6157–6173. [Google Scholar] [CrossRef]
- Wang, H.; An, J.; Cheng, M.; Shen, L.; Zhu, B.; Li, Y.; Wang, Y.; Duan, Q.; Sullivan, A.; Xia, L. One year online measurements of water-soluble ions at the industrially polluted town of Nanjing, China: Sources, seasonal and diurnal variations. Chemosphere 2016, 148, 526–536. [Google Scholar] [CrossRef] [PubMed]
- Liao, T.; Wang, S.; Ai, J.; Gui, K.; Duan, B.; Zhao, Q.; Zhang, X.; Jiang, W.; Sun, Y. Heavy pollution episodes, transport pathways and potential sources of PM2.5, during the winter of 2013 in Chengdu (China). Sci. Total Environ. 2017, 584–585, 1056–1065. [Google Scholar] [CrossRef] [PubMed]
- Mao, M.; Zhang, X.; Yin, Y. Particulate matter and gaseous pollutions in three metropolises along the Chinese Yangtze River: Situation and implications. Int. J. Environ. Res. Public Health 2018, 15, 1102. [Google Scholar] [CrossRef] [PubMed] [Green Version]
- Ta, W.; Wang, T.; Xiao, H.; Zhu, X.; Xiao, Z. Gaseous and particulateair pollution in the Lanzhou Valley, China. Sci. Total Environ. 2004, 320, 163–176. [Google Scholar] [CrossRef] [PubMed]
- Zheng, H.; Kong, S.; Chen, N.; Yan, Y.; Liu, D.; Zhu, B.; Xu, K.; Cao, W.; Ding, Q.; Lan, B.; et al. Significant changes in the chemical compositions and sources of PM2.5 inWuhan since the city lockdown as COVID-19. Sci. Total Environ. 2020, 739, 140000. [Google Scholar] [CrossRef]
- Faridi, S.; Yousefian, F.; Niazi, S.; Ghalhari, M.R.; Hassanvand, M.S.; Naddafi, K. Impact of SARS-CoV-2 on ambient air particulate matter in Tehran. Aerosol Air Qual. Res. 2020, 20. [Google Scholar] [CrossRef]
- Wang, C.; Horby, P.W.; Hayden, F.G.; Gao, G.F. A novel coronavirus outbreak of global health concern. Lancet 2020, 395, 470–473. [Google Scholar] [CrossRef] [Green Version]
- Chu, B.; Zhang, S.; Liu, J.; Ma, Q.; He, H. Significant concurrent decrease in PM2.5 and NO2 concentrations in China during COVID-19 epidemic. J. Environ. Sci. 2020, 99, 346–353. [Google Scholar] [CrossRef]
- Wang, S.; Zhang, Y.; Ma, J.; Zhu, S.; Shen, J.; Wang, P.; Zhang, H. Responses of decline in air pollution and recovery associated with COVID-19 lockdown in the Pearl River Delta. Sci. Total Environ. 2021, 756, 143868. [Google Scholar] [CrossRef]
- Shen, F.; Zhang, L.; Jiang, L.; Tang, M.; Gai, X.; Chen, M.; Ge, X. Temporal variations of six ambient criteria air pollutants from 2015 to 2018, their spatial distributions, health risks and relationships with socioeconomic factors during 2018 in China. Environ. Int. 2020, 137, 105556. [Google Scholar] [CrossRef]
- Rupakheti, D.; Yin, X.; Rupakheti, M.; Zhang, Q.; Li, P.; Rai, M.; Kang, S. Spatio-temporal characteristics of air pollutants over Xinjiang, northwestern China. Environ. Pollut. 2021, 268, 115907. [Google Scholar] [CrossRef] [PubMed]
- Shen, Y.; Zhang, L.; Fang, X.; Ji, H.; Li, X.; Zhao, Z. Spatiotemporal patterns of recent PM2.5 concentrations over typical urban agglomerations in China. Sci. Total Environ. 2019, 655, 13–26. [Google Scholar] [CrossRef] [PubMed]
- Zhou, T.C.; Sun, J.; Yu, H. Temporal and spatial patterns of China’s main air pollutants: Years 2014 and 2015. Atmosphere 2017, 8, 137. [Google Scholar] [CrossRef] [Green Version]
- Xie, Y.; Zhao, B.; Zhang, L.; Luo, R. Spatiotemporal variations of PM2.5 and PM10 concentrations between 31 Chinese cities and their relationships with SO2, NO2, CO, and O3. Particuology 2015, 20, 141–149. [Google Scholar] [CrossRef]
- Zhao, S.; Yu, Y.; Yin, D.; He, J.; Liu, N.; Qu, J.; Xiao, J. Annual and diurnal variations of gaseous and particulate pollutants in 31 provincial capital cities based on in situ air quality monitoring data from China National Environmental Monitoring Center. Environ. Int. 2016, 86, 92–106. [Google Scholar] [CrossRef]
- Zhou, X.; Zhang, T.; Li, Z.; Tao, Y.; Wang, F.; Zhang, X.; Xu, C.; Ma, S.; Huang, J. Particulate and gaseous pollutants in a petrochemical industrialized valley city, Western China during 2013–2016. Environ. Sci. Pollut. Res. 2018, 25, 15174–15190. [Google Scholar] [CrossRef]
- Draxler, R.R.; Stunder, B.; Rolph, G.; Stein, A.; Taylor, A.; Zinn, S.; Loughner, C.; Crawford, A. HYSPLIT 4 Users Guide [EB/OL]. [23-05-2018]. NOAA Tech Mem Air Resources Laboratory, 2018–02. Available online: https://www.arl.noaa.gov/documents/reports/hysplit_user_guide.pdf (accessed on 3 December 2022).
- Bagheri, R.; Bagheri, F.; Karami, G.H.; Jafari, H. Chemo-isotopes (18O&2H) signatures and HYSPLIT model application: Clues to the atmospheric moisture and air mass origins. Atmos. Environ. 2019, 215, 116892. [Google Scholar]
- Ahmad, P.; Zahra, K.; Peyman, D. Atmospheric dispersion assessment of radioactive materials during severe accident conditions for Bushehr nuclear power plant using HYSPLIT code. Prog. Nucl. Energy 2018, 108, 169–178. [Google Scholar]
- Bilinska, D.; Skjoth, C.; Werner, M.; Kryza, M.; Malkiewicz, M.; Krynicka, J.; Drzeniecka-Osiadacz, A. Source regions of ragweed pollen arriving in south-western Poland and the influence of meteorological data on the HYSPLIT model results. Aerobiologia 2017, 33, 315–326. [Google Scholar] [CrossRef] [Green Version]
- Wang, Y.Q. MeteoInfo: GIS software for meteorological data visualization and analysis. Meteorol. Appl. 2014, 21, 360–368. [Google Scholar] [CrossRef]
- Wang, Y.Q.; Zhang, X.Y.; Draxler, R.R. TrajStat: GIS-based software that uses various trajectory statistical analysis methods to identify potential sources from long-term air pollution measurement Data. Environ. Model. Softw. 2009, 24, 938–939. [Google Scholar] [CrossRef]
- Draxler, R.R.; Hess, G.D. An overview of the hysplit-4 modeling system for trajectories. Aust. Meteorol. Mag. 1998, 47, 295–308. [Google Scholar]
- Stein, A.F.; Draxler, R.R.; Rolph, G.D.; Stunder, B.J.B.; Cohen, M.D.; Ngan, F. NOAA’s HYSPLIT atmospheric transport and dispersion modeling system. Bull. Am. Meteorol. Soc. 2015, 96, 2059–2077. [Google Scholar] [CrossRef]
- Borge, R.; Lumbreras, J.; Vardoulakis, S.; Kassomenos, P.; Rodrigues, E. Analysis of long-range transport influences on urban PM10 using two-stage atmospheric trajectory clusters. Atmos. Environ. 2007, 41, 4434–4450. [Google Scholar] [CrossRef]
- Li, M.; Huang, X.; Zhu, L.; Li, J.; Song, Y.; Cai, X.; Xie, S. Analysis of the transport pathways and potential sources of PM10 in Shanghai based on three methods. Sci. Total Environ. 2012, 414, 525e534. [Google Scholar] [CrossRef]
- Begum, B.A.; Kim, E.; Jeong, C.H.; Lee, D.-W.; Hopke, P.K. Evaluation of the potential source contribution function using the 2002 Quebec forest fire episode. Atmos. Environ. 2005, 39, 3719–3724. [Google Scholar] [CrossRef]
- Salvador, P.; Artinano, B.; Alonso, D.G.; Querol, X.; Alastuey, A. Identification and characterization of sources of PM10 in Madrid (Spain) by statistical methods. Atmos. Environ. 2004, 38, 435–447. [Google Scholar] [CrossRef]
- Tian, M.; Wang, H.; Chen, Y.; Yang, F.M.; Zhang, X.H.; Zou, Q.; Zhang, R.Q.; Ma, Y.L.; He, K.B. Characteristics of aerosol pollution during heavy haze events in Suzhou, China. Atmos. Phys. 2016, 16, 7357–7371. [Google Scholar] [CrossRef] [Green Version]
- Zeng, Y.; Hopke, P. A study of the sources of acid precipitation in Ontario, Canada. Atmos. Environ. 1989, 23, 1499–1509. [Google Scholar] [CrossRef]
- Xu, X.; Akhtar, U.S. Identification of potential regional sources of atmospheric total gaseous mercury in Windsor, Ontario, Canada using hybrid receptor modeling. Atmos. Chem. Phys. 2010, 10, 7073–7083. [Google Scholar] [CrossRef] [Green Version]
- Polissara, V.; Hopke, P.K.; Harris, J.M. Source regions for atmospheric aerosol measured at Barrow, Alaska. Environ. Sci. Technol. 2001, 35, 4214–4226. [Google Scholar] [CrossRef] [PubMed]
- Liu, N.; Ye, Y.; He, J.J.; Zhao, S. Integrated modeling of urban-scale pollutant transport: Application in a Semi-arid urban Valley, Northwestern China. Atmos. Pollut. Res. 2013, 4, 306–314. [Google Scholar] [CrossRef]
- Seibert, P.; Kromp-Kolb, H.; Baltensperger, U.; Jost, D.T.; Schwikowski, M.; Kasper, A.; Puxbaum, H. Trajectory analysis of aerosol measurements at high alpine sites. Acad. Publ. 1994, 15, 689–693. [Google Scholar]
- Stohl, A. Trajectory statistics: A new method to establish source-receptor relationships of air pollutants and its application to the transport of particulate sulfate in Europe. Atmos. Environ. 1996, 30, 579–587. [Google Scholar] [CrossRef]
- Liu, Z.; Hu, B.; Wang, L.; Wu, F.; Gao, W.; Wang, Y. Seasonal and diurnal variation in particulate matter (PM10 and PM2.5) at an urban site of Beijing: Analyses from a 9-year study. Environ. Sci. Pollut. Res. Int. 2015, 22, 627–642. [Google Scholar] [CrossRef]
- Wang, F.; Li, Z.; Wang, F.; You, X.; Xia, D.; Zhang, X.; Zhou, X. Air Pollution in a Low-Industry City in China’s Silk Road Economic Belt: Characteristics and Potential Sources. Front. Earth Sci. 2021, 9, 527475. [Google Scholar] [CrossRef]
- Jianjun, H.; Sunling, G.; Ye, Y.; Lijuan, Y.; Lin, W.; Hongjun, M.; Congbo, S.; Suping, Z.; Hongli, L.; Xiaoyu, L.; et al. Air pollution characteristics and their relation to meteorological conditions during 2014–2015 in major Chinese cities. Environ. Pollut. 2017, 223, 484–496. [Google Scholar]
- Wang, P.F.; Chen, K.Y.; Zhu, S.Q.; Wang, P.; Zhang, H.L. Severe air pollutionevents not avoided by reduced anthropogenic activities during COVID-19 outbreak. Resour. Conserv. Recycl. 2020, 158, 104814. [Google Scholar] [CrossRef]
- Venter Zander, S.; Aunan, K.; Chowdhury, S.; Lelieveld, J. COVID-19 lockdowns cause global air pollution declines. Proc. Natl. Acad. Sci. USA 2020, 117, 18984–18990. [Google Scholar] [CrossRef]
- Huang, Q.; Cheng, S.; Perozzi, R.E. Use of a MM5–CAMx–PSAT Modeling System to Study SO2 Source Apportionment in the Beijing Metropolitan Region. Environ. Model. Assess. 2012, 17, 527–538. [Google Scholar] [CrossRef]
- Zhang, R.X.; Zhang, Y.Z.; Lin, H.P.; Feng, X.; Fu, T.M.; Wang, Y.H. NOx emissionreduction and recovery during COVID-19 in East China. Atmosphere 2020, 11, 433. [Google Scholar] [CrossRef]


| City | Pollutants Species | 2017 | 2018 | 2019 | 2020 | 2021 |
|---|---|---|---|---|---|---|
| Mean ± SD | Mean ± SD | Mean ± SD | Mean ± SD | Mean ± SD | ||
| Changji | AQI | 103.52 ± 60.30 | 105.03 ± 53.81 | 95.28 ± 47.29 | 96.52 ± 54.49 | 97.66 ± 45.90 |
| SO2 | 18.09 ± 12.98 | 14.41 ± 5.63 | 10.52 ± 3.01 | 8.48 ± 2.39 | 10.60 ± 2.47 | |
| NO2 | 45.24 ± 13.27 | 43.29 ± 11.67 | 37.36 ± 7.23 | 32.61 ± 16.56 | 35.72 ± 12.83 | |
| CO | 1.33 ± 0.68 | 1.16 ± 0.64 | 0.97 ± 0.50 | 0.93 ± 0.64 | 1.08 ± 0.56 | |
| O3 | 83.43 ± 30.38 | 82.03 ± 32.77 | 77.85 ± 32.06 | 89.28 ± 31.39 | 91.86 ± 32.58 | |
| PM10 | 98.49 ± 68.39 | 114.52 ± 67.07 | 98.87 ± 64.66 | 91.45 ± 64.53 | 92.19 ± 53.93 | |
| PM2.5 | 67.29 ± 57.62 | 61.45 ± 52. 48 | 57.66 ± 48.00 | 52.79 ± 55.22 | 51.75 ± 49.60 | |
| Shihezi | AQI | 109.27 ± 53.17 | 105.32 ± 55.21 | 103.73 ± 53.31 | 97.82 ± 59.02 | 96.97 ± 47.57 |
| SO2 | 15.25 ± 4.86 | 11.84 ± 2.64 | 11.88 ± 2.21 | 9.63 ± 2.20 | 9.25 ± 1.98 | |
| NO2 | 42.80 ± 17.71 | 33.71 ± 13.62 | 36.53 ± 9.94 | 32.87 ± 12.72 | 35.88 ± 11.87 | |
| CO | 1.15 ± 0.63 | 0.99 ± 0.52 | 0.91 ± 0.51 | 0.85 ± 0.45 | 0.86 ± 0.42 | |
| O3 | 101.39 ± 42.04 | 86.78 ± 35.31 | 84.50 ± 32.94 | 84.40 ± 30.06 | 84.07 ± 33.25 | |
| PM10 | 102.14 ± 74.29 | 101.42 ± 62.59 | 99.87 ± 57.79 | 94.29 ± 59.88 | 91.72 ± 53.78 | |
| PM2.5 | 61.87 ± 56.71 | 61.23 ± 55.00 | 61.44 ± 55.81 | 55.44 ± 59.06 | 53.43 ± 48.88 | |
| Urumqi | AQI | 108.14 ± 64.97 | 97.98 ± 36.85 | 90.03 ± 34. 82 | 87.68 ± 41.98 | 81.59 ± 24.97 |
| SO2 | 13.26 ± 6.42 | 10.54 ± 2.31 | 8.31 ± 1.17 | 8.52 ± 0.91 | 7.21 ± 1.08 | |
| NO2 | 48.69 ± 17.83 | 42.83 ± 12.80 | 41.22 ± 12.65 | 35.52 ± 16.37 | 37.34 ± 12.11 | |
| CO | 1.38 ± 0.76 | 1.20 ± 0.64 | 1.04 ± 0.56 | 0.94 ± 0.52 | 0.81 ± 0.39 | |
| O3 | 71.77 ± 30.82 | 79.70 ± 34. 28 | 79.09 ± 34.23 | 80.45 ± 30.05 | 84.58 ± 30.83 | |
| PM10 | 112.80 ± 59.41 | 113.37 ± 45.76 | 86.87 ± 33.65 | 79.00 ± 31.81 | 71.87 ± 21.90 | |
| PM2.5 | 68.99 ± 63.54 | 52.65 ± 39.92 | 49.01 ± 39.38 | 47.34 ± 43.30 | 39.74 ± 30.98 |
| City | Pollutant Species (Annually Average ± SD) | ||||||
|---|---|---|---|---|---|---|---|
| AQI | SO2 | NO2 | CO | O3 | PM10 | PM2.5 | |
| Changji | 99.60 ± 52.76 | 12.42 ± 7.48 | 38.48 ± 13.53 | 1.09 ± 0.62 | 84.89 ± 32.25 | 99.10 ± 64.46 | 58.19 ± 53.01 |
| Shihezi | 102.62 ± 53.98 | 11.57 ± 3.66 | 36.36 ± 13.87 | 0.95 ± 0.52 | 88.23 ± 35.63 | 97.89 ± 62.14 | 58.68 ± 55.31 |
| Urumqi | 93.08 ± 43.28 | 9.57 ± 3.81 | 41.12 ± 15.25 | 1.07 ± 0.62 | 79.12 ± 32.36 | 92.78 ± 44.12 | 51.55 ± 45.79 |
| City | Air Mass Type | Frequency% | ρ */(μg m−3) | ρ */(μg m−3) | ||||
|---|---|---|---|---|---|---|---|---|
| PM2.5 | Stdev | Num | PM10 | Stdev | Num | |||
| Changji | 1 | 60.07 | 170.32 | 64.41 | 499 | 226.06 | 94.38 | 554 |
| 2 | 20.06 | 155.67 | 66.86 | 144 | 193.83 | 9395 | 168 | |
| 3 | 18.75 | 161.53 | 66.05 | 158 | 201.83 | 90.61 | 175 | |
| 4 | 1.12 | 176.44 | 62.72 | 9 | 304.90 | 273.33 | 10 | |
| Shihezi | 1 | 21.08 | 176.94 | 68.44 | 285 | 210.88 | 89.74 | 304 |
| 2 | 36.01 | 194.81 | 79.43 | 210 | 227.07 | 106.04 | 230 | |
| 3 | 10.73 | 180.11 | 78.65 | 98 | 212.57 | 109.79 | 106 | |
| 4 | 16.23 | 140.50 | 5564 | 8 | 319.90 | 334.52 | 10 | |
| 5 | 15.95 | 172.71 | 65.78 | 224 | 201.37 | 84.85 | 252 | |
| Urumqi | 1 | 38.62 | 152.37 | 51.75 | 301 | 157.40 | 57.31 | 305 |
| 2 | 16.88 | 131.84 | 40.17 | 104 | 137.03 | 43.25 | 98 | |
| 3 | 33.40 | 136.04 | 42.42 | 247 | 156.33 | 59.53 | 260 | |
| 4 | 11.10 | 145.89 | 53.76 | 66 | 153.94 | 73.13 | 66 | |
Disclaimer/Publisher’s Note: The statements, opinions and data contained in all publications are solely those of the individual author(s) and contributor(s) and not of MDPI and/or the editor(s). MDPI and/or the editor(s) disclaim responsibility for any injury to people or property resulting from any ideas, methods, instructions or products referred to in the content. |
© 2022 by the authors. Licensee MDPI, Basel, Switzerland. This article is an open access article distributed under the terms and conditions of the Creative Commons Attribution (CC BY) license (https://creativecommons.org/licenses/by/4.0/).
Share and Cite
Chen, Z.; Li, Z.; Xu, L.; Zhou, X.; Zhang, X.; Wang, F.; Luo, Y. Gaseous and Particulate Pollution in the Wu-Chang-Shi Urban Agglomeration on the Northern Slope of Tianshan Mountains from 2017 to 2021. Atmosphere 2023, 14, 91. https://doi.org/10.3390/atmos14010091
Chen Z, Li Z, Xu L, Zhou X, Zhang X, Wang F, Luo Y. Gaseous and Particulate Pollution in the Wu-Chang-Shi Urban Agglomeration on the Northern Slope of Tianshan Mountains from 2017 to 2021. Atmosphere. 2023; 14(1):91. https://doi.org/10.3390/atmos14010091
Chicago/Turabian StyleChen, Zhi, Zhongqin Li, Liping Xu, Xi Zhou, Xin Zhang, Fanglong Wang, and Yutian Luo. 2023. "Gaseous and Particulate Pollution in the Wu-Chang-Shi Urban Agglomeration on the Northern Slope of Tianshan Mountains from 2017 to 2021" Atmosphere 14, no. 1: 91. https://doi.org/10.3390/atmos14010091