Article

Influence of Madden–Julian Oscillation on Precipitation over the Tibetan Plateau in Boreal Summer

1
State Key Laboratory of Severe Weather, Institute of Tibetan Plateau Meteorology, Chinese Academy of Meteorological Sciences, Beijing 100081, China
2
Collaborative Innovation Center on Forecast and Evaluation of Meteorological Disasters (CIC-FEMD), Nanjing University of Information Science and Technology, Nanjing 210044, China
3
Department of Atmospheric and Oceanic Sciences and Institute of Atmospheric Sciences, Fudan University, Shanghai 200438, China
*
Author to whom correspondence should be addressed.
Atmosphere 2023, 14(1), 70; https://doi.org/10.3390/atmos14010070
Submission received: 27 November 2022 / Revised: 10 December 2022 / Accepted: 27 December 2022 / Published: 30 December 2022
(This article belongs to the Special Issue Climate Extremes in China)

Abstract

:
The influence of the Madden–Julian oscillation (MJO) on precipitation over the Tibetan Plateau (TP) during boreal summer is investigated using observational and reanalysis data during 1980–2020. The results show that summer precipitation over most areas of the eastern TP increases (decreases) in MJO Phases 1–2 (5–6), especially when the eastward-propagating MJO active convection is located over the Indian Ocean (Western Pacific) in Phase 2 (6). The most significant negative precipitation anomalies in Phase 4 (8) are located over the southern (northeastern) TP. Moreover, MJO has a relatively weakened effect on the TP summer precipitation in Phases 3 and 7 when its convection migrates to the eastern Indian Ocean and the western–central Pacific, respectively. The MJO-phase dependence of the TP summer precipitation anomalies is closely associated with the anomalous atmospheric circulation and evolution of the horizontal moisture flux convergence directly induced by MJO. When the MJO convection centers are located over the western Indian Ocean and the Pacific, high-level anticyclonic and low-level cyclonic anomalous circulations over the TP are excited. In contrast, when MJO locates over the Indian Ocean and the Maritime Continent, its diabatic heating can inspire high-level cyclonic and low-level anticyclonic circulation anomalies over the TP. The vertical motions and moisture transport from the Bay of Bengal caused by the MJO-excited large-scale circulation can modulate the TP summer precipitation. This study advances the understanding of the TP intraseasonal variability.

1. Introduction

The Madden–Julian oscillation (MJO) is the dominant mode of tropical atmospheric intraseasonal (20–100-day) variability [1,2,3]. It is a planetary-scale circulation–convection-coupled system existing in the troposphere, moving eastward, slowly, with a phase speed of approximately 5 m s−1 [4,5,6,7,8,9,10,11]. MJO plays an important role in modulating global weather and climate [12,13,14], such as typhoons [15], extreme precipitation [16,17,18,19], and the South China Sea summer monsoon onset [20], and has a close association with the El Nino–Southern oscillation (ENSO) [21,22,23,24].
Previous studies demonstrated that the intraseasonal variation in precipitation in different regions of Asia is closely associated with MJO [16,25,26,27,28,29]. For example, Xavier et al. [16] suggested that convectively active (suppressed) MJO phases increase (decrease) the probability of extreme rainfall events over Southeast Asia in November–March. Muhammad et al. [25] indicated that the horizontal moisture flux convergence induced by MJO leads to an increased (decreased) probability of extreme precipitation events in Indonesia. Zhang et al. [26] revealed that when the MJO deep convection is located over the Indian Ocean, the Rossby waves forced by MJO can propagate through the westerly waveguide to the southeastern China, causing higher-than-normal summer precipitation; when MJO is over the western Pacific, the northward shift of meridional circulation with anomalous descents to the north will weaken precipitation in situ. Jia et al. [27] reported that MJO can significantly influence the precipitation in South China during boreal winter. More specifically, in the subtropical region, MJO may influence the northward water vapor transport from the Bay of Bengal and South China Sea by modulating the south trough and the western Pacific subtropical high, while the far-reaching impacts of MJO on the middle–high latitudes come into being through exciting the tropical–extratropical teleconnections. Previous studies found that subseasonal precipitation variations over the southwestern China including the Tibetan Plateau (TP) may also be associated with MJO that regulates moist air source from the Bay of Bengal [28].
The TP is well known as the third pole of the world and the Asian water tower, and its precipitation plays a key role in energetic and hydrological cycles over Asia [30,31]. TP precipitation has profound seasonal and regional variations [32], and as previous studies have demonstrated, it is not only influenced by the intense thermal heating and topography of the TP but also by the large-scale circulation of the Asian monsoon and westerly jet [33,34,35,36]. Particularly, large-scale climate modes, such as ENSO, can influence the spatial distributions of precipitation over the TP [37,38,39].
However, the variations in the TP precipitation on the intraseasonal time scale and their possible associations with MJO have received less attention. Among a few previous works that mentioned the MJO–TP precipitation relation, Li et al. [40] suggested that the day-to-day variations in boreal winter TP precipitation show some MJO phase-dependent characterizations. They found that the TP rains more frequently than normal in MJO Phases 8–1, while in Phases 4–5, less-than-normal rainfall might be expected. Zhao et al. [41] showed that MJO can significantly influence the TP low vortex during boreal summer by adjusting mid-latitude atmospheric circulations, which are important in affecting TP summer precipitation. Ren and Shen [42] also mentioned that MJO may have some potential impacts on the TP precipitation.
Despite these previous studies, we note that the possible relation of the TP precipitation with MJO during boreal summer and the underlying mechanisms are still elusive. In this regard, we put forward the major scientific question to be addressed in this paper: To what extent and how the TP summer precipitation can be influenced by MJO? Following previous studies [26,27,28], we diagnose the atmospheric circulation and moisture transport processes in different MJO phases to understand the underlying mechanisms of MJO influencing the TP summer precipitation. The results will be reported in Section 3 after the introduction of data and methods in Section 2. We summarize and discuss our main results in Section 4.

2. Data and Methods

Daily precipitation observed from more than 2400 stations in China for the period of 1980–2020 was used in this study. This data product was provided by the National Meteorological Information Center of China Meteorological Administration and has been subjected to quality control to ensure accuracy. We select 91 stations over the TP for our study. Besides the station products, we also used daily gridded precipitation on a ¼° grid during 1980–2020 from the China regional grid observation dataset CN05.1. Daily outgoing longwave radiation (OLR) with a horizontal resolution of 2.5° × 2.5° during 1980–2020 from the National Oceanic and Atmospheric Administration was used as a proxy of convective activity in the tropics and subtropics [43]. The fifth generation of ECMWF reanalysis (ERA5) data [44] was used to describe the large-scale circulation characteristics, including zonal and meridional winds ( u and v ) and specific humidity ( q ), with a horizontal resolution of 1.5° × 1.5° and 37 pressure levels covering the period of 1980–2020. The original hourly data were further averaged to create the daily mean datasets.
The daily real-time multivariate MJO (RMM) index [45] from the Australian Bureau of Meteorology (http://www.bom.gov.au/climate/mjo/, accessed on 9 January 2022) was employed to describe the MJO characteristics and has been widely employed in operational predictions and scientific research [19,46,47,48,49]. The RMM index has two components (i.e., RMM1 and RMM2) that are derived by the multivariate empirical orthogonal function analysis of equatorially (15° S–15° N) averaged OLR and zonal winds at 850 and 200 hPa. Based on the RMM indices, one can divide the MJO life cycle into eight phases, which indicate that the MJO convective center propagates eastward along the equator from the Western Hemisphere and Africa (Phases 8, 1) to the Indian Ocean (IO; Phases 2, 3), the Maritime Continent (MC; Phases 4, 5) and the Western Pacific (WP; Phases 6, 7). A strong MJO is identified when the RMM amplitude ( RMM 1 2 + RMM 2 2 ) exceeds unit one. Otherwise, it is a weak MJO.
The daily anomalies of each field during 1980–2020 were obtained by removing the climatological annual cycle and its first four harmonics. We analyzed the boreal summer season from June to August (JJA) when the convective center of MJO shifts northward and likely affects the TP precipitation more than in other seasons. Phase composite techniques [50,51] were used here to represent the MJO phase-dependent evolution of large-scale convection and circulation. Two-tailed Student’s t-test at the 95% confidence level was adopted to evaluate the significance of composite results by comparing against the climatological mean.
In addition, we used the RMM indices to perform a bilinear regression analysis to analyze the contribution of MJO to the TP summer precipitation. Let y be the raw precipitation anomalies and y ^ be the regressed precipitation anomalies against the RMM indices. Then, we derive the complex correlation coefficient R between y ^ and y as follows:
R = i = 1 n y i y ¯ y ^ i y ¯ i = 1 n y i y ¯ 2 i = 1 n y ^ i y ¯ 2  
where y ¯ is the time mean of y and i denotes the time (in days).
The variance contribution rate R a t is used to measure the contribution of MJO to the TP precipitation:
R a t = R 2
Based on Equations (1) and (2), we could quantify the MJO/RMM contribution to the TP summer precipitation. The significance of R is assessed based on Student’s t-test.

3. Results

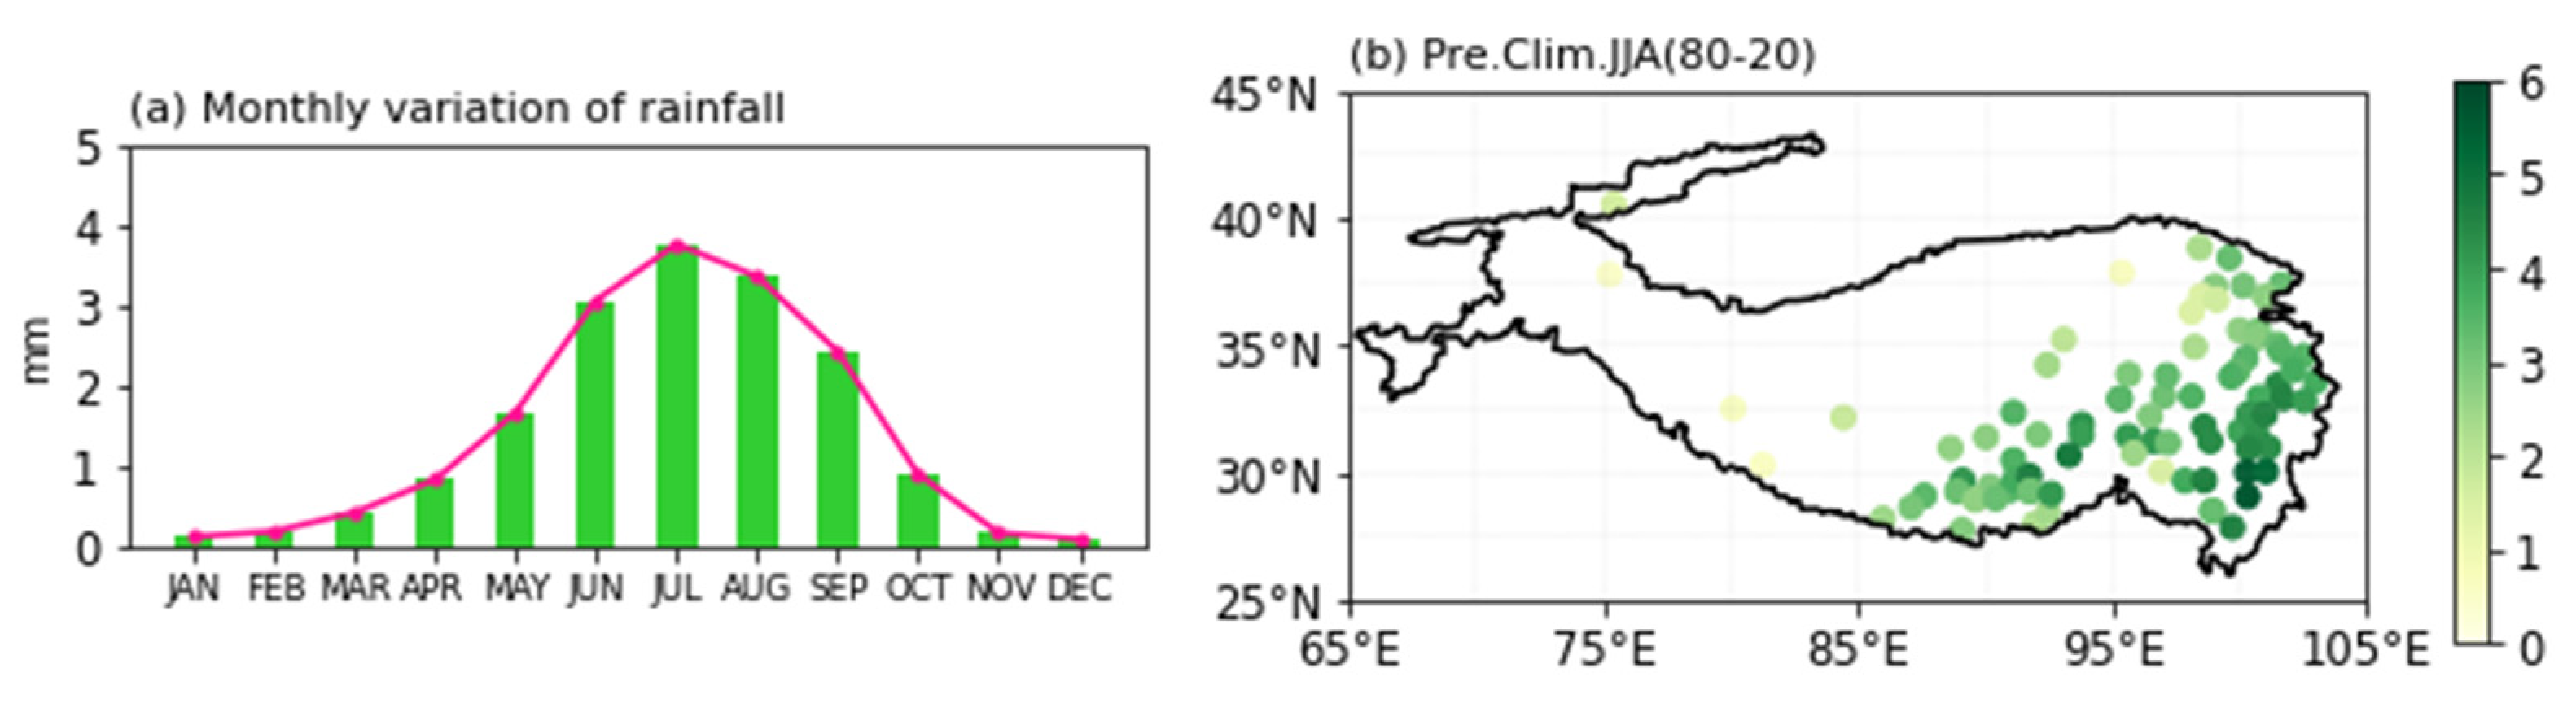
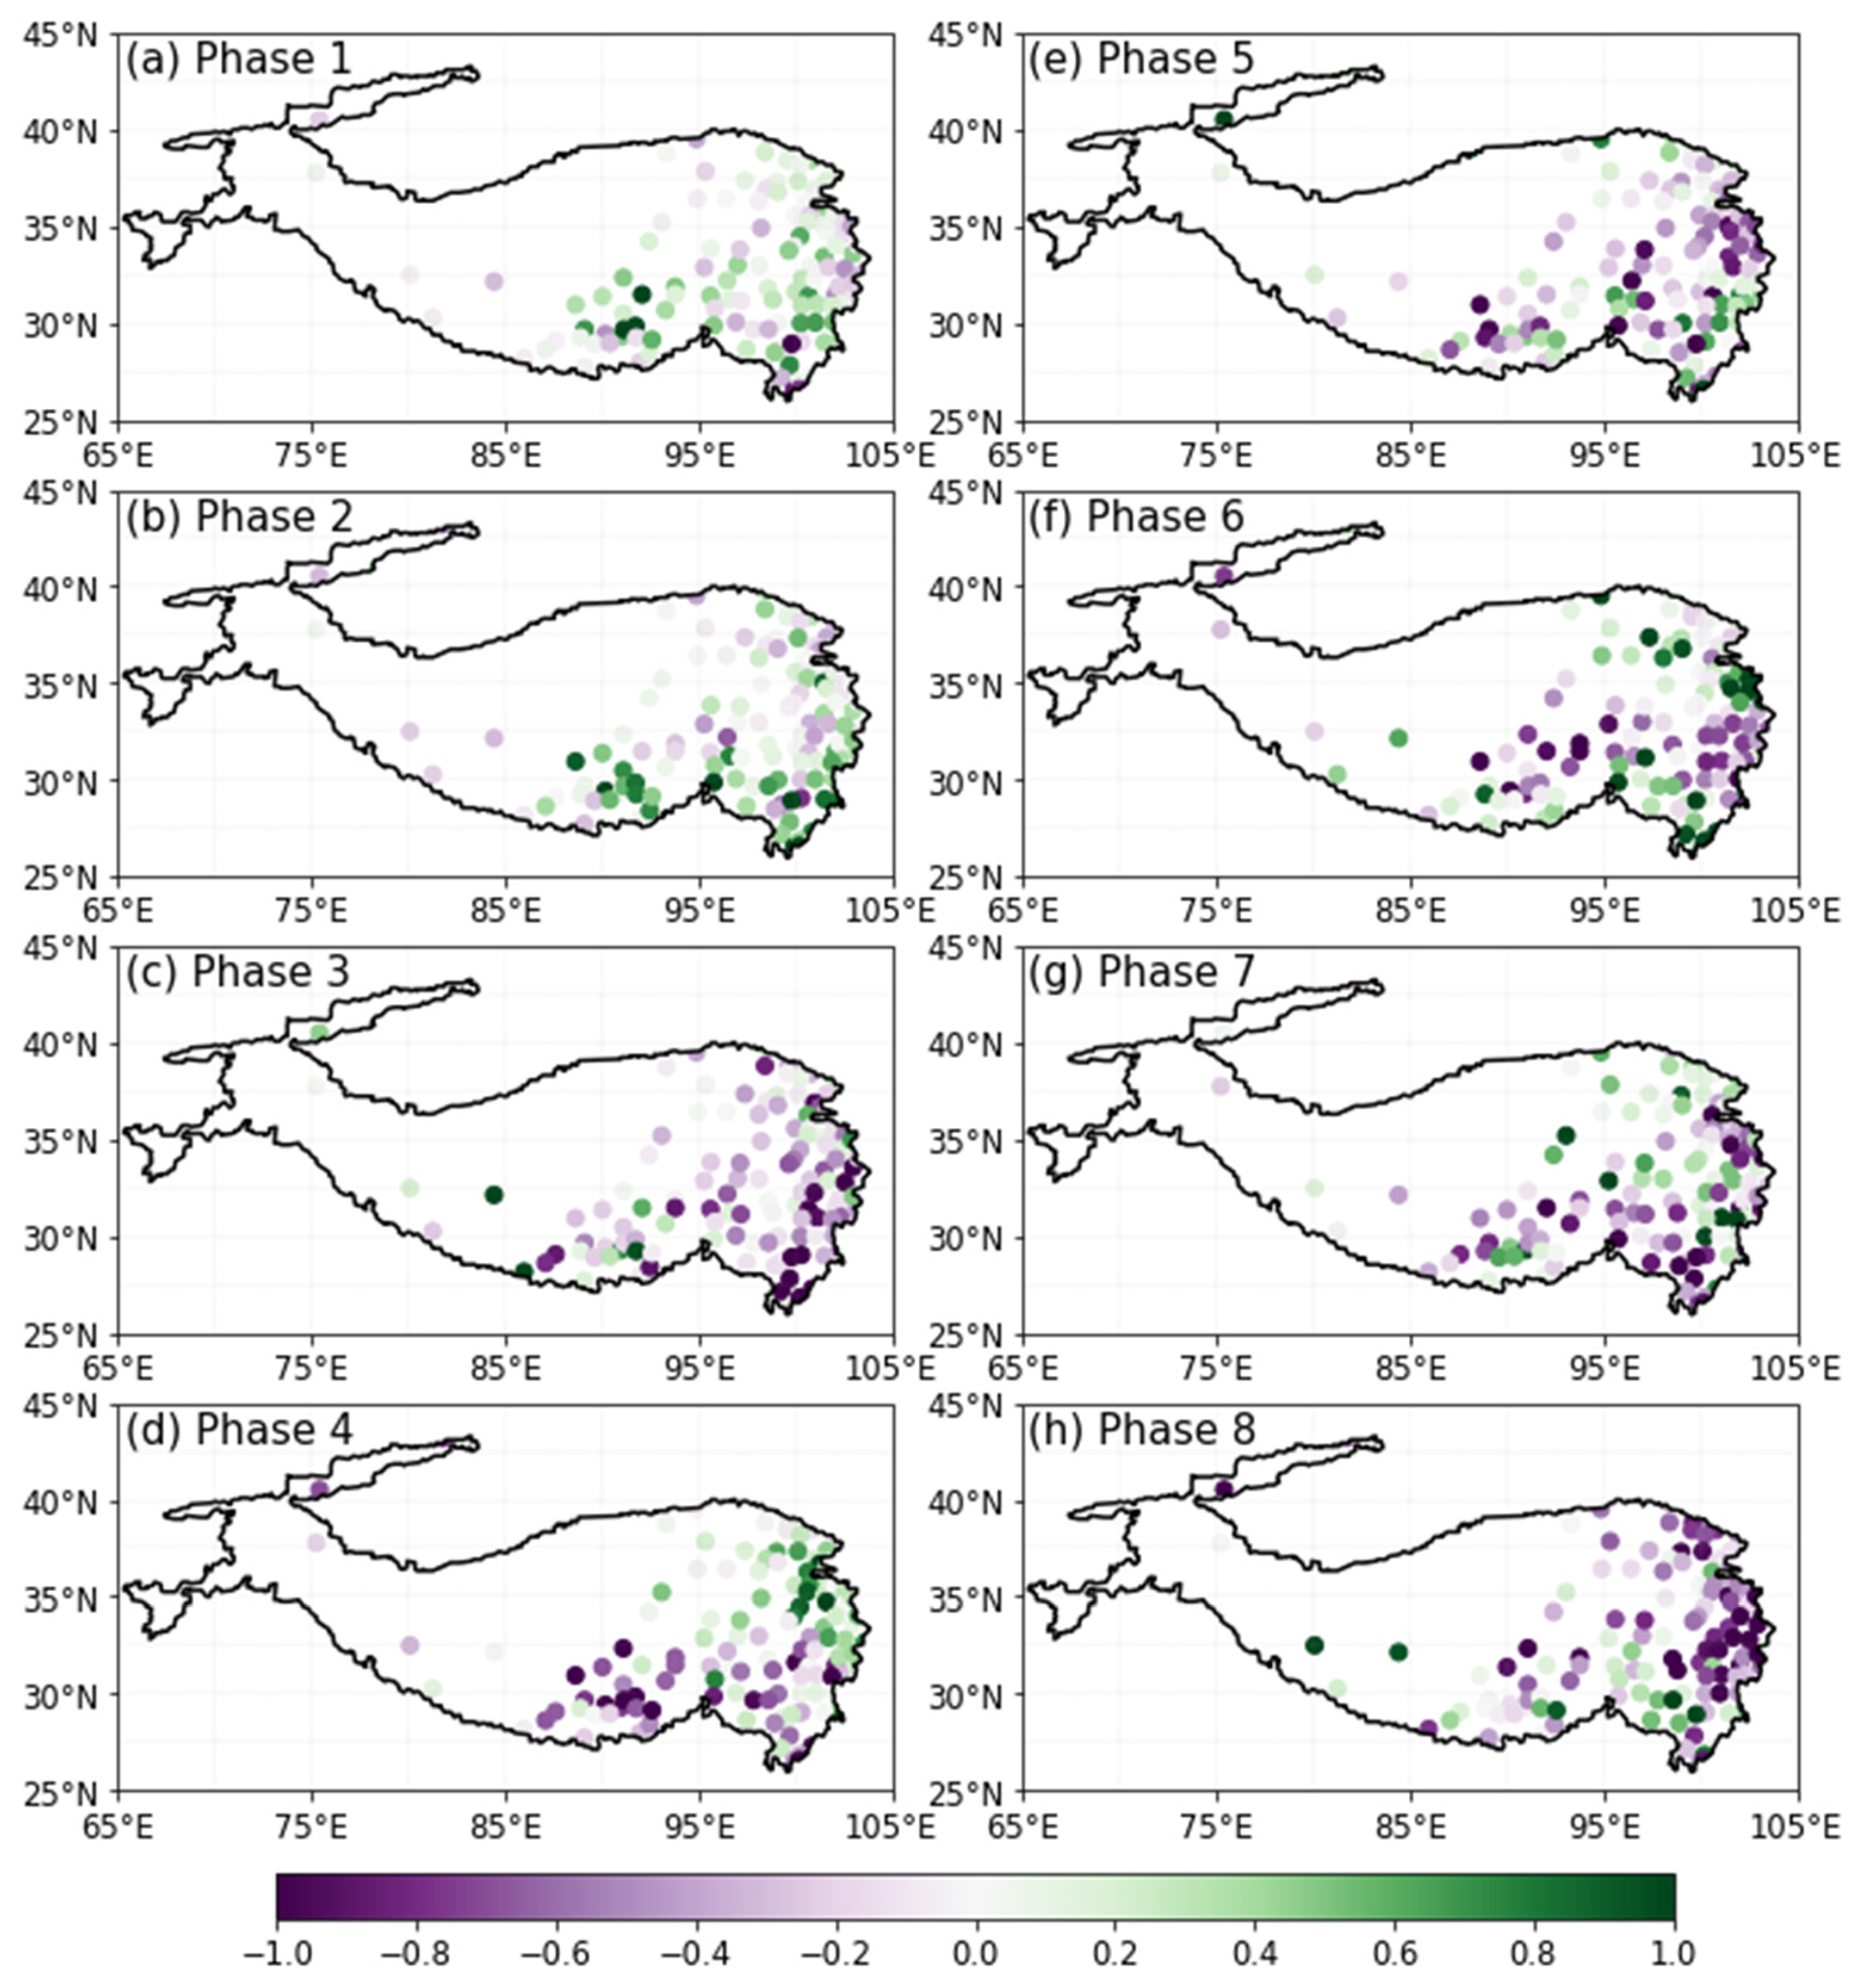
3.1. The Importance of MJO Influence on the TP Summer Precipitation

Before exploring the influence of MJO on TP precipitation during boreal summer, it is necessary to examine the climatological features of precipitation over the TP. In Figure 1a, we show the monthly variation in climatological precipitation over the TP for the period of 1980–2020. As we can see, the TP precipitation has obvious seasonal variation, among which the boreal summer season (JJA) has the most rainfall—much more than November–March. At the same time, it can be seen from the spatial distribution of climatological summer precipitation that the TP summer precipitation has distinct spatial variation (Figure 1b). The precipitation increases from west to east and from north to south, with the maximum rainfall occurring over the southeast corner of the TP, and this may be closely related to topographic effects.
To track the signal of the eastward-propagating MJO convection, we give the composite patterns of OLR anomalies for each MJO phase during boreal summer in Figure 2. The location of the MJO convection center shown here is quite consistent with our traditional understanding, which is explained in Section 2, and we will not repeat it. Note that the MJO convection in summer has a significant northward shift in addition to the basic eastward transmission characteristics.
Considering that the northward shift of MJO convection in summer likely affects the TP precipitation, we analyzed the percentage of the total precipitation during the MJO days relative to the summer means (Figure 3). Table 1 shows the case numbers of MJO phases in JJA. In general, the percentage can reach 70% over the TP. In Phases 1–2, the distribution of percentage is more uniform over the eastern TP, ranging from 90% to 120%. In Phase 3, the percentage over the eastern part decreases, while the west is larger. In Phase 4, the percentage is higher over the northeastern TP and lower over the western and southern parts. The distribution of Phases 5–8 is basically opposite to that of Phases 1–4. The percentage in Phases 5–6 over the eastern TP is between 80% and 110%, about 10% lower than in Phases 1–2.
As a result, we can obtain an idea that the influence of MJO on TP precipitation is extremely important and sensitive to seasonal evolution. In the following, we try to understand the influence of MJO on the TP precipitation during boreal summer and its potential mechanism.

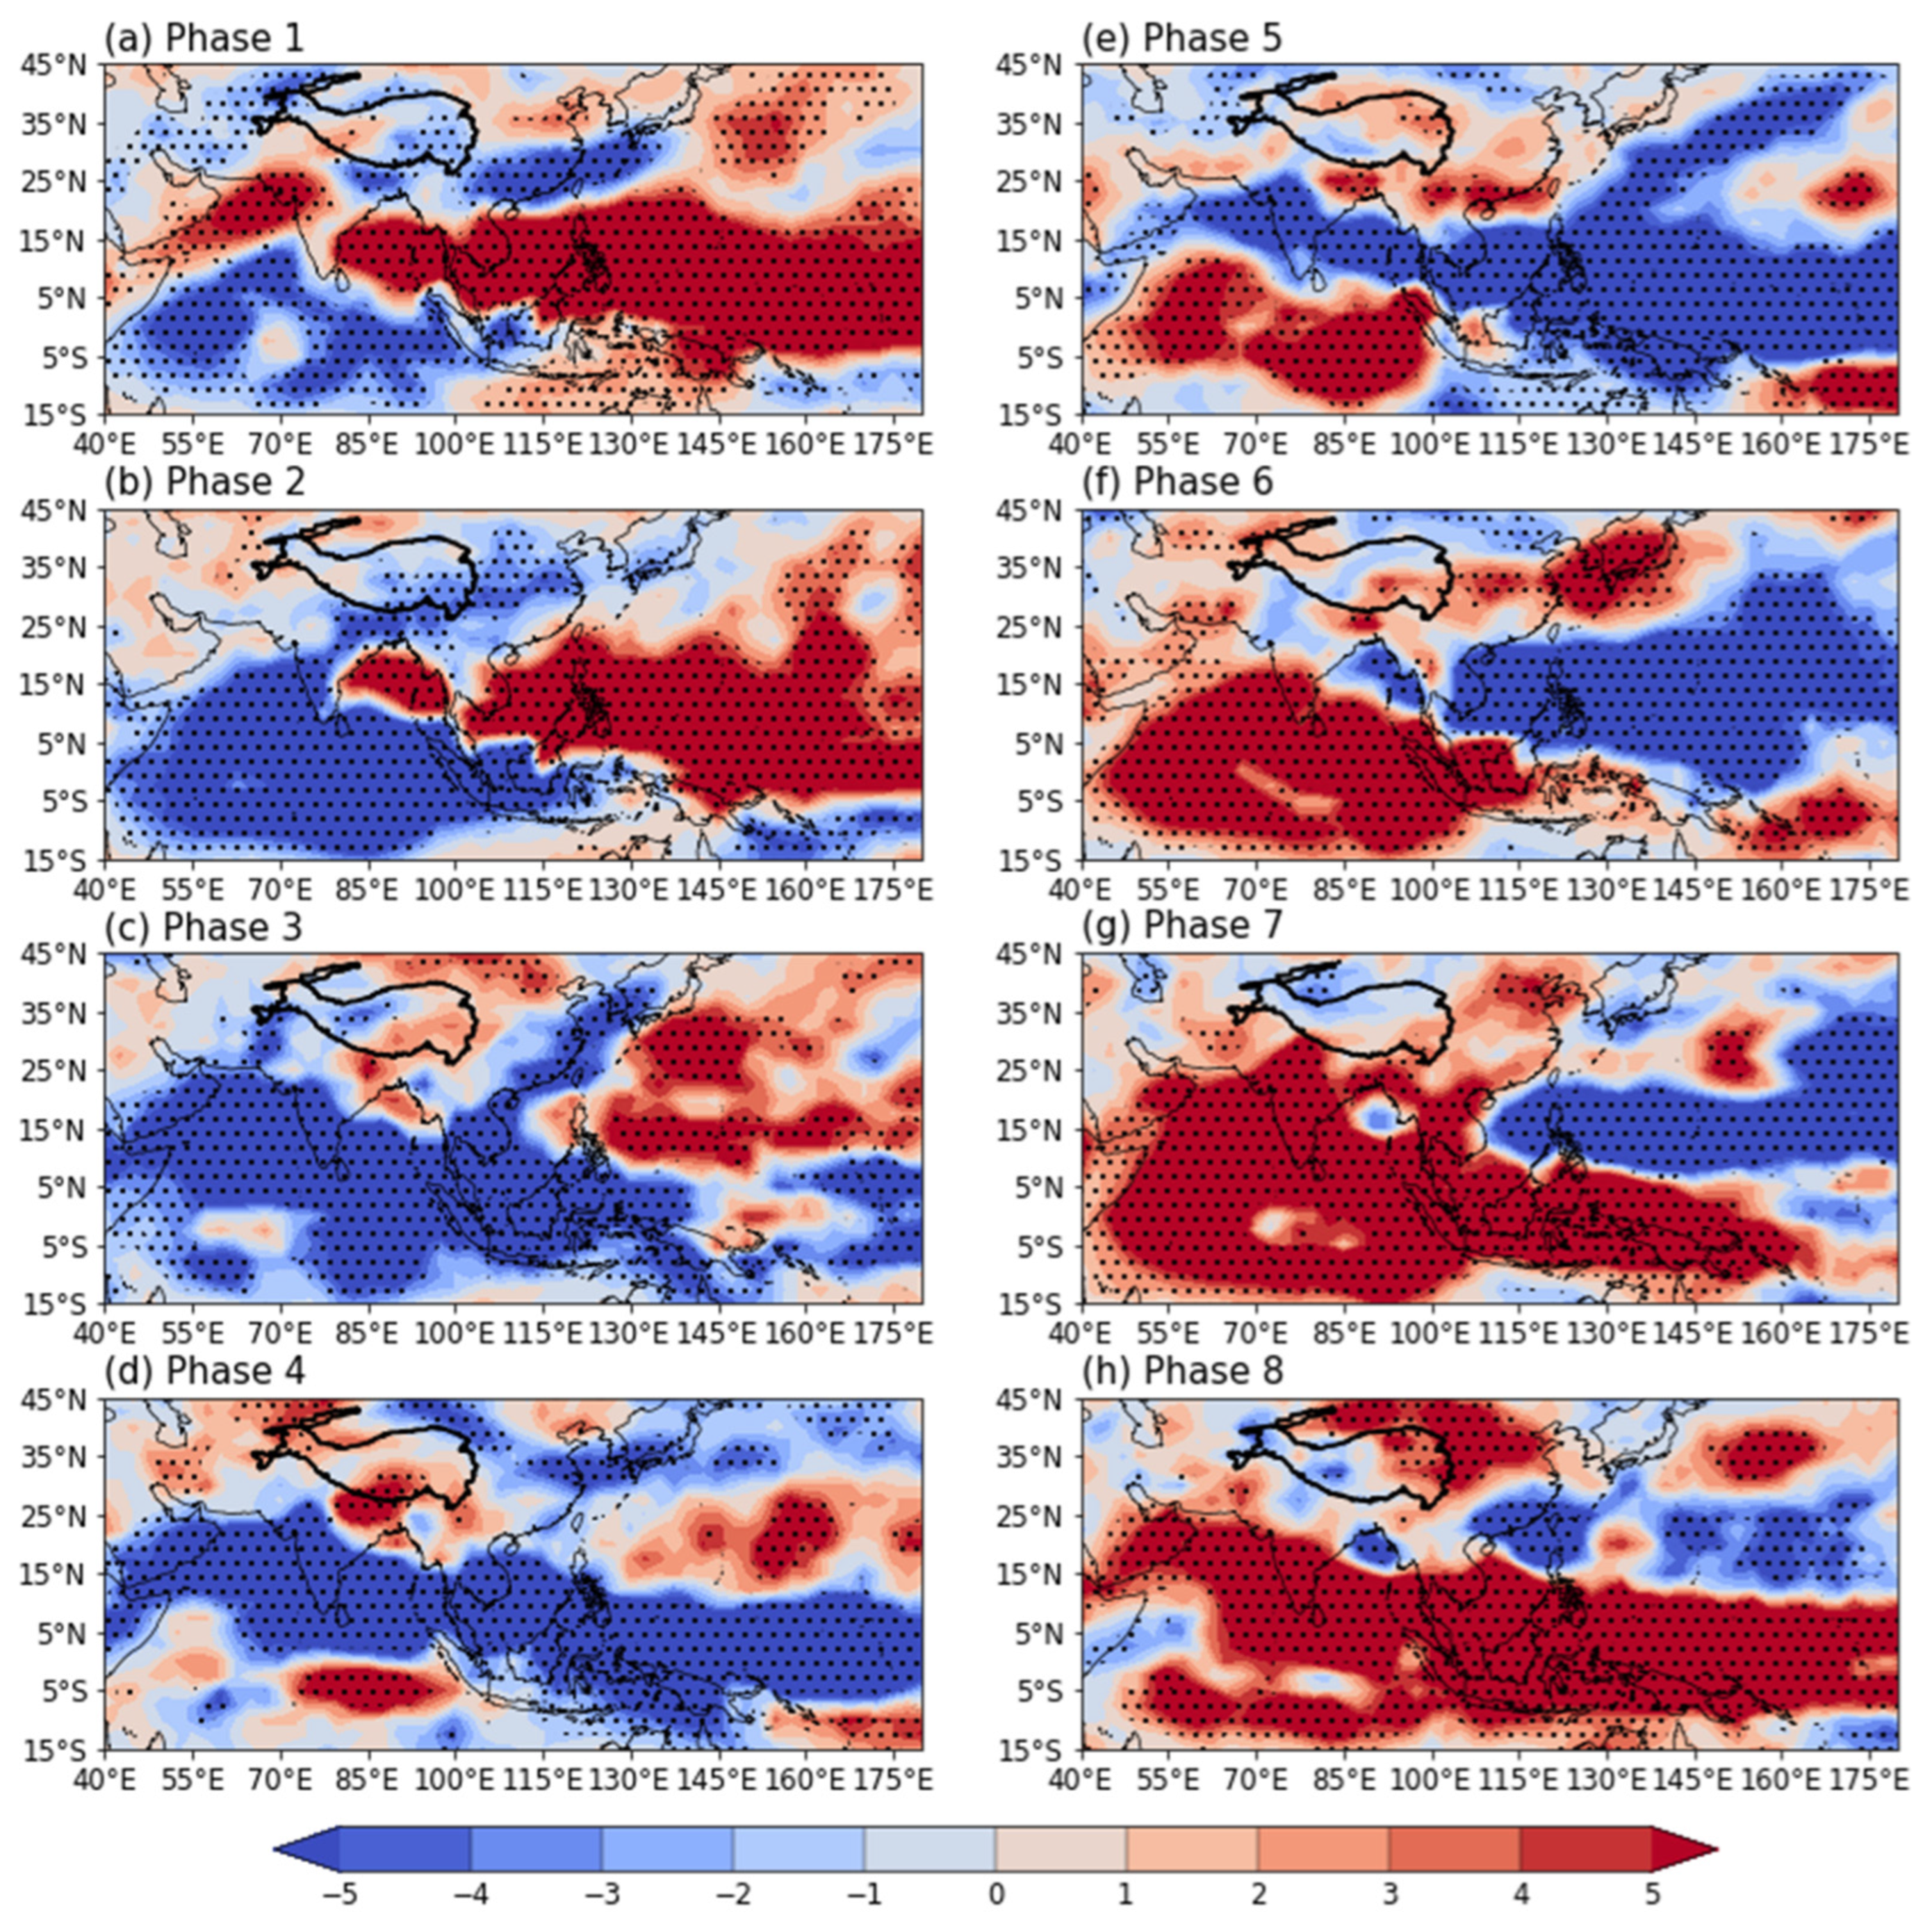
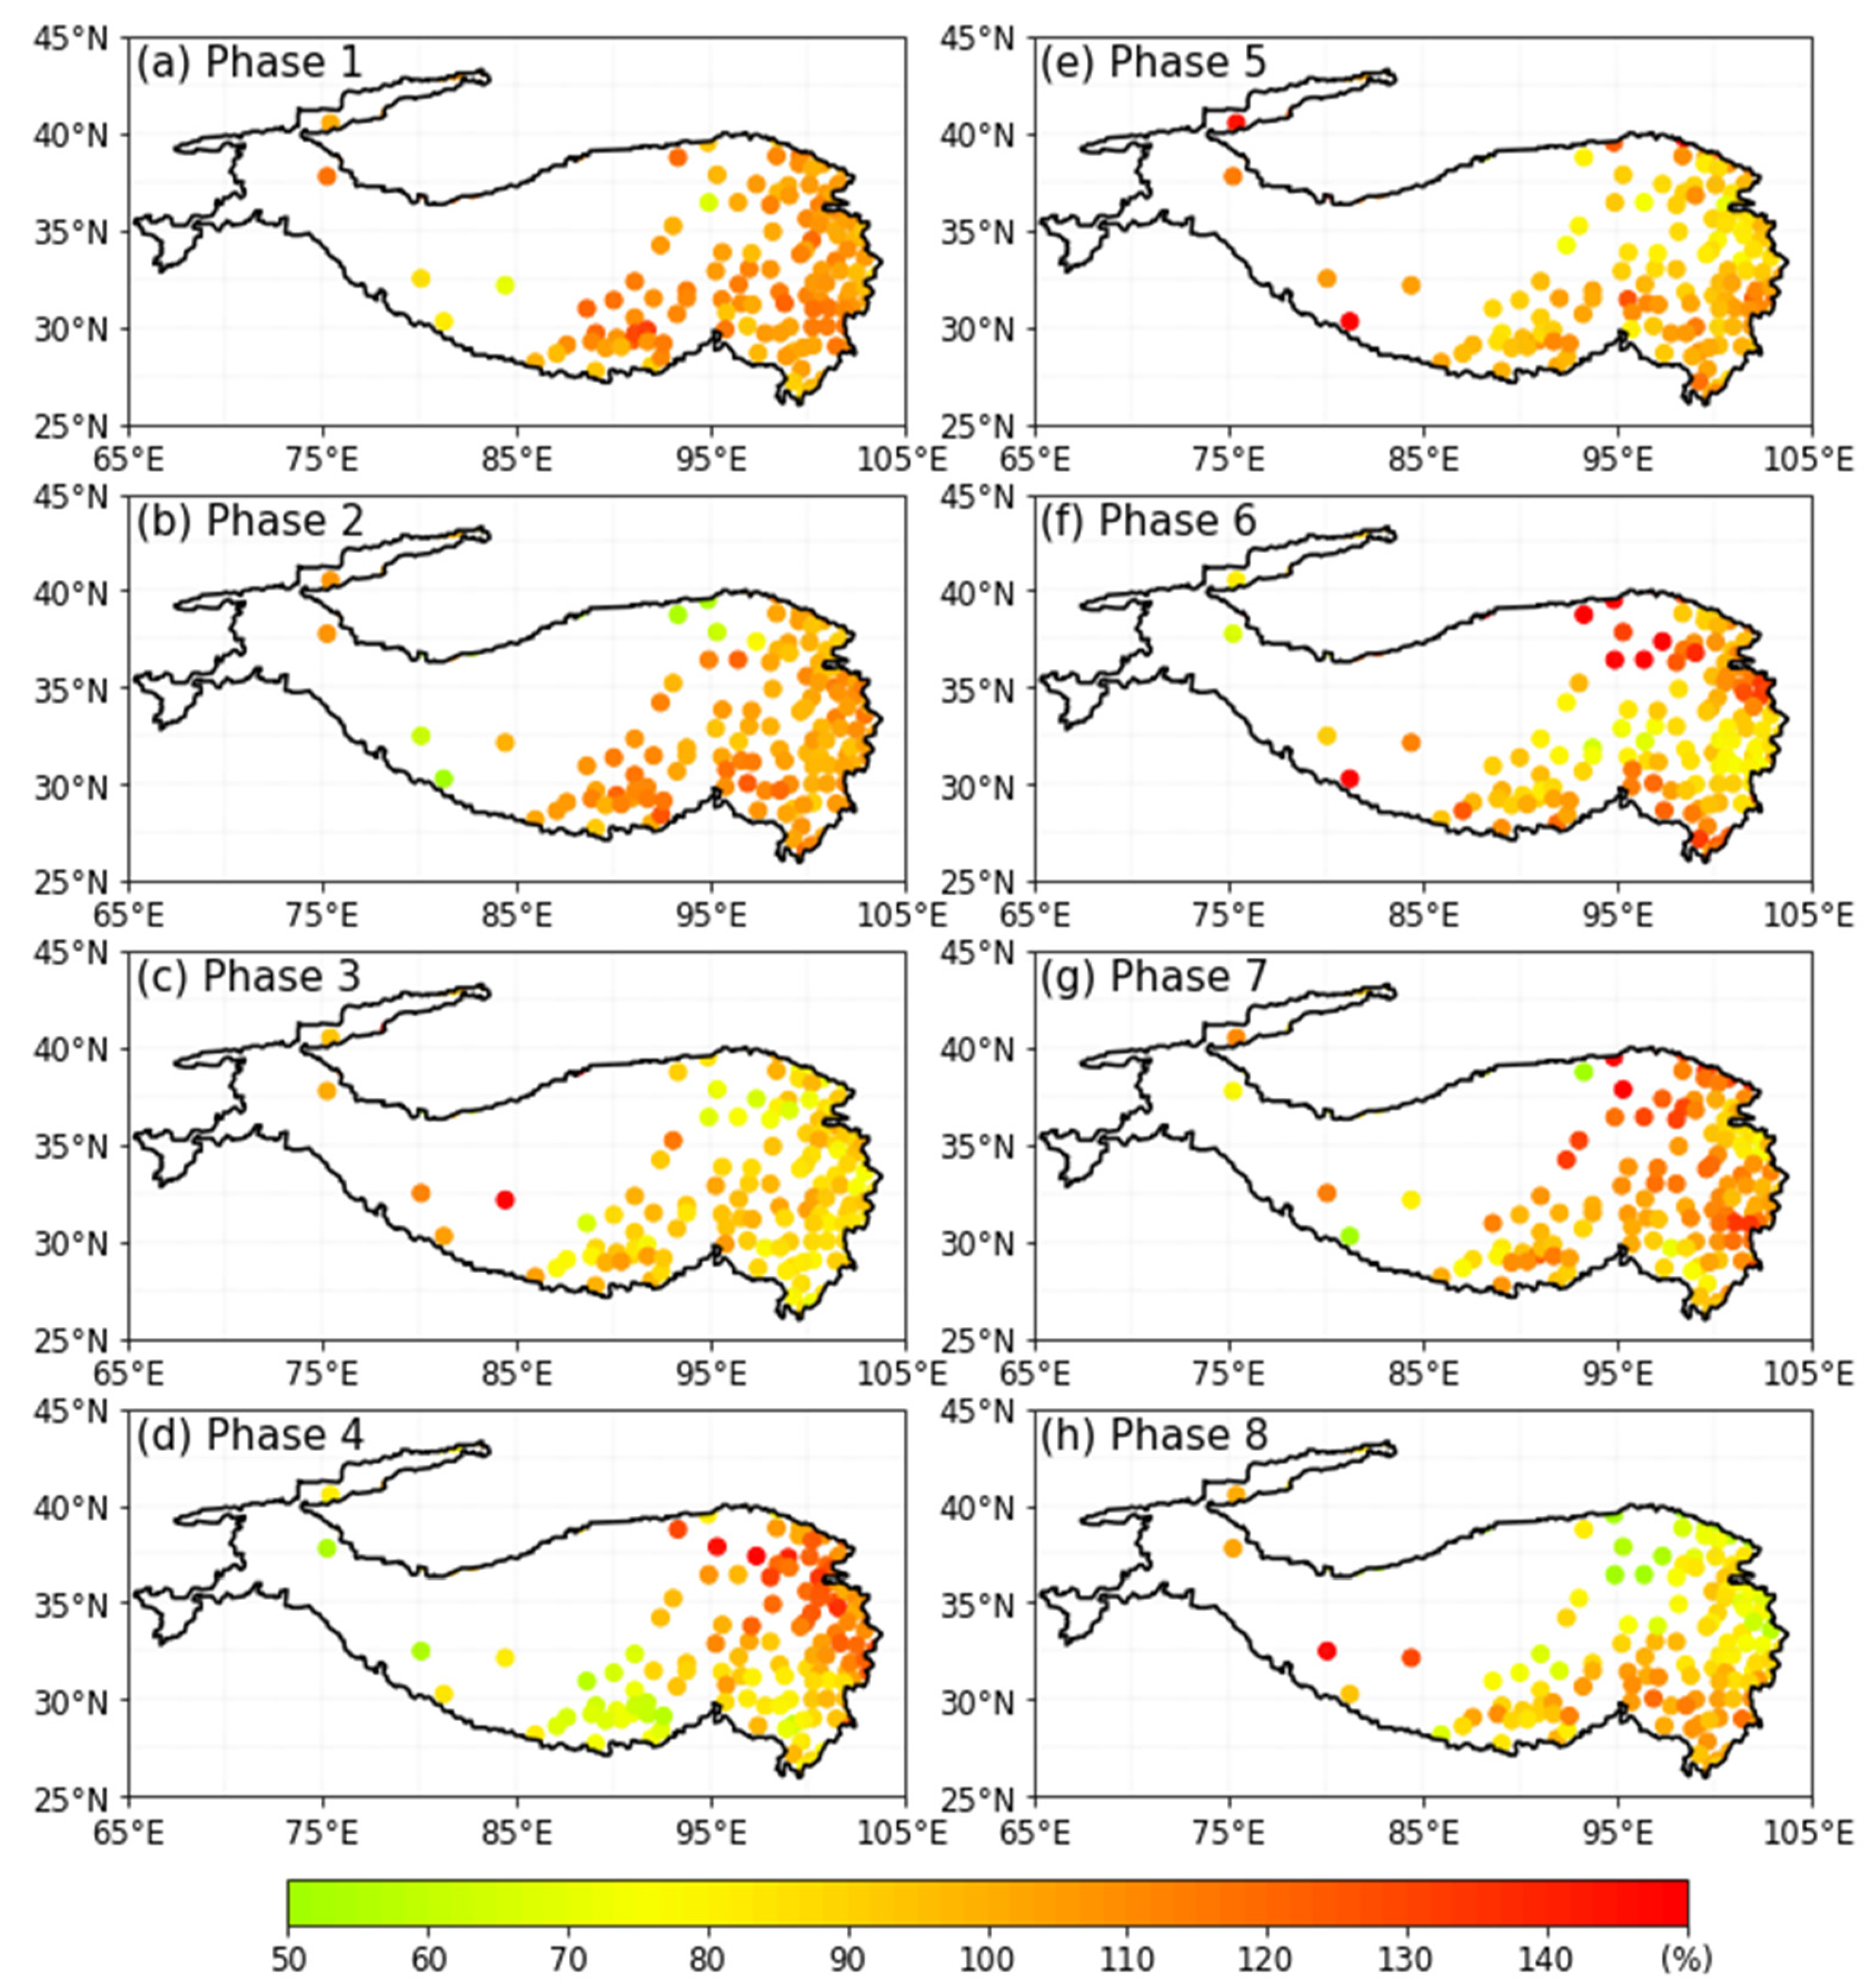
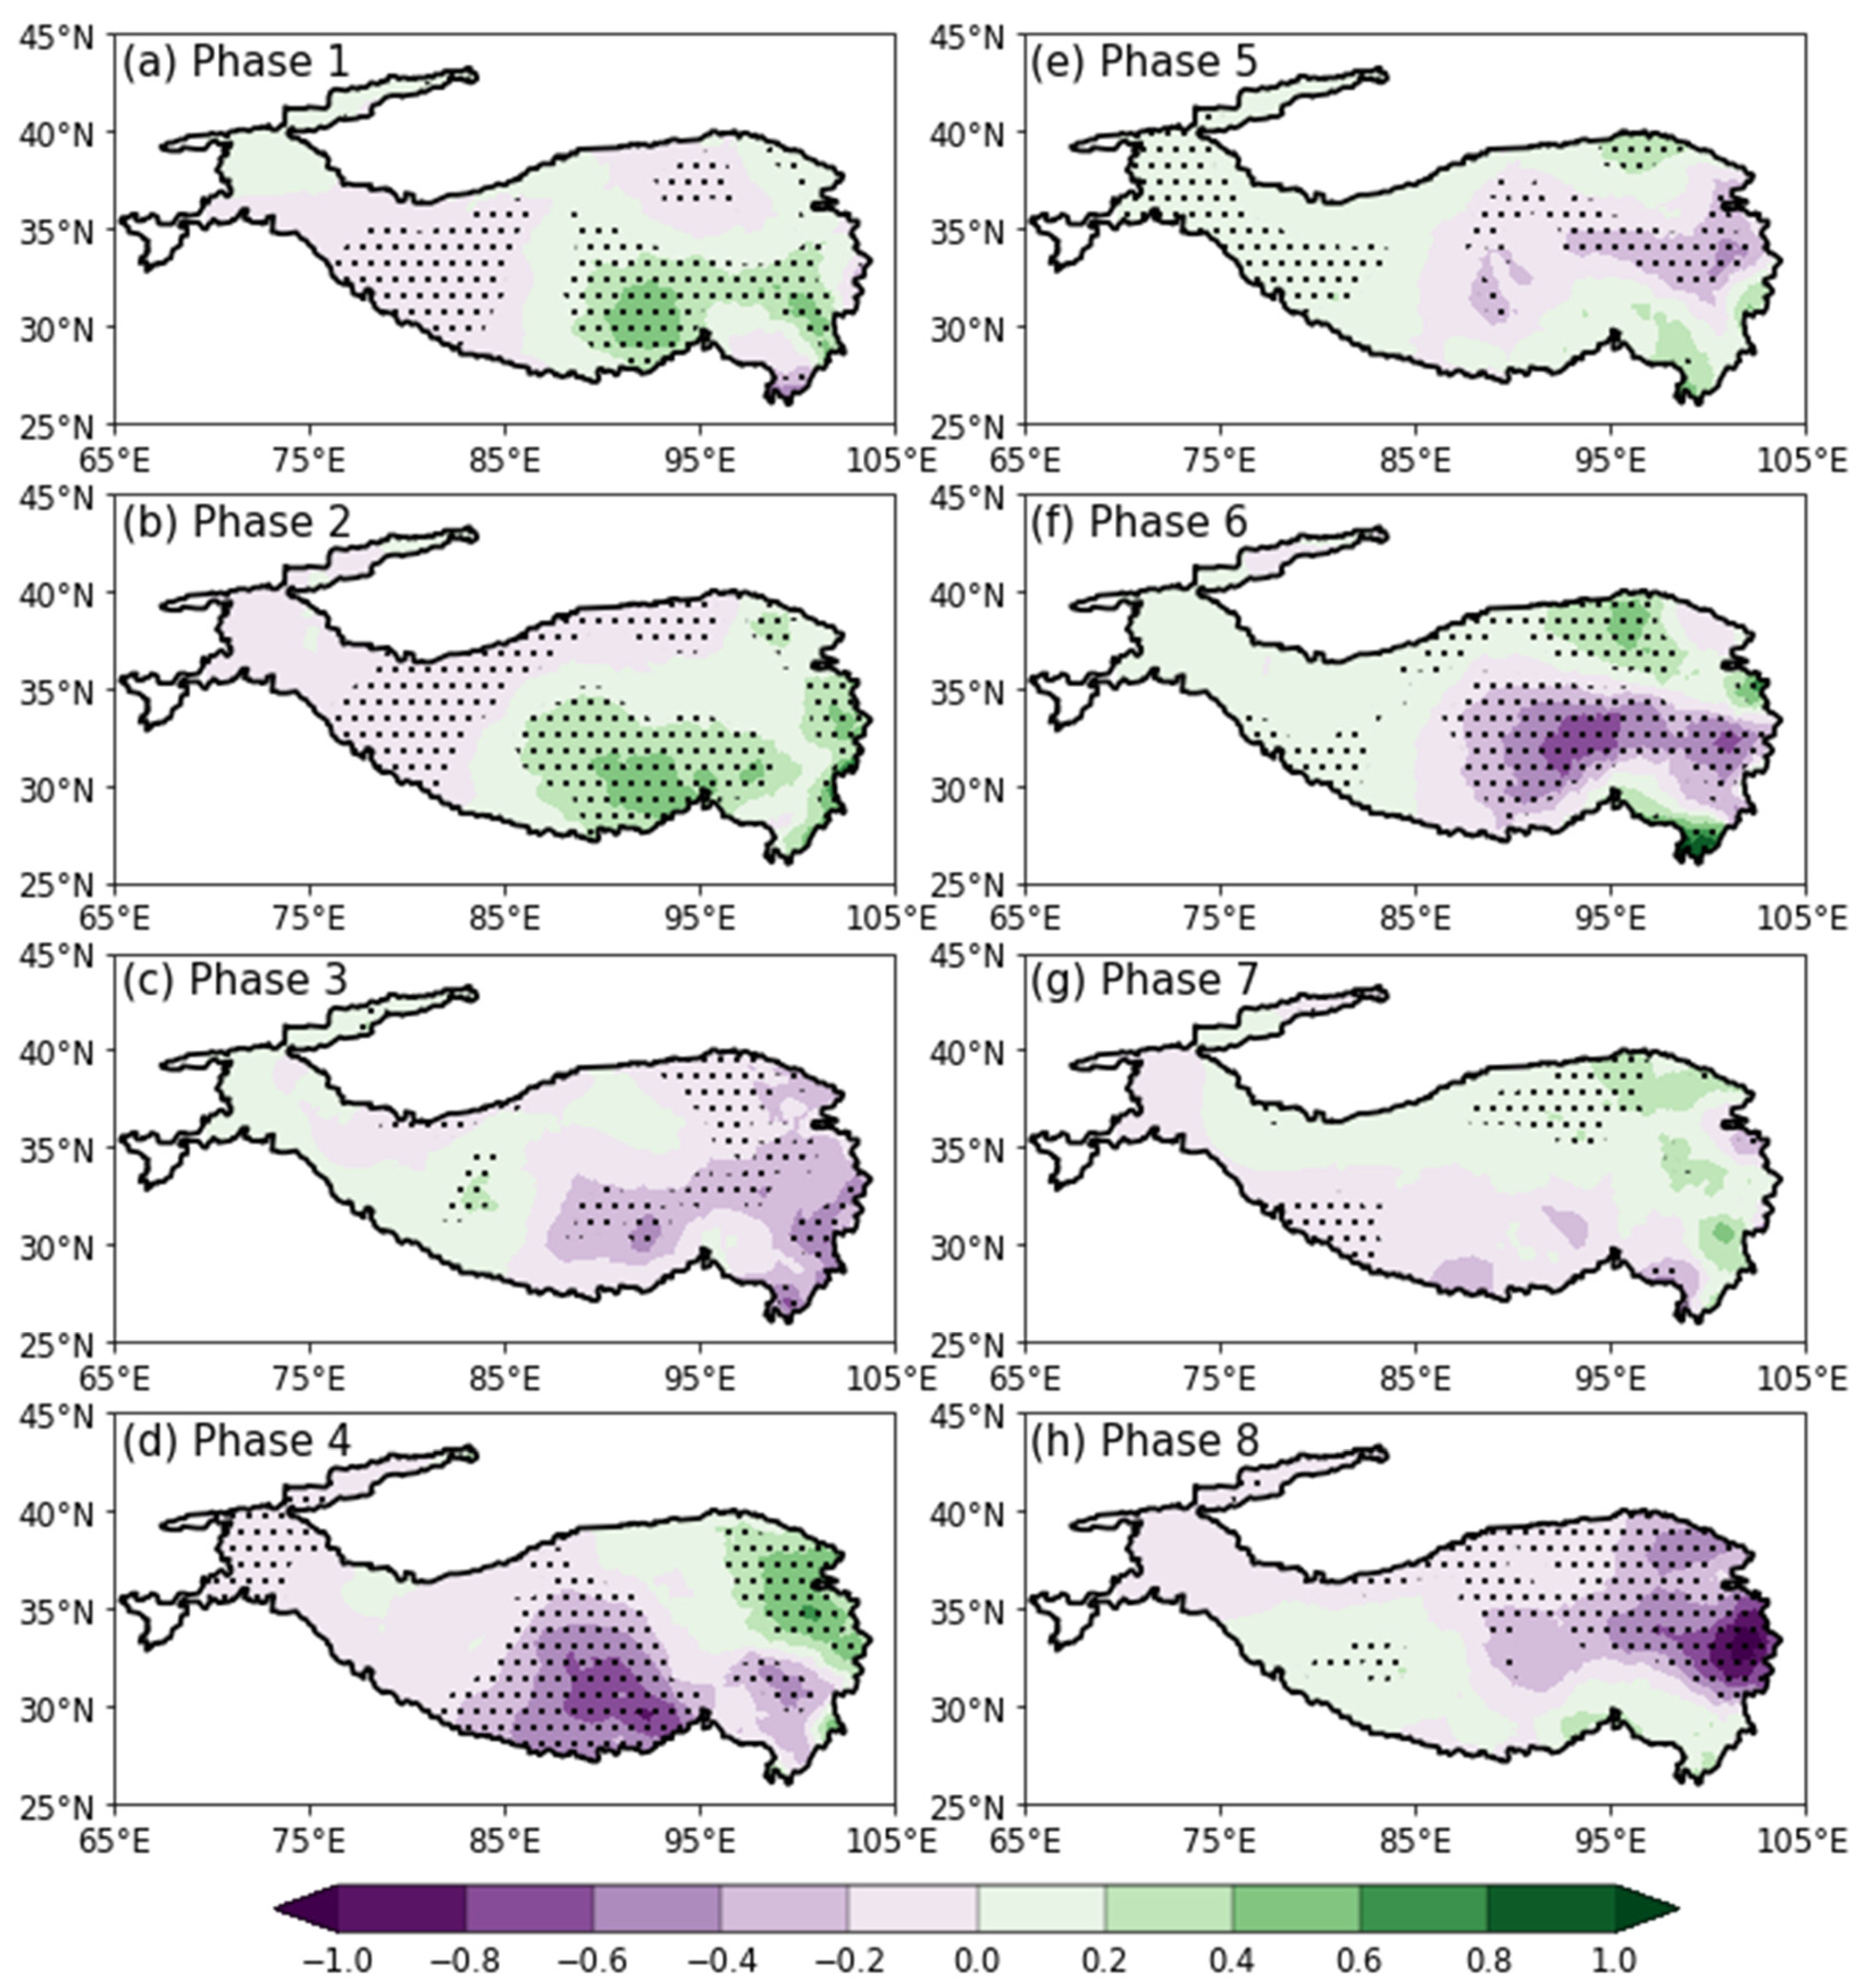
3.2. Potential Impacts of MJO on the TP Summer Precipitation

First, we address how much the TP summer precipitation variability can be attributed to MJO/RMM. Using the station precipitation observations, we derive the spatial distribution of R in Figure 4. It can be found that there is a certain linear relationship between MJO and the TP summer precipitation. The correlation coefficients can reach 0.14 over the TP except for the northeastern area. However, the impact of MJO on the summer precipitation over the TP is extremely inhomogeneous, which is relatively stronger over the southeastern TP, showing significant correlations and the variance contribution rate are above 0.2 and 4% respectively. The result is consistent with the study of Ren and Shen [42].
To investigate the responses of the TP precipitation to the eastward-propagating MJO convection, we firstly examine the TP summer precipitation patterns affected by MJO in different phases in Figure 5 and Figure 6. Here, we use the results of gridded data to compare with the observational precipitation distribution and give the significance test. In general, there is more precipitation over the eastern TP but less over the western TP during Phases 1–2. The maximum of positive anomalous precipitation is located over the southern TP. The precipitation pattern in Phase 3 shows negative and positive anomalies over the eastern and western TP, respectively. In Phase 4, positive precipitation anomalies can be observed over the northeastern TP while negative anomalies can be observed in other regions. The distributions of precipitation anomalies in Phases 5–8 exhibit nearly the opposite pattern to those in Phases 1–4.
The above analyses suggest that the summer precipitation over most of the eastern TP increases (decreases) in MJO Phases 1–2 (5–6), especially when MJO propagates to IO and WP in Phases 2 and 6. The influence of MJO on the TP summer precipitation weakens when its convection center migrates to the eastern IO in Phase 3 and the western–central Pacific in Phase 7. As the MJO convection moves into MC in Phase 4 and the central Pacific in Phase 8, the summer precipitation over the western and eastern TP is abnormally deficient, respectively. The response of the TP summer precipitation to MJO is inhomogeneous, possibly due to the strong topographic effects of the TP. MJO impacts over the eastern TP are greater than that over the west and the most prominent over the south part and eastern edge of the TP. Meanwhile, the weak influence of MJO on the western TP may be due to the lack of observational stations.
To further understand the relationship between the MJO activity and TP summer precipitation, we diagnose spatial distribution characteristics of the corresponding convection over the TP (Figure 2). In Phase 1, when MJO convective heating appears in Africa and the western IO, the east of the TP is dominated by enhanced convection and the west by suppressed convection. As the diabatic heating of MJO travels eastward into the IO, the negative OLR anomalies tend to be the strongest in Phase 2, and meanwhile, the positive OLR anomalies shrink and weaken. The variation in OLR anomalies is consistent with that of the precipitation anomalies in Figure 5 and Figure 6. In Phase 3, the eastern TP shows suppressed convection, while enhanced convection can be observed over the western TP. In Phase 4, the whole TP is mainly occupied by suppressed convection, with its center located in the south of the TP. The anomalous convection patterns in Phases 5–8 are nearly contrary to those in Phases 1–4. On the basis of the above analyses, it can be found that the enhanced convective activities are consistent with the positive precipitation anomalies and vice versa.

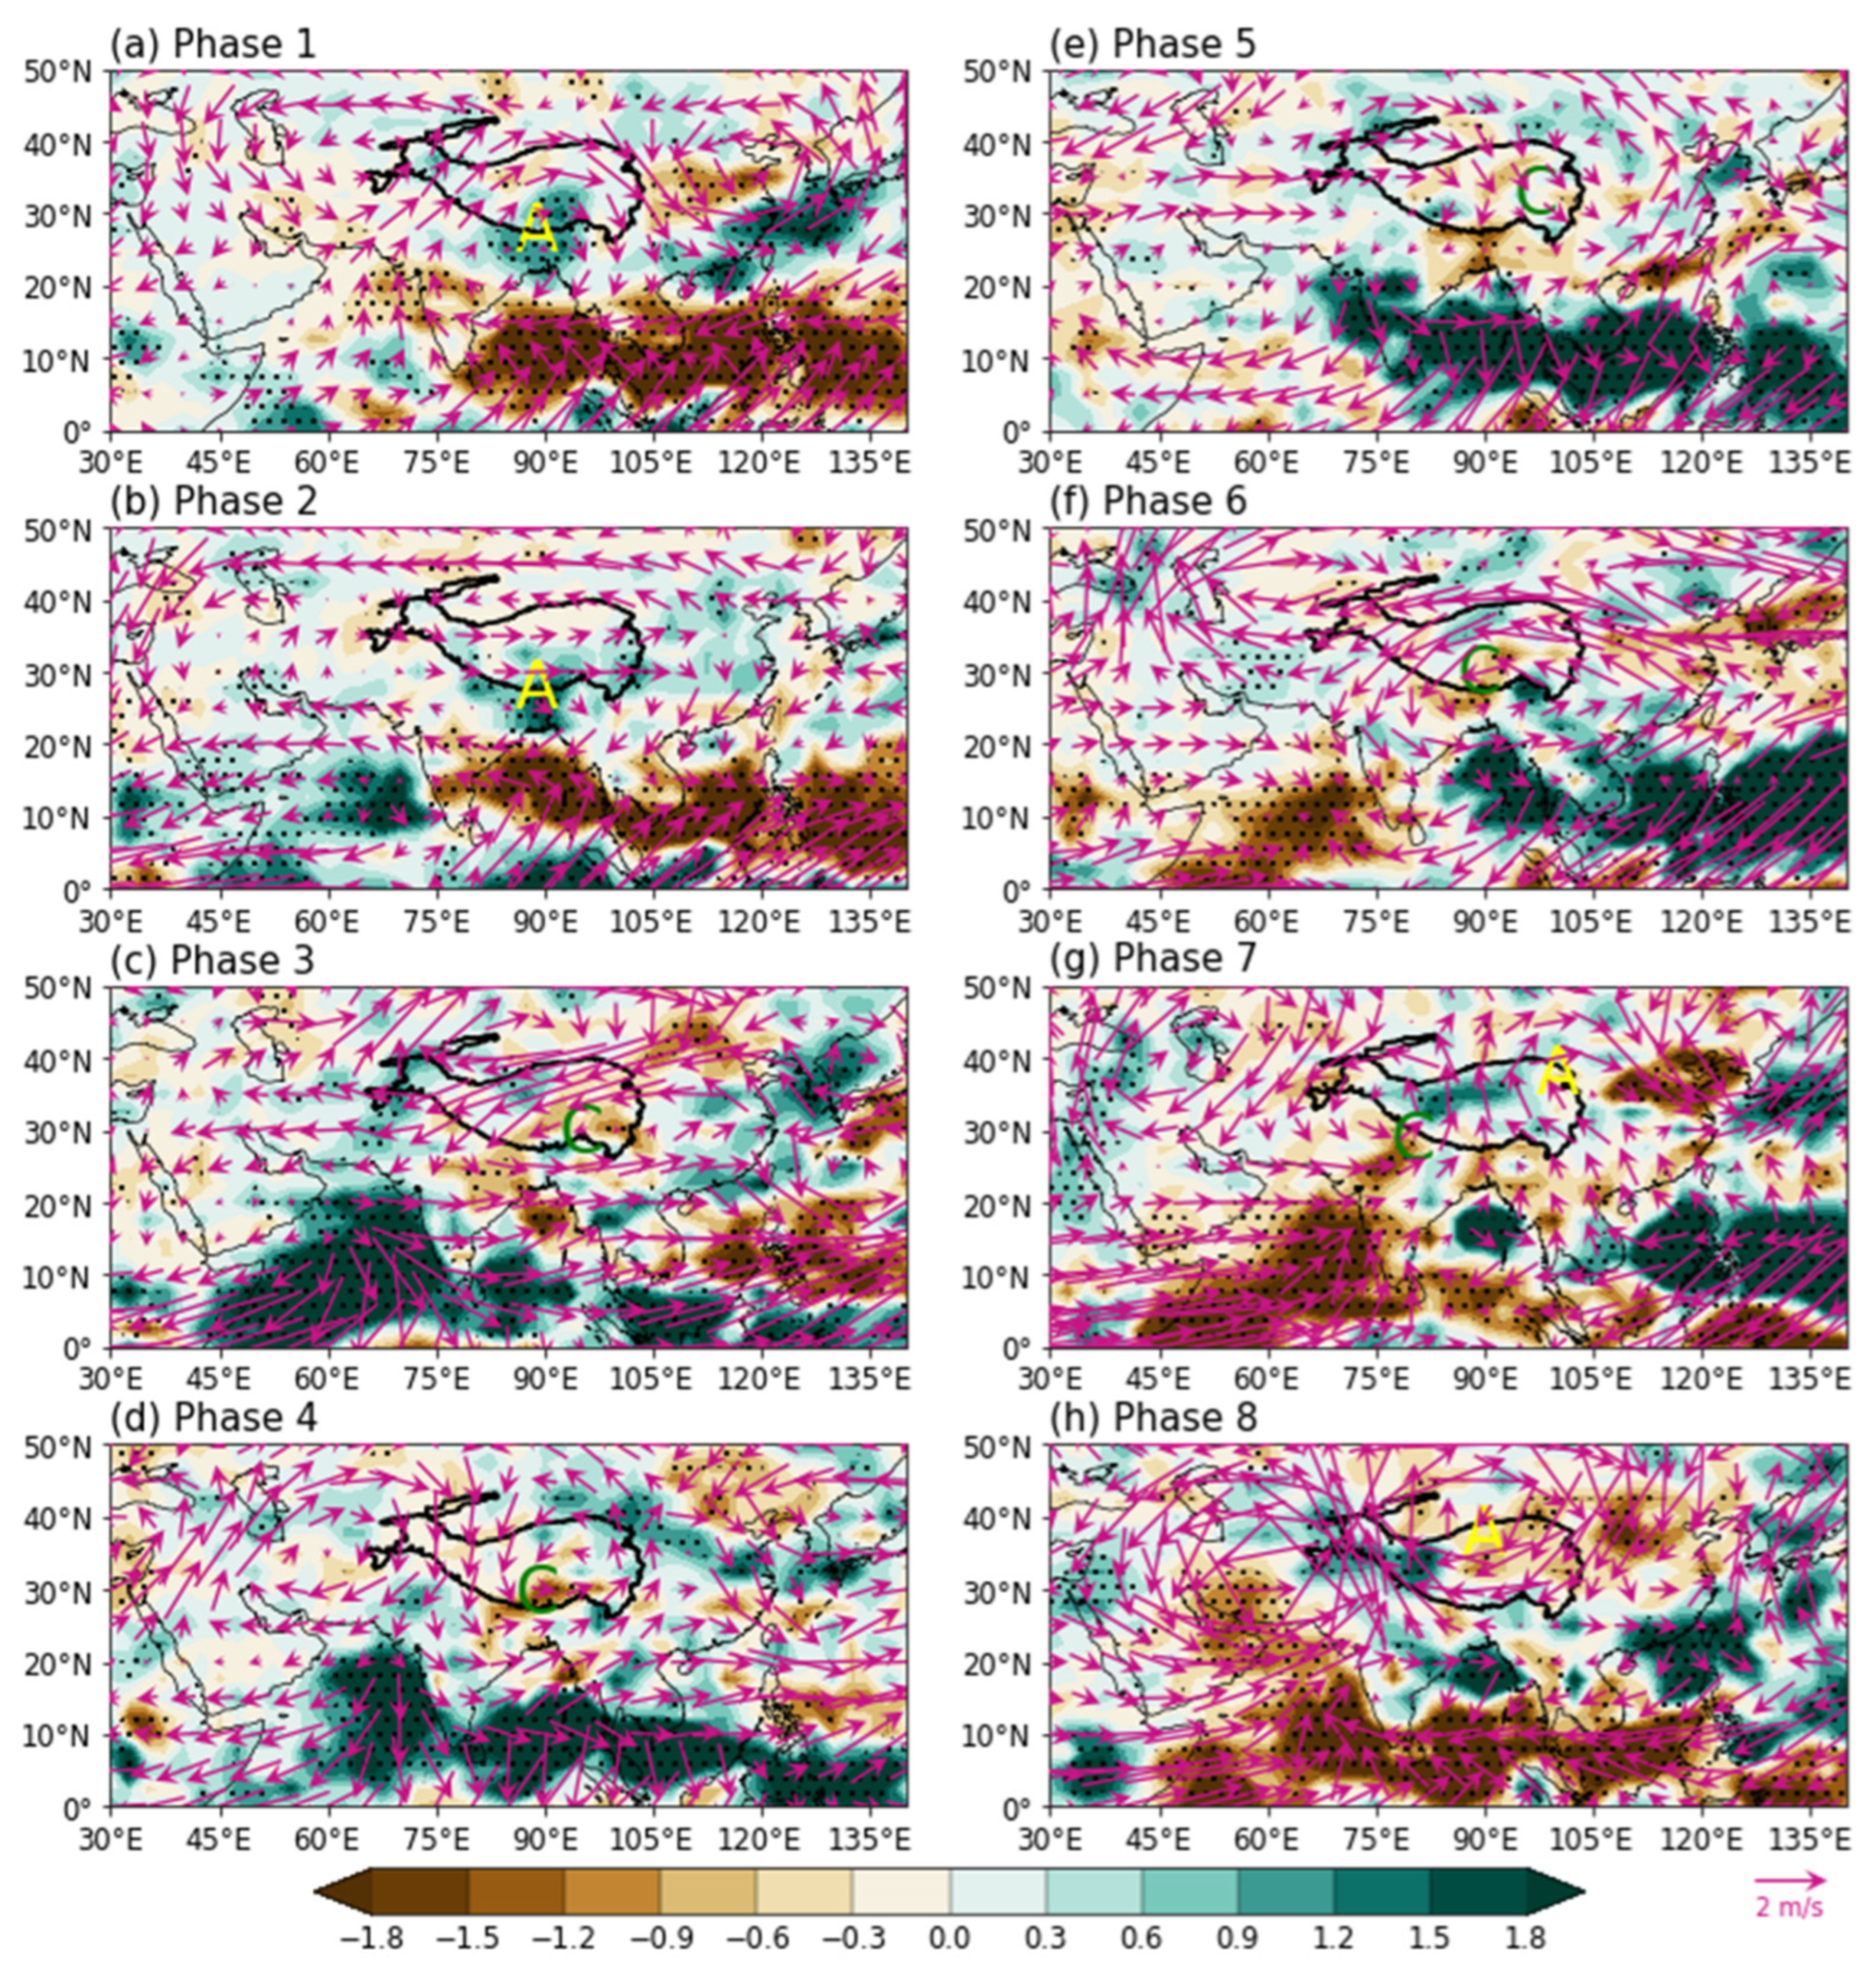
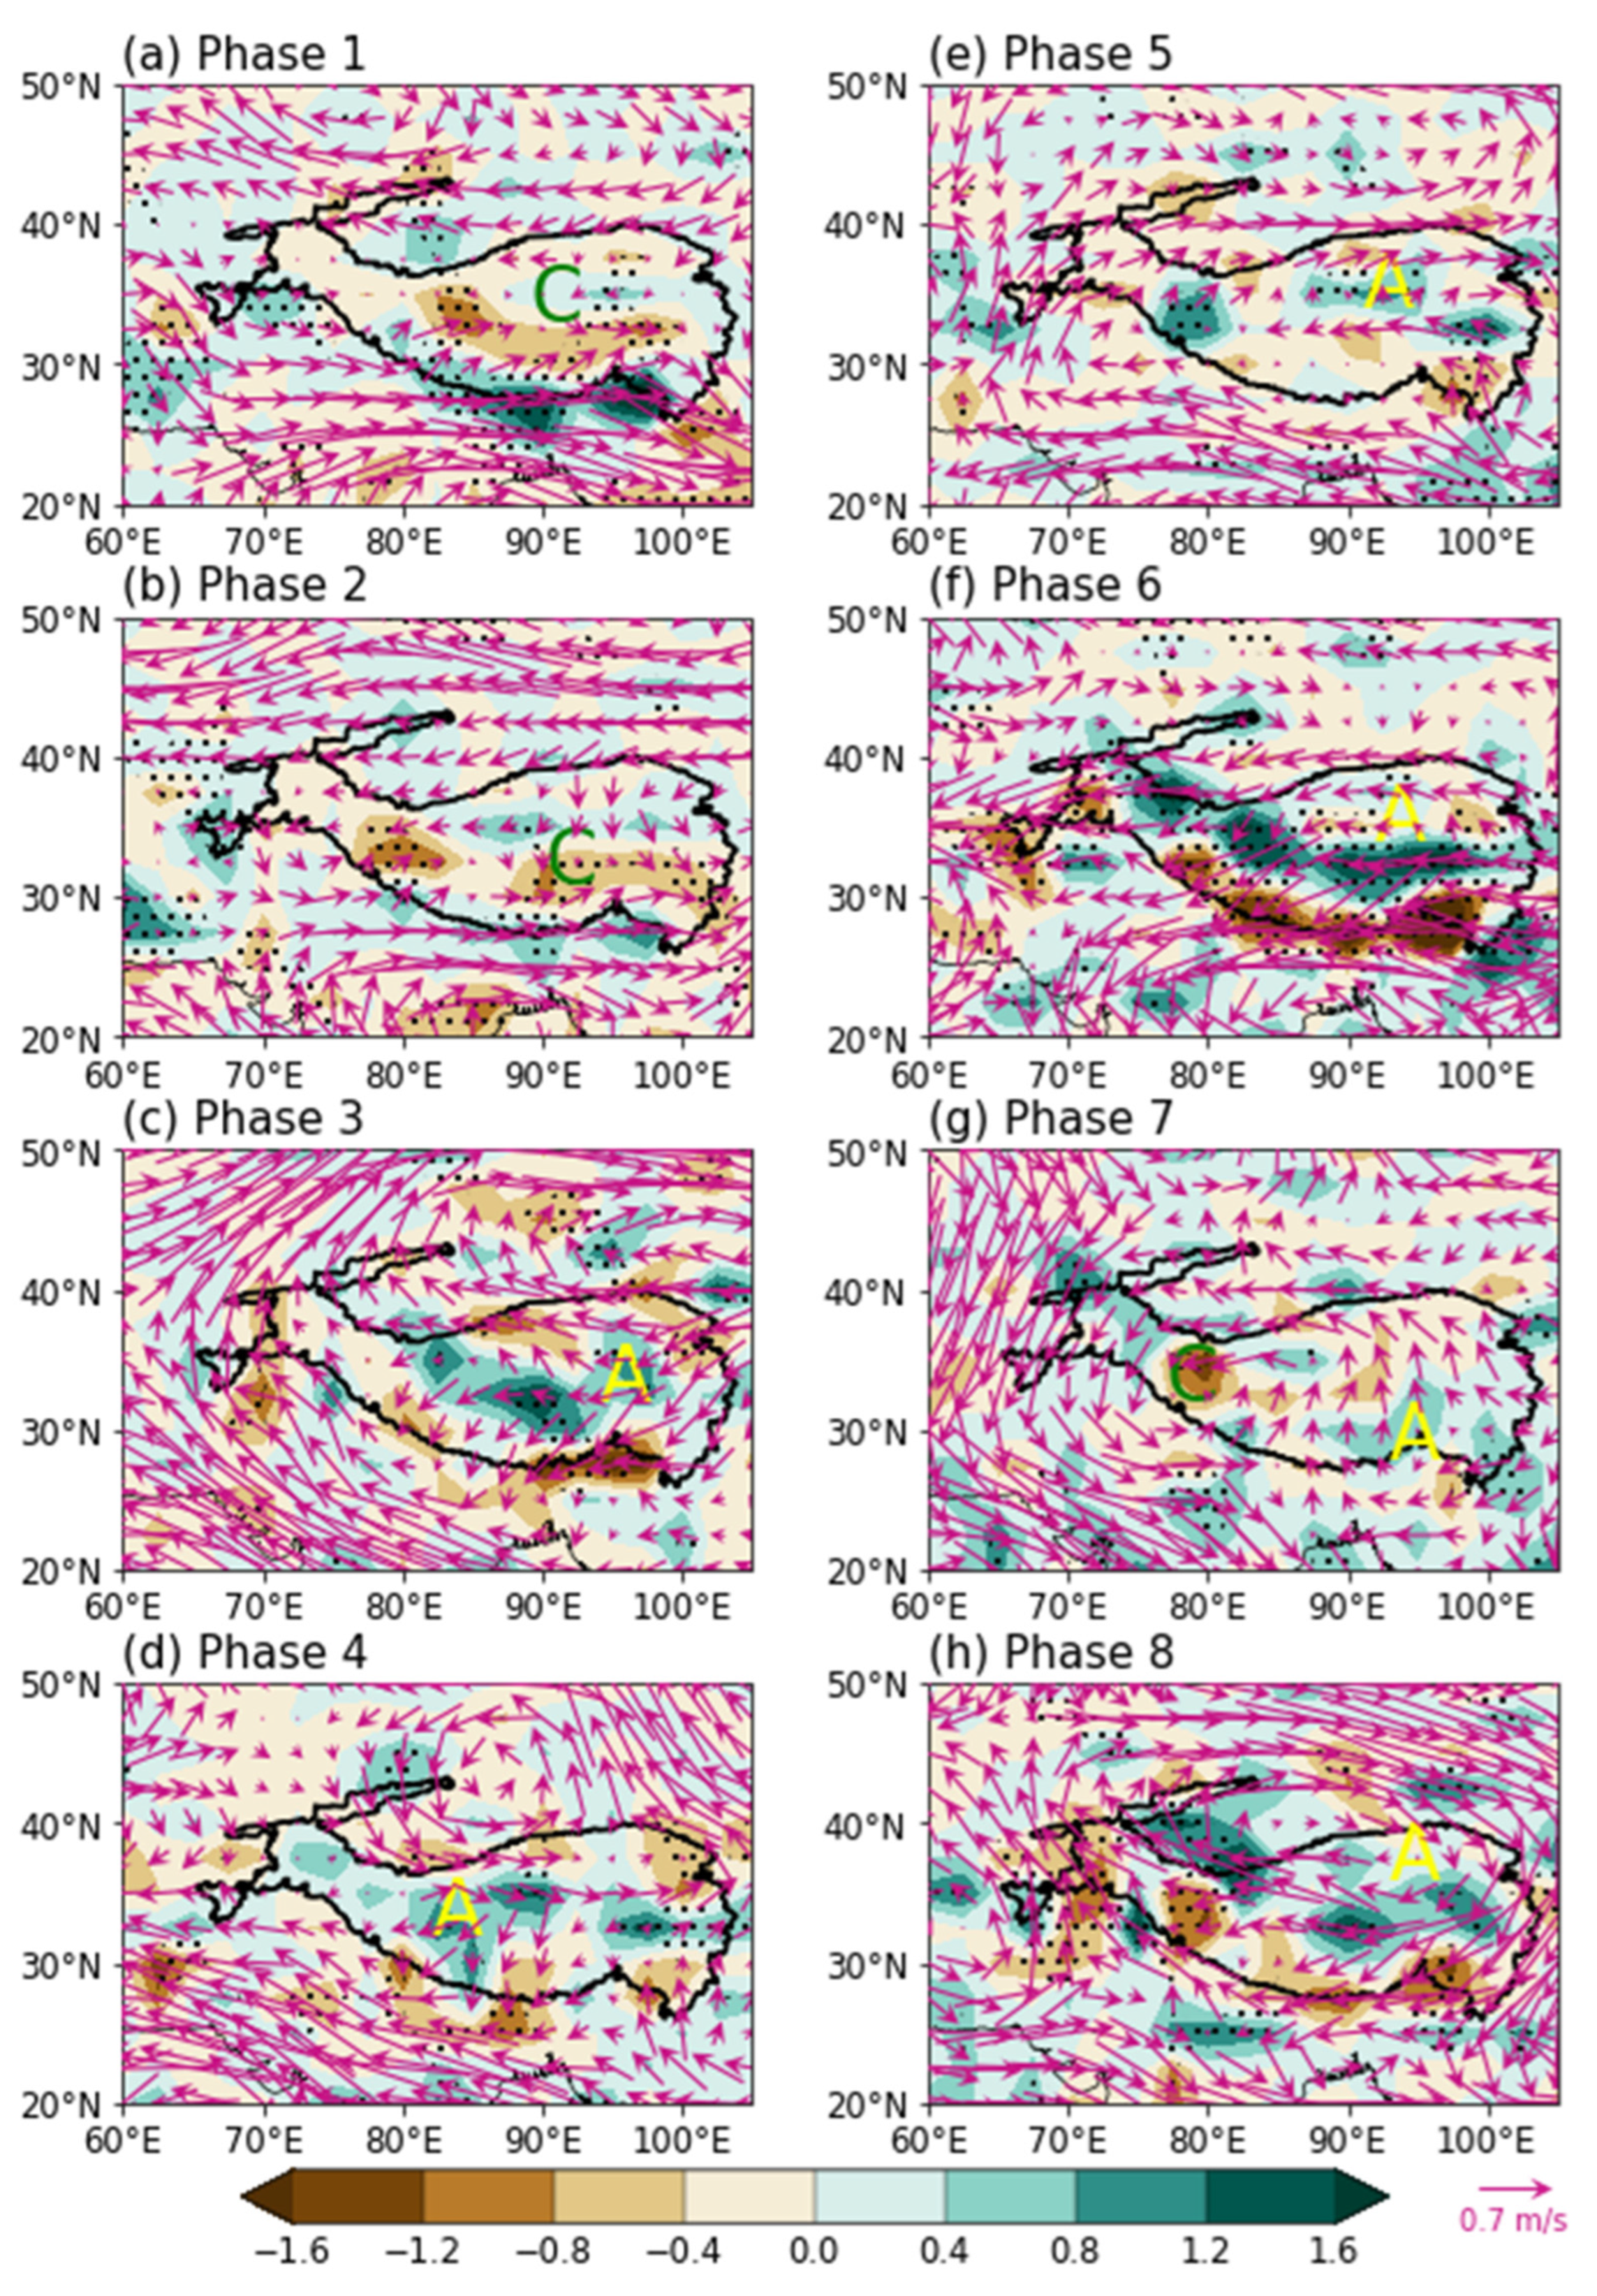
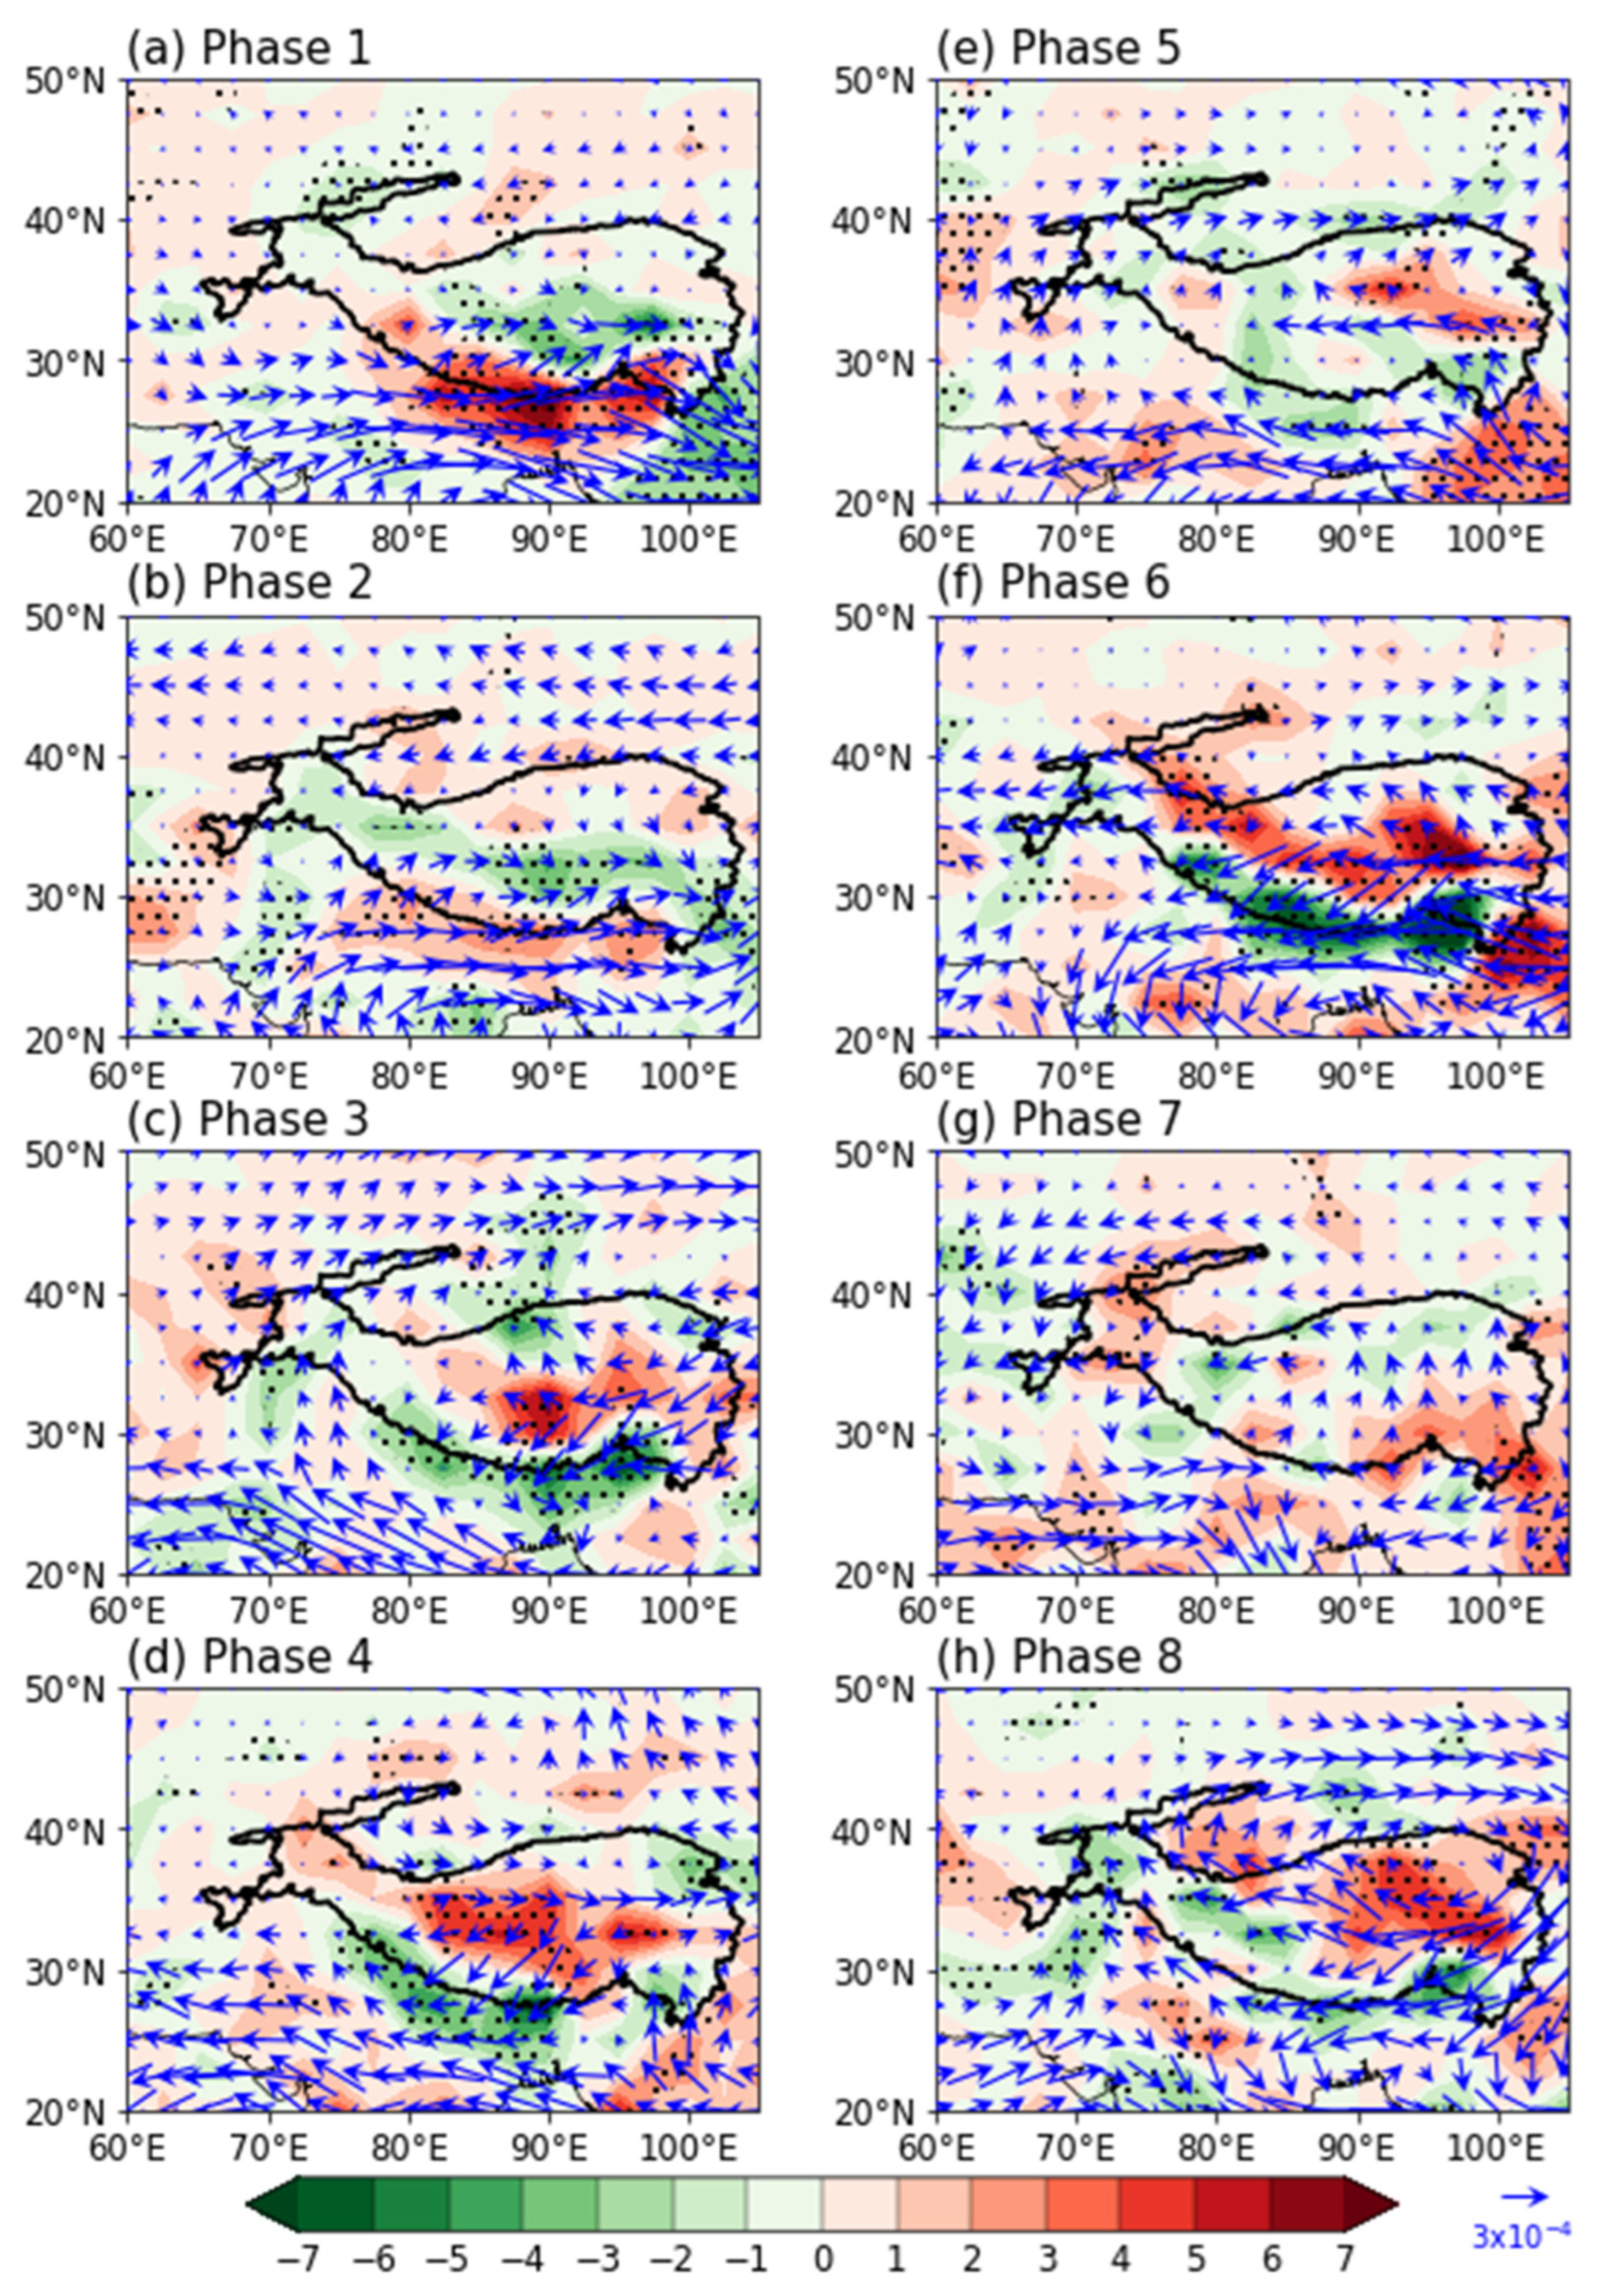
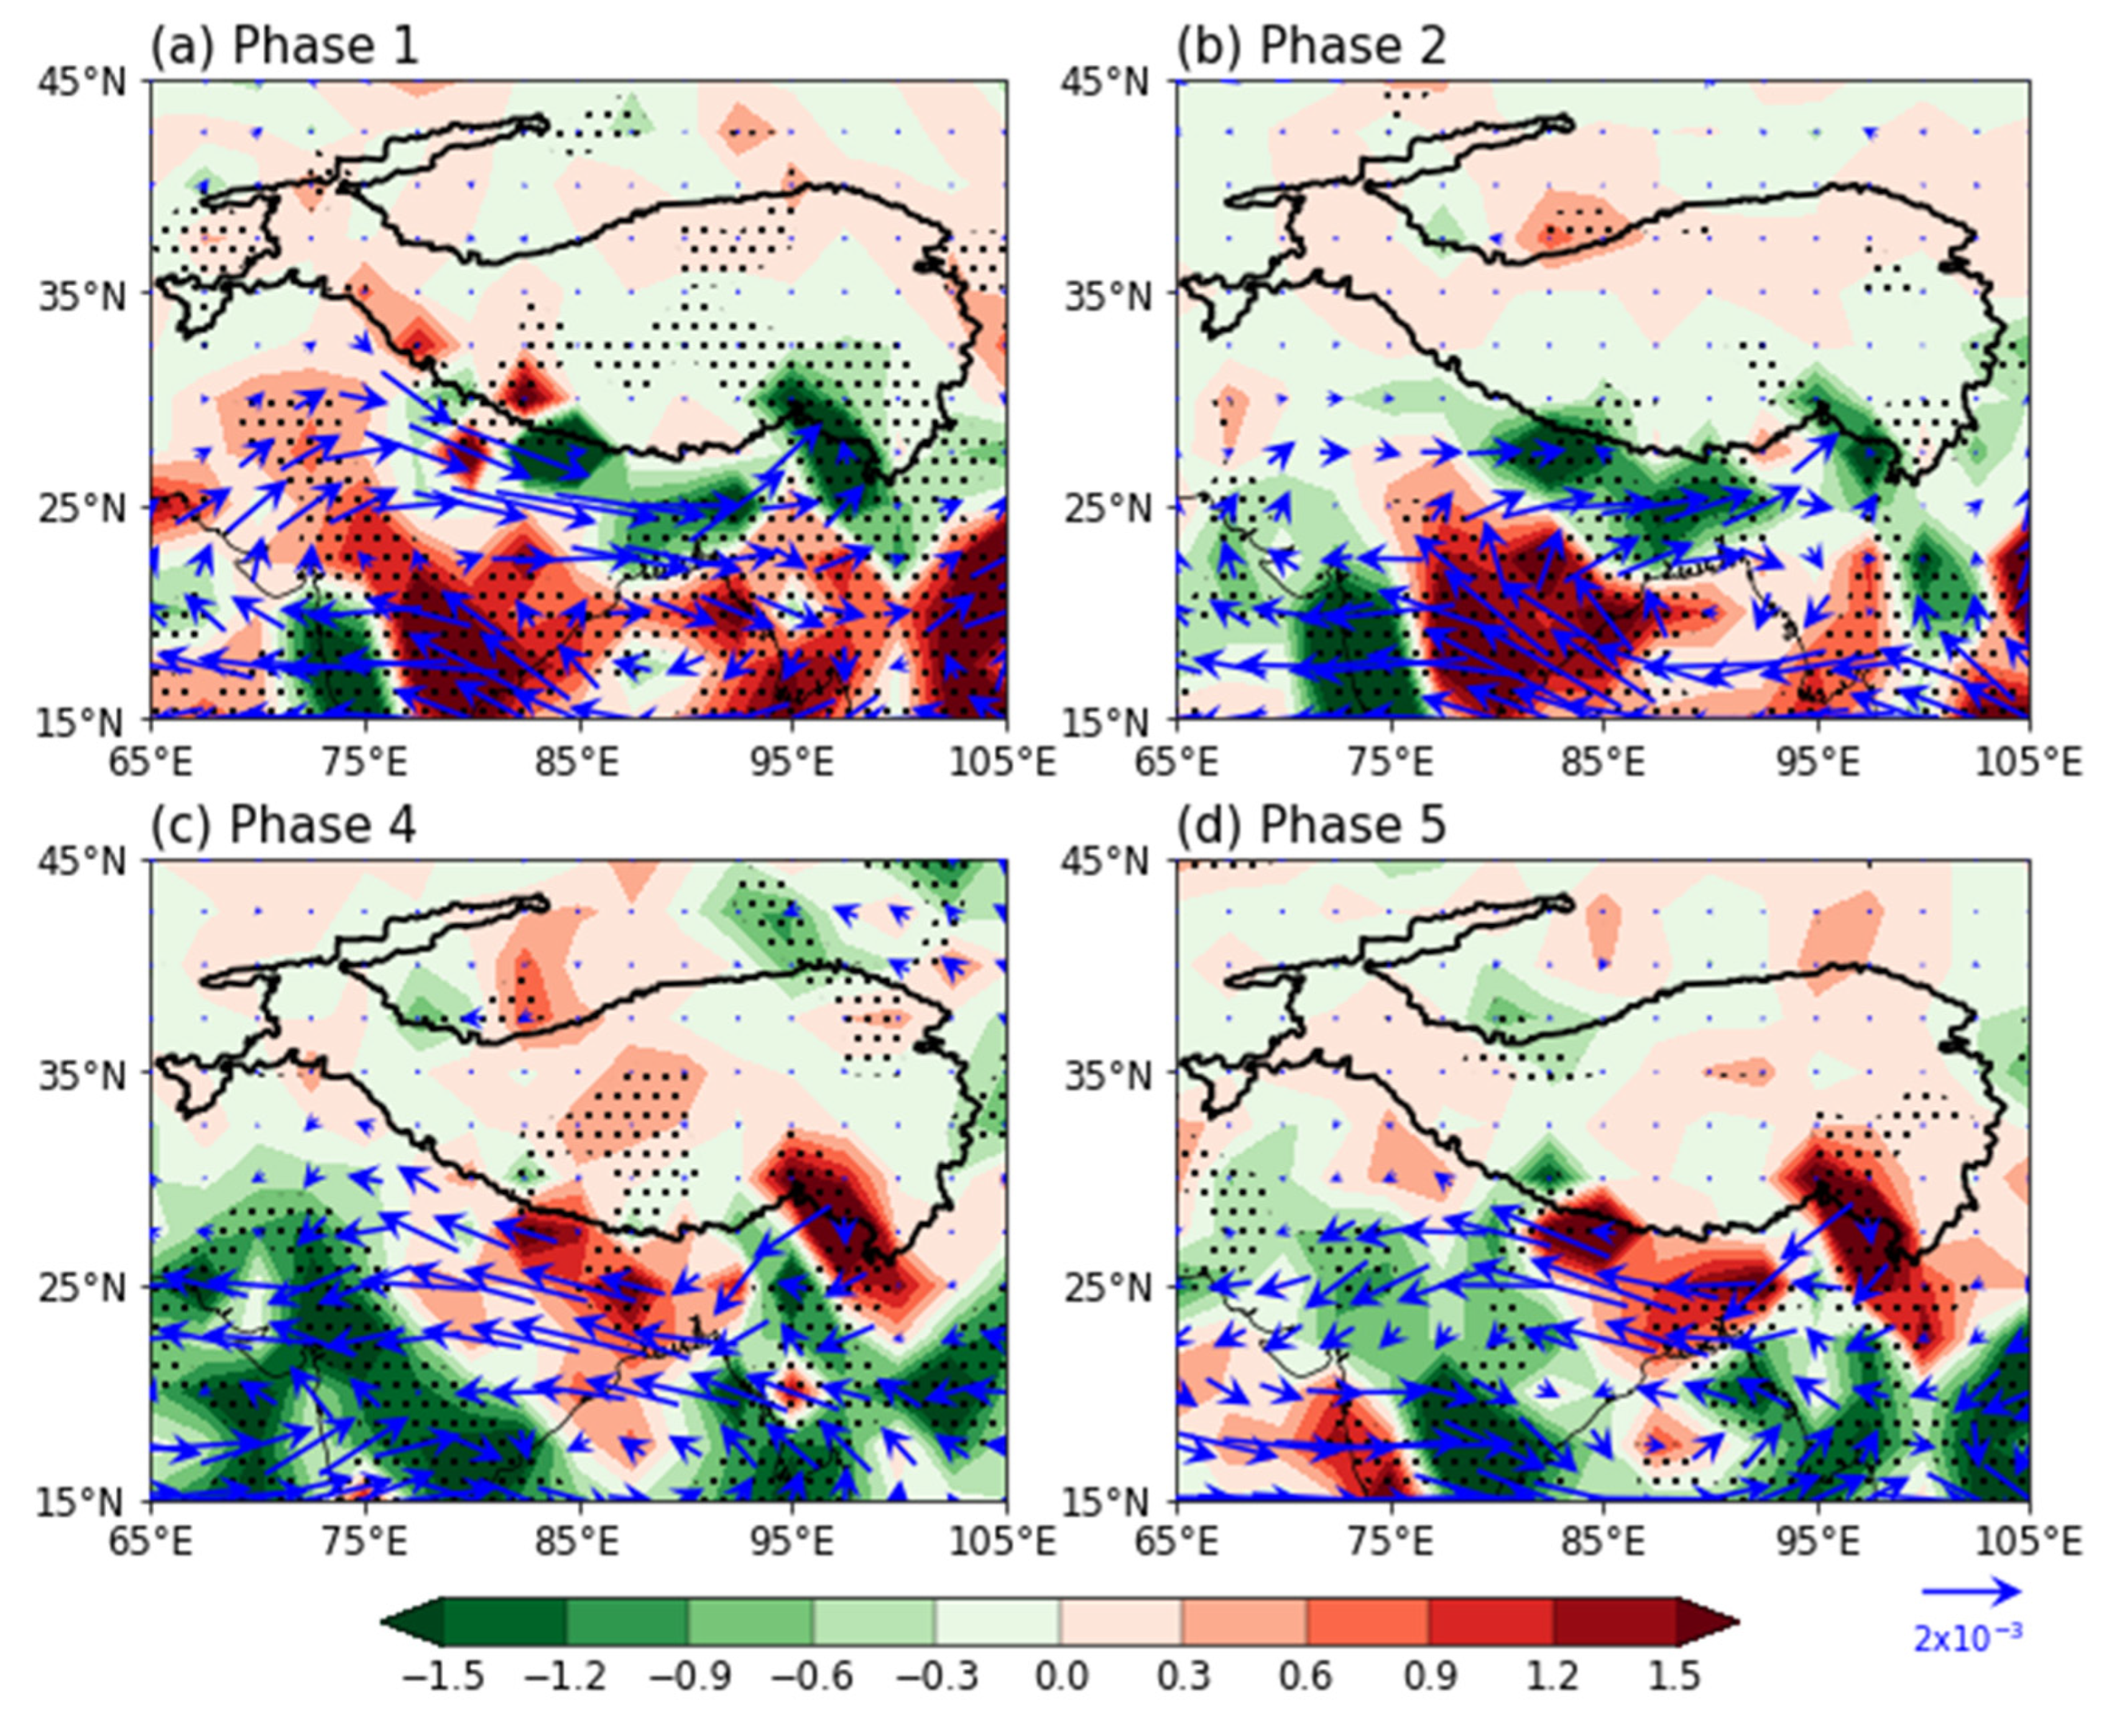
3.3. Mechanism of MJO Influencing the TP Summer Precipitation

To investigate the mechanisms by which MJO affects the spatiotemporal distributions of the TP summer precipitation, we firstly examine the evolution of large-scale atmospheric circulation anomalies excited by MJO and their links to the summer precipitation over the TP. Figure 7 and Figure 8 present the patterns of the 200 and 500 hPa circulation anomalies for each phase of MJO during summer, representing the upper- and lower-level troposphere over the TP, respectively. Clearly, upper-level anomalous anticyclonic circulation over the TP is directly associated with the diabatic heating of enhanced MJO convection over the tropical western IO in Phase 1 (Figure 7a), where the southwesterly on the west flank of the anticyclone diverges from the tropics to the eastern TP. Meanwhile, there are anomalous cyclones and convergence on the lower level, which increases the heating pump effect and induces the anomalous ascending motion and enhanced convection over the eastern TP. Influenced jointly by southwestern warm and humid air, as well as northeastern cold air, there would be more precipitation over the eastern TP, whereas the western TP receives less precipitation due to the northerly wind anomalies. As the MJO-enhanced convection moves northeastward and further strengthens (Figure 2b), the MJO-related anomalous circulation and ascending motion reach their peaks in Phase 2, corresponding to the maximum of positive precipitation anomalies. The circulation pattern, as initiated from MJO convective heating, is characterized by anomalous cyclone and convergence at the upper level when it continues eastward to the central IO. The lower-level anomalous anticyclone and divergence, corresponding to the descending motion over the eastern TP in Phase 3, is unfavorable for precipitation and, thus, causes negative TP precipitation anomalies there. The opposite conditions appear over the western TP. In Phase 4, the teleconnection atmospheric circulation extends to the western TP, with its center over the south. At the same time, note that the northeastern TP is influenced by southerlies due to the obstruction of MC, which can transport the warm and wet flow from the low-latitude ocean northward into this region, contributing to more precipitation.
From Phases 5 to 6, the anomalous circulation moves eastward and strengthens, following the MJO convection leaving the IO and entering the MC and the WP. Correspondingly, the decrease in precipitation tends to reach its maxima over the eastern TP in Phase 6. When MJO is located over the WP (Phase 7), suppressed convection dominates in the IO. Diabatic heating over the Pacific can force anomalous anticyclone and divergence in the upper troposphere and anomalous cyclone and convergence on the lower level over the northern TP, forming the ascending motion and developed convection, and is conducive to precipitation. On the contrary, the opposite anomalous circulation and precipitation in the southern TP are due to diabatic cooling over the IO. In Phase 8, with the decaying of MJO-enhanced convection, the response of atmospheric circulation over the TP gradually weakens, which becomes complicated by the control of anomalous anticyclone on both upper and lower levels. However, the still-evident high-level convergence and low-level divergence cause the descending motion and, thus, deficient precipitation over TP.
On the basis of these analyses, we find the upper- and lower-level anomalous circulations directly excited by the MJO convection are tightly coupled and exhibit a quasi-baroclinic structure in the troposphere over the TP. The anomalous ascending (descending) motion caused by such a configuration is in good agreement with the enhanced (suppressed) convection and positive (negative) precipitation anomalies. In general, when MJO is located over the western IO and the Pacific, its convective heating inspires an anomalous anticyclone in the upper troposphere and an anomalous cyclone at the lower level over the TP, and the convection anomalies over the IO and the MC tend to excite the opposite anomalous circulation patterns.
In addition to strong upward motion, abundant moisture is another necessary condition for the development of precipitation. The convergence of moisture will result in more precipitation over the TP as usual. To explore the role of water vapor in MJO impacting the TP summer precipitation, we will examine the evolution of moisture associated with MJO using the patterns of 500 hPa horizontal moisture flux and its divergence anomalies (Figure 9). Moreover, the composites of 850 hPa moisture anomalies in MJO Phases 1–2 and 4–5 are shown in Figure 10 to illustrate the source of moisture over the TP. During Phases 1–2, strong moisture divergence can be observed in the Bay of Bengal and the Indian peninsula, the anomalous water vapor from the Bay of Bengal transports northwestward and reaches the Indian Peninsula and is then carried by the southwesterly anomalous water vapor flux to the southern TP (Figure 10a,b). As a result, the enhanced moisture converges in this region and forms a moisture channel (Figure 9a,b). Abundant moisture and the ascending motion caused by the MJO-excited circulation contribute to the enhanced convection and increased precipitation anomalies over the eastern TP. In the following two phases, abnormal northeasterlies in the east of the anticyclone block the transport of water vapor, and the moisture over the TP spreads southward, forming the divergence of water vapor and is unfavorable for precipitation over the TP. Meanwhile, it should be noted that the abnormal southerlies can carry moisture from the tropical ocean to the northeastern TP in Phase 4, causing more precipitation over this region.
When the MJO convection migrates to the MC in Phase 5, the water vapor from the Bay of Bengal will also be transported into the Indochina Peninsula and then to the TP along with the southeasterlies (Figure 10d). The features in Phase 6 are opposite to those in Phase 2. It can be clearly seen that a part of the anomalous water vapor over the TP is transported northward into the northern TP, and another part is transported southward and accumulates with moisture from the Bay of Bengal at the southern edge of the TP, resulting in moisture diverging over the central TP and converging over the northern and southern TP. In Phase 7, under the influence of southerlies at the southeastern part of the cyclone, water vapor gathered over the southern TP was transported northward, forming the opposite pattern of anomalous moisture and precipitation over the southern and northern TP. At the demise of the MJO convection, the abnormal northeasterlies in Phase 8 cut off the northward moisture transport, and the water vapor over the northern TP was transported into the southwest, resulting in decreased precipitation over the northeastern and increased precipitation over the southwestern TP. The above analyses indicate that the evolution of water vapor transport coming from the Bay of Bengal plays an essential role in MJO influencing the TP summer precipitation.

4. Summary and Discussions

In this study, we examined the influence of MJO on TP precipitation during boreal summer based on observational data from 91 stations and reanalysis products. We found that MJO has a considerable impact on the summer precipitation over the TP. The distribution of the TP summer precipitation undergoes significant variations as the convective center of MJO propagates eastward from the tropical IO to the WP. There is increased (decreased) precipitation over most areas of the eastern TP in MJO Phases 1–2 (5–6), especially when the MJO-enhanced convection is located over the IO and the WP (Phases 2 and 6). Phases 4 and 8 have the most dominant negative precipitation anomalies over the southern and northeastern TP, respectively. However, the response of the TP summer precipitation to the MJO convection becomes weaker in Phases 3 and 7, when the eastward-propagating MJO-enhanced convection is located over the eastern IO and the western–central Pacific. Meanwhile, the enhanced convection in each MJO phase is highly in conjunction with the positive precipitation anomalies, and the suppressed convection is consistent with the negative precipitation anomalies over the TP.
We further investigated the mechanism of MJO impacting the TP summer precipitation. The diabatic heating of MJO-enhanced convection over the western IO and the Pacific directly excites the high-level anomalous anticyclone and low-level anomalous cyclone over the TP, while the convection over the IO and the MC forces the opposite circulation anomalies. The coupling of the upper- and lower-level anomalous divergence and circulations exhibits a quasi-baroclinic structure in the troposphere over the TP, which can induce the vertical motions and convergence of the horizontal moisture fluxes originating from the Bay of Bengal associated with the TP precipitation. The moisture flux convergence (divergence) combined with the ascending (descending) motion induced by the MJO convection contributes to the increased (decreased) precipitation anomalies over the TP.
This study advances our understanding of the relationship between MJO and the TP summer precipitation on the intraseasonal time scale and suggests the mechanism of such an MJO influence. Our results indicate that MJO provides the predictability source for the summer precipitation over the TP, and we might refer to the locations of the eastward-propagating MJO convection to predict the possible contemporaneous distribution of the TP summer precipitation. However, numerical experiments are needed to prove this hypothesis. We note that the impacts of MJO on the summer precipitation are largely inhomogeneous over the TP. However, the original cause of this phenomenon is not clear. Consequently, related works in the future should be conducted to investigate this scientific question, which is important for better understanding the influences of MJO on weather and climate over the TP. Because convectively coupled equatorial waves (CCEWs), equatorial waves and background mean flow, such as ENSO and TP uplift can affect the propagation and intensity of the MJO convection [52,53,54], it is interesting to unravel the potential role of these factors in MJO influence on TP precipitation. In addition, because precipitation over the TP can also be affected by other factors, a more in-depth study is necessary in future work.

Author Contributions

Conceptualization, H.-L.R. and L.B.; methodology, H.-L.R. and L.B.; software, L.B.; formal analysis, L.B.; validation, H.-L.R. and L.B.; investigation, L.B.; data curation, H.-L.R. and L.B.; writing—original draft preparation, L.B.; writing—review and editing, H.-L.R., L.B., Y.W. (Yuntao Wei)., Y.W. (Yuwen Wang). and B.C. All authors have read and agreed to the published version of the manuscript.

Funding

This work was jointly funded by China National Science Foundation projects (Grant Nos. 91937301, 41975094, U2242206), the Second Tibetan Plateau Scientific Expedition and Research (STEP) program (Grant No. 2019QZKK0105), and the Basic Research and Operational Special Project of CAMS (Grant No. 2021Z007).

Institutional Review Board Statement

Not applicable.

Informed Consent Statement

Not applicable.

Data Availability Statement

Not applicable.

Conflicts of Interest

The authors declare no conflict of interest.

References

  1. Madden, R.A.; Julian, P.R. Detection of a 40–50 day oscillation in the zonal wind in the tropical Pacific. J. Atmos. Sci. 1971, 28, 702–708. [Google Scholar] [CrossRef]
  2. Madden, R.A.; Julian, P.R. Description of global-scale circulation cells in the tropics with a 40–50 day period. J. Atmos. Sci. 1972, 29, 1109–1123. [Google Scholar] [CrossRef]
  3. Zhang, C. Madden-Julian Oscillation. Rev. Geophys. 2005, 43, RG2003. [Google Scholar] [CrossRef] [Green Version]
  4. Knutson, T.R.; Weickmann, K.M.; Kutzbach, J.E. Global-scale intraseasonal oscillations of outgoing longwave radiation and 250 mb zonal wind during Northern Hemisphere summer. Mon. Weather Rev. 1986, 114, 605–623. [Google Scholar] [CrossRef]
  5. Lau, K.M.; Chan, P.H. The 40–50 day oscillation and the El Niño/Southern Oscillation: A new perspective. Bull. Am. Meteorol. Soc. 1986, 67, 533–534. [Google Scholar] [CrossRef]
  6. Salby, M.L.; Hendon, H.H. Intraseasonal behavior of clouds, temperature, and motion in the tropics. J. Atmos. Sci. 1994, 51, 2207–2224. [Google Scholar] [CrossRef]
  7. Sperber, K.R. Propagation and the vertical structure of the Madden–Julian oscillation. Mon. Weather Rev. 2003, 131, 3018–3037. [Google Scholar] [CrossRef]
  8. Li, T.; Zhou, C. Planetary scale selection of the Madden–Julian oscillation. J. Atmos. Sci. 2009, 66, 2429–2443. [Google Scholar] [CrossRef]
  9. Chen, G.; Wang, B. Does the MJO have a westward group velocity? J. Clim. 2018, 31, 2435–2443. [Google Scholar] [CrossRef]
  10. Chen, G.; Wang, B. Dynamic moisture mode versus moisture mode in MJO dynamics: Importance of the wave feedback and boundary layer convergence feedback. Clim. Dyn. 2019, 52, 5127–5143. [Google Scholar] [CrossRef]
  11. Wei, Y.; Liu, F.; Mu, M.; Ren, H.L. Planetary scale selection of the Madden–Julian Oscillation in an air-sea coupled dynamic moisture model. Clim. Dyn. 2018, 50, 3441–3456. [Google Scholar] [CrossRef]
  12. Liebmann, B.; Hendon, H.H.; Glik, J.D. The relationship between tropical cyclones of the western Pacific and Indian oceans and the Madden-Julian Oscillation. J. Meteorol. Soc. Japan. Ser. II 1994, 72, 401–412. [Google Scholar] [CrossRef] [Green Version]
  13. Cassou, C. Intraseasonal interaction between the Madden–Julian oscillation and the North Atlantic Oscillation. Nature 2008, 455, 523–527. [Google Scholar] [CrossRef] [PubMed]
  14. Seo, K.H.; Lee, H.J. Mechanisms for a PNA-like teleconnection pattern in response to the MJO. J. Atmos. Sci. 2017, 74, 1767–1781. [Google Scholar] [CrossRef]
  15. Fu, X.; Hsu, P.C. Extended-range ensemble forecasting of tropical cyclogenesis in the northern Indian Ocean: Modulation of Madden-Julian Oscillation. Geophys. Res. Lett. 2011, 38, 15. [Google Scholar] [CrossRef] [Green Version]
  16. Xavier, P.; Rahmat, R.; Cheong, W.K.; Wallace, E. Influence of Madden-Julian Oscillation on Southeast Asia rainfall extremes: Observations and predictability. Geophys. Res. Lett. 2014, 41, 4406–4412. [Google Scholar] [CrossRef]
  17. Ren, H.-L.; Ren, P. Impact of Madden-Julian Oscillation on winter extreme rainfall in the southern China: Observations and predictability in CFSv2. Atmosphere 2017, 8, 192. [Google Scholar] [CrossRef] [Green Version]
  18. Shen, Y.-y.; Ren, H.; Li, W.; Zhang, Y.; Zuo, J. Relationship between summer low-frequency rainfall over southern China and propagation of tropical intraseasonal oscillation. J. Trop. Meteorol. 2018, 24, 92–101. [Google Scholar] [CrossRef]
  19. Wang, Y.; Ren, H.-L.; Wei, Y.; Jin, F.-F.; Ren, P.; Gao, L.; Wu, J. MJO Phase swings modulate the recurring latitudinal shifts of the 2020 extreme summer-monsoon rainfall around Yangtse. J. Geophys. Res. Atmos. 2022, 127, e2021JD036011. [Google Scholar] [CrossRef]
  20. Lin, A.-L.; Gu, D.-J.; Li, C.-H.; Zheng, B. Impact of equatorial MJO activity on summer monsoon onset in the South China Sea. Chin. J. Geophys. 2016, 59, 28–44. (In Chinese) [Google Scholar] [CrossRef]
  21. Rong, X.; Zhang, R.; Li, T.; Su, J. Upscale feedback of high-frequency winds to ENSO. Q. J. R. Meteorol. Soc. 2011, 137, 894–907. [Google Scholar] [CrossRef]
  22. Chen, M.; Li, T.; Shen, X.; Wu, B. Relative roles of dynamic and thermodynamic processes in causing evolution asymmetry between El Niño and La Niña. J. Clim. 2016, 29, 2201–2220. [Google Scholar] [CrossRef]
  23. Wei, Y.; Ren, H.L. Modulation of ENSO on fast and slow MJO modes during boreal winter. J. Clim. 2019, 32, 7483–7506. [Google Scholar] [CrossRef]
  24. Wei, Y.; Liu, F.; Ren, H.L.; Chen, G.; Feng, C.; Chen, B. Western Pacific premoistening for eastward-propagating BSISO and its ENSO modulation. J. Clim. 2022, 35, 4979–4996. [Google Scholar] [CrossRef]
  25. Muhammad, F.R.; Lubis, S.W.; Setiawan, S. Impacts of the Madden–Julian oscillation on precipitation extremes in Indonesia. Int. J. Climatol. 2021, 41, 1970–1984. [Google Scholar] [CrossRef]
  26. Zhang, L.; Wang, B.; Zeng, Q. Impact of the Madden–Julian oscillation on summer rainfall in southeast China. J. Clim. 2009, 22, 201–216. [Google Scholar] [CrossRef]
  27. Jia, X.; Chen, L.; Ren, F.; Li, C. Impacts of the MJO on winter rainfall and circulation in China. Adv. Atmos. Sci. 2011, 28, 521–533. [Google Scholar] [CrossRef]
  28. Li, T.; Yan, X.; Ju, J.H. Impact of MJO activities on precipitation in May over Yunnan. Chin. J. Atmos. Sci. 2012, 36, 1101–1111. [Google Scholar]
  29. Lü, J.; Ju, J.; Ren, J.; Gan, W. The influence of the Madden-Julian Oscillation activity anomalies on Yunnan’s extreme drought of 2009–2010. Sci. China Earth Sci. 2012, 55, 98–112. [Google Scholar] [CrossRef]
  30. Qiu, J. The third pole. Nature 2008, 454, 393–396. [Google Scholar] [CrossRef] [Green Version]
  31. Xu, X.; Lu, C.; Shi, X.; Gao, S. World water tower: An atmospheric perspective. Geophys. Res. Lett. 2008, 35, 20. [Google Scholar] [CrossRef]
  32. Maussion, F.; Scherer, D.; Mölg, T.; Collier, E.; Curio, J.; Finkelnburg, R. Precipitation seasonality and variability over the Tibetan Plateau as resolved by the High Asia Reanalysis. J. Clim. 2014, 27, 1910–1927. [Google Scholar] [CrossRef] [Green Version]
  33. Gao, Y.; Xu, J.; Chen, D. Evaluation of WRF mesoscale climate simulations over the Tibetan Plateau during 1979–2011. J. Clim. 2015, 28, 2823–2841. [Google Scholar] [CrossRef] [Green Version]
  34. Xie, C.; Li, M.; Zhang, X. Characteristics of summer atmospheric water resources and its causes over the Tibetan Plateau in recent 30 years. J. Nat. Resour. 2014, 29, 979–989. [Google Scholar]
  35. Wang, M.; Duan, A. Quasi-biweekly oscillation over the Tibetan Plateau and its link with the Asian summer monsoon. J. Clim. 2015, 28, 4921–4940. [Google Scholar] [CrossRef]
  36. Li, L.; Zhang, R.; Wen, M.; Duan, J.; Qi, Y. Characteristics of the Tibetan Plateau vortices and the related large-scale circulations causing different precipitation intensity. Theor. Appl. Climatol. 2019, 138, 849–860. [Google Scholar] [CrossRef]
  37. Li, M.; Zhang, X.; Xie, C. Cause analysis on typical abnormal year of water vapor in the upper troposphere over Qinghai-Xizang Plateau. Plateau Meteor. 2014, 33, 1197–1203. [Google Scholar]
  38. Ren, Q.; Zhou, C.; He, J.; Cen, S.; Deng, M. Impact of preceding Indian Ocean sea surface temperature anomaly on water vapor content over the Tibetan Plateau moist pool in summer and its possible reason. Chin. J. Atmos. Sci. 2017, 41, 648–658. [Google Scholar]
  39. Wang, Z.; Duan, A.; Yang, S.; Ullah, K. Atmospheric moisture budget and its regulation on the variability of summer precipitation over the Tibetan Plateau. J. Geophys. Res. Atmos. 2017, 122, 614–630. [Google Scholar] [CrossRef]
  40. Li, W.; Guo, W.; Hsu, P.C.; Xue, Y. Influence of the Madden–Julian oscillation on Tibetan Plateau snow cover at the intraseasonal time-scale. Sci. Rep. 2016, 6, 30456. [Google Scholar] [CrossRef] [Green Version]
  41. Zhao, F.-H.; Li, G.-P.; Huang, C.-H.; Liu, X.-R. Modulation of madden-julian oscillation on tibetan plateau vortex. J. Trop. Meteorol. 2016, 22, 30–41. [Google Scholar] [CrossRef]
  42. Ren, H.-L.; Shen, Y.Y. A new look at impacts of MJO on weather and climate in China. Adv. Meteorol. Sci. Technol. 2016, 6, 97–105. [Google Scholar]
  43. Liebmann, B.; Smith, C.A. Description of a complete (interpolated) outgoing longwave radiation dataset. Bull. Am. Meteorol. Soc. 1996, 77, 1275–1277. [Google Scholar] [CrossRef]
  44. Hersbach, H.; Bell, B.; Berrisford, P.; Hirahara, S.; Horányi, A.; Muñoz-Sabater, J.; Nicolas, J.; Peubey, C.; Radu, R.; Schepers, D.; et al. The ERA5 global reanalysis. Q. J. R. Meteorol. Soc. 2020, 146, 1999–2049. [Google Scholar] [CrossRef]
  45. Wheeler, M.C.; Hendon, H.H. An all-season real-time multivariate MJO index: Development of an index for monitoring and prediction. Mon. Weather Rev. 2004, 132, 1917–1932. [Google Scholar] [CrossRef]
  46. Gottschalck, J.; Wheeler, M.; Weickmann, K.; Vitart, F.; Savage, N.; Lin, H.; Hendon, H.; Waliser, D.; Sperber, K.; Nakagawa, M.; et al. A framework for assessing operational Madden–Julian oscillation forecasts: A CLIVAR MJO working group project. Bull. Am. Meteorol. Soc. 2010, 91, 1247–1258. [Google Scholar] [CrossRef] [Green Version]
  47. Wei, Y.; Mu, M.; Ren, H.L.; Fu, J.X. Conditional nonlinear optimal perturbations of moisture triggering primary MJO initiation. Geophys. Res. Lett. 2019, 46, 3492–3501. [Google Scholar] [CrossRef]
  48. Wei, Y.; Ren, H.L.; Mu, M.; Fu, J.X. Nonlinear optimal moisture perturbations as excitation of primary MJO events in a hybrid coupled climate model. Clim. Dyn. 2020, 54, 675–699. [Google Scholar] [CrossRef] [Green Version]
  49. Mariotti, A.; Baggett, C.; Barnes, E.A.; Becker, E.; Butler, A.; Collins, D.C.; Dirmeyer, P.A.; Ferranti, L.; Johnson, N.C.; Jones, J.; et al. Windows of opportunity for skillful forecasts subseasonal to seasonal and beyond. Bull. Am. Meteorol. Soc. 2020, 101, E608–E625. [Google Scholar] [CrossRef] [Green Version]
  50. Mao, J.; Chan, J.C. Intraseasonal variability of the South China Sea summer monsoon. J. Clim. 2005, 18, 2388–2402. [Google Scholar] [CrossRef]
  51. Pan, W.; Mao, J.; Wu, G. Characteristics and mechanism of the 10–20-day oscillation of spring rainfall over southern China. J. Clim. 2013, 26, 5072–5087. [Google Scholar] [CrossRef] [Green Version]
  52. Lubis, S.W.; Jacobi, C. The modulating influence of convectively coupled equatorial waves (CCEWs) on the variability of tropical precipitation. Int. J. Climatol. 2015, 35, 1465–1483. [Google Scholar] [CrossRef]
  53. Peatman, S.C.; Schwendike, J.; Birch, C.E.; Marsham, J.H.; Matthews, A.J.; Yang, G.-Y. A local-to-large scale view of Maritime Continent rainfall: Control by ENSO, MJO and equatorial waves. J. Clim. 2021, 34, 8933–8953. [Google Scholar] [CrossRef]
  54. Yang, Y.M.; Lee, J.Y.; Wang, B. the Tibetan Plateau Uplift is crucial for eastward propagation of Madden-Julian oscillation. Sci. Rep. 2019, 9, 15478. [Google Scholar] [CrossRef] [PubMed]
Figure 1. (a) Monthly variation in total rainfall and (b) spatial pattern of climatological summer (JJA) precipitation over TP during 1980–2020.
Atmosphere 14 00070 g001
Figure 2. Composite patterns of OLR anomalies (shading) (W m−2) in MJO Phases 1–8 (ah). The dots indicate that the values are statistically significant at the 95% confidence level. The thick black curves illustrate TP.
Atmosphere 14 00070 g002
Figure 3. The percentage of total precipitation during the MJO days relative to the summer means in MJO Phases 1–8 (ah) over TP during 1980–2020.
Atmosphere 14 00070 g003
Figure 4. MJO/RMM contribution to the total precipitation variability over TP during boreal summer of 1980–2020. The color circles show the R values derived based on Equation (1). The blue triangles indicate significant R values at the 95% confidence level based on the Student’s t-test.
Atmosphere 14 00070 g004
Figure 5. Composites of the station (dots) precipitation anomalies (mm/day) in MJO Phases 1–8 (ah) over TP in boreal summer during 1980–2020.
Atmosphere 14 00070 g005
Figure 6. Composites of CN05.1-gridded precipitation anomalies (mm) in MJO Phases 1–8 (ah) over TP in boreal summer during 1980–2020. Dots indicate values are statistically significant at the 95% confidence level.
Atmosphere 14 00070 g006
Figure 7. Composite patterns of the 200 hPa divergence (shading; 10−6 s−1) and horizontal wind (vectors; m/s) anomalies in MJO Phases 1–8 (ah). The dots indicate that values are statistically significant at the 95% confidence level. The notations with C and A indicate anomalous cyclone and anticyclone, respectively.
Atmosphere 14 00070 g007
Figure 8. Composite patterns of the 500 hPa divergence (shading; 10−6 s−1) and horizontal wind (vectors; m/s) anomalies in MJO Phases 1–8 (ah). The dots indicate that values are statistically significant at the 95% confidence level. The notations with C and A indicate anomalous cyclone and anticyclone, respectively.
Atmosphere 14 00070 g008
Figure 9. Composite patterns of the 500 hPa anomalous horizontal moisture fluxes (vectors; kg m−1 s−2) and their divergence (shading; 10−10 kg m−2 s−2) in MJO Phases 1–8 (ah). The dots indicate values that are statistically significant at the 95% confidence level. The thick black curves show the Tibetan Plateau.
Atmosphere 14 00070 g009
Figure 10. Composite patterns of the 850 hPa anomalous horizontal moisture fluxes (vectors; kg m−1 s−2) and their divergence (shading; 10−9 kg m−2 s−2) in MJO Phases (a,b) 1–2 and (c,d) 4–5. The dots indicate that values are statistically significant at the 95% confidence level. The thick black curves show the Tibetan Plateau.
Atmosphere 14 00070 g010
Table 1. The case numbers of MJO phases in JJA.
Phase 1Phase 2Phase 3Phase 4Phase 5Phase 6Phase 7Phase 8
496371180190242275179182
Disclaimer/Publisher’s Note: The statements, opinions and data contained in all publications are solely those of the individual author(s) and contributor(s) and not of MDPI and/or the editor(s). MDPI and/or the editor(s) disclaim responsibility for any injury to people or property resulting from any ideas, methods, instructions or products referred to in the content.

