Article

An Improved Strategy for Real-Time Troposphere Estimation and Its Application in the Severe Weather Event Monitoring

1
School of Remote Sensing and Geomatics Engineering, Nanjing University of Information Science and Technology, Nanjing 210044, China
2
School of Geographic Information and Tourism, Chuzhou University, Chuzhou 239000, China
*
Author to whom correspondence should be addressed.
Atmosphere 2023, 14(1), 46; https://doi.org/10.3390/atmos14010046
Submission received: 1 December 2022 / Revised: 20 December 2022 / Accepted: 23 December 2022 / Published: 27 December 2022
(This article belongs to the Special Issue Advanced GNSS for Severe Weather Events and Climate Monitoring)

Abstract

:
The water vapor content in the atmosphere is highly correlated with rainfall events, which can be used as a data source for rainfall prediction or drought monitoring. The GNSS PPP (Precise Point Positioning) technique can be used to estimate the troposphere ZWD (Zenith Wet Delay) parameter which can be converted into precipitable water vapor (PWV). In this study, we first investigate the impacts of the weighting strategies, observation noise settings, and gradient estimation on the accuracy of ZWD and positions. A refined strategy is proposed for the troposphere estimation with uncombined raw PPP model, down-weighting of Galileo/GLONASS/BDS code observation by a factor of 3, using a sine2-type elevation-dependent weighting function and estimating the horizontal gradients. Based on the strategy, the correlation of the estimated tropospheric parameters with the rainfall is analyzed based on the data from the “7.20” rainstorm in Henan Province, China. The PWV is first calculated based on the hourly global pressure and temperature (HGPT) model and compared with the results from ERA5 products. Results show their good consistency during the rainfall period or the normal period with a standard deviation of 3 mm. Then, the high correlation between the PWV and the heavy rain rainfall event is validated. Results show that the accumulated PWV maintains a high level before the rainstorm if a sustainable water supply is available, while it decreased rapidly after the rainfall. In comparison, the horizontal gradients and the satellite residuals are less correlated with the water vapor content. However, the gradients can be used to indicate the horizontal asymmetry of the water vapor in the atmosphere.

1. Introduction

The troposphere usually refers to the non-dispersive atmosphere, which cannot be eliminated by combinations of signals differing in frequency. Global Navigation Satellite System (GNSS) has been a promising tool for obtaining tropospheric parameters [1]. Precise point positioning (PPP) with an uncombined model can simultaneously estimate the troposphere and its horizontal gradients by making full use of the available frequencies [2], which can be used for water vapor detection and weather forecasting. The tropospheric parameter estimated from GNSS measurements is usually expressed as a function of zenith hydrostatic delay (ZHD), zenith wet delay (ZWD), and corresponding mapping functions [3]. The generally used empirical model for ZHD correction is the Saastamonien [4], which can achieve a millimeter level. An improved ZTD model is also made available by considering the height scale factor [5]. Users can select the proper model for a prior tropospheric correction, then the ZWD and horizontal gradient parameters can be determined with a properly functional and stochastic model in PPP.
The ZWD can be converted to precipitable water vapor (PWV) value if the weighted mean temperature (Tm) of atmospheric can be derived based on surface air temperature measurements [6]. However, only a limited number of GNSS stations are installed with meteorological sensors and most of the data are not open access. An alternative method is to obtain the meteorological data from the numerical weather models (NWMs) [7]. The latest reanalysis data (ERA5) from the European Center for Medium-Range Weather Forecast (ECMWF) contains meteorological parameters with a three-dimensional grid-based format. To make better use of the NWMs, a GNSS Meteorological Ensemble Tools (GMET) online interface (http://gmet.users.sgg.whu.edu.cn, accessed on 26 December 2022) has been developed by the group from Wuhan University. The GMET interface is able to calculate tropospheric parameters from MWMs or radiosonde data at the user-required sites or regions. Meanwhile, the WMF (Wuhan University Mapping Function) model grid products (1 × 1) and real-time ZTD grid products over China are also available. The derived meteorological parameters have been proved to obtain high-accuracy PWV over China [8,9,10,11]. Liu et al. also validated the high consistency and accuracy of ZTD from three different types of reanalysis data by comparing them to the IGS products [12]. Based on the meteorological parameters from the NWMs, the PWV can be derived. Researchers also established the global grid empirical model to obtain the Tm [13] or other meteorological parameters [14]. Mateus et al. developed an hourly global pressure and temperature (HGPT) model based on the full spatial and temporal resolution of the new ERA5 reanalysis products. The model is proven to improve the accuracy of Tm by 33% compared to recent global models and can be easily used for real-time and post-processing applications.
Many studies have investigated the relationship between PWV values and rainfalls, aiming at improving the accuracy of rainfall forecasting with dense GNSS networks. The feasibility of real-time PPP-derived PWV for rainfall monitoring has been validated [15,16,17]. Manandhar et al. proposed a rainfall prediction algorithm for the tropical region using the maximum PWV value and maximum rate of increment criteria and validated its feasibility [18]. Li et al. proposed a multi-factors model for rainfall prediction and validated its feasibility [19]. The PWV only represents the water vapor content along the zenith direction and does not include the water vapor along individual satellite paths. To improve the spatial resolution of the GNSS-derived tropospheric information, the atmospheric gradients and the tropospheric residuals are analyzed and proved to be a promising tool for sensing the water vapor in the atmosphere [20,21,22].
Obtaining the precise tropospheric parameters in real-time is the precondition to promote the application of GNSS for heavy rainfall monitoring or short-term weather forecasting. In this article, different strategies for the PPP tropospheric parameters estimation are compared and validated with respect to the IGS final products. After identifying an optimal strategy, precise ZWD/PWV are derived and compared to the ERA5 model. Then, the correlations of the tropospheric parameters, including the PWV, horizontal gradient and atmospheric residuals, with respect “7.20” Zhengzhou heavy rainfall event are analyzed. The results can provide technical support for the application of GNSS tropospheric parameters on rainstorm monitoring.

2. Methodology

The raw code and carrier phase observations for satellite s to receiver r at observation frequency i can be expressed as:
P r , i s = ρ + r s d t r d t s + T r s + μ i I r , 1 s + ε i , P s L r , i s = ρ + r s d t r d t s + T r s μ i I r , 1 s + λ i N r , i s + ε i , L s
where P r , i s and L r , i s denote the raw code and carrier phase observations in meters, respectively, ρ r s denotes the geometric distance between the receiver and the satellite, d t r denotes the receiver clock error, d t s denotes the satellite clock error, I r , 1 s denotes the slant ionospheric delay on the first frequency, μ i = f 1 2 / f i 2 denotes the frequency-related constant value, T r s denotes the slant tropospheric delays, N r , i s and λ i denote the phase ambiguities and corresponding wavelength, ε i , P s and ε i , L s denote the sum of multipath errors and measurement noises for code and phase observables after applying the antenna phase center offset/variations and phase wind up corrections, etc. The precise satellite orbits and clocks are usually corrected with external IGS/MGEX final or real-time products. The other terms are estimated as unknown parameters in the PPP model with proper stochastic model. Normally, the slant tropospheric delay T r s can be written as the sum of hydrostatic, wet and gradient delays:
T r s = m H Z H D + m W Z W D + m G [ G N cos ( A ) + G E sin ( A ) ]
A is the azimuth angle of the satellite; Z H D and Z W D are hydrostatic and wet contributions of the ZTD; m H and m W are corresponding hydrostatic and wet mapping functions; m G is the gradients mapping function; G N and G E are corresponding horizontal north and east gradient parameters. The Z H D can be corrected using empirical models. Then the tropospheric wet delay and horizontal gradients are usually estimated as unknowns along with other parameters.
The estimated Z W D can be converted to the P W V by multiplying a conversion factor, which can be written as:
P W V = Π Z W D = 10 6 | ρ w R v ( k 3 T m + k 2 ) | 1 Z W D
Π is the water vapor conversion factor; ρ w = 1 × 10 3 k g / m 3 is the density of liquid water; R v = 461.524 J / k g is the vapor gas constant; k 3 and k 2 are empirical values; and Tm is the atmospheric weighted mean temperature, which can be calculated using a linear combination:
T m = α + β T s
where α and β are the linear regression coefficients. The coefficients are bilinearly interpolated in space using Python subroutine along with the coefficient files in binary format provided by the hourly global pressure and temperature (HGPT) model.

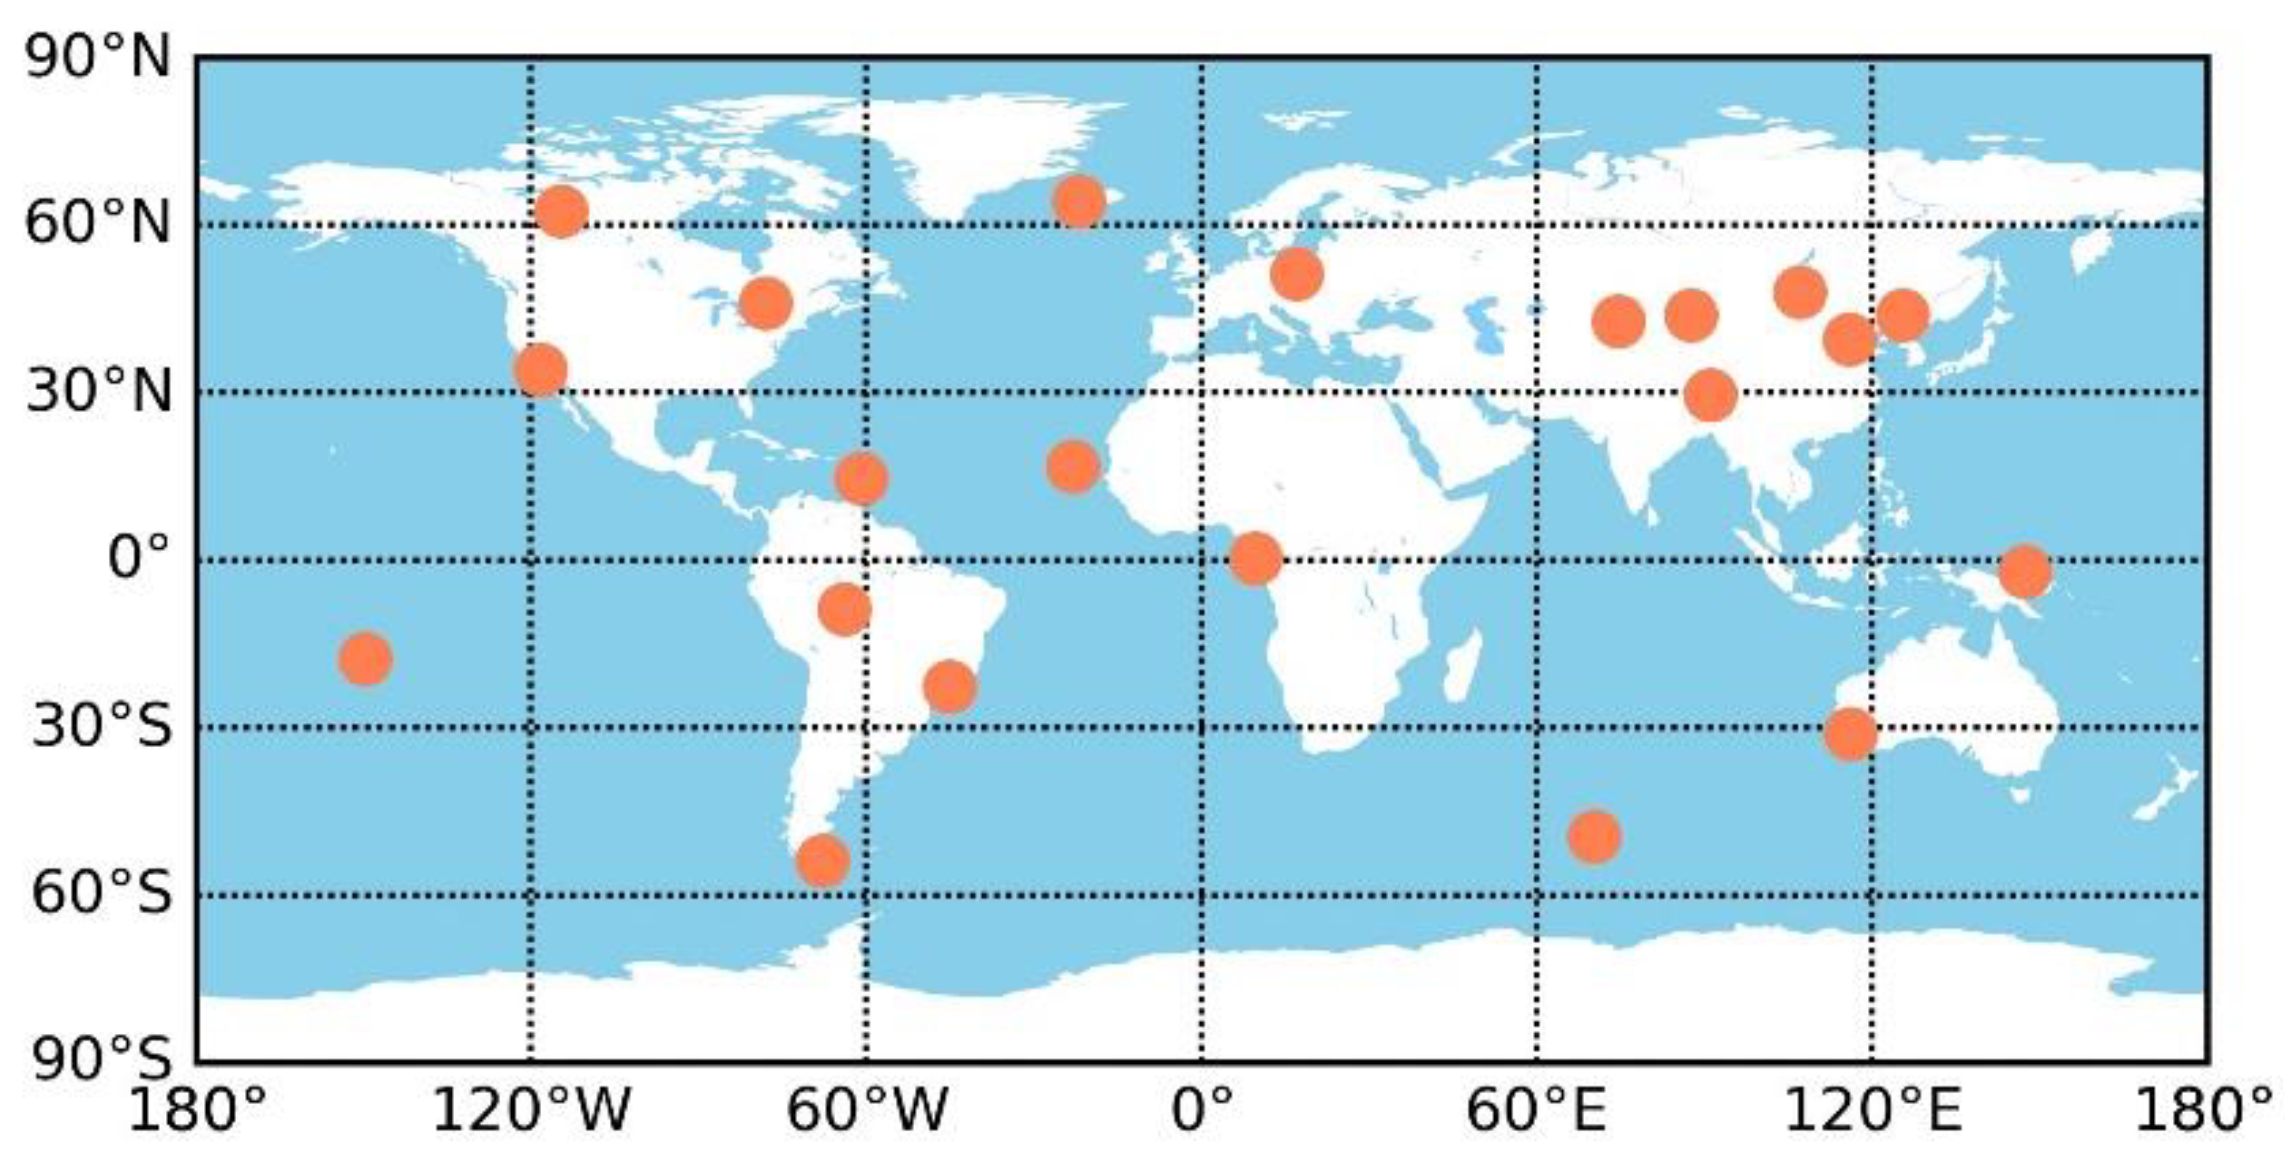
3. Data and Experiments

The G-Nut/Tefnut Pro V3.4 software developed at the Geodetic Observatory Pecny (GOP) is used for data processing [23]. The software has the capability of multi-frequency processing based on the raw model and has been validated to achieve high accuracy for real-time multi-GNSS troposphere estimation. An RMS of 5–8 mm can be achieved for individual stations during the two-year period of a routine real-time estimation [24]. To further explore the accuracy improvement of the tropospheric parameters, we first compare the different PPP strategies that are commonly used in the literature and then identify an optimal strategy for the software. Based on the new strategy, precise tropospheric parameters are derived and their correlation with the heavy rainfall event is analyzed.

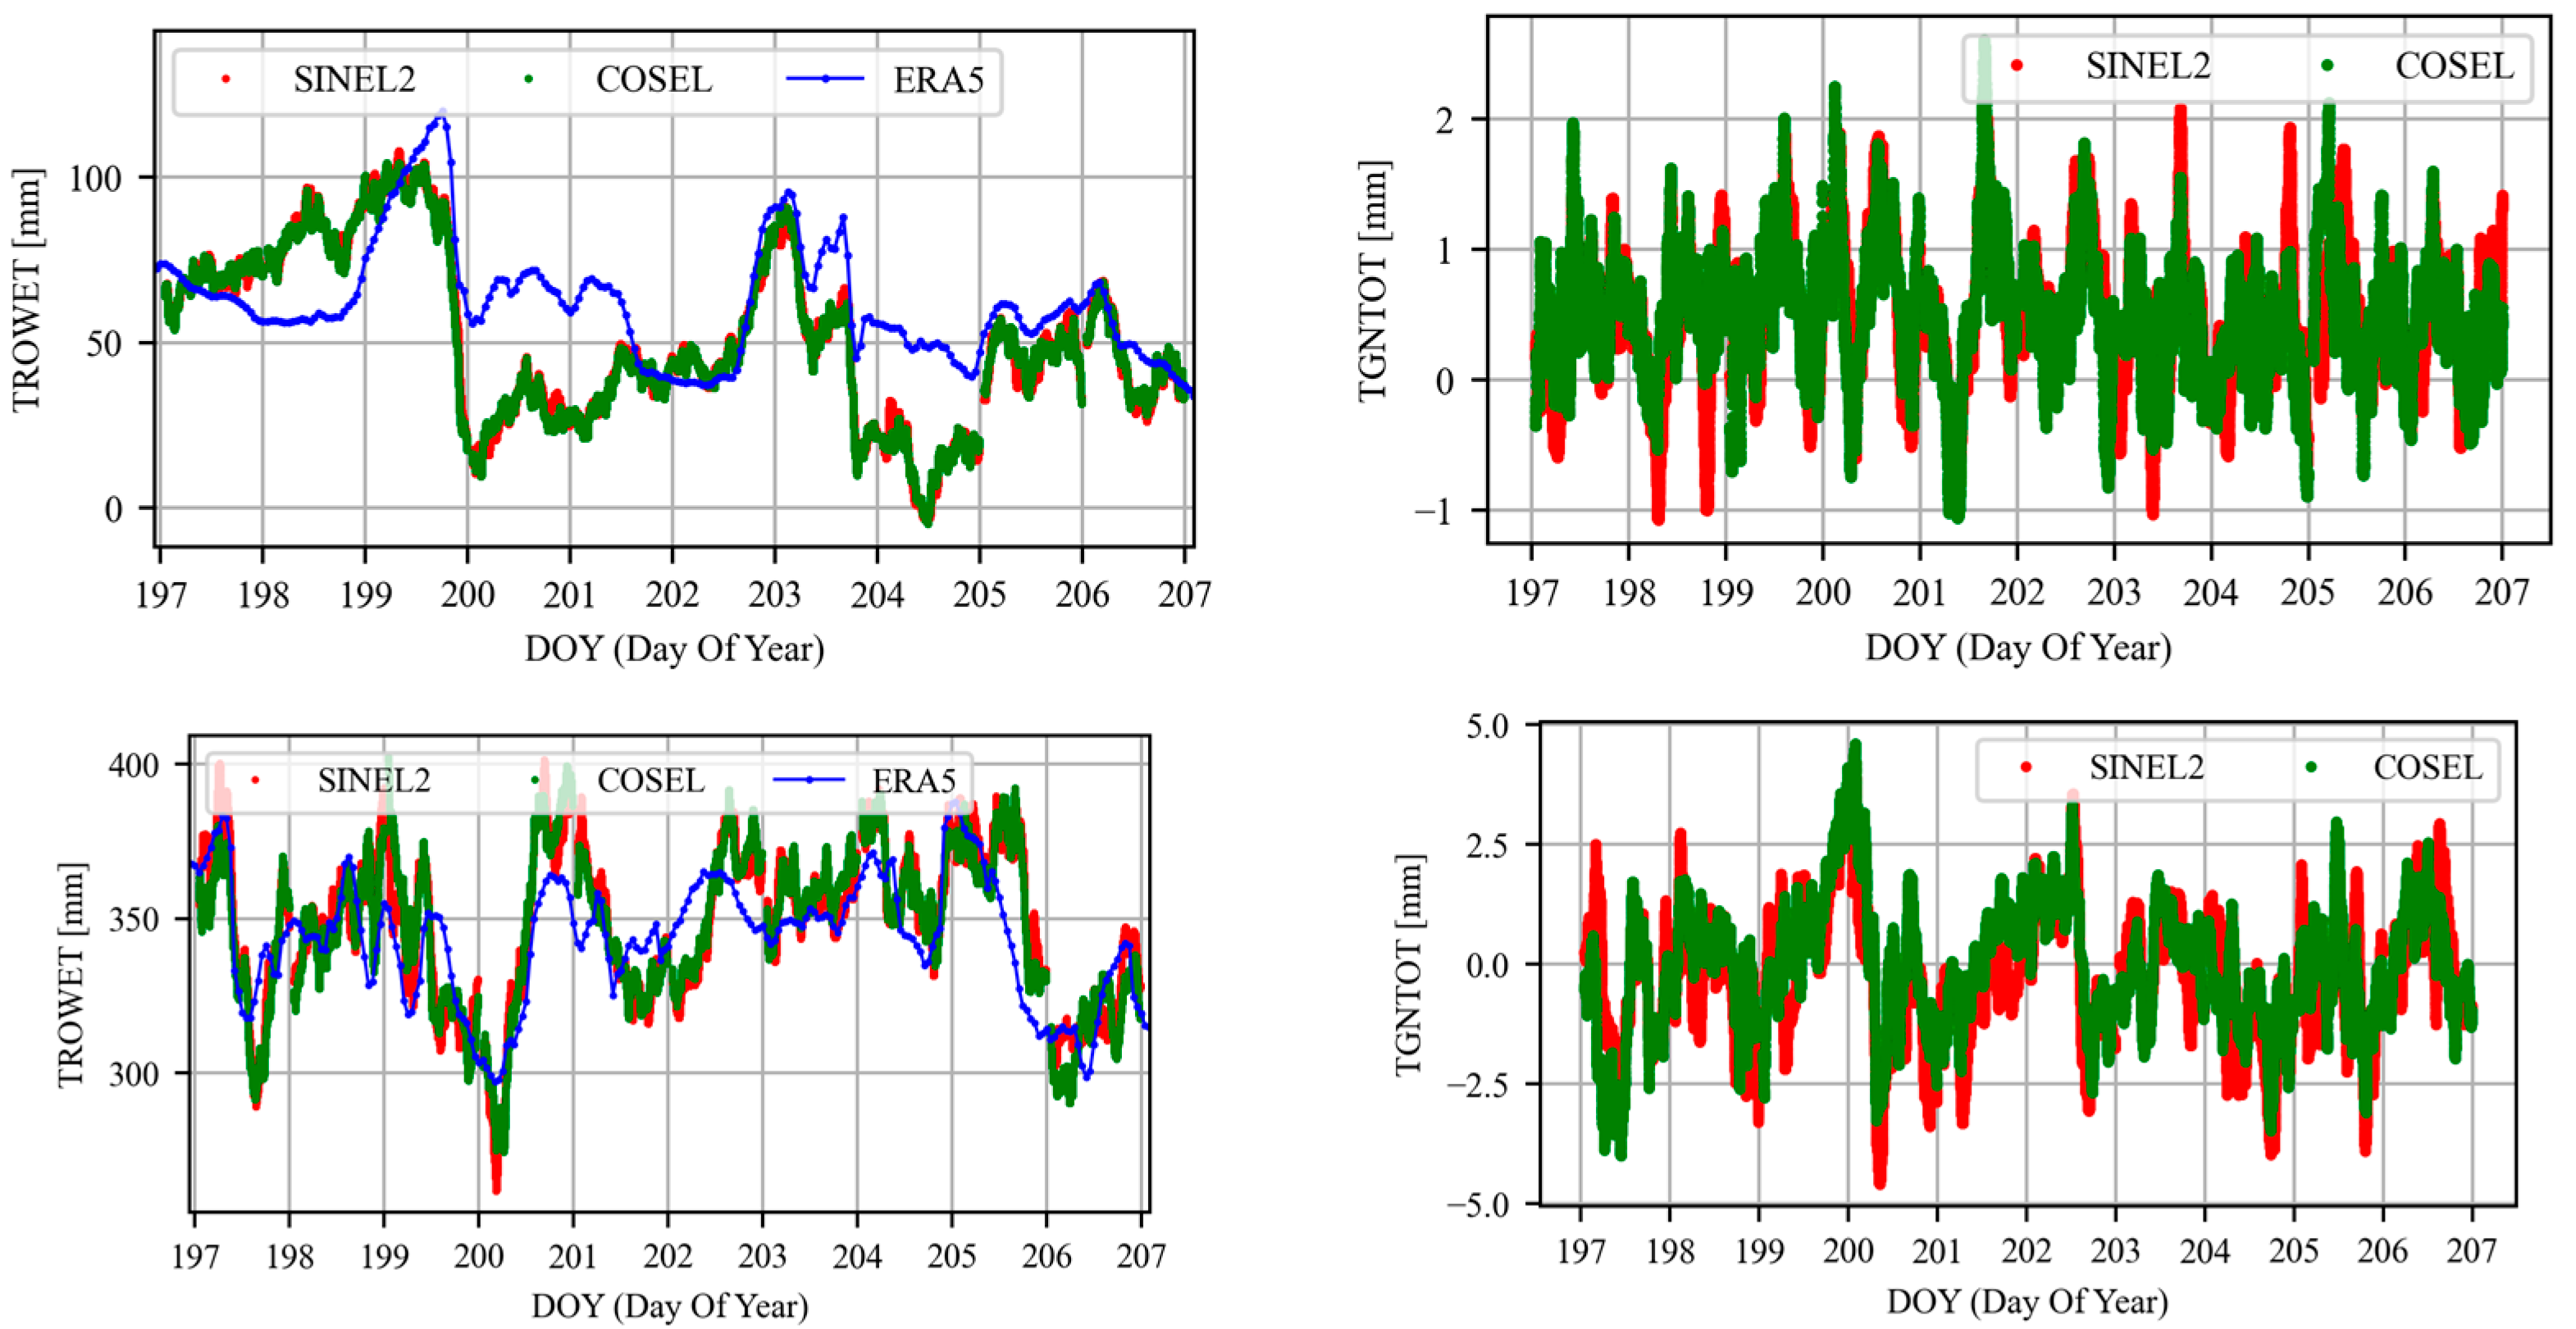
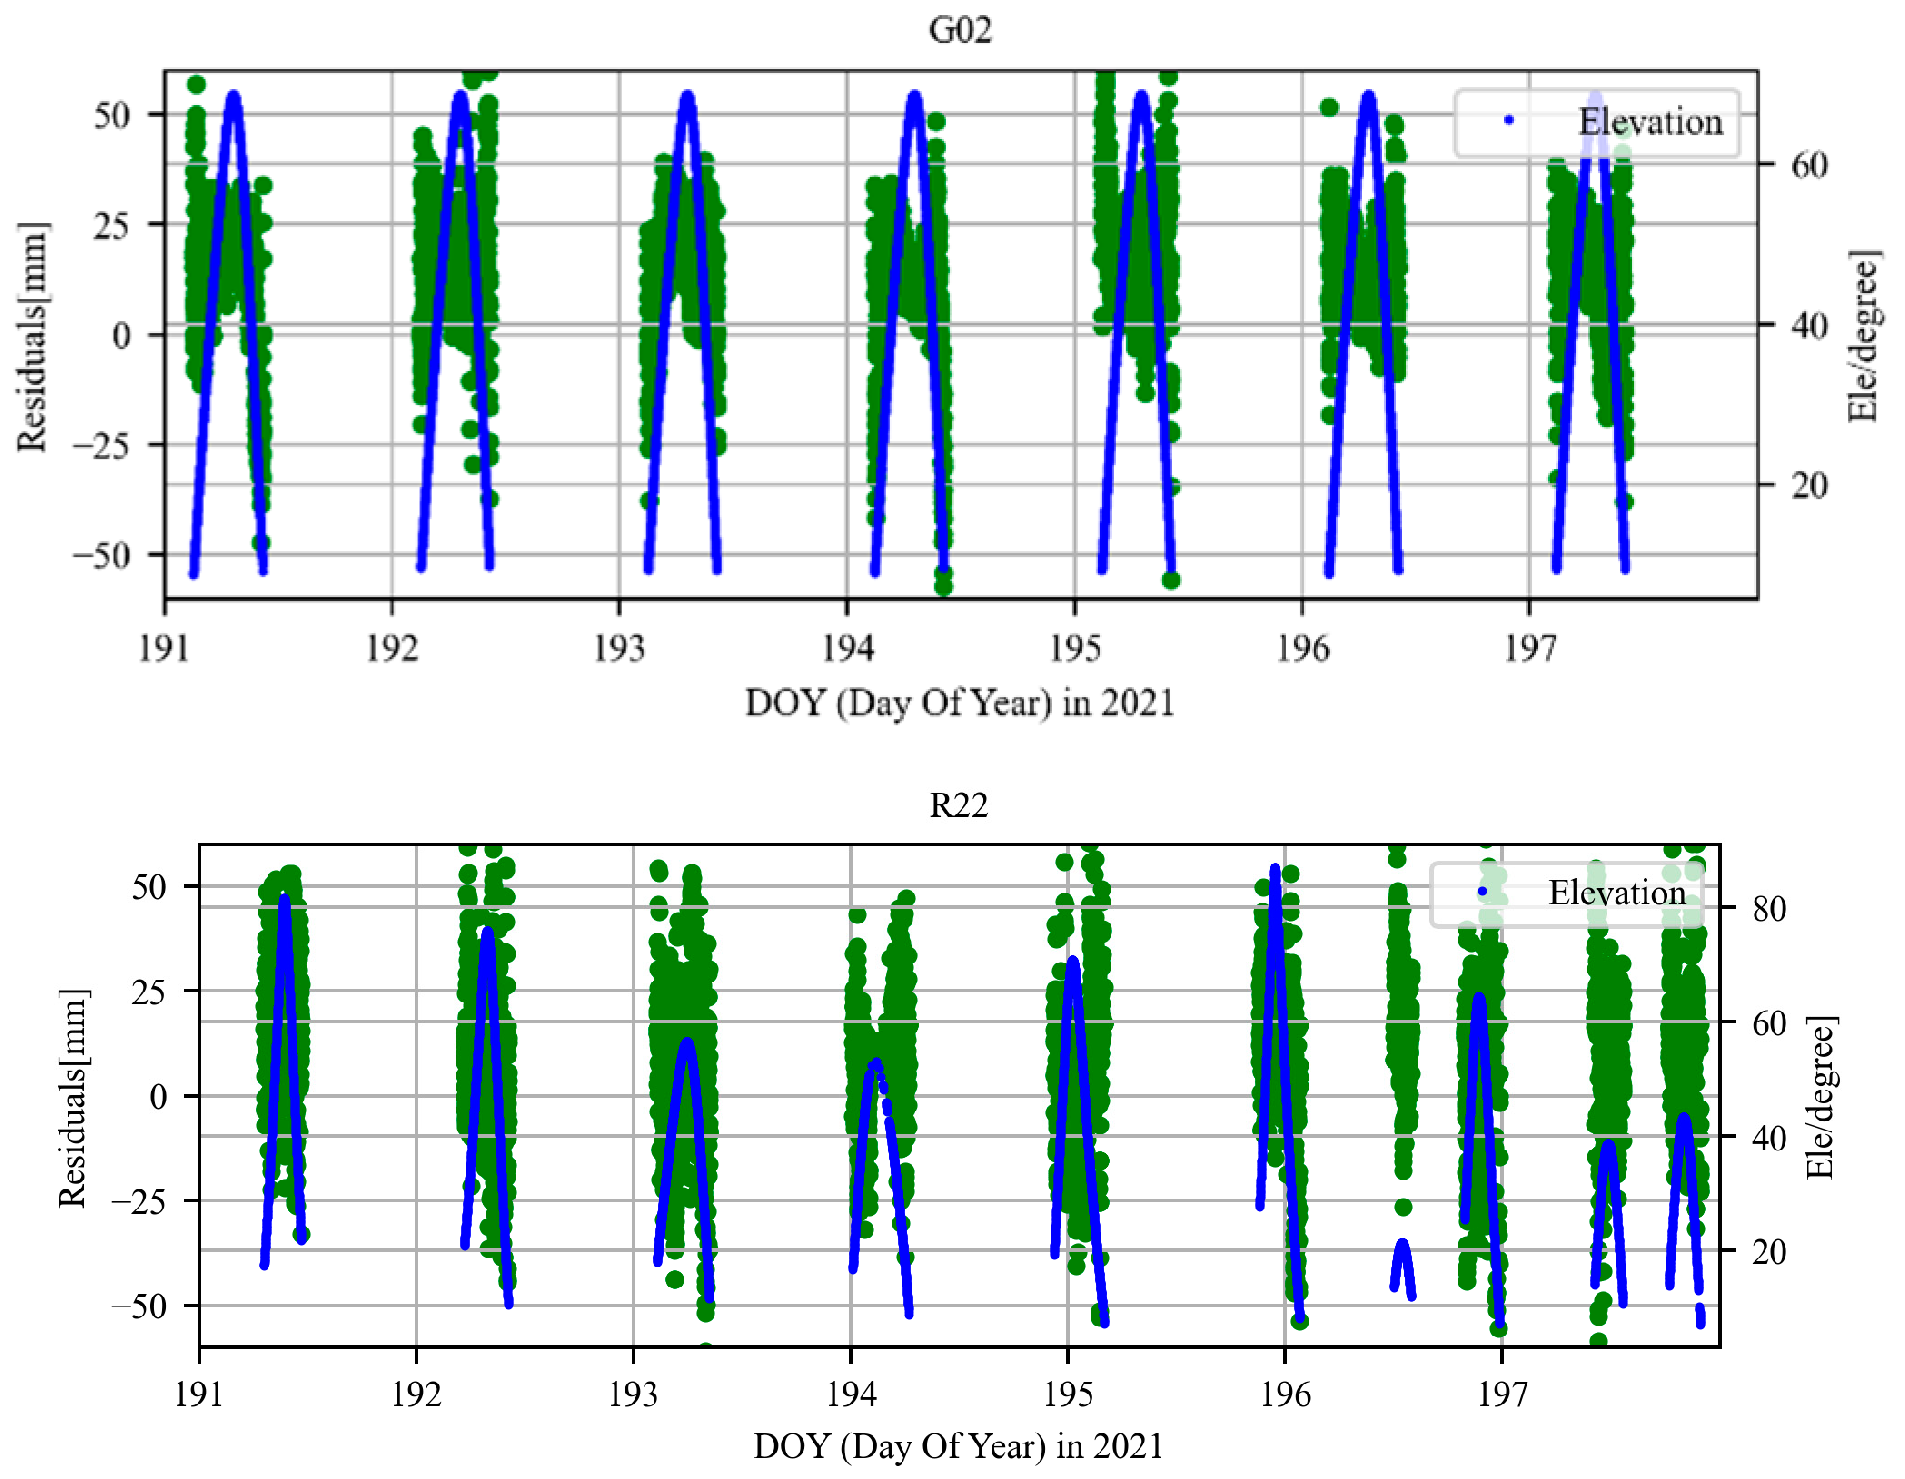
3.1. Validation of Advanced Strategy for Tropospheric Estimation

Observations data at 21 Multi-GNSS Experiment (MGEX) stations from DOY (Day Of Year) 197 to DOY 207 are selected for the PPP experiments. Figure 1 shows the distribution of the global stations. The stations are able to track all four GNSS systems during the periods. Table 1 list the default settings used in the experiments. To simulate the real-time processing, the orbit/clock products from Center National d’Études Spatiales (CNES) CLK93 streams are converted to the standard SP3/CLK format. The difference between the strategy compared to the real-time processing is that the PPP is not affected by the delay of the orbit/clock streams.
Generally, the elevation-dependent stochastic model is used for PPP. Based on the conception, different stochastic functions are proposed. Hadas et al. compared the performance of four stochastic functions and found the cosine-type function can improve the accuracy of tropospheric parameters significantly [25]. Based on their innovation, we further compared its performance to a sine2-type stochastic function. The used functions are defined as
sin 2 e : σ = σ 0 / sin e 2 cos e : σ = σ 0 α 3 + β 3 cos n e
where e is the elevation angle, σ 0 is a priori sigma of the observation. The constant parameters are α 3 = 1 ,   β 3 = 4 ,   n = 8 . The two elevation-dependent weighting function varies significantly at the lower elevation angles, especially the cos e function. It is a common practice to amplify the observation noise for other GNSS when compared to GPS considering the mis-modeling of real-time satellite orbits and clocks. According to the signal-in-space ranging errors (SISRE) values from Kazmierski’s [26] results, the SISRE for GLONASS/Galileo/BDS are three times larger than that of GPS. Therefore, the SISRE error is considered by increasing the pseudo-range noise of the Galileo/GLONASS/BDS observations.
Table 2 list the different strategies used for the processing and the corresponding ZTD/coordinate accuracy. The effects of the different weighting functions and the SISRE weighting and estimating of the horizontal gradients are considered. The troposphere accuracy is evaluated by comparing it to the IGS final products [27] and the positioning accuracy is evaluated using the repeatability of the horizontal and vertical coordinates measured by the standard deviation (STD) of the time series. It is observed that estimating the tropospheric gradients can improve the accuracy of ZTD and coordinates in all three different strategies. The maximum improvement is 0.49 mm and 1.15 mm respectively for the ZTD and vertical coordinates when using the cos e weighting function. When considering the SISRE weighting, the horizontal and vertical accuracy is improved by 28.5% and 19.2% for the sin e weighting functions which can achieve the best accuracy in the different strategies. In comparison, the accuracy of the parameters estimated from the cos e type weighting is worse than the sin e when considering the SISRE weighting. This might be due to the cos e function imposing a higher weight for the low-elevation observations. Though estimating the gradients can absorb part of the residuals, the improvement is still limited.
Figure 2 compares the time series of the ZWD and the north gradients estimated from the sine2-type and cosine-type functions when considering the SISRE weighting. The average STD of the ZWD for station RGDG (top) and station PNGM (bottom) is 5.8 mm and 11.58 mm, respectively, when compared to the IGS final products. The ZWD differences range from 10 mm–40 mm, depending on its magnitude at the station. Obviously, a large ZWD difference exists between station RGDG and PNGM. The ZWD obtained from the online ERA5 interface is also shown on the left of Figure 2. It is observed that the magnitude of the ZWD from different sources is at the same level though short-term difference exists. Therefore, it can be deduced that the relatively large ZWD for the station PNGM is caused by the environment. The magnitude of the tropospheric gradients estimated from the different strategies show a consistent trend; however, its trends are less correlated with the ZWD. Though an obvious ZWD decreasing and increasing trend is observed from DOY 199 to DOY 200 for station PNGM, the corresponding trend is not obvious for the gradients.

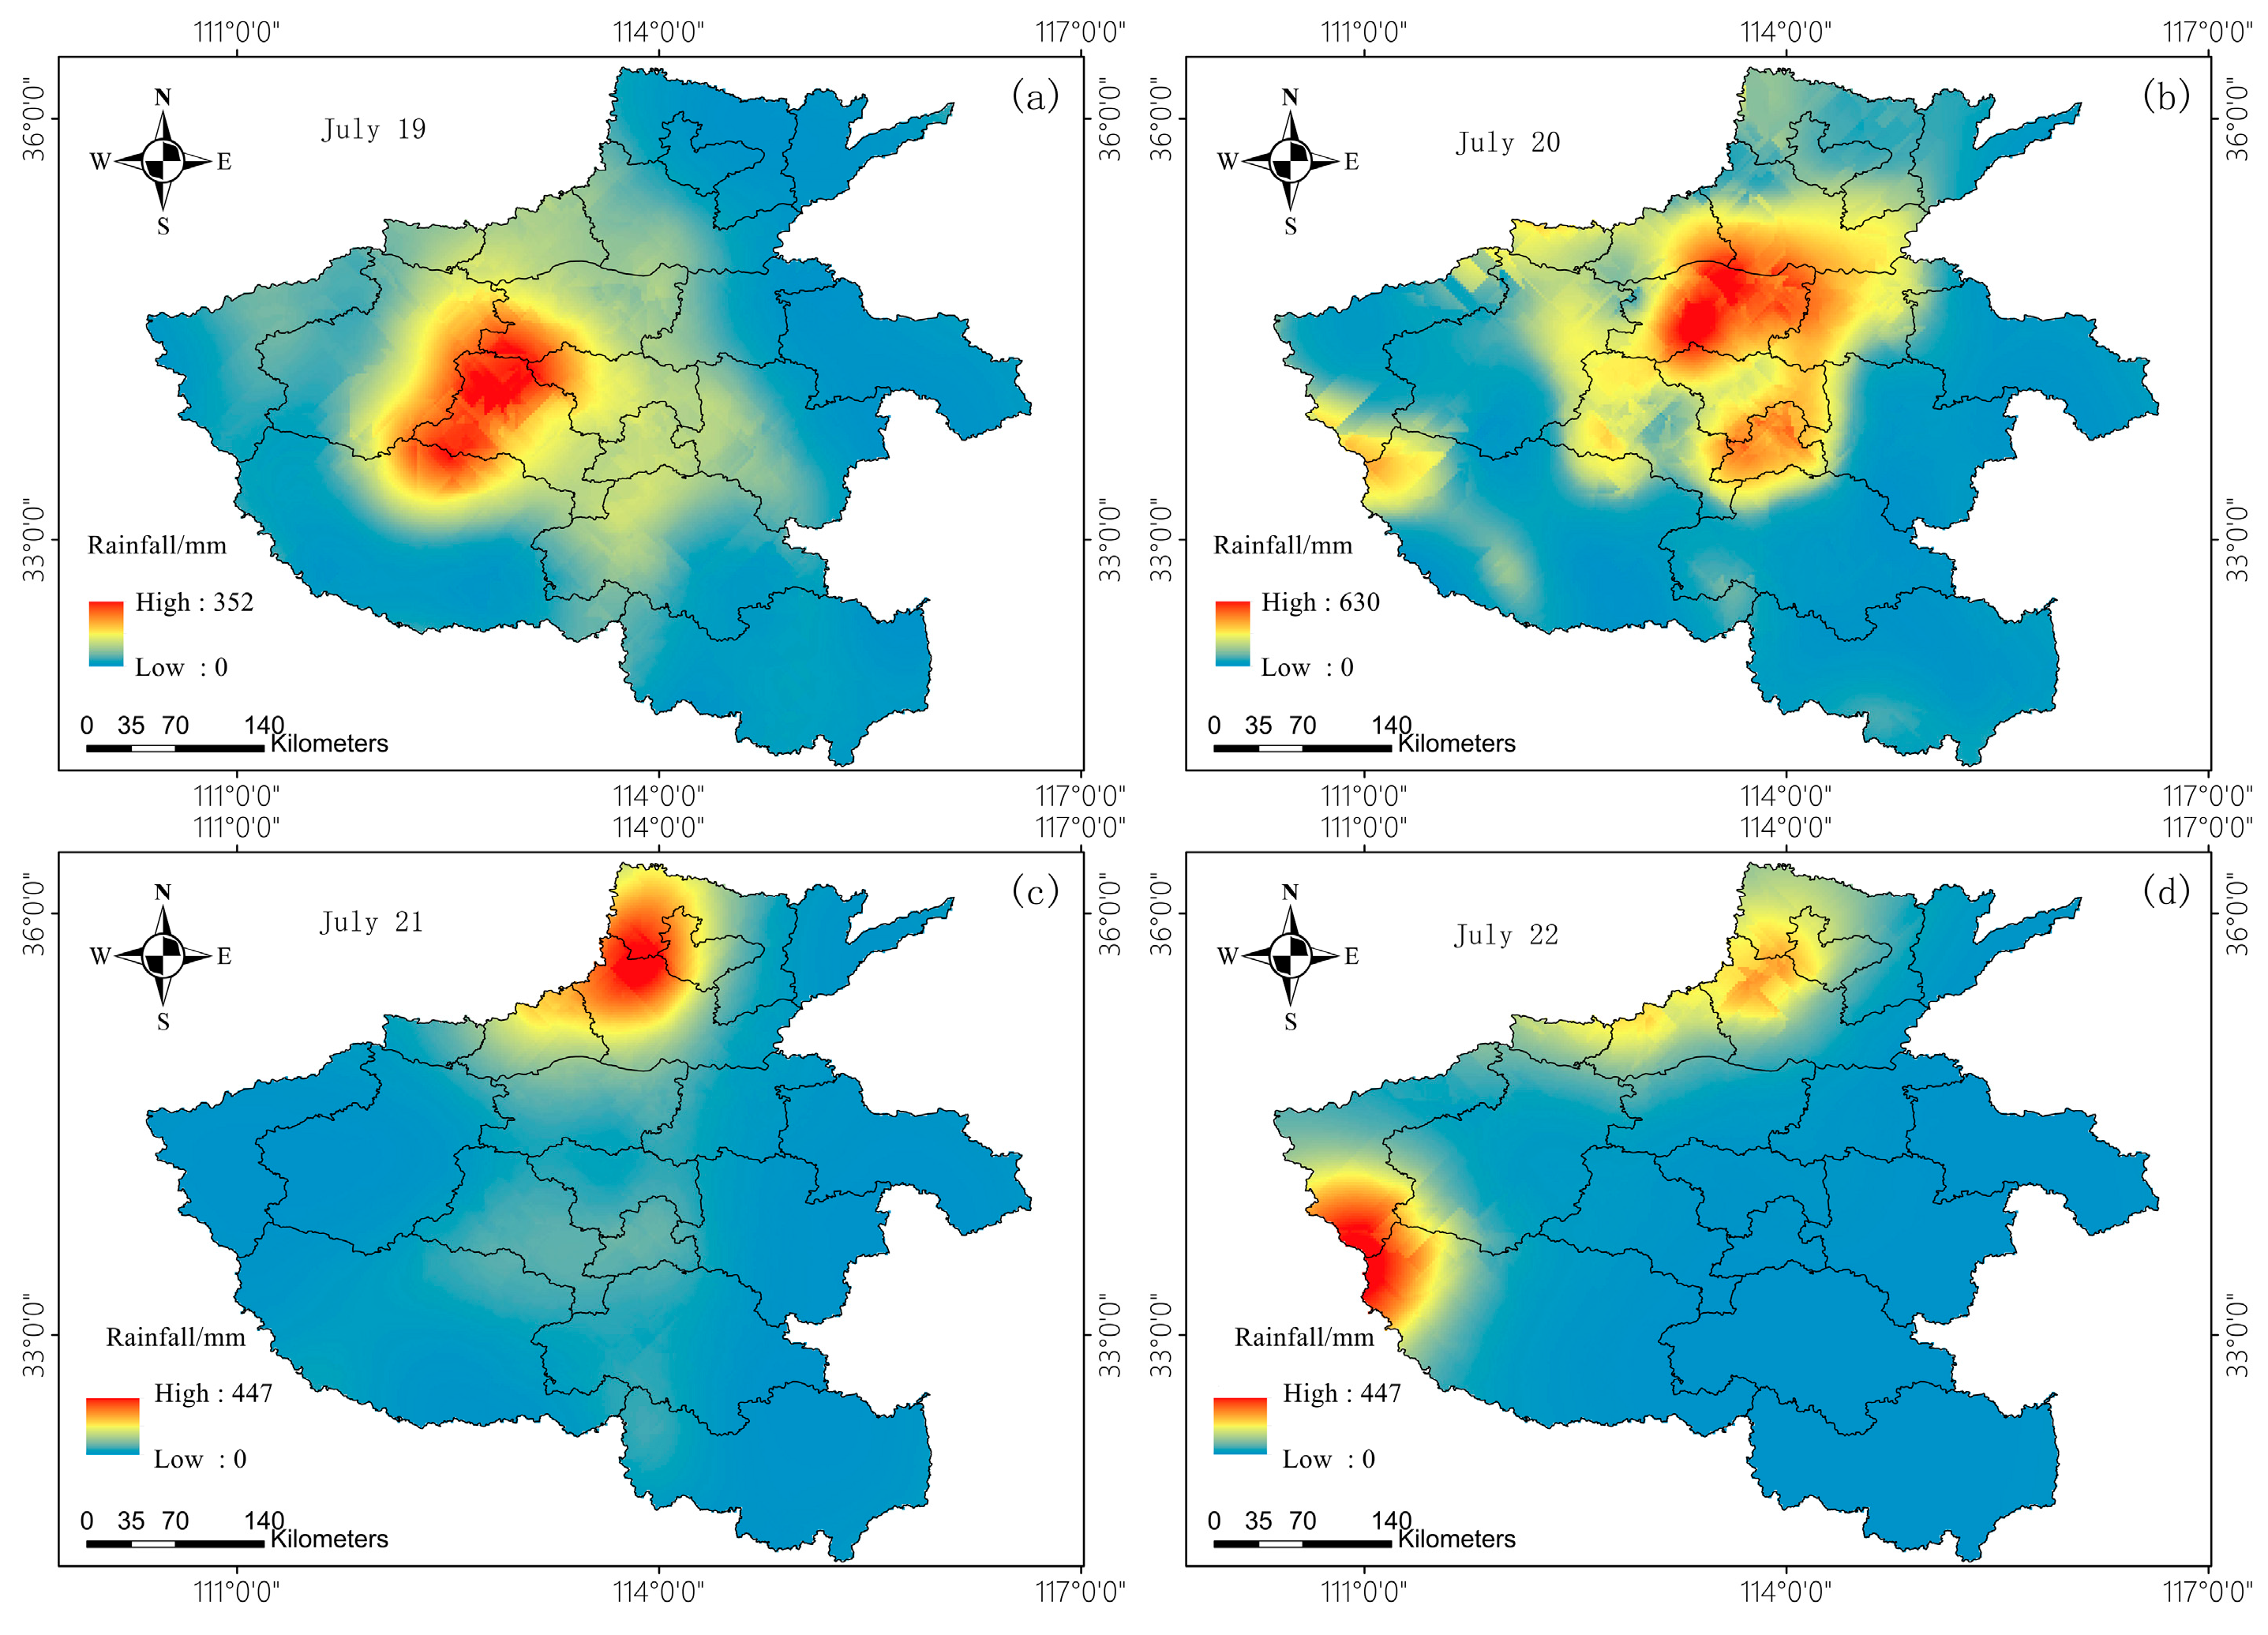
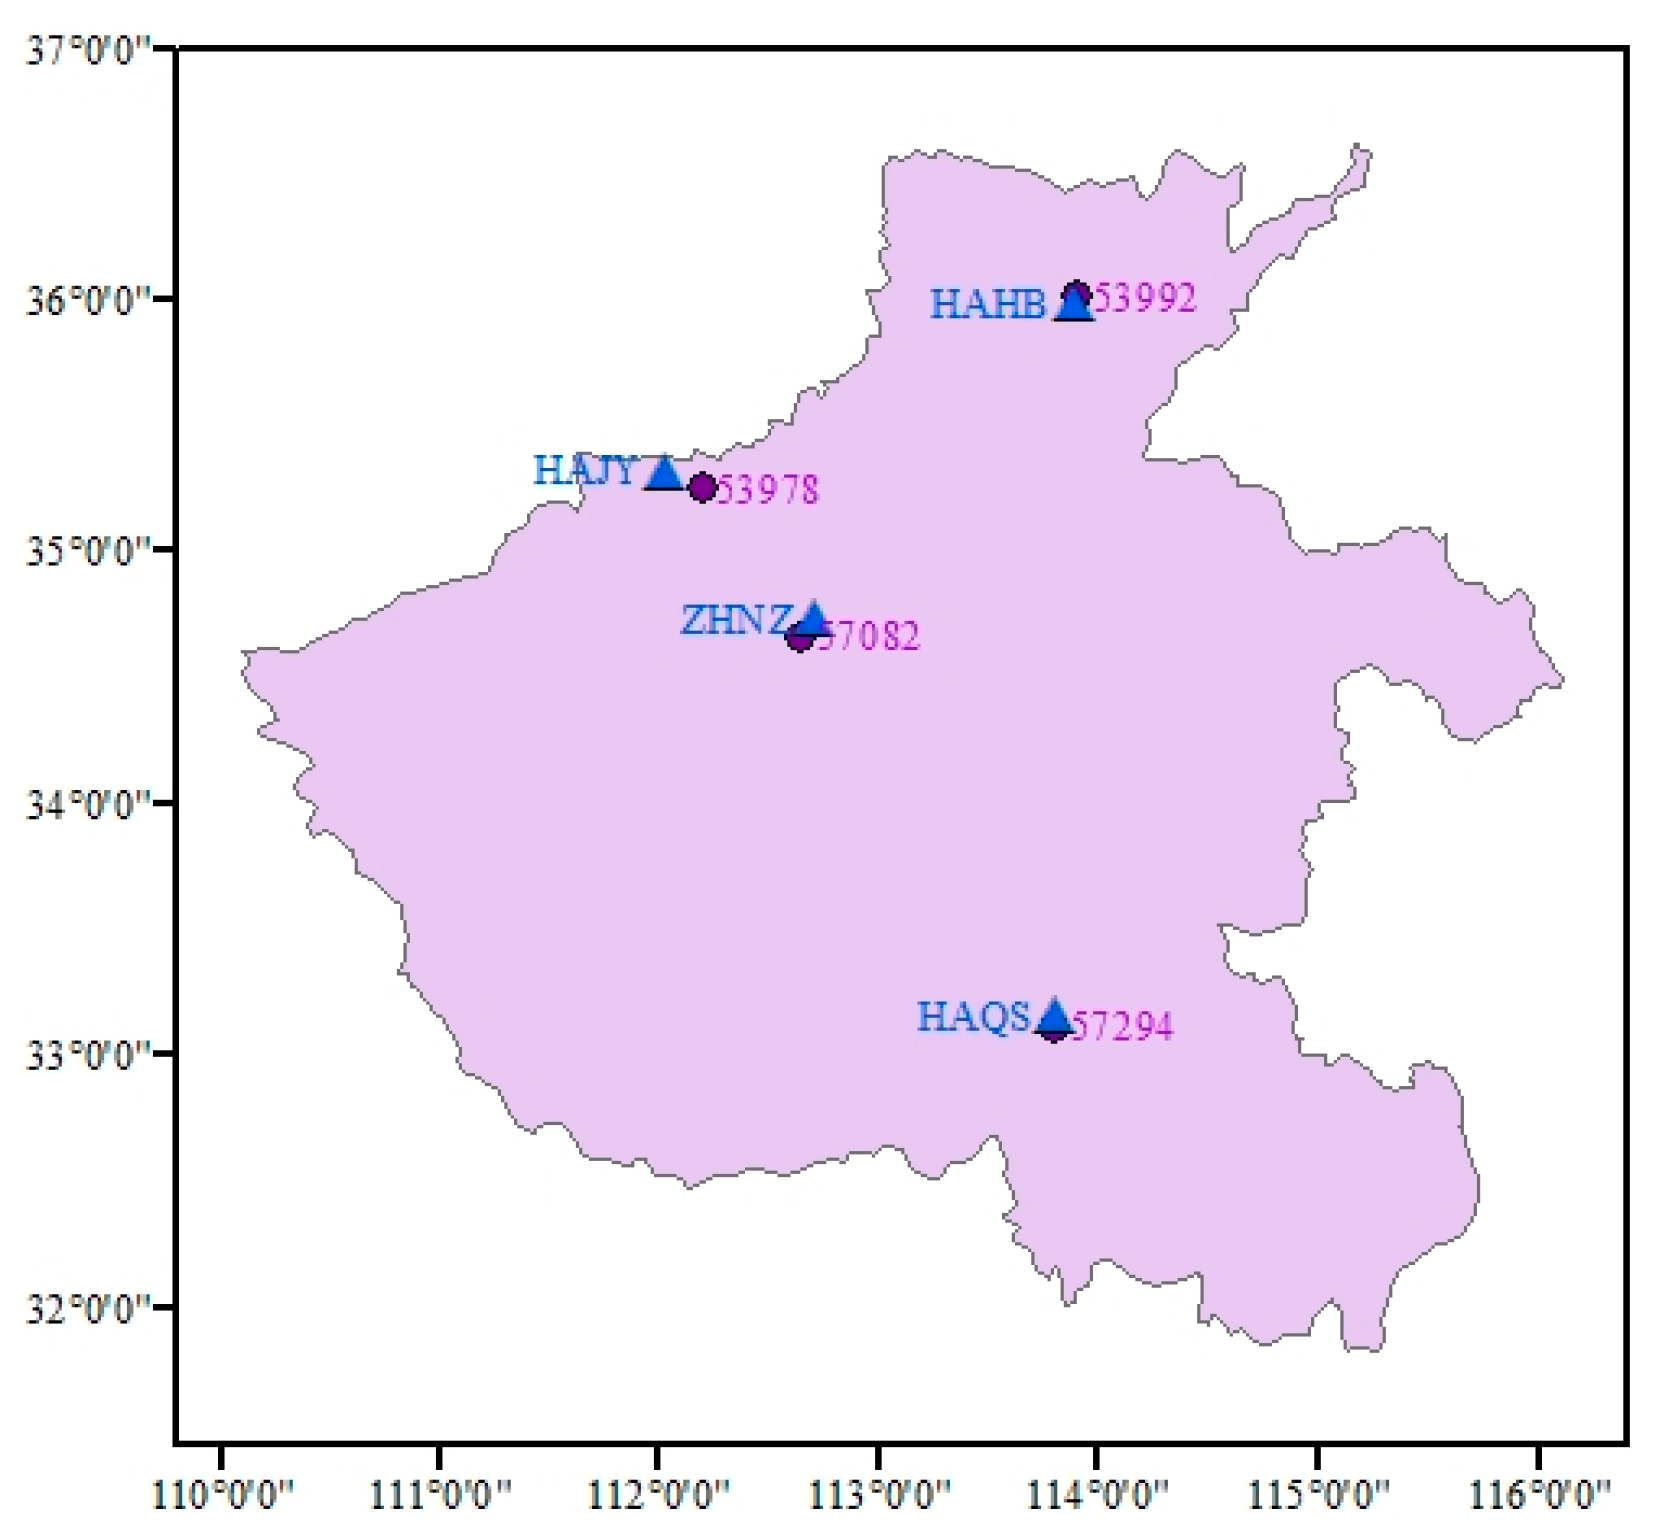
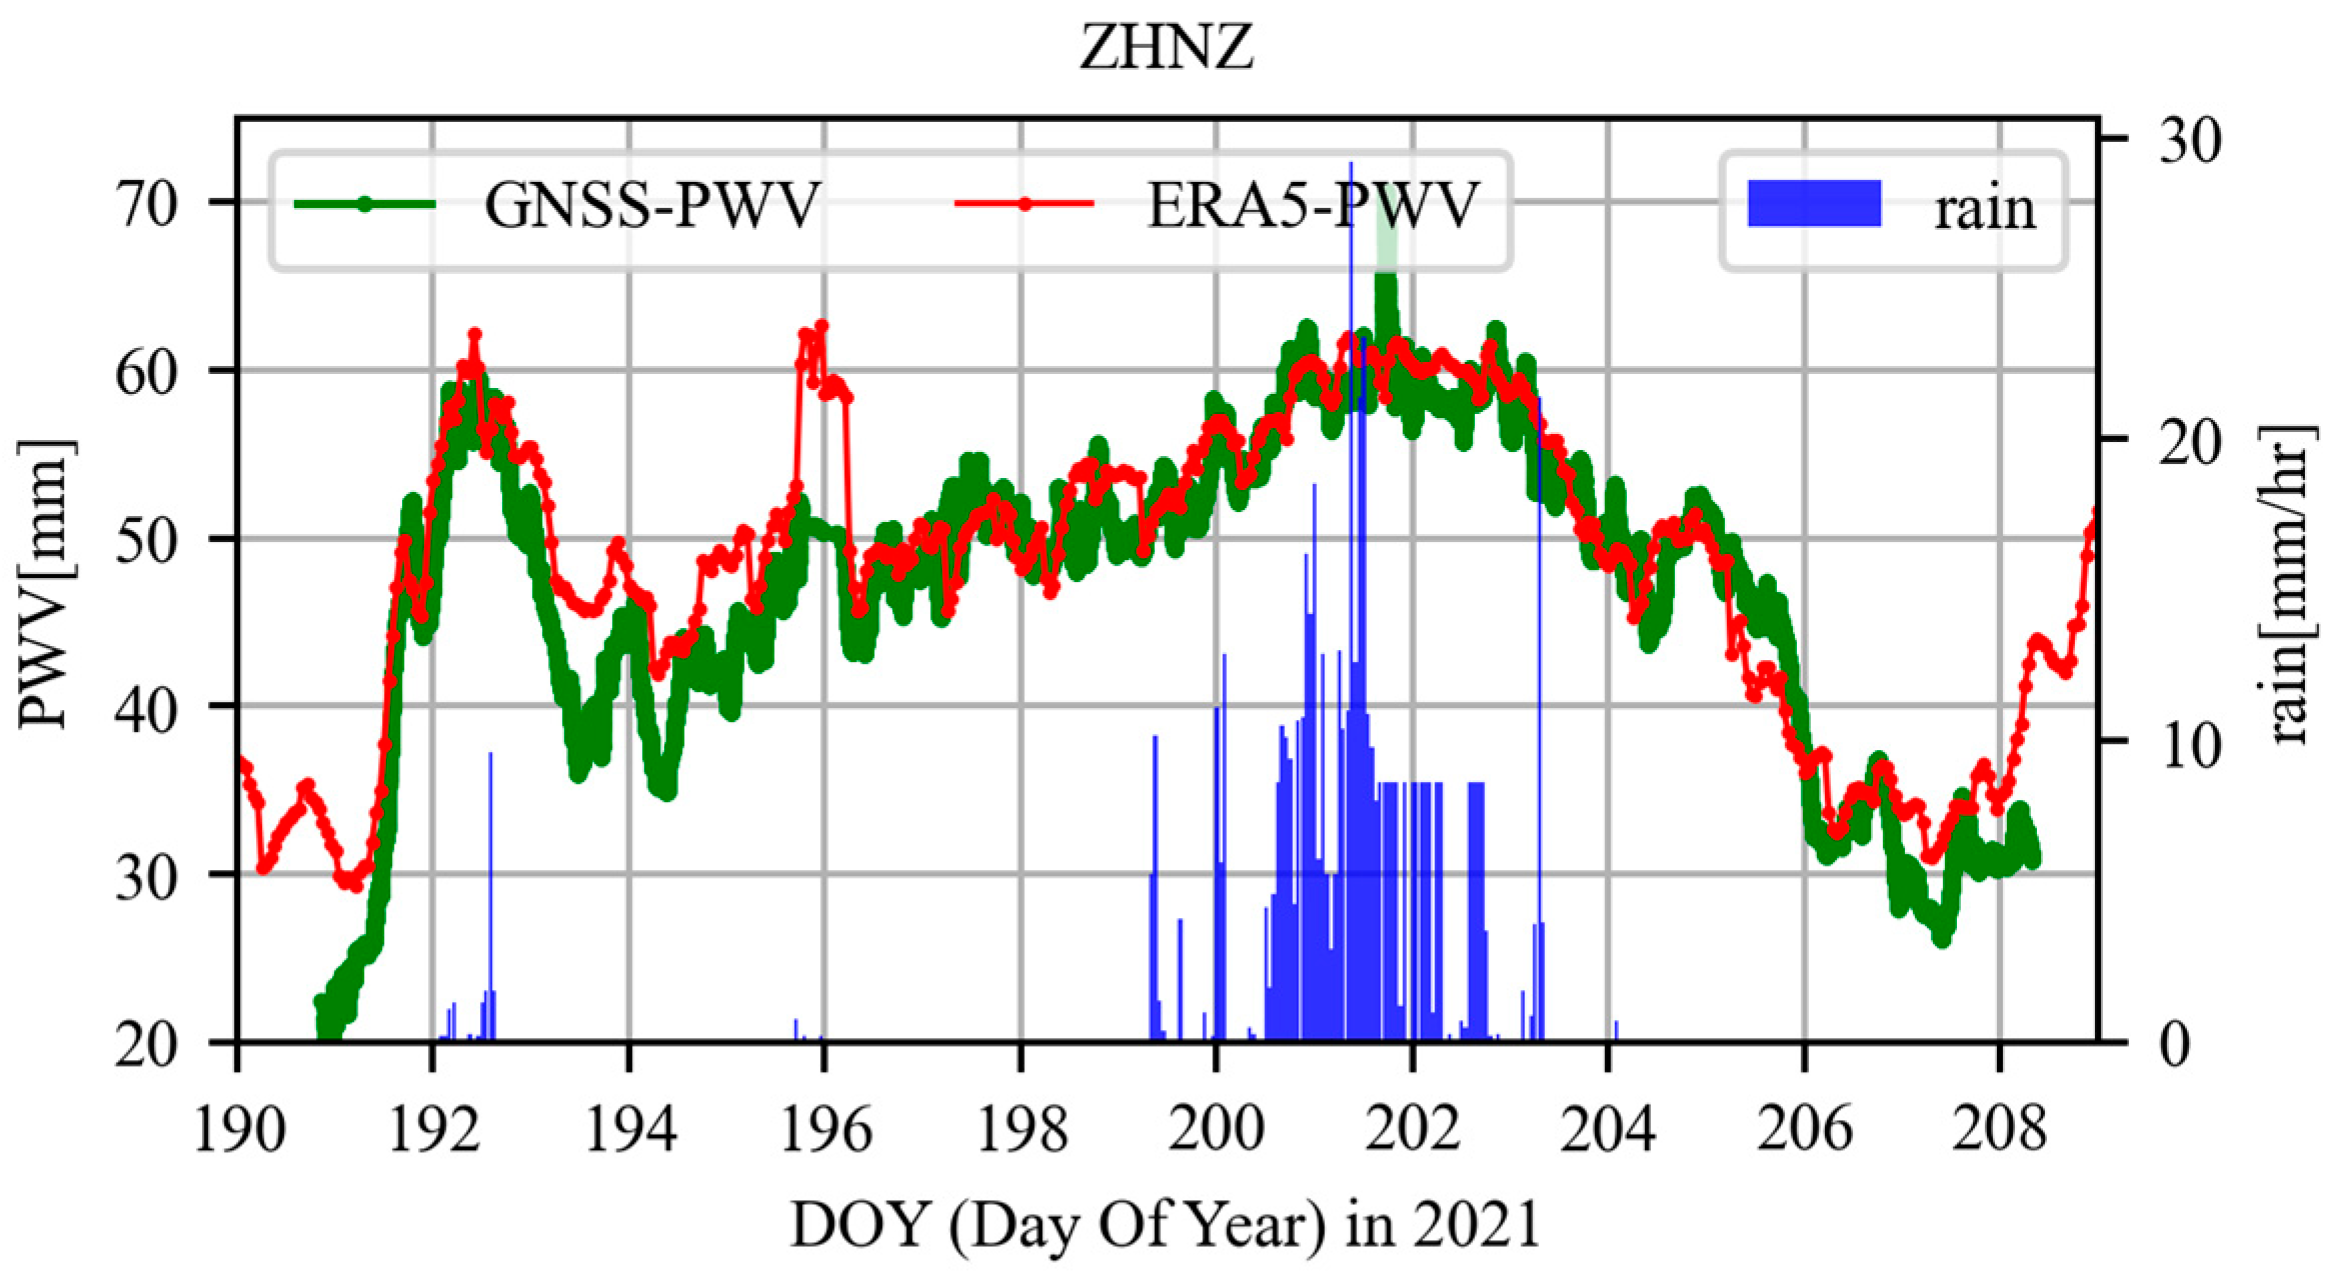
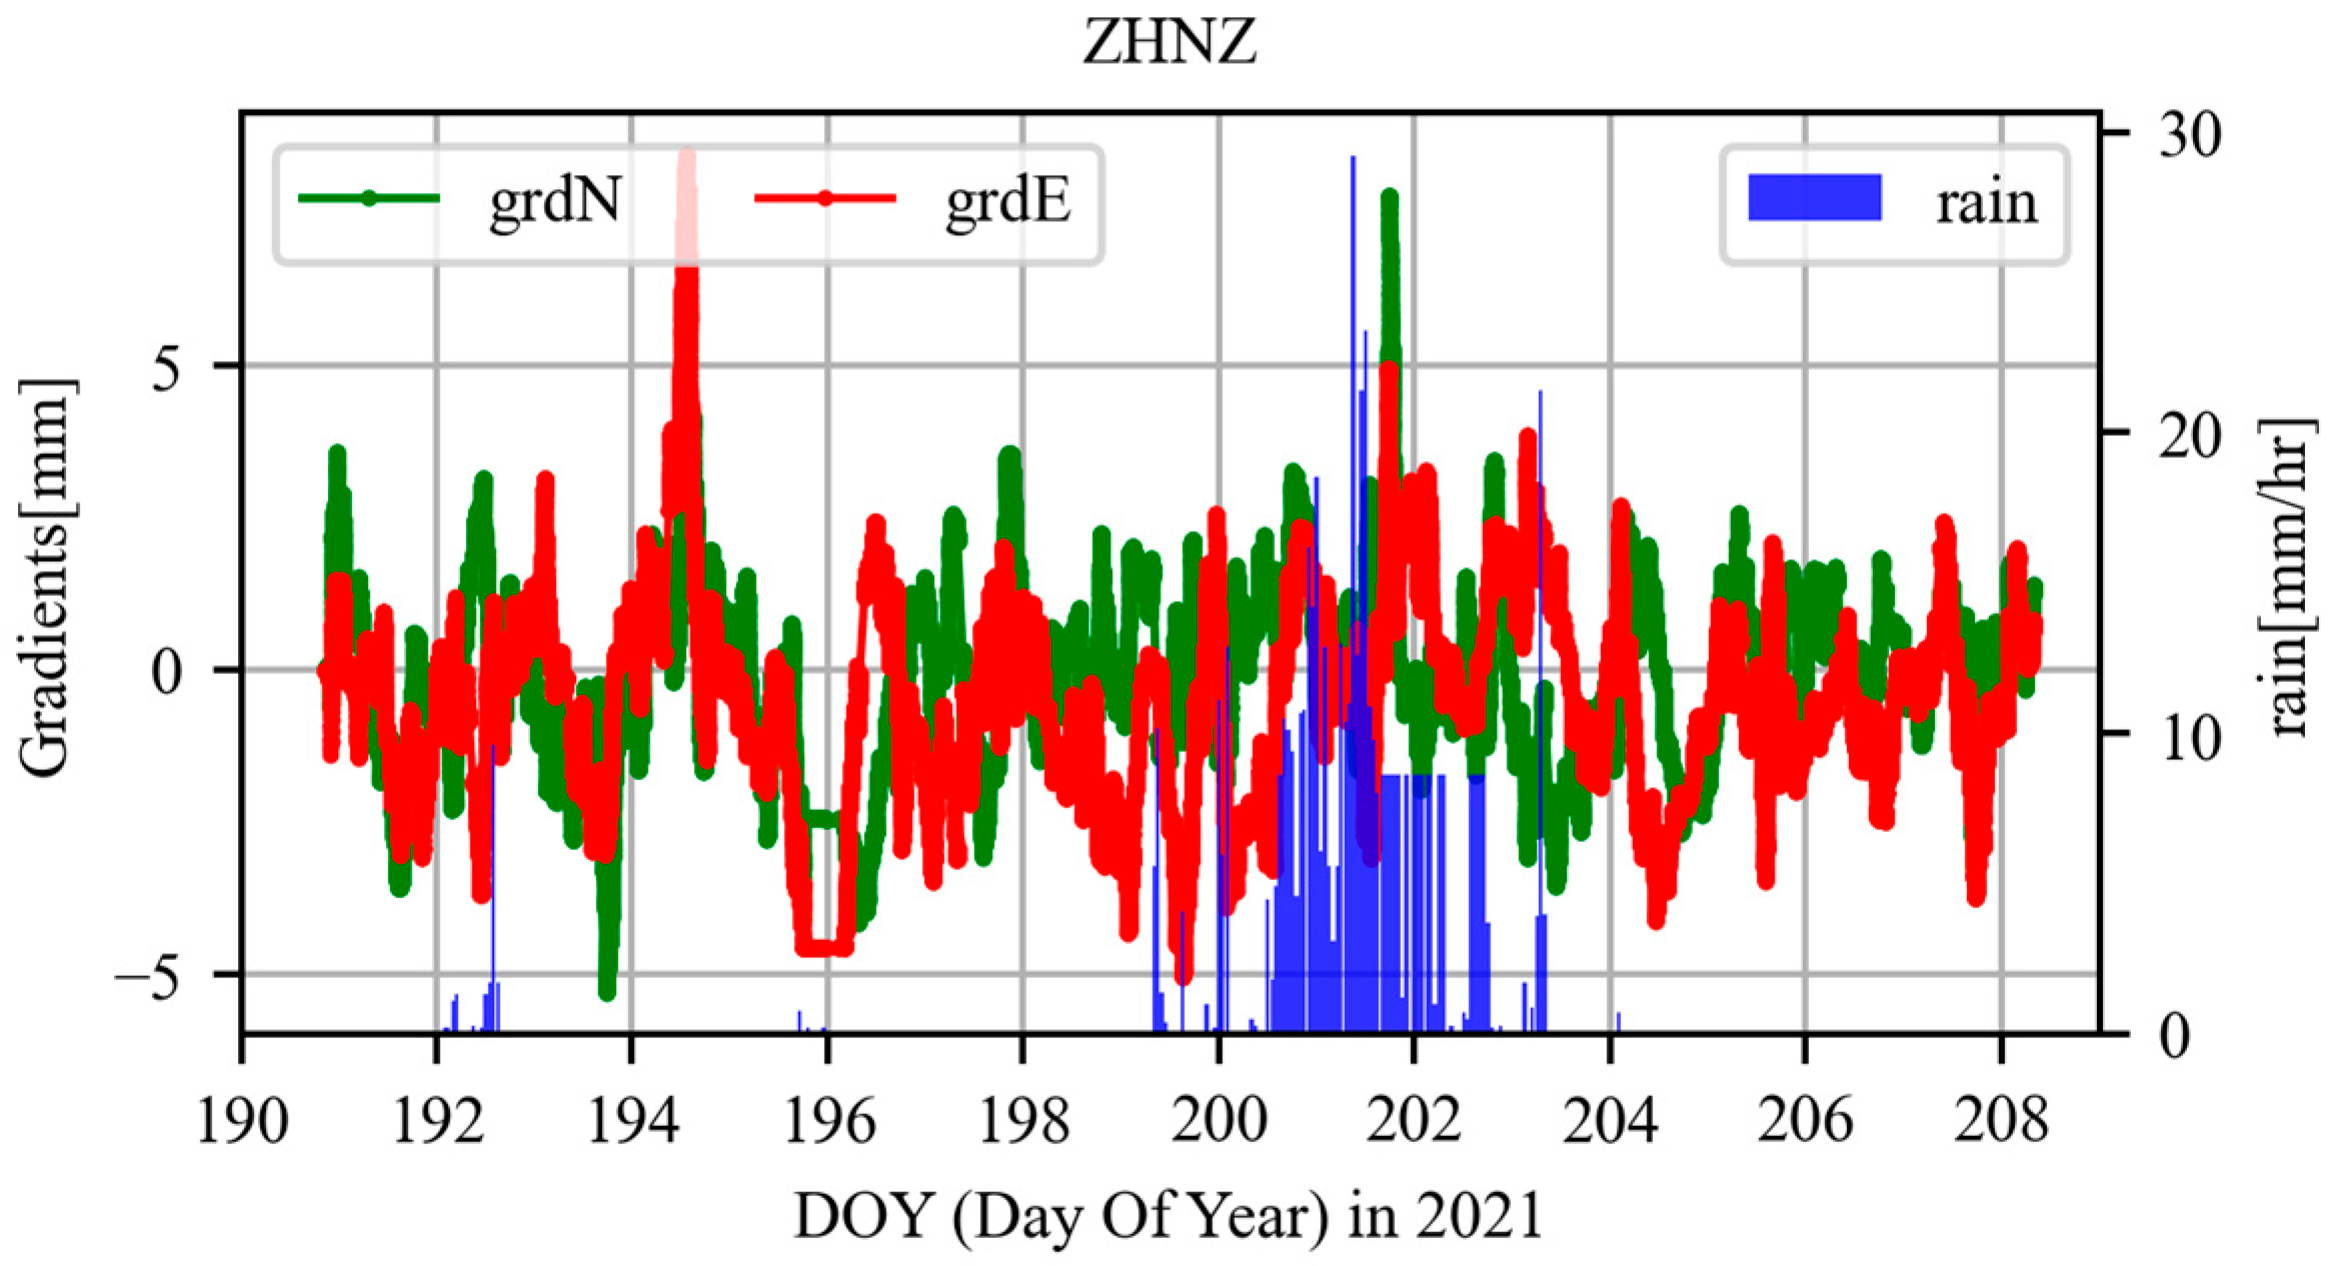
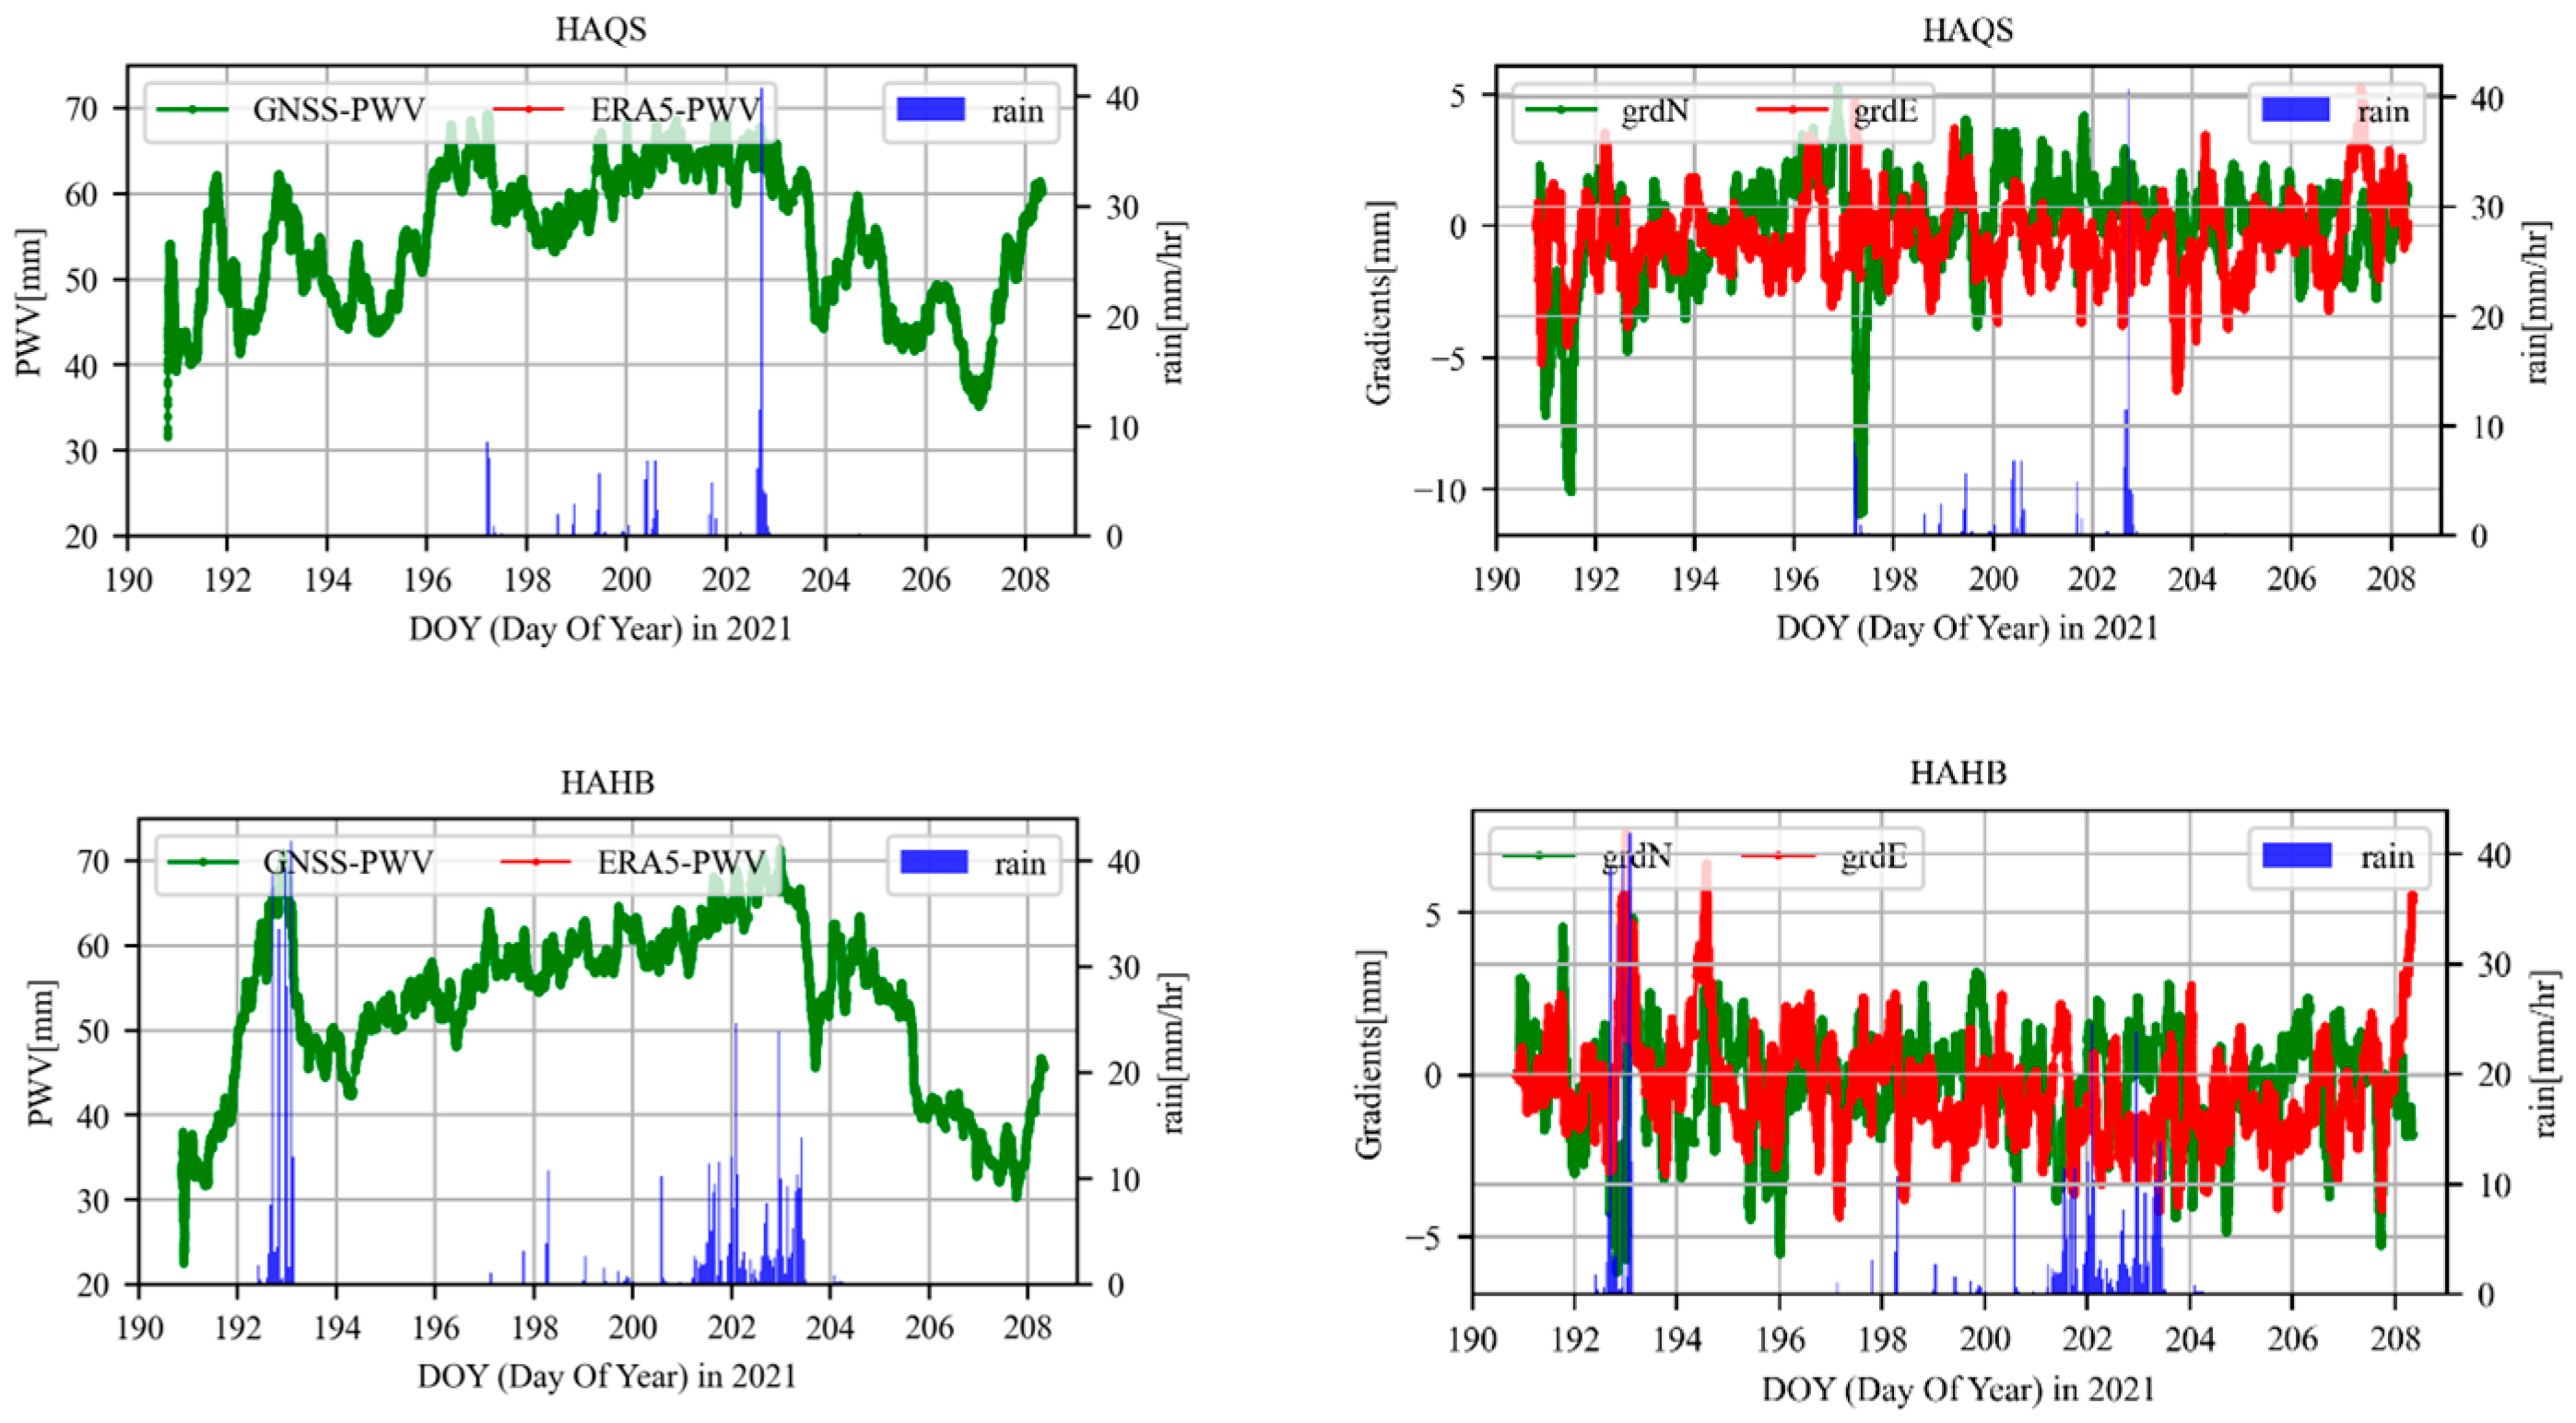
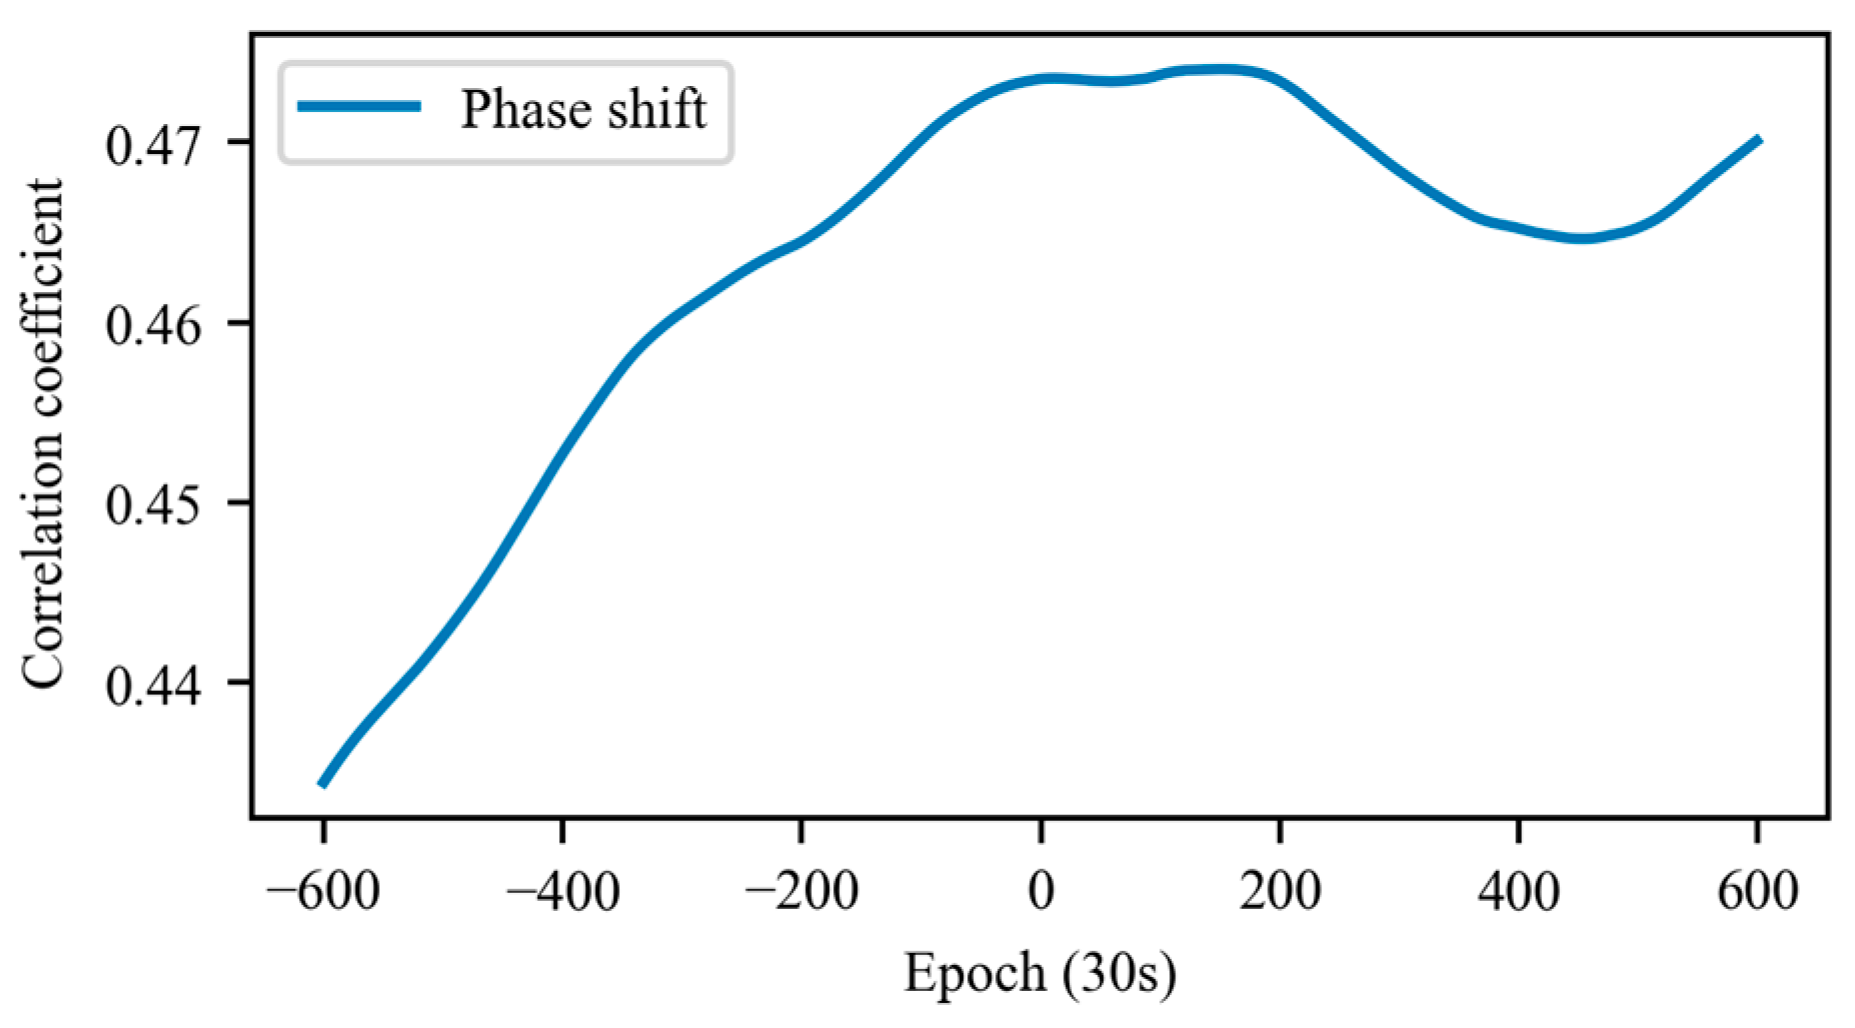
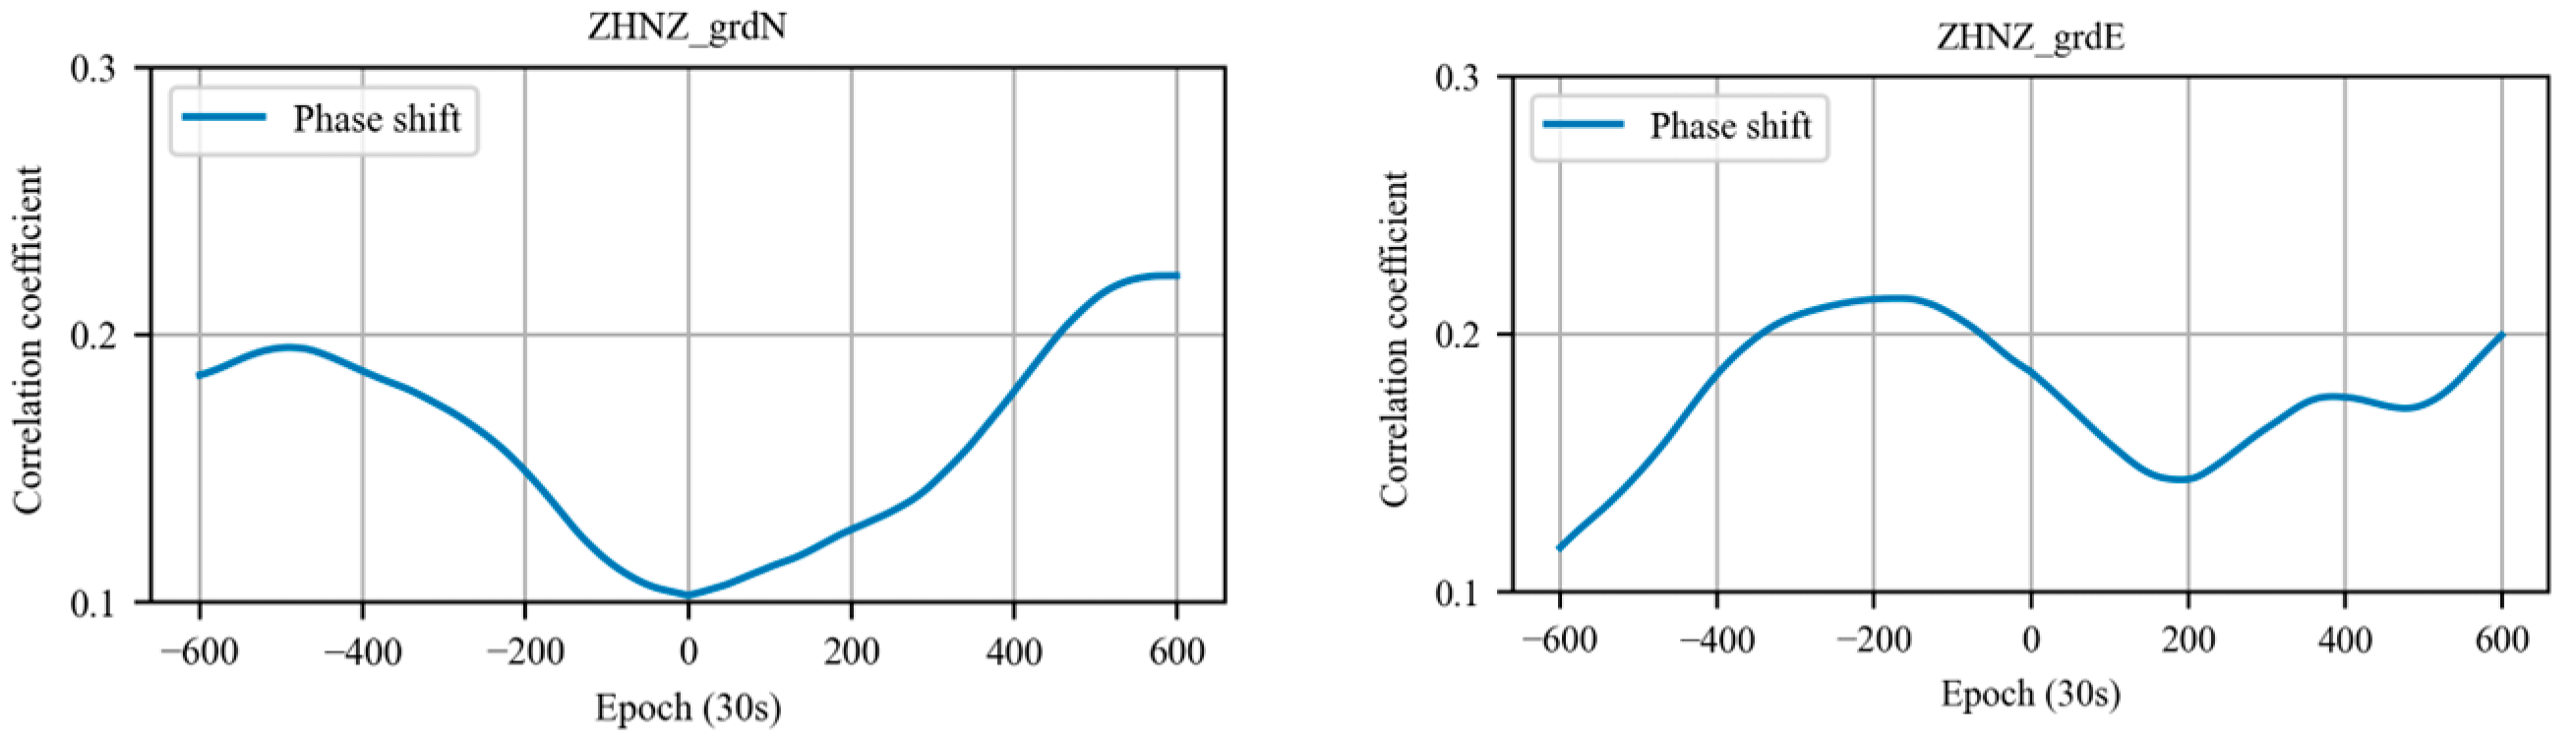
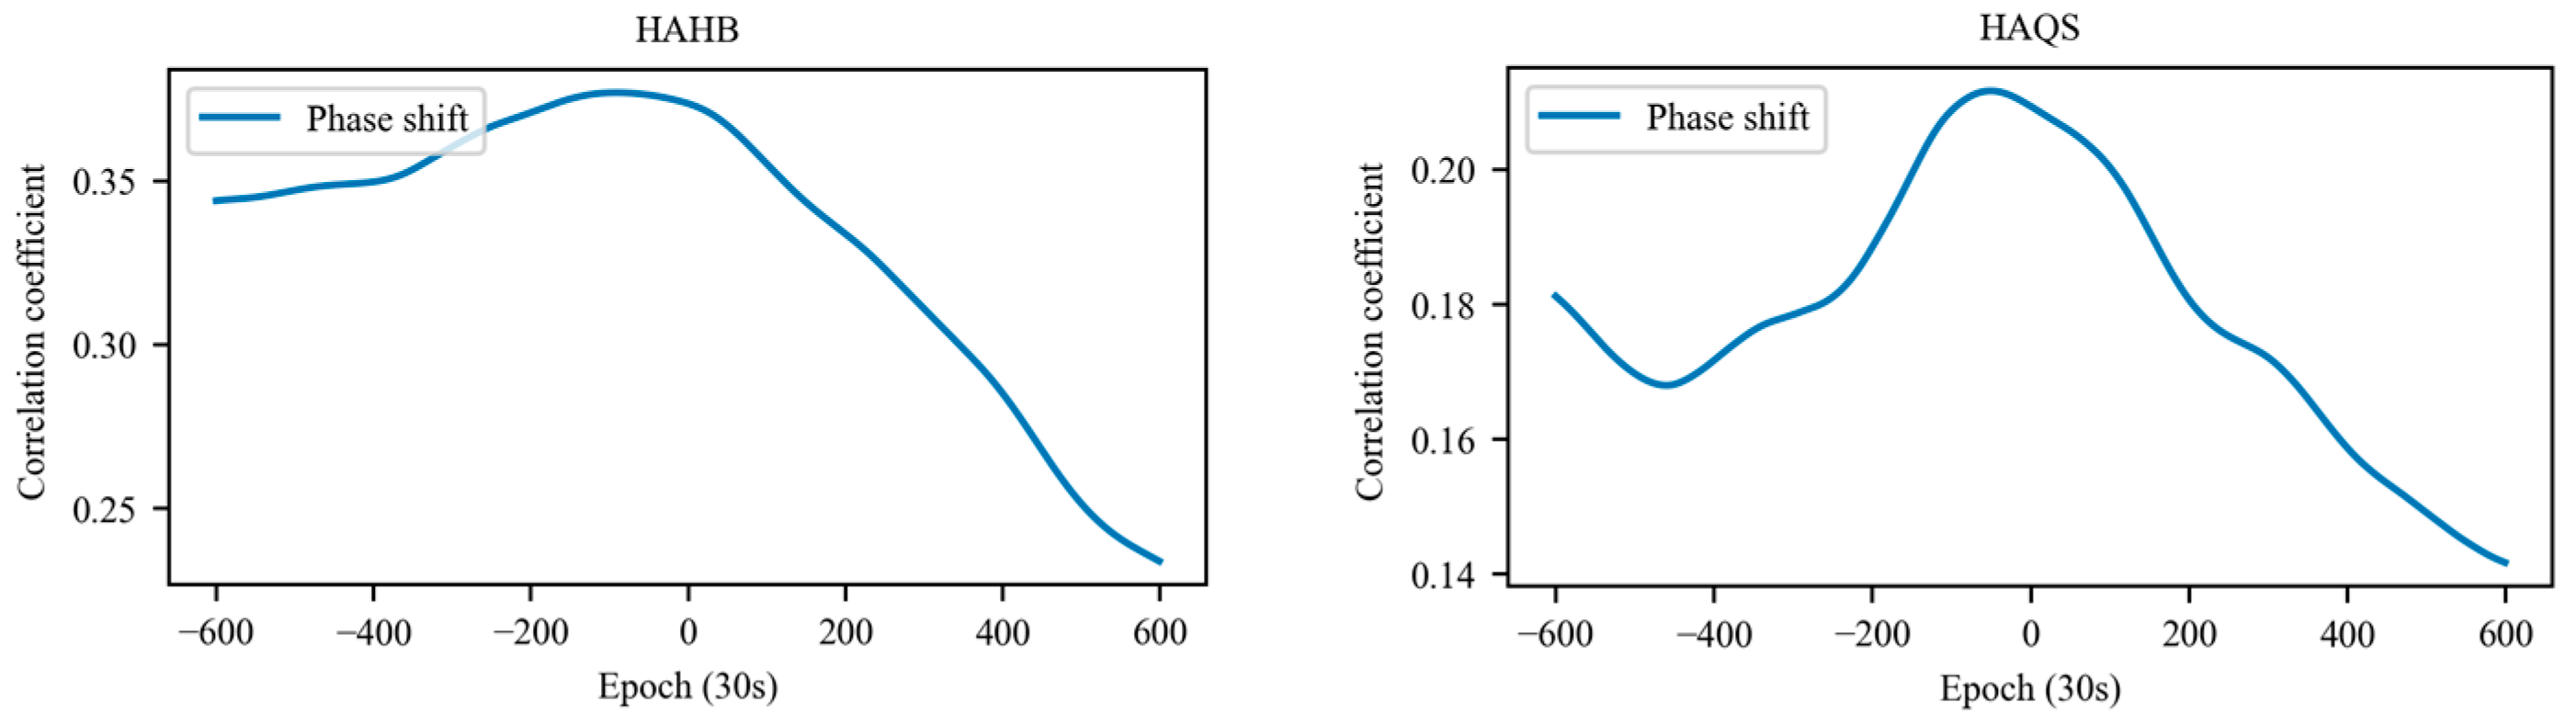
3.2. Correlation Analysis between the GNSS Derived Tropospheric Parameters and Rainfall Event

Based on the previous analysis, an optimal strategy for the real-time tropospheric parameters estimation is defined as that PPP based on the undifferenced uncombined functional model, with sine2-type weighting function, empirical SISRE weighting by down weighting noise of the code observation for the GLONASS/Galileo/BDS with a factor of 3, and estimating the horizontal gradients. Based on the strategy, we selected the data from the Crustal Movement Observation Network of China (CMONOC) to analyze the correlations of the GNSS-derived parameters with respect to the meteorological sensor data based on the “7–20” extreme rainfall event in Zhengzhou, China. Only GPS/GLONASS observations are available in the file with a sample of 30 s.
The extreme rainfall event that occurred in China’s Henan Province between 17 and 21 July 2021 is analyzed in this section. The center of the rainfall is mainly located around Zhengzhou where most meteorological stations have an accumulated rainfall of more than 250 mm. The distribution of the rainfall is presented in Figure 3 and its moving characteristics have been analyzed in [28]. Figure 4 shows the location of the GNSS stations in the Henan Province and their nearby meteorological stations with its records accessed from the China National Meteorological Information Center. Table 3 lists the position of the GNSS stations, as well as the height difference and distance between the GNSS and meteorological stations. Three station pairs with a relative distance of 10 Km and a relative elevation within 80 m are used for the analysis.
The data are processed with the optimal PPP strategies and the derived ZWD is converted to the PWV using the Tm calculated with the HGPT model. The resolution of the rainfall rate data is 1 h, while the ZWD is computed every 30 s. The PWV obtained from the ERA5 online web interface is compared to the PWV calculated using the HGPT model for validation. Figure 5 shows the variations of the PWV time series at ZHNZ station and the hourly rainfall from the nearby GNSS meteorological station for the period of DOY (Day Of Year) 191 to DOY 208. It is observed that the variations of ERA5 PWV show good consistency with respect to the GNSS PWV. The large discrepancy at the initial period of DOY 191 is caused by the poor convergence quality of PPP due to the limited number of satellites used in the processing. Afterward, the absolute discrepancy is within 10 mm with an average STD of 3 mm. The absolute PWV differences include the errors caused by GNSS ZWD estimation, HGPT Tm interpolation and ERA5 PWV calculation. Due to the high resolution of the GNSS-derived PWV, it can better capture the details of atmospheric variations.
When considering the relation between the PWV and rainfall, it indicates that an increasing trend can be clearly observed before the arrival of rainfall and reaches a relatively large value during rainfall. The PWV drops after the rainfall ends, reflecting their high correlations. However, the PWV increment rate is less correlated with heavy rainfall events. More specifically, the obvious PWV escalating trend from 30 mm to 60 mm occurs during 12:00, DOY 191 to 12:00, DOY 192. After a total rainfall of 14 mm within 3 h, the PWV decrease to 37 mm. Afterward, the PWV accumulated smoothly and maintained at a high level from DOY 193 to 199. During the heavy rainfall period from DOY 199 to DOY 203, the PWV maintained a high level due to the continuous supply of water vapor, resulting in the long extreme rainstorm. After the external water vapor cannot be sufficiently supplied, the PWV value is shown as falling to the magnitude of 30 mm.
Figure 6 shows the time series of the horizontal north gradients and east gradients with respect to the hourly rainfall at station ZHNZ. Generally, the magnitude of the gradients is within the range of 4 mm. The gradient variations are less correlated with rainfall. This is mainly due to that the tropospheric gradients reflect mainly the horizontal asymmetry rather than the water vapor in the atmosphere. It is also associated with the rotational motion of the earth around its own axis [21]. However, there is an uprush of the east horizontal gradients near 15:00, DOY 194, 2021. We believe that this is caused by the accumulation of water vapor in the east direction. However, due to the limited number of GNSS networks, the anomaly cannot be analyzed in depth.
The PWV time series and gradient variations are also analyzed at the station HAQS and HAHB for the period from DOY 191 to DOY 208, July 2021. By comparing the PWV magnitude and its variations to the rainfall in Figure 7, it is clear that the PWV maintains at a high level ≥ 50 mm before the rainfall. After the rain, the PWV falls to the magnitude of 35 mm. It can be concluded that the continuous water supply and abundant water vapor in the atmosphere can easily lead to heavy rainfall events. In comparison, the horizontal gradient parameters are not sensitive to the rainfall in the atmosphere, but they can be used to indicate the increasing amount of water vapor in the troposphere [29].
The cross-correlation method proposed by Zhang et al. [30] is used to describe the numerical causality between PWV/horizontal gradients and the rainfall at the meteorological station. As the sampling rate for the two datasets is different, the rainfall data is interpolated to the 30 s sampling, which is the same as the GNSS-derived parameters. Then, a phase shift ranging from −600 to 600 is applied to the rainfall data for calculating the correlation coefficients. Figure 8 and Figure 9 show the coefficients for the ZWD and horizontal north/east gradients at station ZHNZ, respectively. It is clearly observed that the correlations for the PWV are numerically more significant than the horizontal gradients. The correlation for PWV reaches the peak > 0.47 during a phase shift of 0 to 77 min, indicating that the rain starts after the PWV accumulates to the peak. In comparison, the correlations for horizontal gradients are below 0.2. When the coefficients for PWV reach the peak, the north and east gradient correlations reach the valley, indicating the tropospheric horizontal asymmetry is less correlated with the rainfall. Figure 10 shows the coefficients for the ZWD at station HAHB and HAQS, respectively. The phase shifts are −91 (40.5 min) and −50 (25 min), respectively, when the correlation reaches a maximum value. The PWV in the atmosphere accumulates continuously when the rainfall reaches the peak indicating the continuous water supply in the atmosphere. The coefficients and phase shift differ slightly at different stations because the path from PWV to the rainfall is a complicated process, but the high correlations between the ZWD/PWV and heavy rainfall event are validated.
To further investigate the performance of the proposed strategy and identify whether the unmolded tropospheric delays can be absorbed by the PPP residuals during the heavy rainfall event. Figure 11 shows the variation of the residuals with respect to the satellite elevation for PRN G02 and R22 at station HAHB. There is heavy rainfall on DOY 192; however, only the elevation-related variations can be observed for the two satellites. The results indicate that most of the tropospheric delays are absorbed by the estimated ZWD and gradient parameters. The residuals are mainly affected by the observation noise and the multipath effects.

4. Conclusions

GNSS is an all-weather, low-cost, and high-precision technique for sensing water vapor. In this study, the uncombined PPP model is used for the tropospheric parameters estimation and its correlations with respect to the heavy rainfall event are analyzed. We implement an optimized strategy for the ZWD estimation; the settings include a sine2 type weighting function, the down-weighting of the code observation for the GLONASS/Galileo/BDS with a factor of 3 and estimating the horizontal gradients. With the strategy, the accuracy of the troposphere reaches 8.77 mm when using the CNES real-time orbits/clocks and the forward Kalman filter method. The repeatability of the horizontal and vertical coordinates is 3.78 mm and 7.23 mm, respectively.
Then, the correlations of the tropospheric ZWD/PWV, horizontal gradients and the slant residuals with the heavy rainfall event are analyzed. Results show the PWV variations are highly correlated with the rainfall event, the PWV accumulates before the rainfall event and falls to the normal level after the rainfall event. An accumulated PWV value of ≥50 mm can be an indicator of heavy rainfall. The duration of the rainfall depends on whether there is a continuous water vapor supply. In comparison, the tropospheric gradients are less correlated with the water vapor content. The north or the east gradients are generally within the range of 4 mm and their reaction to the heavy rainfall is mainly indicating the water vapor asymmetry in the atmosphere. The slant residuals show a strong correlation with the satellite elevations, their magnitude is not obviously enlarged during the heavy rainfall period, which indicates the proposed optimal PPP strategy can absorb the troposphere residuals to the ZTD or the gradient parameters.
Extreme rainstorms can cause heavy casualties and huge economic losses. Our results validated that the proposed strategy can obtain high-accuracy PWV in real time and can be used for server weather monitoring; however, the rainfall prediction method is not investigated in the paper. One reason is that there are limited GNSS stations and meteorological stations access. Another reason is that the commonly used indicator, including the maximum PWV, and the hourly/daily PWV variations are not enough for rainfall prediction.

Author Contributions

Conceptualization, L.Z. and J.S.; methodology, J.S.; software, L.Z.; validation, M.C.; formal analysis, M.C.; writing—original draft preparation, J.S.; writing—review and editing, M.C. and L.Z. All authors have read and agreed to the published version of the manuscript.

Funding

This research was funded by the National Natural Science Foundation of China (Grant 42104018) and the China Postdoctoral Science Foundation funded project (2022M711669).

Institutional Review Board Statement

Not applicable.

Informed Consent Statement

Not applicable.

Data Availability Statement

MGEX observations files and IGS final ZTD are available at public repositories: https://urs.earthdata.nasa.gov/ (accessed on 26 December 2022). Real-time multi-GNSS orbit and clock products are available in the CNES repository http://www.ppp-wizard.net/products/REAL_TIME/ (accessed on 26 December 2022). GNSS data from the Crustal Movement Observation Network of China (CMONOC) is available through The First Monitoring and Application Center, China Earthquake Administration.

Acknowledgments

The Crustal Movement Observation Network of China (CMONOC) is thanked for providing the GNSS data.

Conflicts of Interest

The authors declare no conflict of interest.

References

  1. Baker, H.C.; Dodson, A.H.; Penna, N.T.; Higgins, M.; Offiler, D. Ground-based GPS water vapour estimation: Potential for meteorological forecasting. J. Atmos. Sol. Terr. Phys. 2001, 63, 1305–1314. [Google Scholar] [CrossRef]
  2. Zhao, L.; Václavovic, P.; Douša, J. Performance evaluation of troposphere estimated from galileo-only multi-frequency observations. Remote Sens. 2020, 12, 373. [Google Scholar] [CrossRef] [Green Version]
  3. Davis, J.L.; Herring, T.A.; Shapiro, I.I.; Rogers, A.; Elgered, G. Geodesy by radio interferometry: Effects of atmospheric modeling errors on estimates of baseline length. Radio Sci. 1985, 20, 1593–1607. [Google Scholar] [CrossRef]
  4. Saastamoinen, J. Contributions to the theory of atmospheric refraction. Bull. Géodésique 1972, 105, 279–298. [Google Scholar] [CrossRef]
  5. Huang, L.; Zhu, G.; Peng, H.; Liu, L.; Ren, C.; Jiang, W. An improved global grid model for calibrating zenith tropospheric delay for GNSS applications. GPS Solut. 2023, 27, 1–14. [Google Scholar] [CrossRef]
  6. Bevis, M.; Businger, S.; Chiswell, S.; Herring, T.A.; Anthes, R.A.; Rocken, C.; Ware, R.H. GPS meteorology: Mapping zenith wet delays onto precipitable water. J. Appl. Meteorol. 1994, 33, 379–386. [Google Scholar] [CrossRef]
  7. Dee, D.P.; Uppala, S.M.; Simmons, A.J.; Berrisford, P.; Poli, P.; Kobayashi, S.; Andrae, U.; Balmaseda, M.A.; Balsamo, G.; Bauer, D.P.; et al. The ERA-Interim reanalysis: Configuration and performance of the data assimilation system. Q. J. R. Meteorol. Soc. 2011, 137, 553–597. [Google Scholar] [CrossRef]
  8. Zhang, W.; Zhang, H.; Liang, H.; Lou, Y.; Cai, Y.; Cao, Y.; Zhou, Y.; Liu, W. On the suitability of ERA5 in hourly GPS precipitable water vapor retrieval over China. J. Geod. 2019, 93, 1897–1909. [Google Scholar] [CrossRef]
  9. Zhang, W.; Lou, Y.; Haase, J.S.; Zhang, R.; Zheng, G.; Huang, J.; Shi, C.; Liu, J. The use of ground-based GPS precipitable water measurements over China to assess radiosonde and ERA-Interim moisture trends and errors from 1999 to 2015. J. Clim. 2017, 30, 7643–7667. [Google Scholar] [CrossRef]
  10. Zhou, Y.; Lou, Y.; Zhang, W.; Kuang, C.; Liu, W.; Bai, J. Improved performance of ERA5 in global tropospheric delay retrieval. J. Geod. 2020, 94, 1–14. [Google Scholar] [CrossRef]
  11. Huang, L.; Wang, X.; Xiong, S.; Li, J.; Liu, L.; Mo, Z.; Fu, B.; He, H. High-precision GNSS PWV retrieval using dense GNSS sites and in-situ meteorological observations for the evaluation of MERRA-2 and ERA5 reanalysis products over China. Atmos. Res. 2022, 276, 106247. [Google Scholar] [CrossRef]
  12. Liu, G.; Huang, G.; Xu, Y.; Ta, L.; Jing, C.; Cao, Y.; Wang, Z. Accuracy Evaluation and Analysis of GNSS Tropospheric Delay Inversion from Meteorological Reanalysis Data. Remote Sens. 2022, 14, 3434. [Google Scholar] [CrossRef]
  13. Huang, L.; Jiang, W.; Liu, L.; Chen, H.; Ye, S. A new global grid model for the determination of atmospheric weighted mean temperature in GPS precipitable water vapor. J. Geod. 2019, 93, 159–176. [Google Scholar] [CrossRef]
  14. Mateus, P.; Catalão, J.; Mendes, V.B.; Nico, G. An ERA5-based hourly global pressure and temperature (HGPT) model. Remote Sens. 2020, 12, 1098. [Google Scholar] [CrossRef] [Green Version]
  15. Shi, J.; Xu, C.; Guo, J.; Gao, Y. Real-Time GPS precise point positioning-based precipitable water vapor estimation for rainfall monitoring and forecasting. IEEE Trans. Geosci. Remote Sens. 2015, 53, 3452–3459. [Google Scholar]
  16. Barindelli, S.; Realini, E.; Venuti, G.; Fermi, A.; Gatti, A. Detection of water vapor time variations associated with heavy rain in northern Italy by geodetic and low-cost GNSS receivers. Earth Planets Space 2018, 70, 28. [Google Scholar] [CrossRef] [Green Version]
  17. Huang, L.; Mo, Z.; Xie, S.; Liu, L.; Chen, J.; Kang, C.; Wang, S. Spatiotemporal characteristics of GNSS-derived precipitable water vapor during heavy rainfall events in Guilin, China. Satell. Navig. 2021, 2, 1–17. [Google Scholar] [CrossRef]
  18. Manandhar, S.; Lee, Y.H.; Meng, Y.S. GPS-PWV based improved long-term rainfall prediction algorithm for tropical regions. Remote Sens. 2019, 11, 2643. [Google Scholar] [CrossRef] [Green Version]
  19. Li, L.; Zhang, K.; Wu, S.; Li, H.; Wang, X.; Hu, A.; Li, W.; Fu, E.; Zhang, M.; Shen, Z. An Improved Method for Rainfall Forecast Based on GNSS-PWV. Remote Sens. 2022, 14, 4280. [Google Scholar] [CrossRef]
  20. Biswas, A.N.; Lee, Y.H.; Manandhar, S. Rainfall forecasting using GPS derived atmospheric gradient and residual for tropical region. IEEE Trans. Geosci. Remote Sens. 2022, 60, 1–10. [Google Scholar] [CrossRef]
  21. Graffigna, V.; Hernández-Pajares, M.; Azpilicueta, F.; Gende, M. Comprehensive Study on the Tropospheric Wet Delay and Horizontal Gradients during a Severe Weather Event. Remote Sens. 2022, 14, 888. [Google Scholar] [CrossRef]
  22. Heh, D.Y.; Lee, Y.H.; Biswas, A.N.; Koh, L.M. GPS-Derived Slant Water Vapor for Cloud Monitoring in Singapore. Remote Sens. 2022, 14, 5459. [Google Scholar] [CrossRef]
  23. Vaclavovic, P.; Dousa, J.; Gyori, G. G-Nut software library-state of development and first results. Acta Geodyn. Geomater. 2013, 10, 431–436. [Google Scholar] [CrossRef] [Green Version]
  24. Douša, J.; Václavovic, P.; Bezdĕka, P.; Guerova, G. European GNSS troposphere monitoring for meteorological applications. In Proceedings of the IOP Conference Series: Earth and Environmental Science, Prague, Czech Republic, 6–10 September 2021; IOP Publishing: Bristol, UK, 2021; Volume 906, p. 012058. [Google Scholar]
  25. Hadas, T.; Hobiger, T.; Hordyniec, P. Considering different recent advancements in GNSS on real-time zenith troposphere estimates. GPS Solut. 2020, 24, 1–14. [Google Scholar] [CrossRef]
  26. Kazmierski, K.; Hadas, T.; Sośnica, K. Weighting of multi-GNSS observations in real-time precise point positioning. Remote Sens 2018, 10, 84. [Google Scholar] [CrossRef] [Green Version]
  27. Byun, S.H.; Bar-Sever, Y.E. A new type of troposphere zenith path delay product of the international GNSS service. J. Geod. 2009, 83, 367–373. [Google Scholar] [CrossRef] [Green Version]
  28. Duan, C.; Zheng, X.; Jin, L.; Chen, Y.; Li, R.; Yang, Y. Study on the Remote Sensing Spectral Method for Disaster Loss Inversion in Urban Flood Areas. Water 2022, 14, 2165. [Google Scholar] [CrossRef]
  29. Douša, J.; Dick, G.; Kačmařík, M.; Brožková, R.; Zus, F.; Brenot, H.; Stoycheva, A.; Möller, G.; Kaplon, J. Benchmark campaign and case study episode in central Europe for development and assessment of advanced GNSS tropospheric models and products. Atmos. Meas. Tech. 2016, 9, 2989–3008. [Google Scholar] [CrossRef]
  30. Zhang, F.; Feng, P.; Barriot, J.; Hopuare, M.; Sichoix, L. Correlation between integrated precipitable water vapor and precipitated water during the heavy rainfall event of February 2018 in the Tahiti Island (South Pacific). In Proceedings of the International Conference on Earth Observations and Societal Impacts (ICEO&SI), Taiwan, China, 1–3 July 2018; pp. 1–4. [Google Scholar]
Figure 1. Distribution of the MGEX stations.
Atmosphere 14 00046 g001
Figure 2. Time series of ZWD (TRPWET) and the north gradient difference (TGNTOT) from different schemes for station RGDG (top) and PNGM (bottom).
Atmosphere 14 00046 g002
Figure 3. Distribution of rainfall in Henan Province from 19 July to 22 July: (a) Rainfall distribution on 19 July; (b) Rainfall distribution on 20 July; (c) Rainfall distribution on 21 July; (d) Rainfall distribution on 22 July.
Atmosphere 14 00046 g003
Figure 4. GNSS stations and the meteorological station used for the analysis.
Atmosphere 14 00046 g004
Figure 5. Time series of the GNSS derived PWV (GNSS-PWV) and ERA5 derived PWV (ERA5-PWV) with respect to the hourly rain at the nearby meteorological station.
Atmosphere 14 00046 g005
Figure 6. Time series of the horizontal north gradients (grdN) and east gradients (grdE) with respect to the hourly rain at the nearby meteorological station.
Atmosphere 14 00046 g006
Figure 7. Time series of PWV and horizontal gradients with respect to the hourly rain for station HAQS and HAHB.
Atmosphere 14 00046 g007
Figure 8. Correlation coefficients between the PWV and rainfall.
Atmosphere 14 00046 g008
Figure 9. Correlation coefficients between horizontal north (left) and east gradient (right) with respect to the rainfall.
Atmosphere 14 00046 g009
Figure 10. Correlation coefficients between the PWV and rainfall for station HAHB and HAQS, respectively.
Atmosphere 14 00046 g010
Figure 11. Time variations of residuals with respect to the elevation for station HAHB.
Atmosphere 14 00046 g011
Table 1. Processing strategies for the multi-GNSS troposphere estimation.
ItemStrategies
EstimatorForward Kalman
Satellite orbitFixed with CNES real-time orbits
Satellite clockFixed with CNES real-time clocks
ObservationsCarrier phase with a noise of 0.003 m for GPSP
seudorange with a noise of 0.3 m for GPS
Elevation mask angle7 degree
Station displacementSolid Earth tides, ocean tide loading, pole
tides, IERS Convention 2010
Earth rotation parameterFixed
Antenna phase centerCorrected with “igs14_ wwww.atx” file
Zenith Tropospheric delayZHD: Saastamoinen model
ZWD: estimated with random-walk
Mapping function: GMF
Tropospheric gradientsEstimated, epoch-wise random-walk
Receiver clock Estimated as white noise
ISB and IFBEstimated as constant, GPS as reference
Station coordinateStatic: estimated and modeled as constants
Phase ambiguitiesEstimated as constants, float solution
Table 2. The STD of the estimated ZTD ( σ Z T D ), repeatability of horizontal ( σ H ) and vertical ( σ V ) coordinates using different schemes.
Weighting FunctionSISRE WeightingZTD [mm]ZTD + GRD [mm]
σ Z T D σ H σ V σ Z T D σ H σ V
sin 2 e No8.755.128.448.724.808.05
sin 2 e Yes8.573.646.958.403.436.42
cos e Yes9.263.758.118.773.787.23
Table 3. Location of GNSS stations and their relative elevation/distance to the meteorological station.
GNSS StationsMeteorological
Stations
Latitude
(°)
Longitude
(°)
Height Difference
(m)
Distance
(Km)
ZHNZ5708234.52075113.104971.7510.44
HAHB5399235.65847114.519115.873.68
HAJY5397835.16256112.4475132.4418.97
HAQS5729432.84514114.026513.215.03
Disclaimer/Publisher’s Note: The statements, opinions and data contained in all publications are solely those of the individual author(s) and contributor(s) and not of MDPI and/or the editor(s). MDPI and/or the editor(s) disclaim responsibility for any injury to people or property resulting from any ideas, methods, instructions or products referred to in the content.

