Article

Hybrid Methods’ Integration for Remote Sensing Monitoring and Process Analysis of Dust Storm Based on Multi-Source Data

1
College of Resources and Environment, University of Chinese Academy of Sciences, Beijing 100049, China
2
Beijing Yanshan Earth Critical Zone National Research Station, University of Chinese Academy of Sciences, Beijing 101408, China
3
Zhejiang Key Laboratory of Ecological and Environmental Monitoring, Forewarning and Quality Control, Hangzhou 310012, China
4
Zhejiang Province Ecological Environment Monitoring Centre, Hangzhou 310012, China
*
Author to whom correspondence should be addressed.
Atmosphere 2023, 14(1), 3; https://doi.org/10.3390/atmos14010003
Submission received: 10 November 2022 / Revised: 6 December 2022 / Accepted: 16 December 2022 / Published: 20 December 2022
(This article belongs to the Section Atmospheric Techniques, Instruments, and Modeling)

Abstract

:
Dust storms are of great importance to climate change, air quality, and human health. In this study, a complete application frame of integrating hybrid methods based on multi-source data is proposed for remote sensing monitoring and process analysis of dust storms. In the frame, horizontal spatial distribution of dust intensity can be mapped by optical remote sensing products such as aerosol optical depth (AOD) from MODIS; the vertical spatial distribution of dust intensity by LIDAR satellite remote sensing products such as AOD profile from CALIPSO; geostationary satellite remote sensing products such as Chinese Fengyun or Japanese Himawari can achieve high-frequency temporal distribution information of dust storms. More detailed process analysis of dust storms includes air quality analysis supported by particulate matter (PM) data from ground stations and the dust emission trace and transport pathways from HYSPLIT back trajectory driven by meteorological data from the Global Data Assimilation System (GDAS). The dust storm outbreak condition of the source location can be proved by precipitation data from the WMO and soil moisture data from remote sensing products, which can be used to verify the deduced emission trace from HYSPLIT. The proposed application frame of integrating hybrid methods was applied to monitor and analyze a very heavy dust storm that occurred in northern China from 14–18 March 2021, which was one of the most severe dust storms in recent decades. Results showed that the dust storm event could be well monitored and analyzed dynamically. It was found that the dust originated in western Mongolia and northwestern China and was then transmitted along the northwest–southeast direction, consequently affected the air quality of most cities of northern China. The results are consistent with the prior research and showed the excellent potential of the integration of the hybrid methods in monitoring dust storms.

1. Introduction

Dust storms are typical catastrophic weather in arid and semi-arid regions. They are weather phenomena in which strong winds sweep large amounts of sand and dust from the ground into the air, resulting in dirty air and significantly reduced visibility [1]. Dust storms play an important role in global climate change and have become one of the most serious environmental problems. Dust particles significantly impact climate by further altering the Earth’s radiation balance through absorption and scattering of short-wave and long-wave radiation [2]. In addition, solar radiation absorption and scattering caused by dust events may affect air temperature, causing significant adverse effects on human health and ecosystems, even leading to economic and human life loss [1]. To accurately analyze the spatial and temporal variability of dust aerosols, continuous monitoring from the source of dust to its impact area is essential. Therefore, it is very important to monitor the occurrence of dust events and study their transportation and distribution.
In addition to traditional ground station observations, satellite remote sensing plays an important role in the dynamic monitoring of dust distribution and change processes during strong dust storms [3]. Currently, the satellites or sensors widely used to study dust weather mainly include the ultraviolet sensor TOMS, ozone monitor OMI, MODIS sensor of the Terra satellite and AVHRR sensor of NOAA satellites [4,5,6,7,8,9]. Furthermore, compared with polar orbiting satellites, geostationary satellites can observe fixed areas with high temporal resolution, which can provide continuous observation data for dust storm process monitoring [10]. Therefore, geostationary satellites have given new ideas and ways to monitor, trace and analyze dust storms [8,11,12,13,14,15,16]. FY-4A is the next-generation geostationary satellite in China, which is equipped with Advanced Geostationary Radiation Imager (AGRI), and it can detect dust weather of East Asia with high efficiency under cloudless weather conditions. It is one of Asia’s best choices for dust storm monitoring. However, single-source remote sensing data have obvious limitations and cannot fully characterize the dust storm. Therefore, integrated approaches, such as multi-temporal or multi-sensor approaches, are widely used to monitor extreme sand and dust events.
Previous studies have shown that the combination of satellite remote sensing and ground-based observation data provides a good analysis of dust storm events, including identifying dust source areas and propagation trajectories [17,18,19,20,21,22,23,24,25,26]. For example, Guo et al. [24] utilized the aerosol optical depth (AOD) data from MODIS aboard Satellite Aqua, along with the altitude-resolved aerosol types from CALIOP and surface PM10 measurements, to investigate the dust activities in the springtime of northern China. Using a variety of satellite observations and meteorological data, Li et al. [23] investigated the sources, transport pathways, vertical distribution and formation processes of an intense dust storm event that occurred in the Sichuan Basin from 9–14 March 2013. Attiya et al. [18] examined the synoptic weather conditions, and assessed the air quality and identified the source and transport trajectory of the dust storm over Sydney using ground and satellite remote sensing data. Wu et al. [27] used ground-based measurements, remote sensing data and the HYSPLIT model to study the aerosol pollution sources and aerosol optical properties of a typical dust storm event that occurred in northwest China in 2018.
In March 2021, China’s northern regions suffered the largest intensity and widest range of a dust invasion process in the past ten years, with a dust area of more than 3.8 million km2. PM10 concentrations exceeded 5000 μg/m3 in several cities in northern China, with exceptionally severe dust storms in some parts of Inner Mongolia and another dust storm in Beijing. Cities in Gansu, Ningxia, Shaanxi, Shanxi, Hebei and Tianjin also experienced varying degrees of sand and dust storm weather. It can be seen that sandstorm weather is still one of the atmospheric environmental problems that cannot be ignored in the 21st century [28]. Several studies have already provided information of this severe dust storm event in March 2021 from ground-based sensors, satellites and atmospheric models [29,30,31,32,33,34,35,36]. Filonchyk et al. [29] stated that the cause of the dust storm was a cyclone with a significant drop in pressure leading to high winds and dry components of the soil over parts of the Gobi Desert becoming airborne. They also studied the dust transport routes, emission source regions and vertical characteristics of aerosols in the dust storm. Luo et al. [30] carried out a day-and-night continuous monitoring of the dust transport path using multi-spectral data from the FY-4A satellite combined with the Himawary-8 from visible to near-infrared, mid-infrared and far-infrared bands. Moreover, they deduced that western Mongolia and arid and semi-arid regions of the northwest of China are the primary sources of this dust storm affecting Beijing from Hybrid Single Particle Lagrangian Integrated Trajectory (HYSPLIT) backward tracking results. Liang et al. [31] investigated the dust storm using MODIS imagery and real-time air quality data to show the visible dust plumes in China first appeared on the morning of 15 March 2021. They also used CALIPSO data to obtain the vertical dust distribution, and geochemical sample data to demonstrate that the precipitated dust particles across northern China during the dust storm were composed of highly mixed dust sourced from the erodible surface along the air mass moving trajectories. These specific studies reveal that any single kind of data has drawbacks, comparatively, multi-source data integration performance is significantly superior for dust storm events.
Therefore, we proposed a complete application frame of integrating hybrid methods based on multi-source data for remote sensing monitoring and process analysis of dust storms. Then, we applied it to the severe dust storm event in north China in March 2021, in which the high temporal resolution Chinese geostationary satellite FY-4A dust fraction product (DST) was used to analyze the dynamic process of this dust event [26]. Daily precipitation data and soil moisture data were proposed to prove the condition of the emission source location.
This paper is structured as follows. Section 2 describes data and methodology, including ground station data, satellite remote sensing data and other auxiliary data such as meteorological data. Section 3 shows our research results and discussion, mainly concerned with spatial–temporal distribution, air quality impact, transport path and emission source deduction. Section 4 presents the conclusions, which show that the proposed application frame has good potential for the monitoring and process analysis of dust storms in the future.

2. Data and Methodology
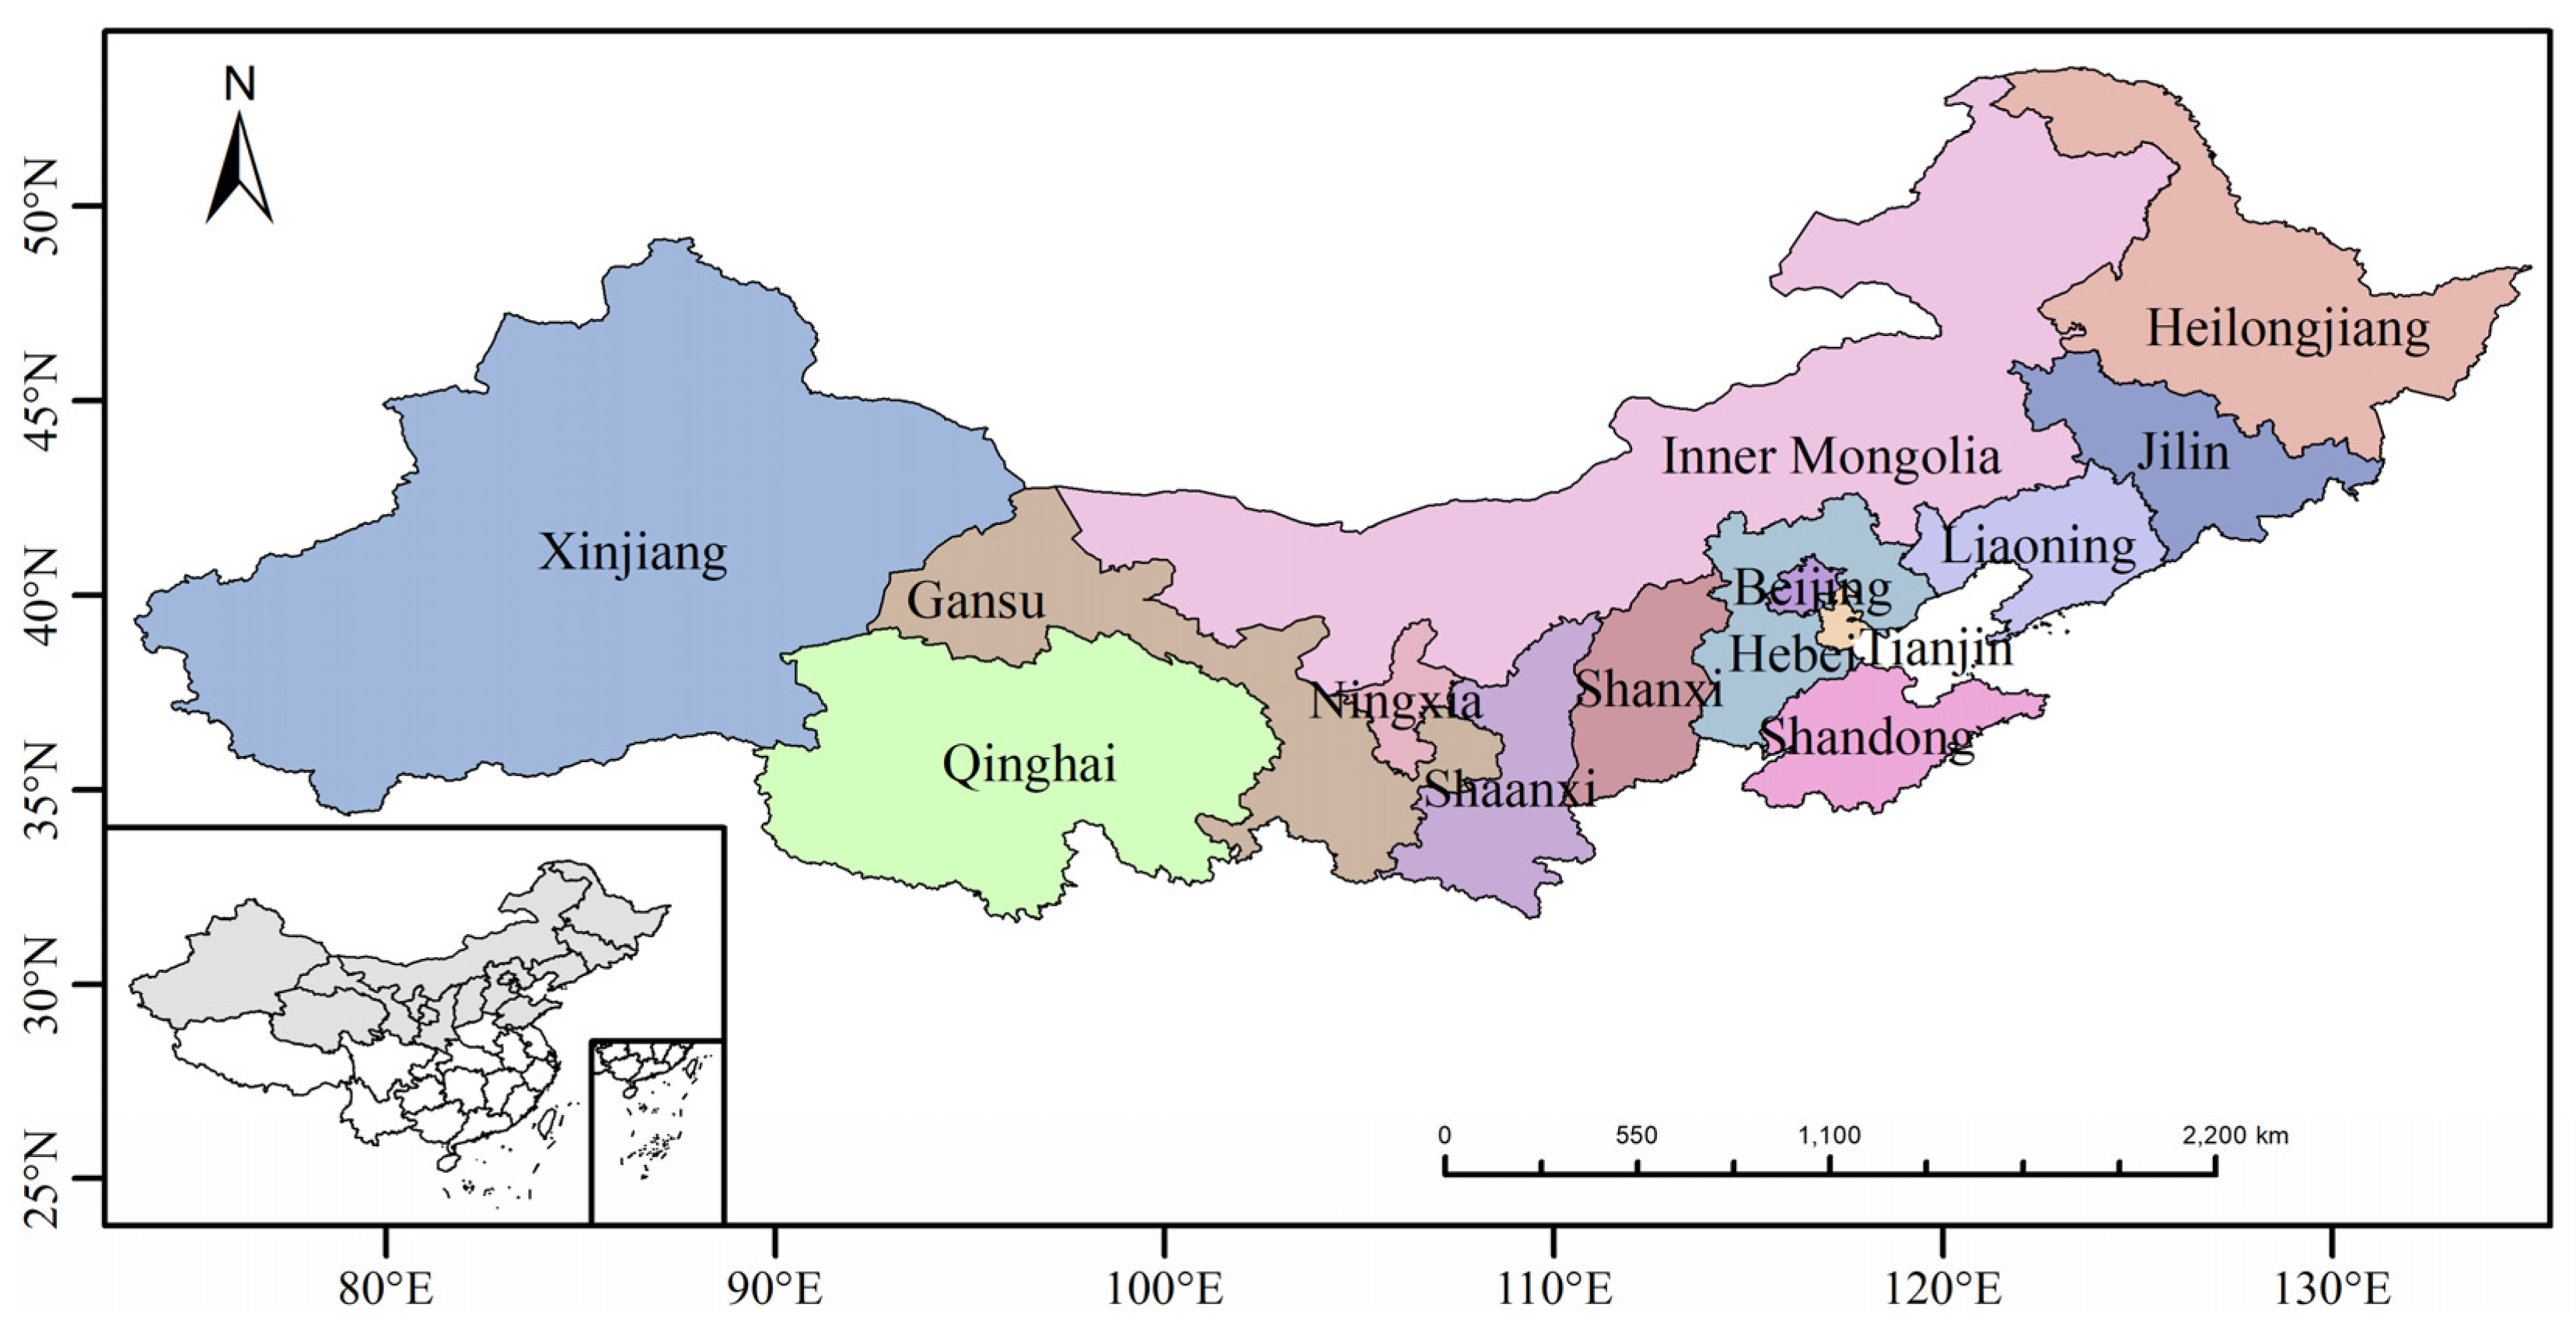
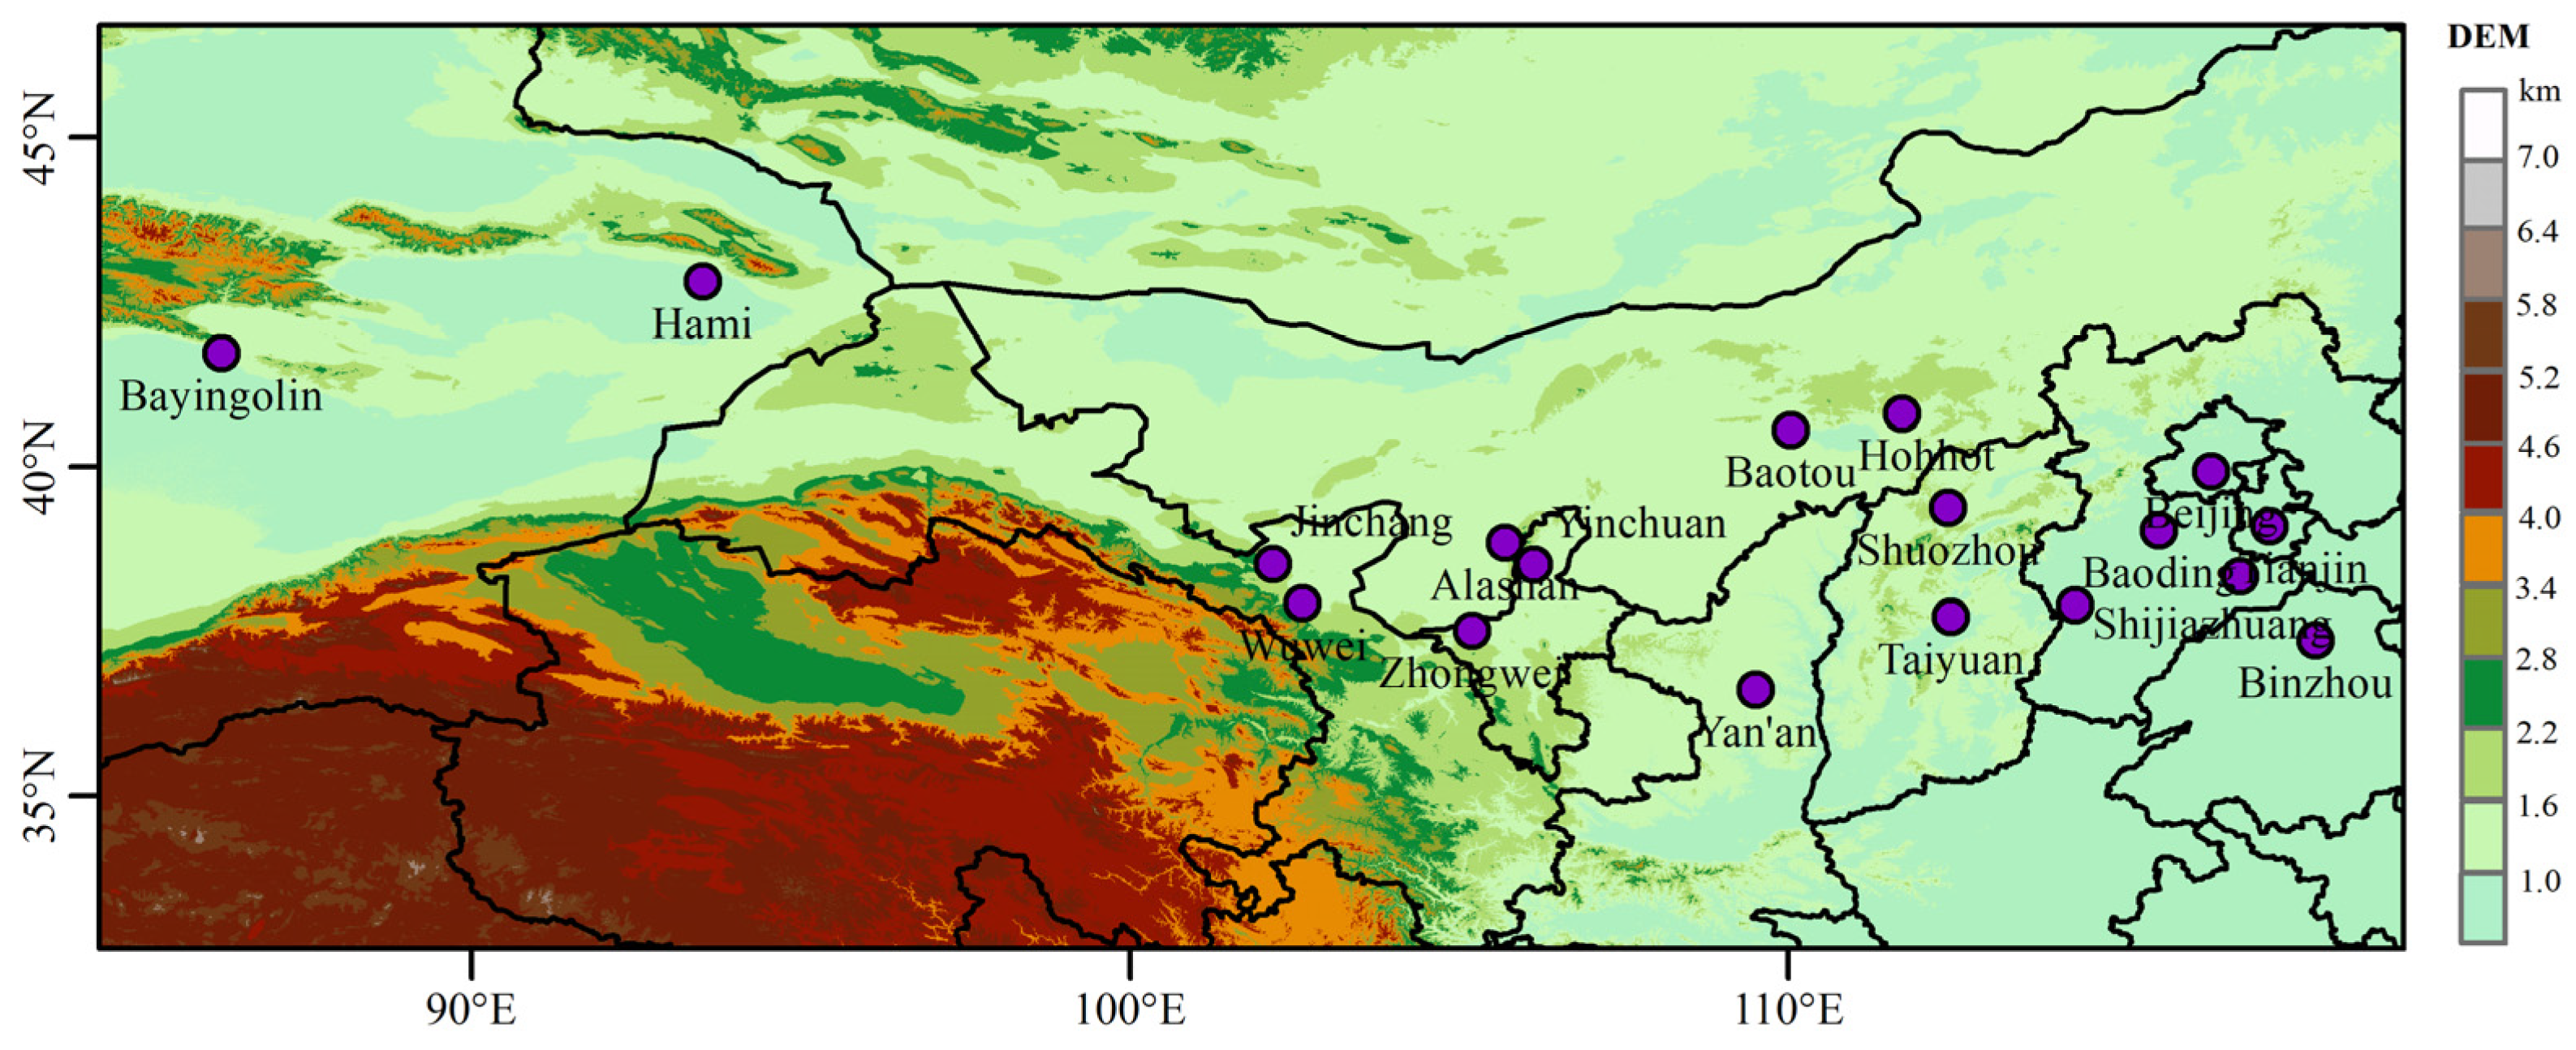
2.1. Study Area

The dust storm event from 14–18 March 2021 (previous research called it the “3.15”dust storm [29]) was the application case in this research, so the study area focused on the northern regions of China affected by this dust storm event, mainly including the cities of Beijing and Tianjin, and the provinces of Xinjiang, Qinghai, Gansu, Ningxia, Inner Mongolia, Shaanxi, Shanxi, Hebei, Shandong, Liaoning, Jilin and Heilongjiang (Figure 1). The region is located at mid-latitudes in the Northern Hemisphere and has a predominantly temperate continental climate with a large area and complex topography. The region’s area is approximately 5,505,000 km2. It contains the biggest desert in China, the Taklimakan desert, and it contributes approximately 60% of the Asian sandstorms [37,38].

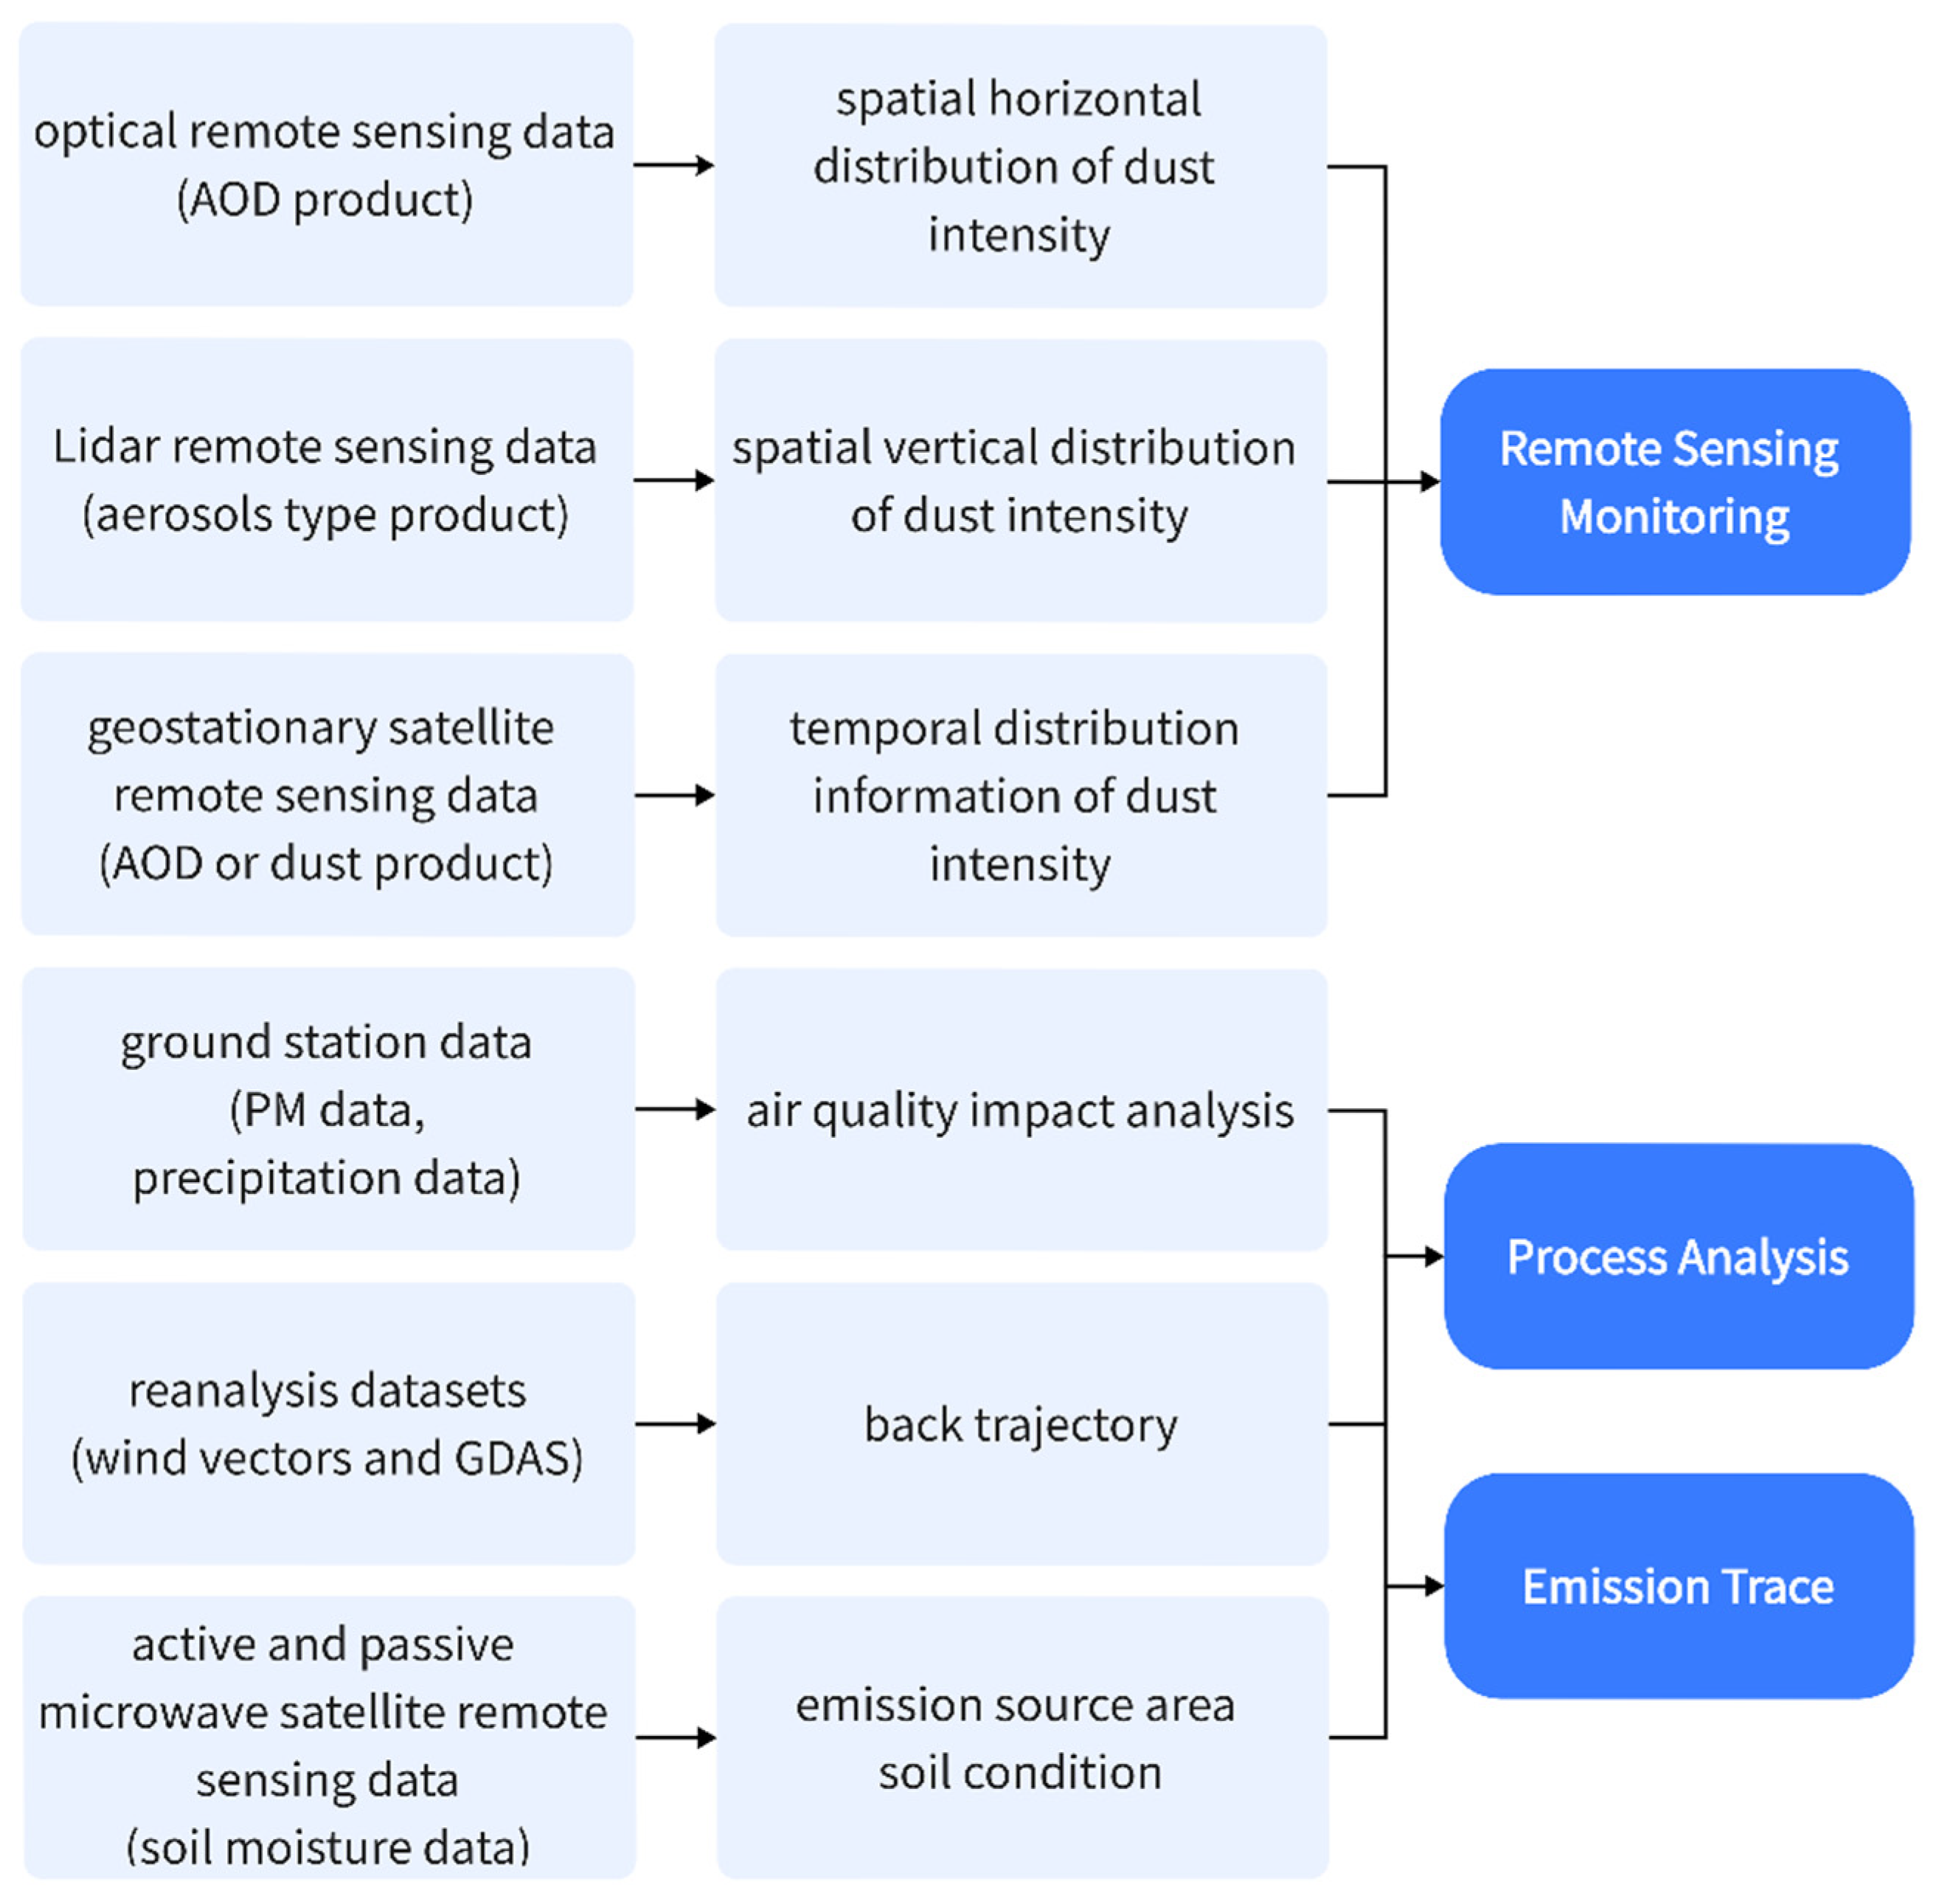
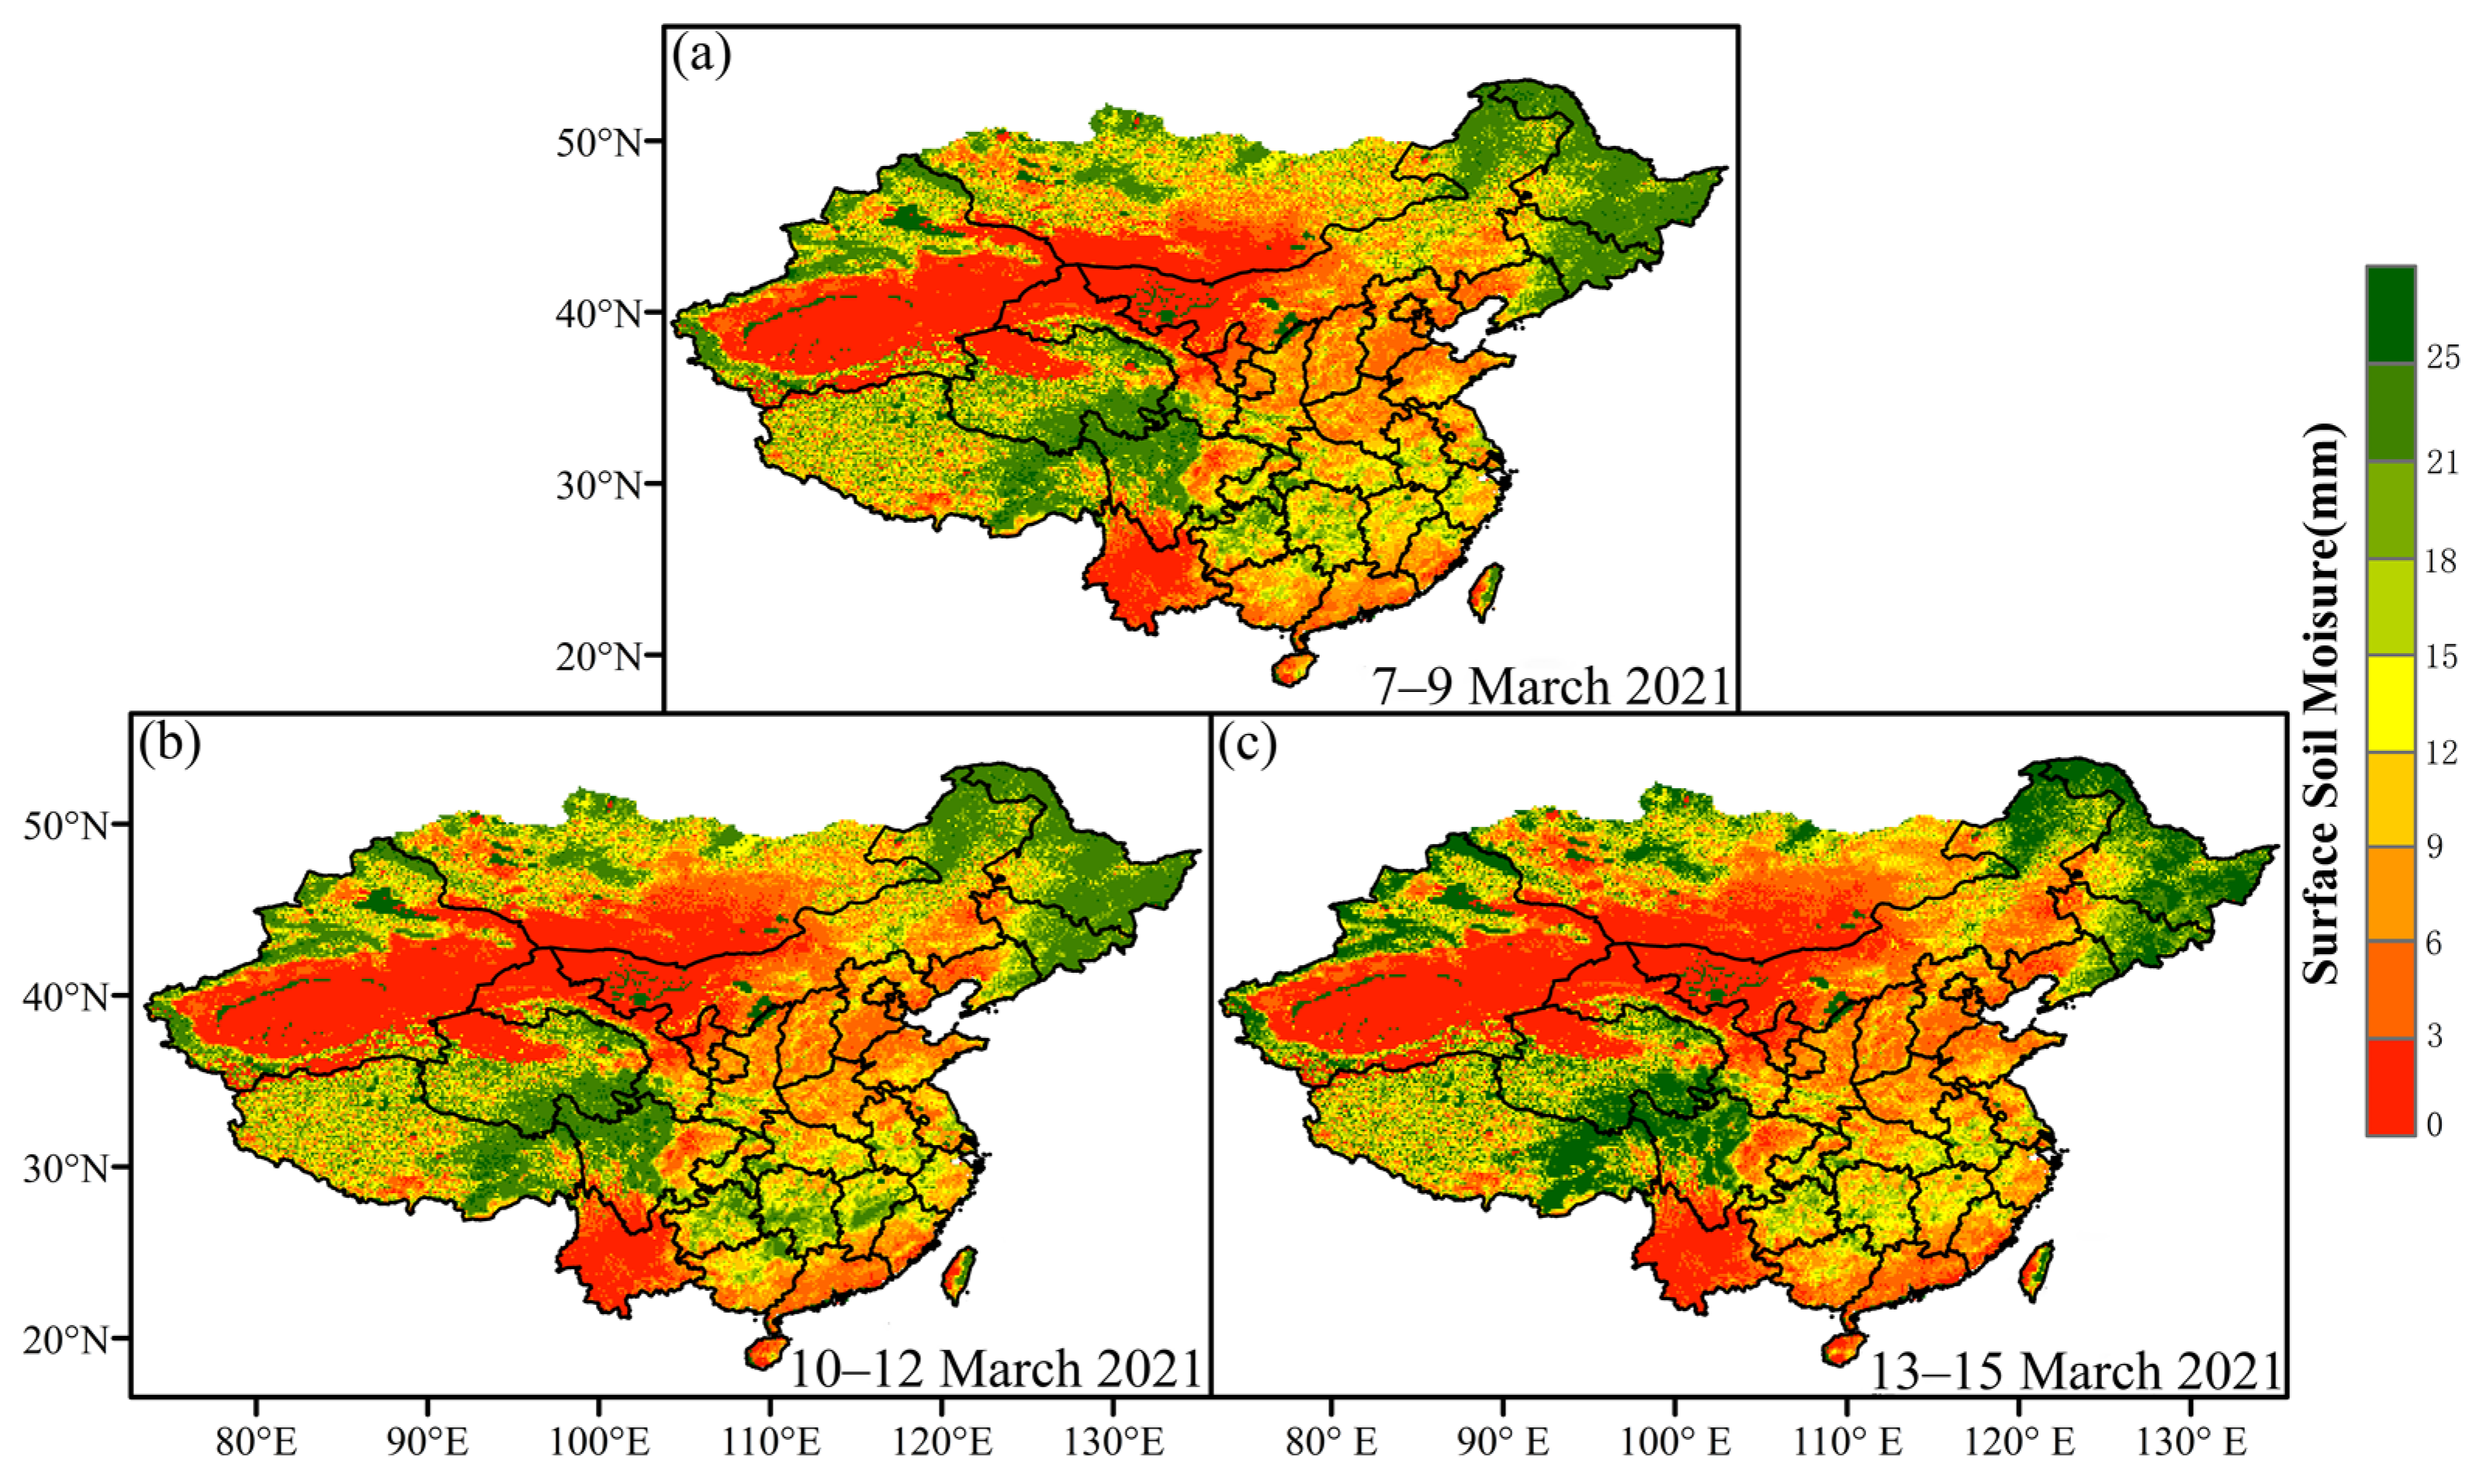
2.2. Multi-Source Data

In this paper, we use multi-source data from 14–18 March 2021 to study this dust storm event that occurred in northern China, which can be classified into ground station data, satellite remote sensing data and reanalysis datasets (Table 1). Due to the diverse data sources and different scales, all data were first transformed into Beijing time and mapped according to the time series. The time series throughout the text are in Beijing time if not otherwise specified.

2.2.1. Ground Station Data

Air quality monitoring station data came from China National Environmental Monitoring Center (CNEMC) (http://www.cnemc.cn/) (accessed on 17 September 2021). Eighteen ground stations in Beijing, Tianjin, Baoding and Hohhot, where the storm occurred severely, were selected to study the changes in ground-level air quality during the dust storm event.
Daily cumulative precipitation data came from ground stations with global coverage provided by the World Meteorological Organization (WMO, https://worldweather.wmo.int) (accessed on 15 October 2022), and the precipitation data were used to study the weather conditions for the occurrence of dust storms in the emission source area.

2.2.2. Satellite Remote Sensing Data

The aerosol optical depth (AOD) data came from the latest aerosol product released by NASA, MCD19A2, which uses the Multi-Angle Implementation of Atmospheric Correction (MAIAC) algorithm with a spatial resolution of 1 km [39]. The AOD at 550 nm was selected for the research.
The full disk data of the dust detection (DSD) level-2 product were provided by the FY-4A satellite from the China National Meteorological Satellite Center. It characterizes dust concentration at spatial and temporal resolutions of 4 km and 1 h [40]. The main product used in this study is the dust fraction (DST) data from the DSD dataset.
The Cloud-Aerosol LIDAR with Orthogonal Polarization (CALIOP) is among the major instruments on the Cloud-Aerosol LIDAR and Infrared Pathfinder Satellite Observations (CALIPSO) satellite. It is capable of obtaining information on the vertical distribution of clouds and aerosols on a global or regional scale [41]. CALIPSO Level 2 Version 4.21 vertical feature mask (VFM) classified aerosols into six categories, which could be used to study the vertical distribution characteristics of aerosols during the event.
Soil moisture data came from active and passive microwave satellite remote sensing data of SMAP (https://nsidc.org/data/smap) (accessed on 10 October 2022). The NASA–USDA global soil moisture and the NASA–USDA SMAP global soil moisture data provide soil moisture information across the globe at a 0.25° × 0.25° spatial resolution. These datasets include surface and subsurface soil moisture (mm), soil moisture profile (%) and surface and subsurface soil moisture anomalies. We took surface soil moisture to prove the condition of the dust emission source area deducted in our study.

2.2.3. Reanalysis Datasets

ERA5, provided by the European Center for Medium-Range Weather Forecasts (ECMWF), is the fifth atmospheric reanalysis dataset for global climate. It includes reanalysis data from 1950 to the present [42]. The variable used in this paper is the wind vector at 10 m above the ground surface. The temporal resolution is 1 h and horizontal spatial resolution is 0.25 × 0.25°.
The Hybrid Single Particle Lagrangian Integrated Trajectory (HYSPLIT) model is widely used to generate air mass backward trajectories in given starting locations [19,43,44]. It was driven by meteorological data output from the Global Data Assimilation System (GDAS). The horizontal resolution of GDAS meteorological data is 1° × 1°, downloaded from https://ready.arl.noaa.gov/HYSPLIT.php (accessed on 15 December 2021).

2.3. Methodology

Dust storm events are mainly studied regarding their impact range and mode, emission source area, transmission process and pathway and many other issues. Of course, the most intriguing but difficult questions to answer in many studies are why a dust storm event breaks out and how to predict it. This study focuses on remote sensing monitoring and process analysis of dust storms. Thus, a complete application framework of hybrid methods based on multi-source data is proposed. The flowchart of the application frame of integrating hybrid methods is shown in Figure 2.
As shown in Figure 2, multi-source data can be used for remote sensing monitoring and process analysis of dust storms. Spatial horizontal distribution of dust intensity can be mapped by optical remote sensing products such as AOD from MODIS; spatial vertical distribution of dust intensity by LIDAR satellite remote sensing products such as aerosol type profile from CALIPSO; temporal distribution information of high frequency can be achieved by geostationary satellite remote sensing products such as Chinese Fengyun or Japanese Himawari which depend on the covered location. More detailed process analyses of dust storms include air quality impact analysis supported by PM data from ground stations, the dust emission trace and transport pathways from HYSPLIT back trajectory driven by meteorological data from the Global Data Assimilation System (GDAS) and the verification of dust storm outbreak conditions of original emission locations. The dust emission locations deduced from HYSPLIT can be proved by precipitation data from the WMO and soil moisture data from remote sensing products such as SMAP since the emission locations should be severely dried.
In this study, firstly, PM2.5 and PM10 concentration data from air quality monitoring stations in the cities most affected by the dust storm were used to analyze ground-level dust intensity in the air. Aiming to explore the spatial dust distribution during the dust storm event, we used MCD19A2 AOD from MODIS data. By using the DST product with the higher temporal resolution from FY-4A, we could obtain more details of the dust storm process, which included high-frequency observations of dust distribution, then determination of dust movement direction and path. Meanwhile, CALIPSO LIDAR data were used to determine the vertical distribution of dust aerosols. Finally, backward trajectory simulations were used to trace the emission source and direction of movement of this dust storm. Moreover, the daily precipitation data and three-day SMAP global soil moisture data were used to verify the deduced source locations from HYSPLIT.

3. Results and Discussion

3.1. Analysis of PM10 and PM2.5 Concentration Changes

A widespread dust storm occurred in northern China in March 2021, and this dust storm was one of the most serious air pollution events in recent years. In order to investigate the impact of this dust storm on air quality, we selected ground-level PM10 and PM2.5 concentration data from cities with severe dust storms. Figure 3 shows the locations of the ground stations for PM observation in the cities most affected by the dust storm and the digital elevation model (DEM) of the study area.
From 14–18 March 2021, most regions of northern China experienced very poor to hazardous air quality. In the cities affected by the weather, PM10 concentrations varied significantly, PM10 concentrations were characterized by obvious peak-shaped changes during the time and the peak PM10 concentrations reflected the maximum intensity of dusty events. Figure 4 shows the hour-by-hour variation of PM10 concentration in the selected cities.
The maximum observed hourly PM10 concentration was above 1000 μg/m3 in many cities, including Shijiazhuang, Baotou, Bayingolin, over 2000 μg/m3 in Tianjin, Taiyuan, Baoding and over 3000 μg/m3 in Alashan, Shuozhou, Binzhou. In many cities, hourly PM10 concentration exceeded 4000 μg/m3, such as Cangzhou, Hohhot, Hami, Yan’an. In Beijing, Jinchang, Wuwei, Zhongwei and Yinchuan, the maximum PM10 concentration exceeded 6000 μg/m3.
Air quality first began to deteriorate in the northern and northwestern regions of China. PM10 concentrations in Baotou, Hohhot and Hami began to rise at 1:00 on 15 March, with cities such as Alashan and Shuozhou following. The PM10 concentration in Baotou was 174 μg/m3 at 1:00 on 15 March, 159 μg/m3 in Hohhot and 160 μg/m3 in Hami. By 4:00, values were 1842 μg/m3 in Baotou and 4066 μg/m3 in Hohhot. PM10 concentration in Hami rose from 160 μg/m3 to 831 μg/m3 and reached its first peak of 4654 μg/m3 at 8:00. In Alashan, the PM10 concentration rose from 227 μg/m3 to 1042 μg/m3 at 3:00 on 15 March and reached 3308 μg/m3 at 9:00. In Shuozhou, the PM10 concentration increased from 358 μg/m3 to 2050 μg/m3 at 6:00 and peaked at 3819 μg/m3 at 10:00. The air quality in Beijing, Jinchang, Wuwei and Zhongwei started to deteriorate around 7:00 on 15 March. The PM10 concentration in Beijing quickly went up from 122 μg/m3 to 9753 μg/m3 in two hours, and the maximum PM10 concentration in Jinchang, Wuwei and Zhongwei exceeded 7000 μg/m3. PM10 concentration variability reflected the spatial variability in the development of dust storms.
Hourly PM10 peaks on 15 March over Tianjin (2039 μg/m3), Taiyuan (2812 μg/m3), Baoding (2316 μg/m3), Shijiazhuang (2534 μg/m3), Baotou (1842 μg/m3), Hohhot (4066 μg/m3), Hami (5006 μg/m3), Alashan (3308 μg/m3), Shuozhou (3819 μg/m3), Binzhou (3750 μg/m3), Beijing (9753 μg/m3), Jinchang (8439 μg/m3), Wuwei (8989 μg/m3), Zhongwei (7044 μg/m3), Yinchuan (6120 μg/m3) and Cangzhou (4333 μg/m3) were observed. Yan’an reached the maximum PM10 concentration of 4876 μg/m3 at 8:00 on 16 March. It can be inferred that the cities Shijiazhuang and Hami experienced two dust processes. During the second dust process, Shijiazhuang and Hami reached the maximum PM10 concentration at 23:00 on 15 March. Bayingolin and Alashan reached the second PM10 concentration peak at 5:00 and 6:00 on 17 March, respectively.
As shown in Figure 5, the trends of PM2.5 and PM10 over time were basically the same in the dust event, but the variation in the range of high PM2.5 concentration was significantly less pronounced than that of PM10. The duration of PM2.5 pollution was short, with PM2.5 concentrations stabilizing in almost all cities on 17 March. The PM2.5 concentration in Tianjin, Taiyuan, Shijiazhuang, Baotou, Hohhot, Hami, Yan’an, Alashan, Shuozhou, Binzhou, Beijing, Jinchang, Wuwei, Zhongwei, Yinchuan and Cangzhou reached the maximum on 15 March and then gradually decayed. Both PM2.5 and PM10 concentrations were high during this air pollution, indicating that this storm was a mixture of dust and haze [45]. Air pollution reached unprecedented levels during this dust event. The hourly concentrations of PM2.5 and PM10 in the selected cities exceeded the China Ambient Air Quality Standards (recommended values: 150 μg/m3 for PM10 as a 24 h average and 75 μg/m3 for PM2.5) by a factor of ten or even dozens. The PM10 concentration can reach up to 80 times the level before the arrival of dust, and the PM2.5 concentration also increased in the same proportion.
The analysis of dust transport time is of great interest for air quality prediction. The dust storm lasted for 9–15 h in most cities, but lasted for more than 30 h in cities such as Alashan, Hami, Jinchang and Yinchuan. By analyzing the concentration of PM10 in each city, we found that the dust transportation from Baotou, Hohhot and other places in the north to Beijing, Jinchang, Wuwei, Zhongwei and other places in the south needed 6 h, and that to Binzhou, Yan’an and other places needed 15 h.

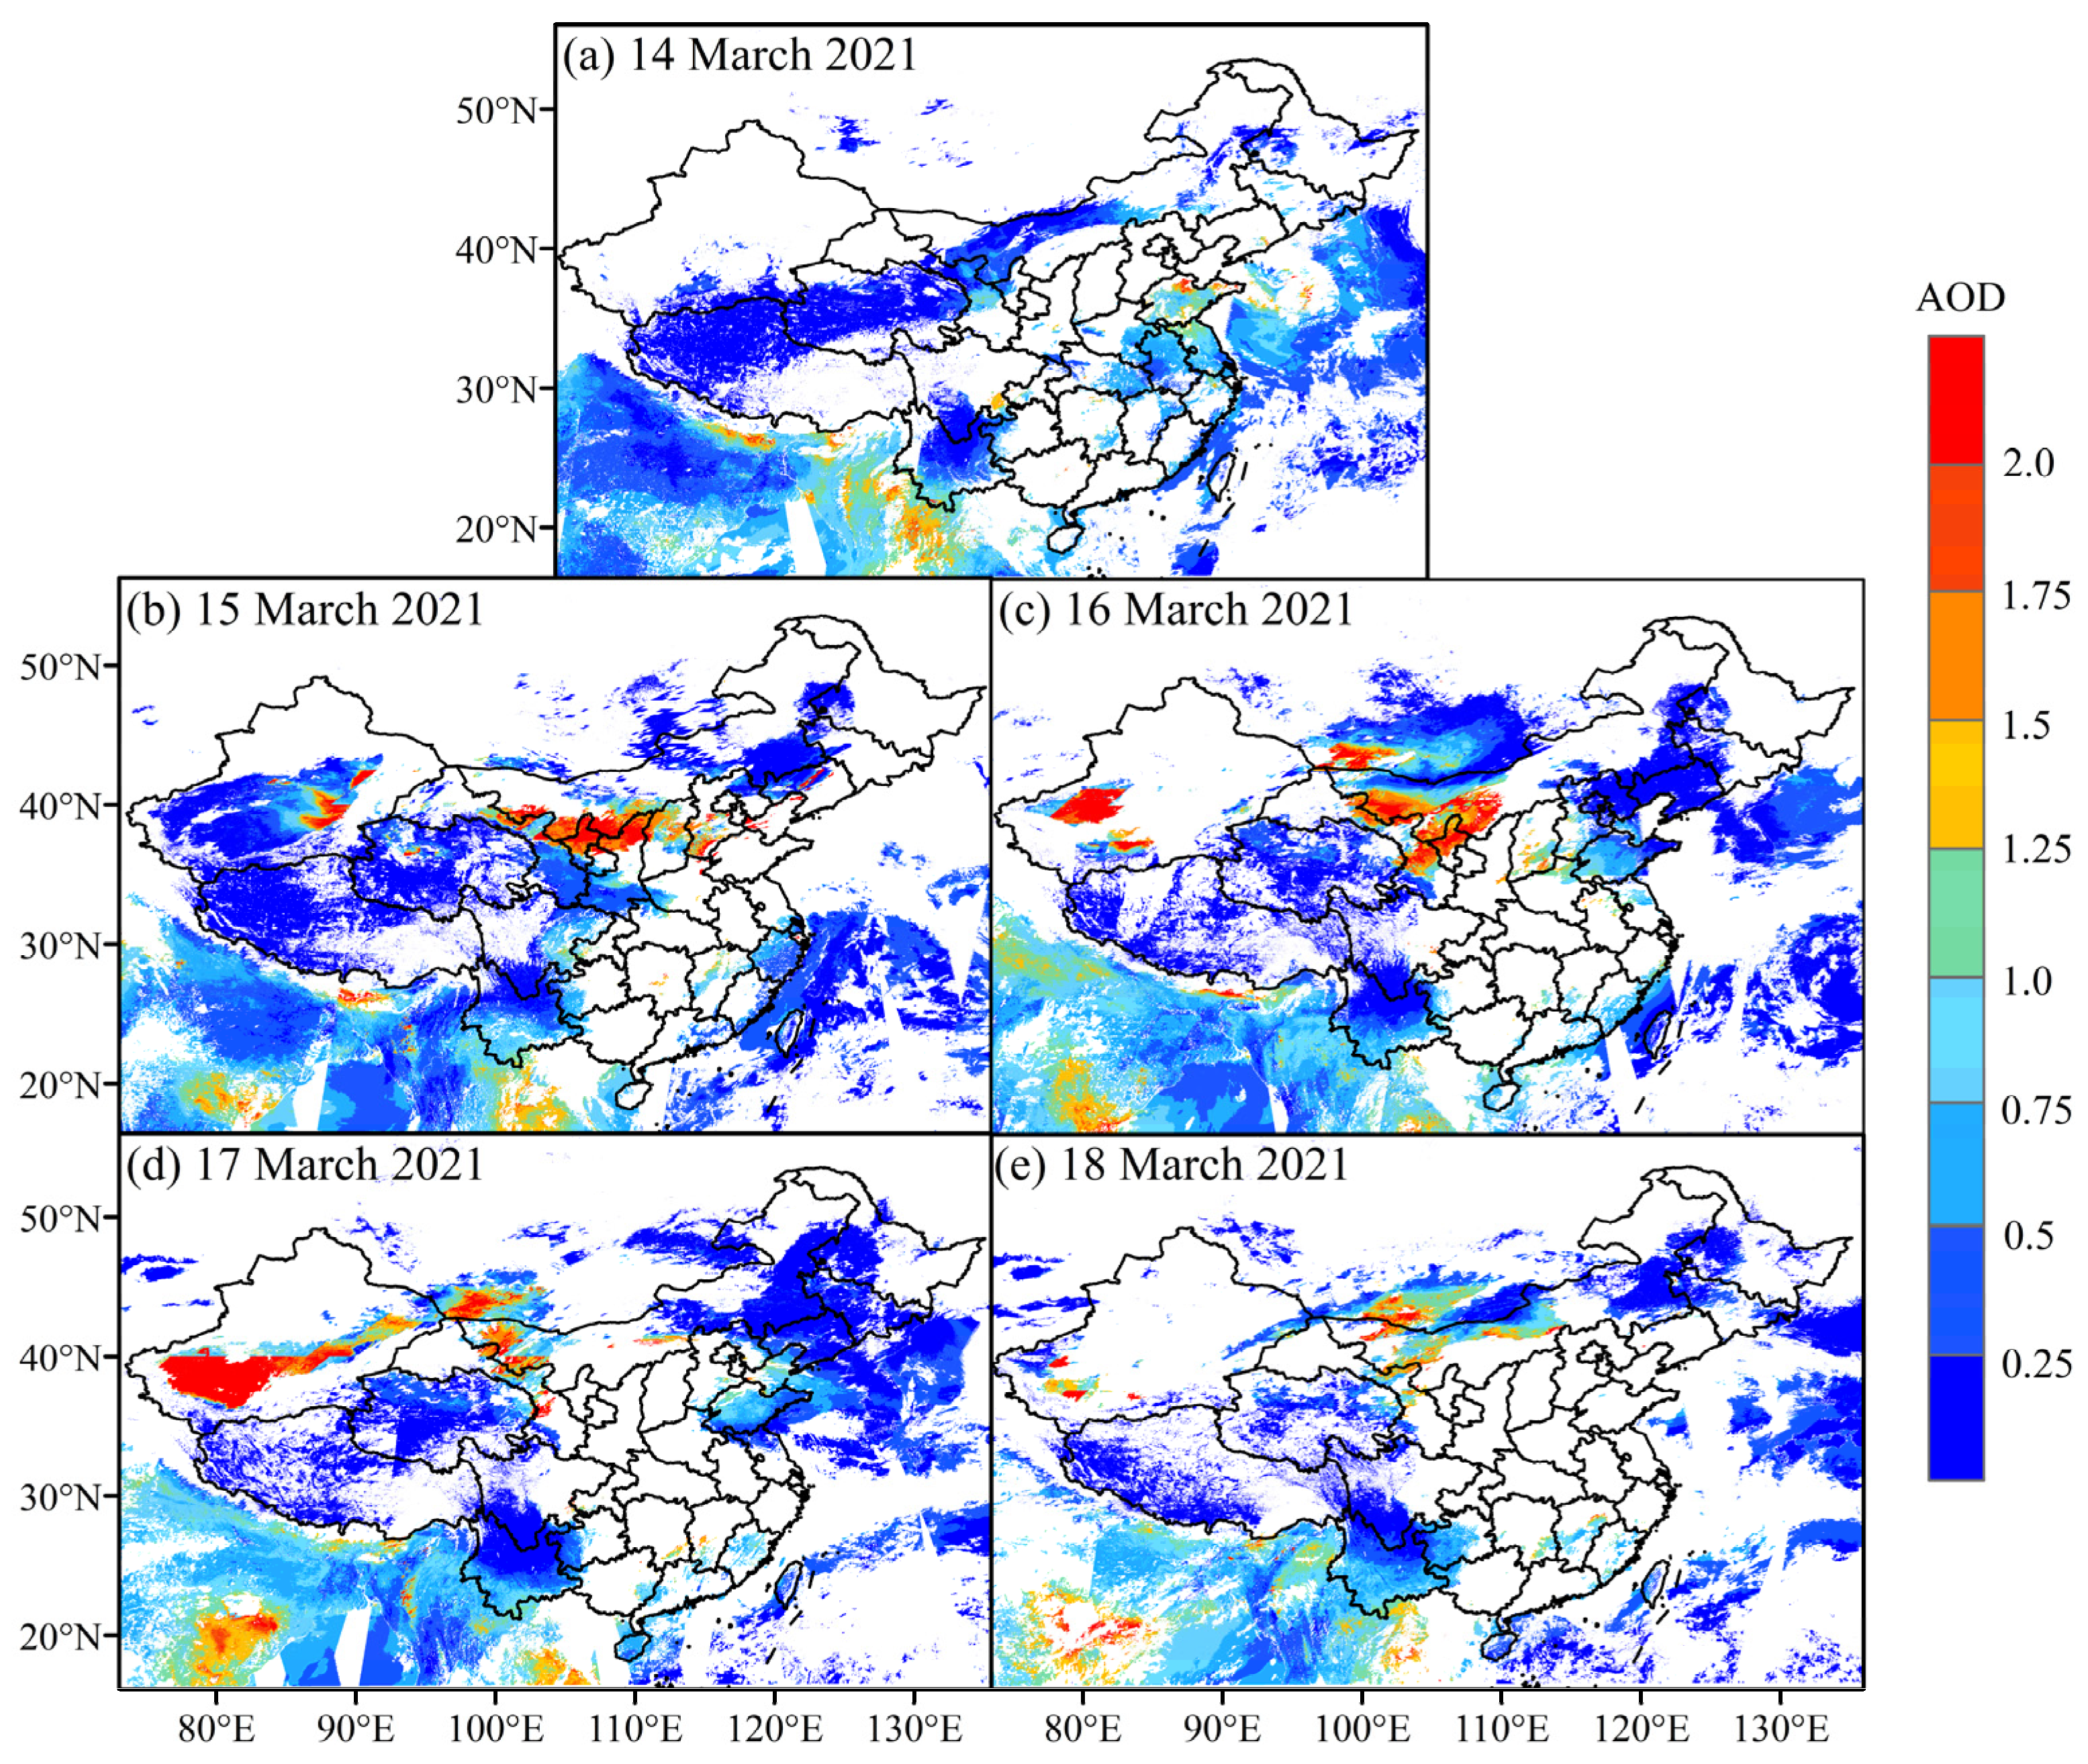
3.2. Spatial Distribution of MODIS AOD

The optical depth of aerosols over cities reflects the level of turbidity of atmospheric pollution. The study used the MCD19A2 dataset from 14–18 March 2021 to describe the spatial distribution of AOD during the dust storm. Figure 6 shows the spatial distribution of the aerosol optical depth (AOD). Most of the northern, northwestern and central parts of China have higher values of AOD (more than 1). High-value aerosols (AOD > 2.0) covered parts of Xinjiang Autonomous Region and several provinces in northern China with more severe dust pollution from 15–16 March. On 17 March, the dust center moved to the Taklamakan Desert in southwestern Xinjiang Autonomous Region, where the AOD remained above 2.0, and the dust intensity was still very strong. The dust intensity weakened significantly on the 18th, and the AOD was below 0.5, with only the central part of Inner Mongolia having AOD above 0.75. By the 18th, there was a significant weakening of the dust process affecting northern China. Although MCD19A2 effectively demonstrates the distribution of AOD during dust storms, the spatial distribution continuity of AOD is poor due to cloud and algorithm limitations, and there are large areas of missing AOD in the data. Further analysis and research are needed using other remote sensing data such as the FY-4A dust detection product.

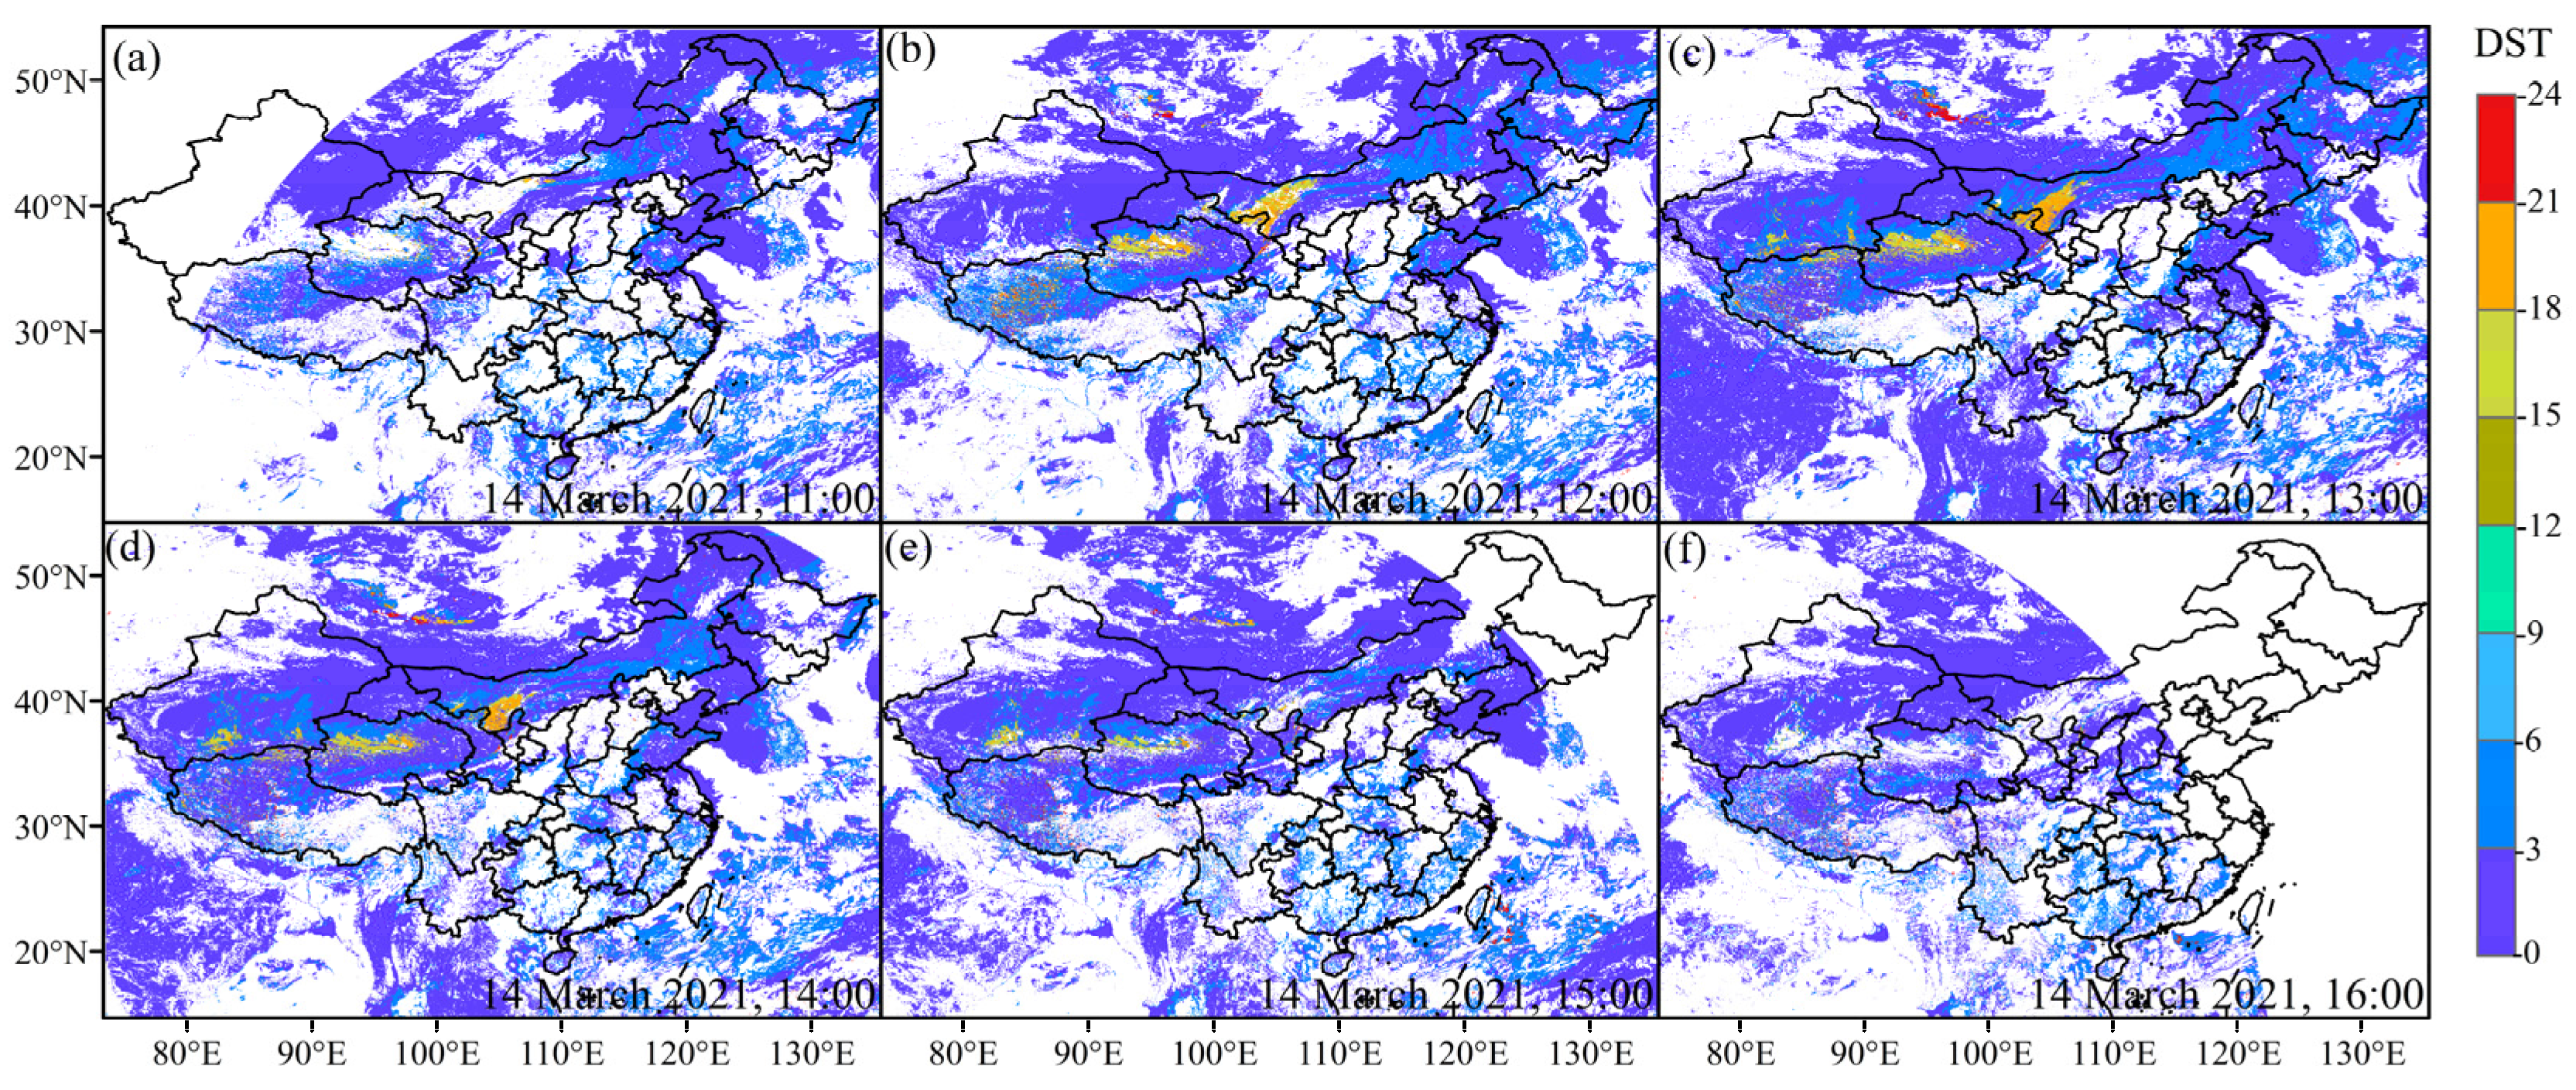
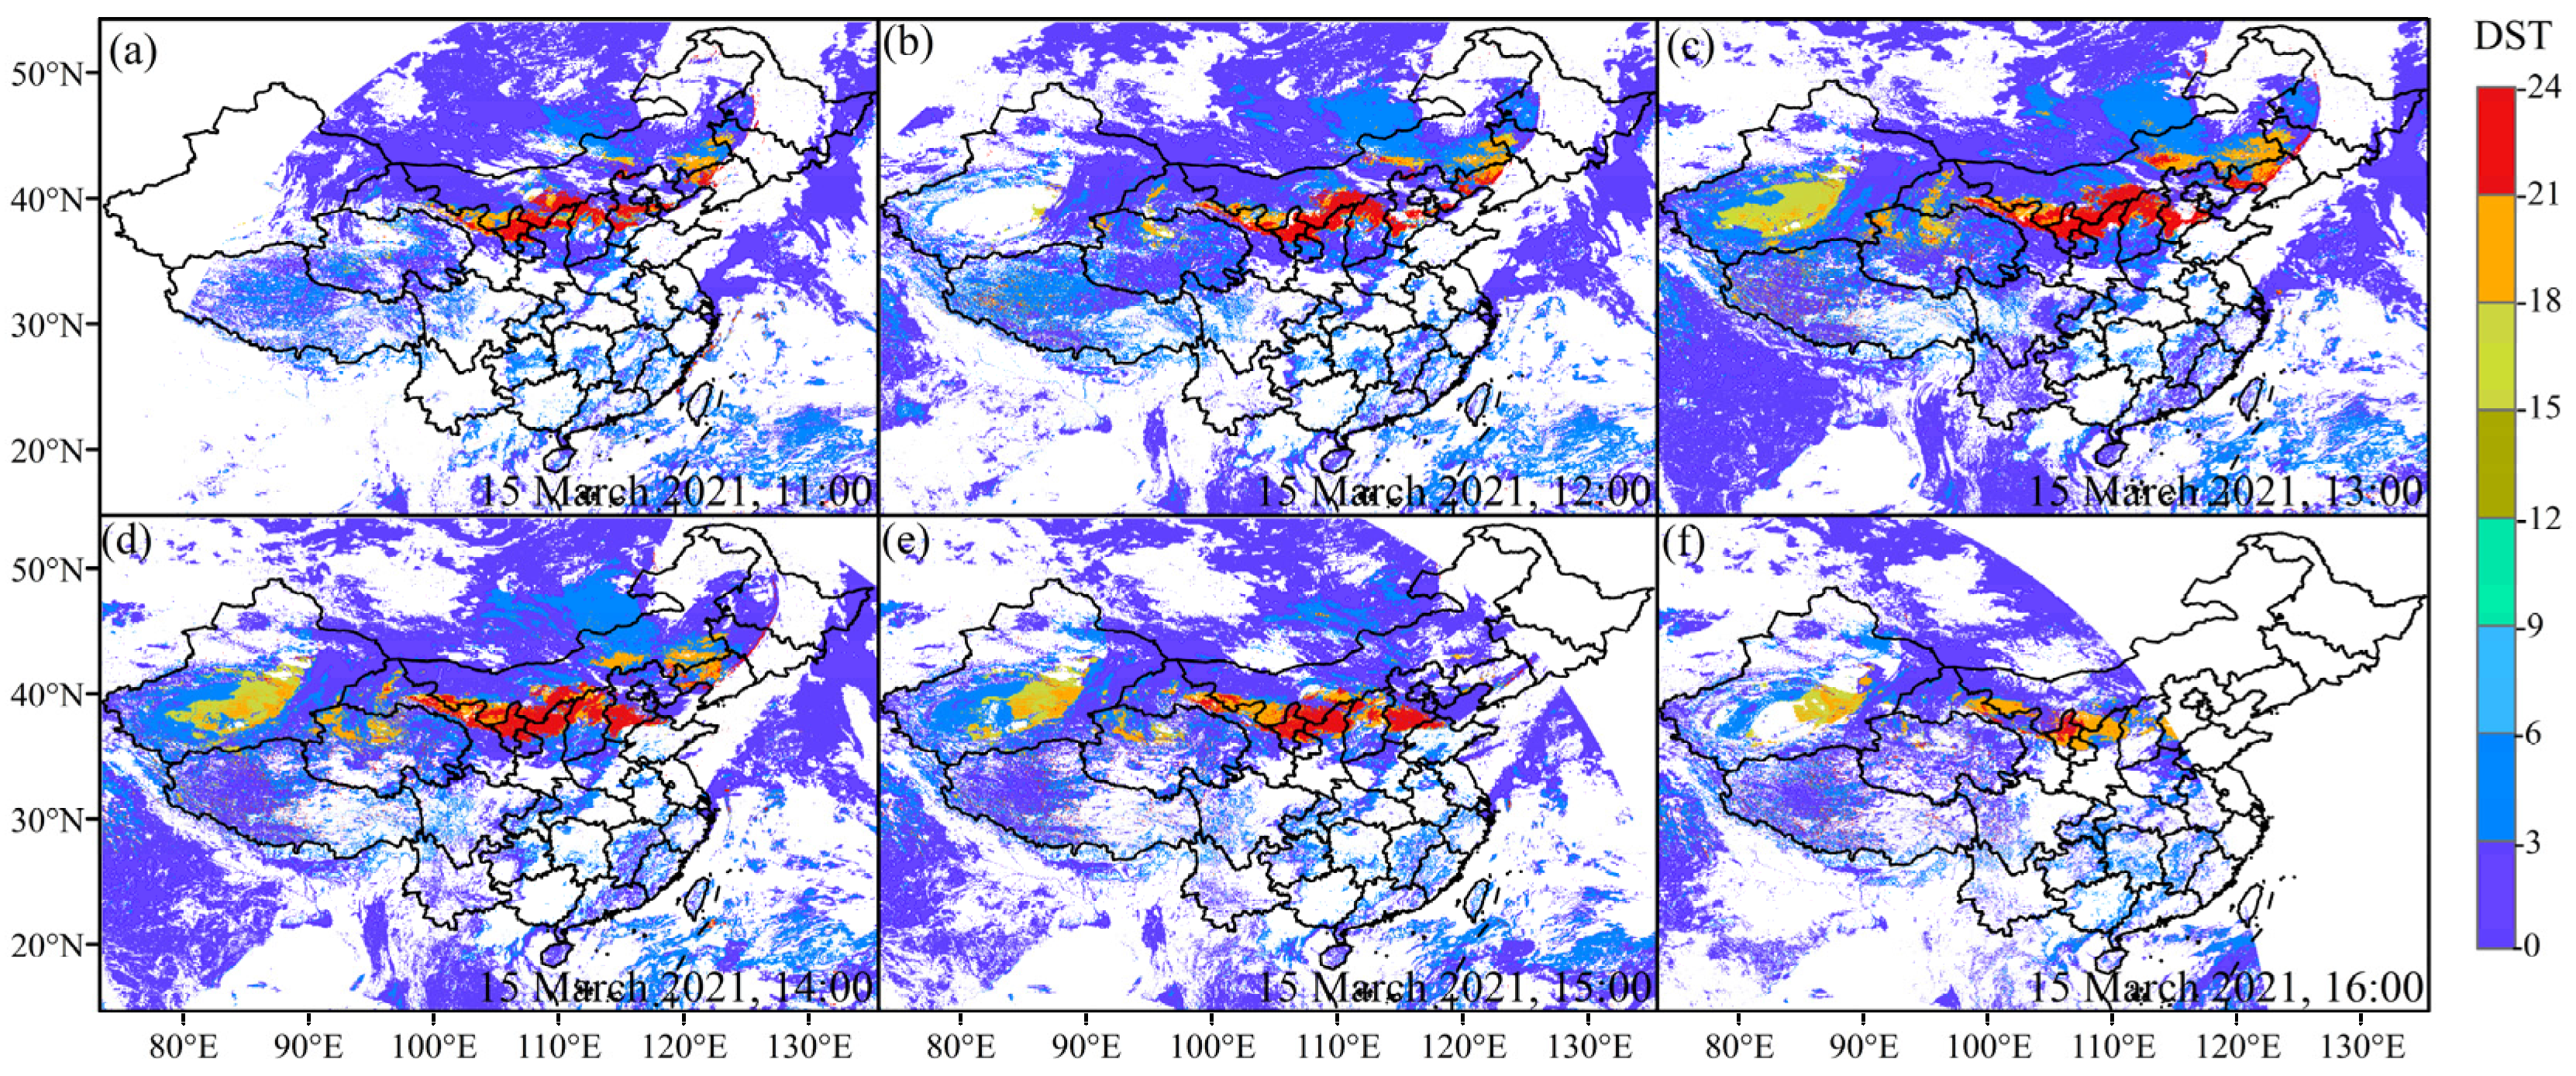
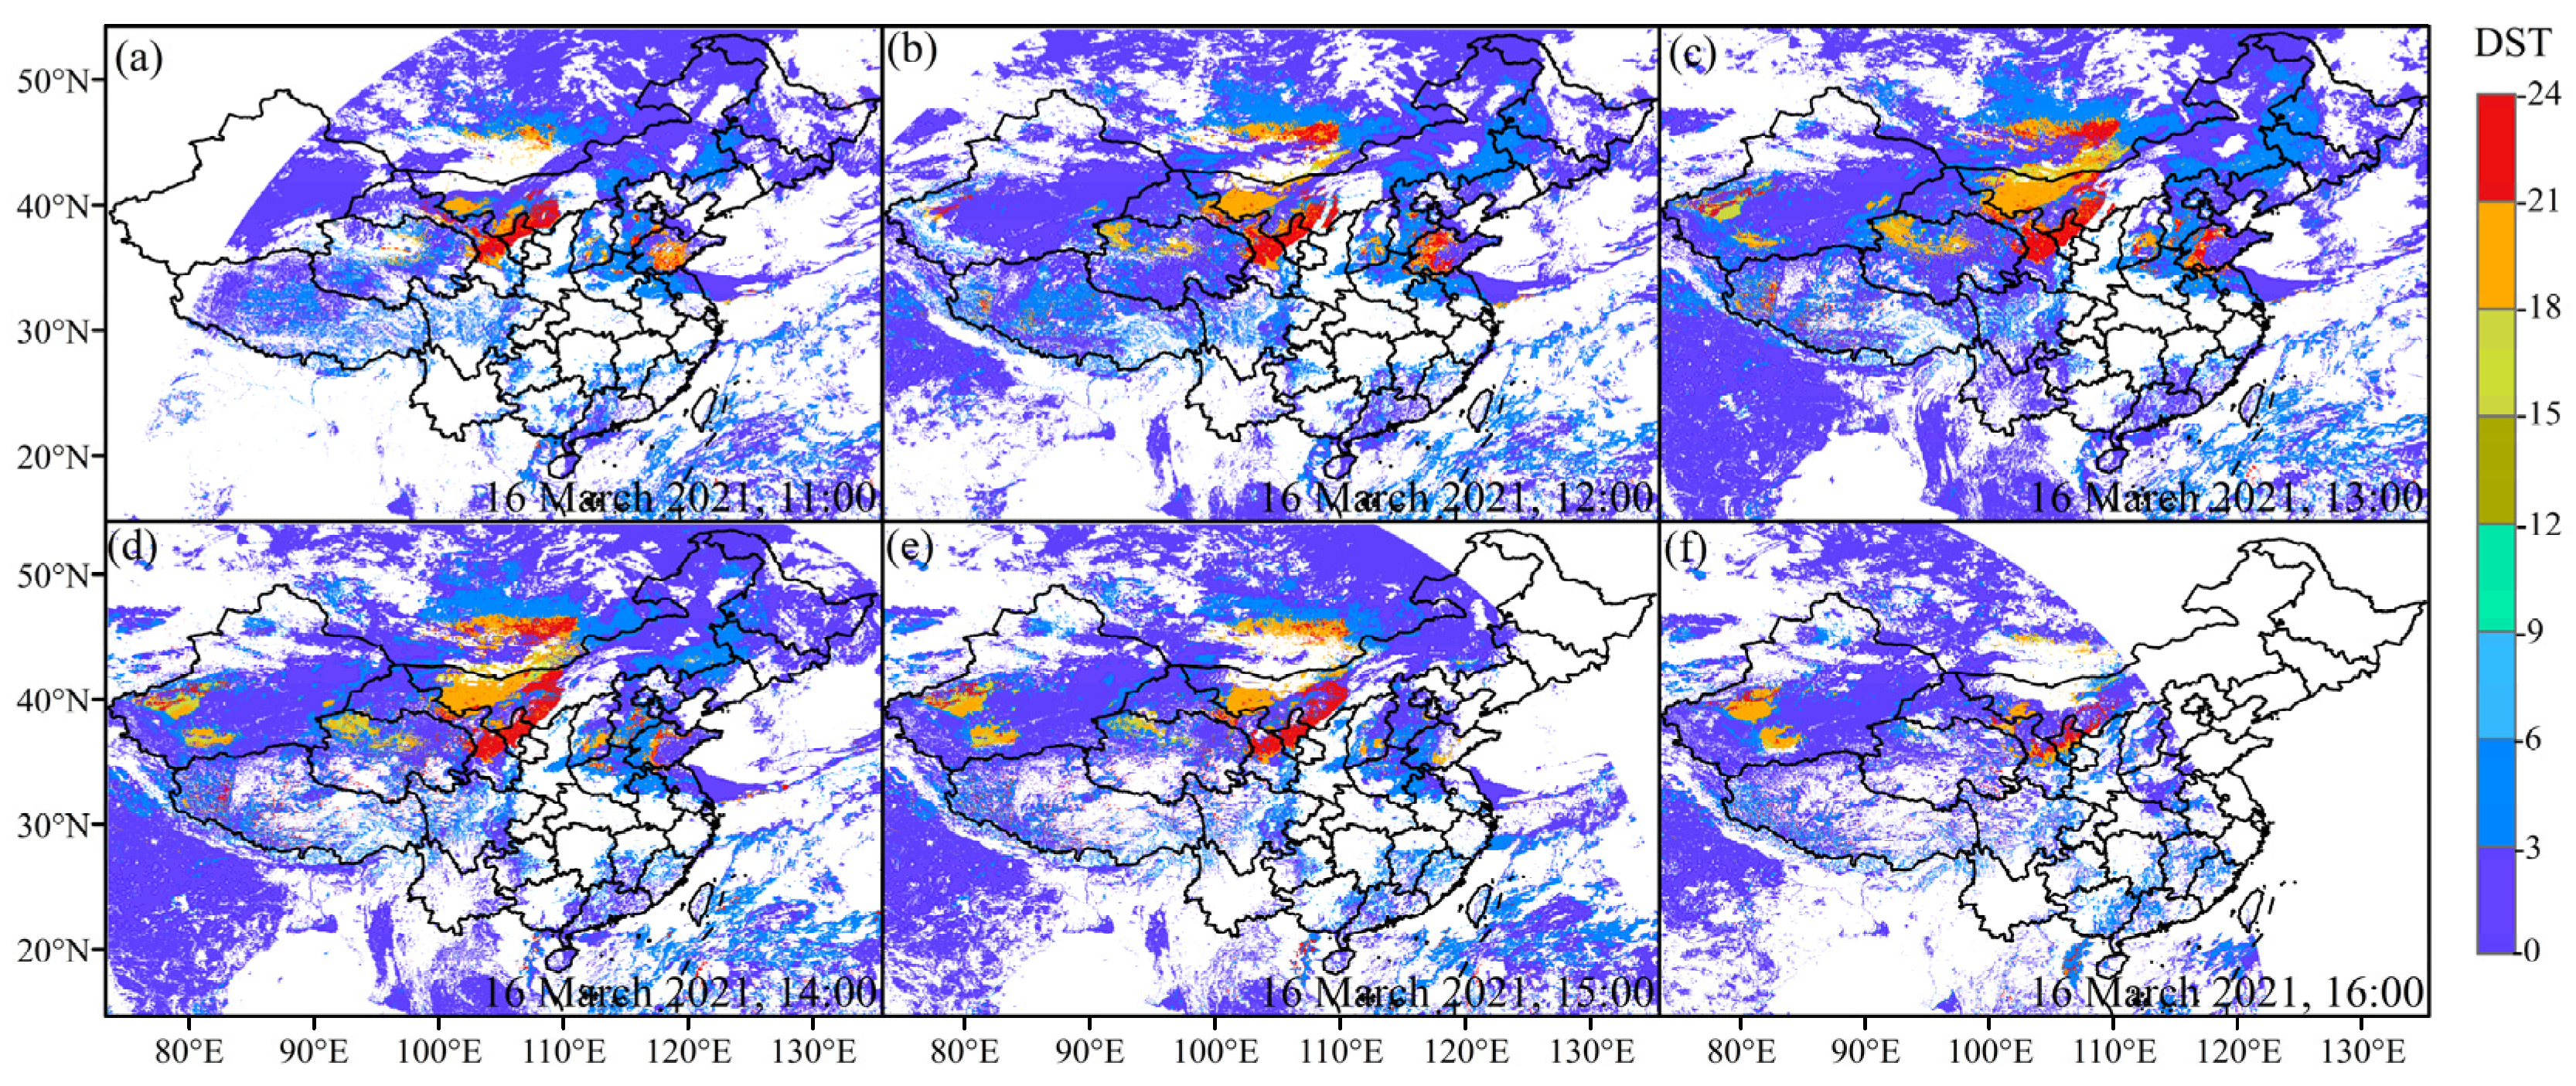
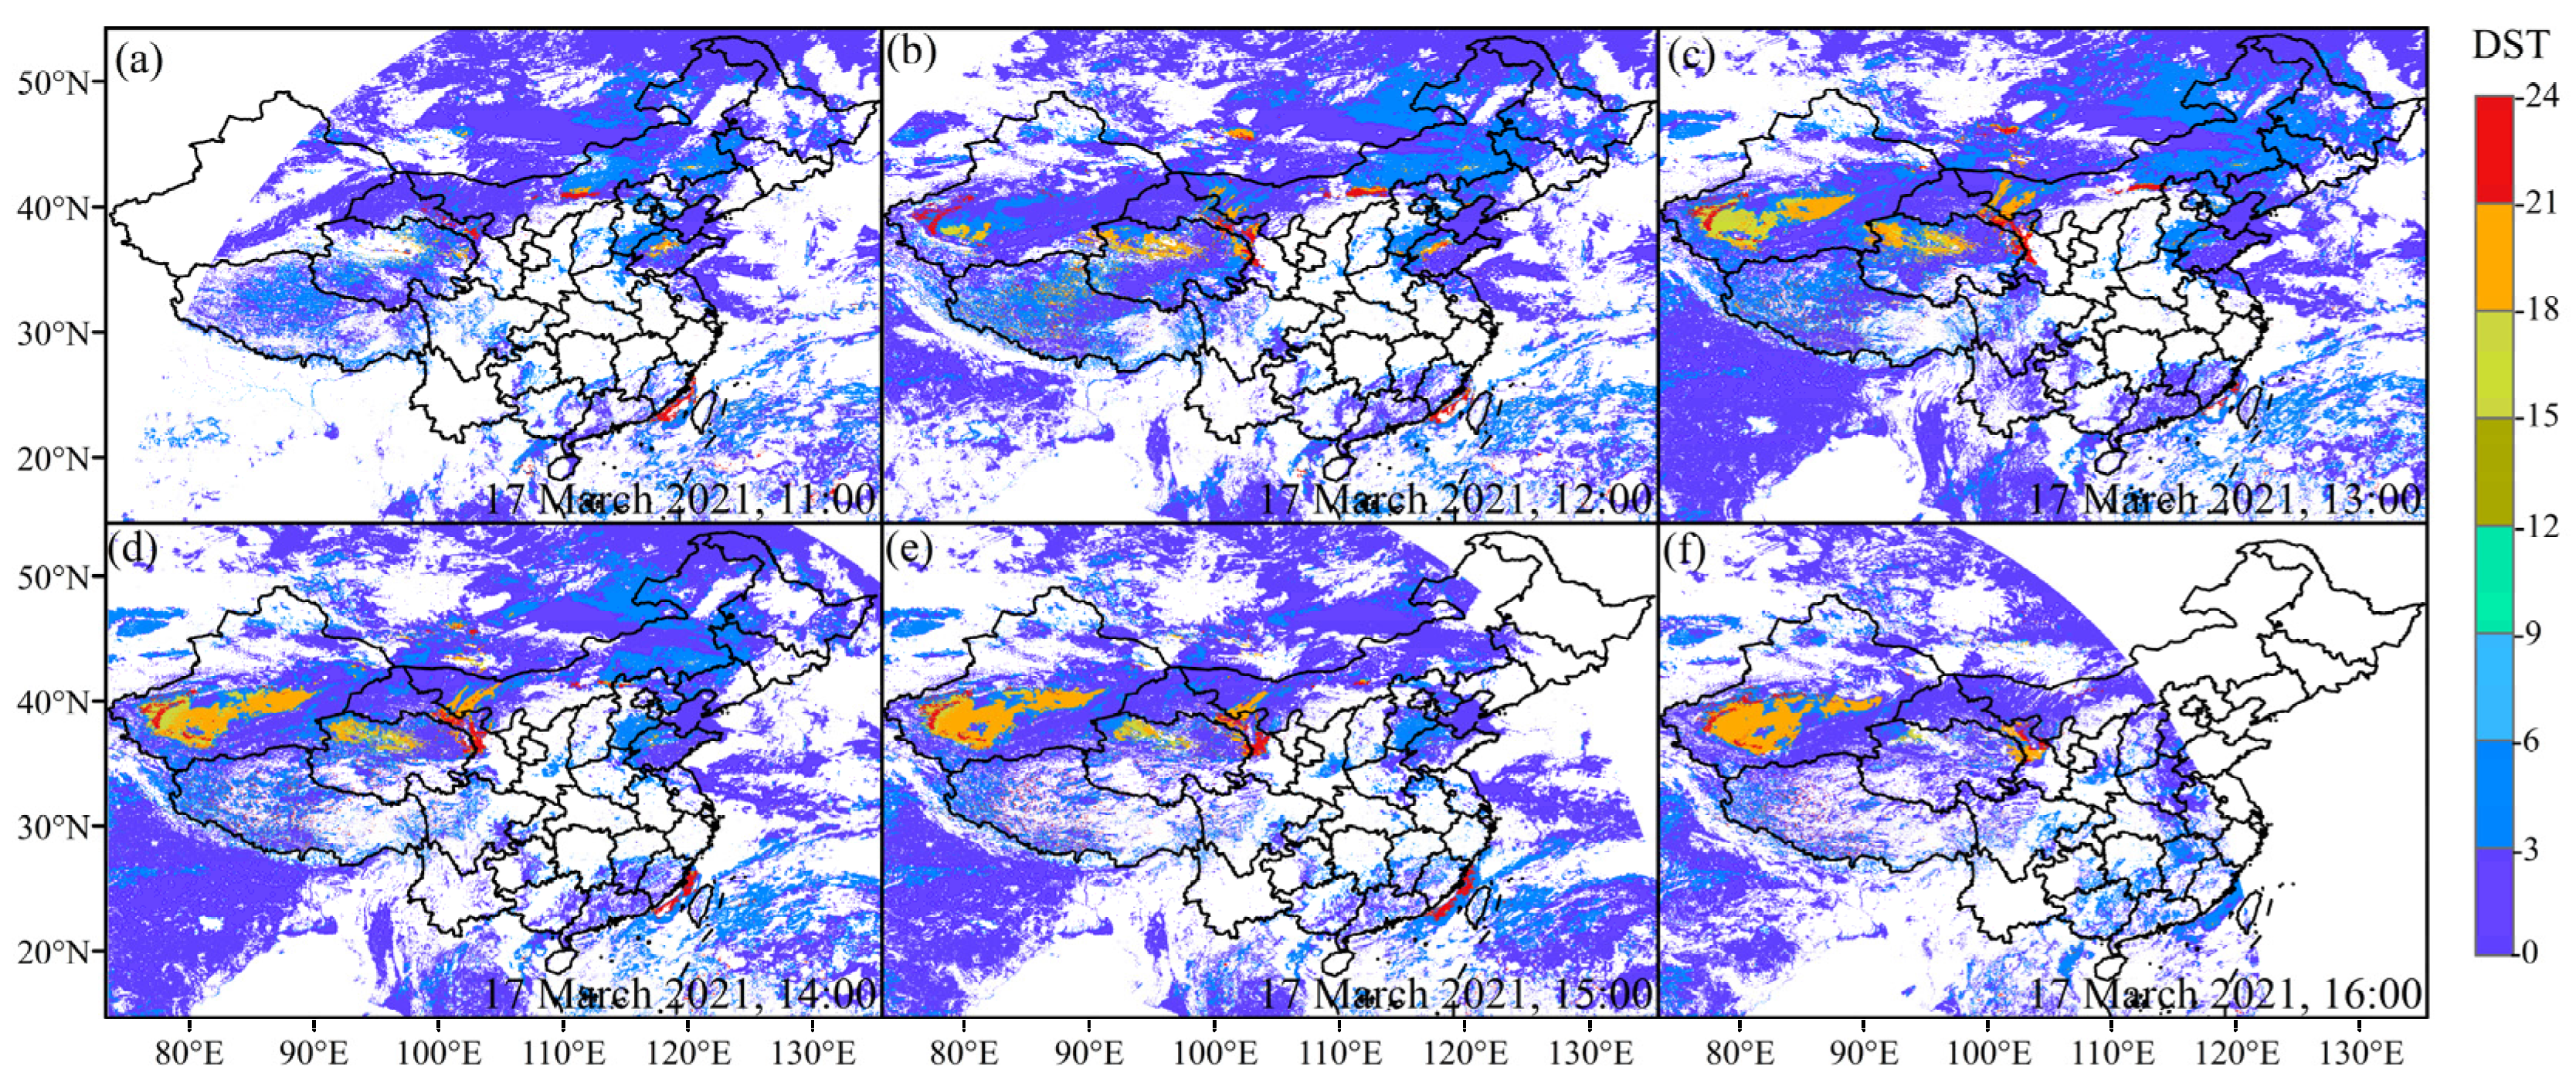
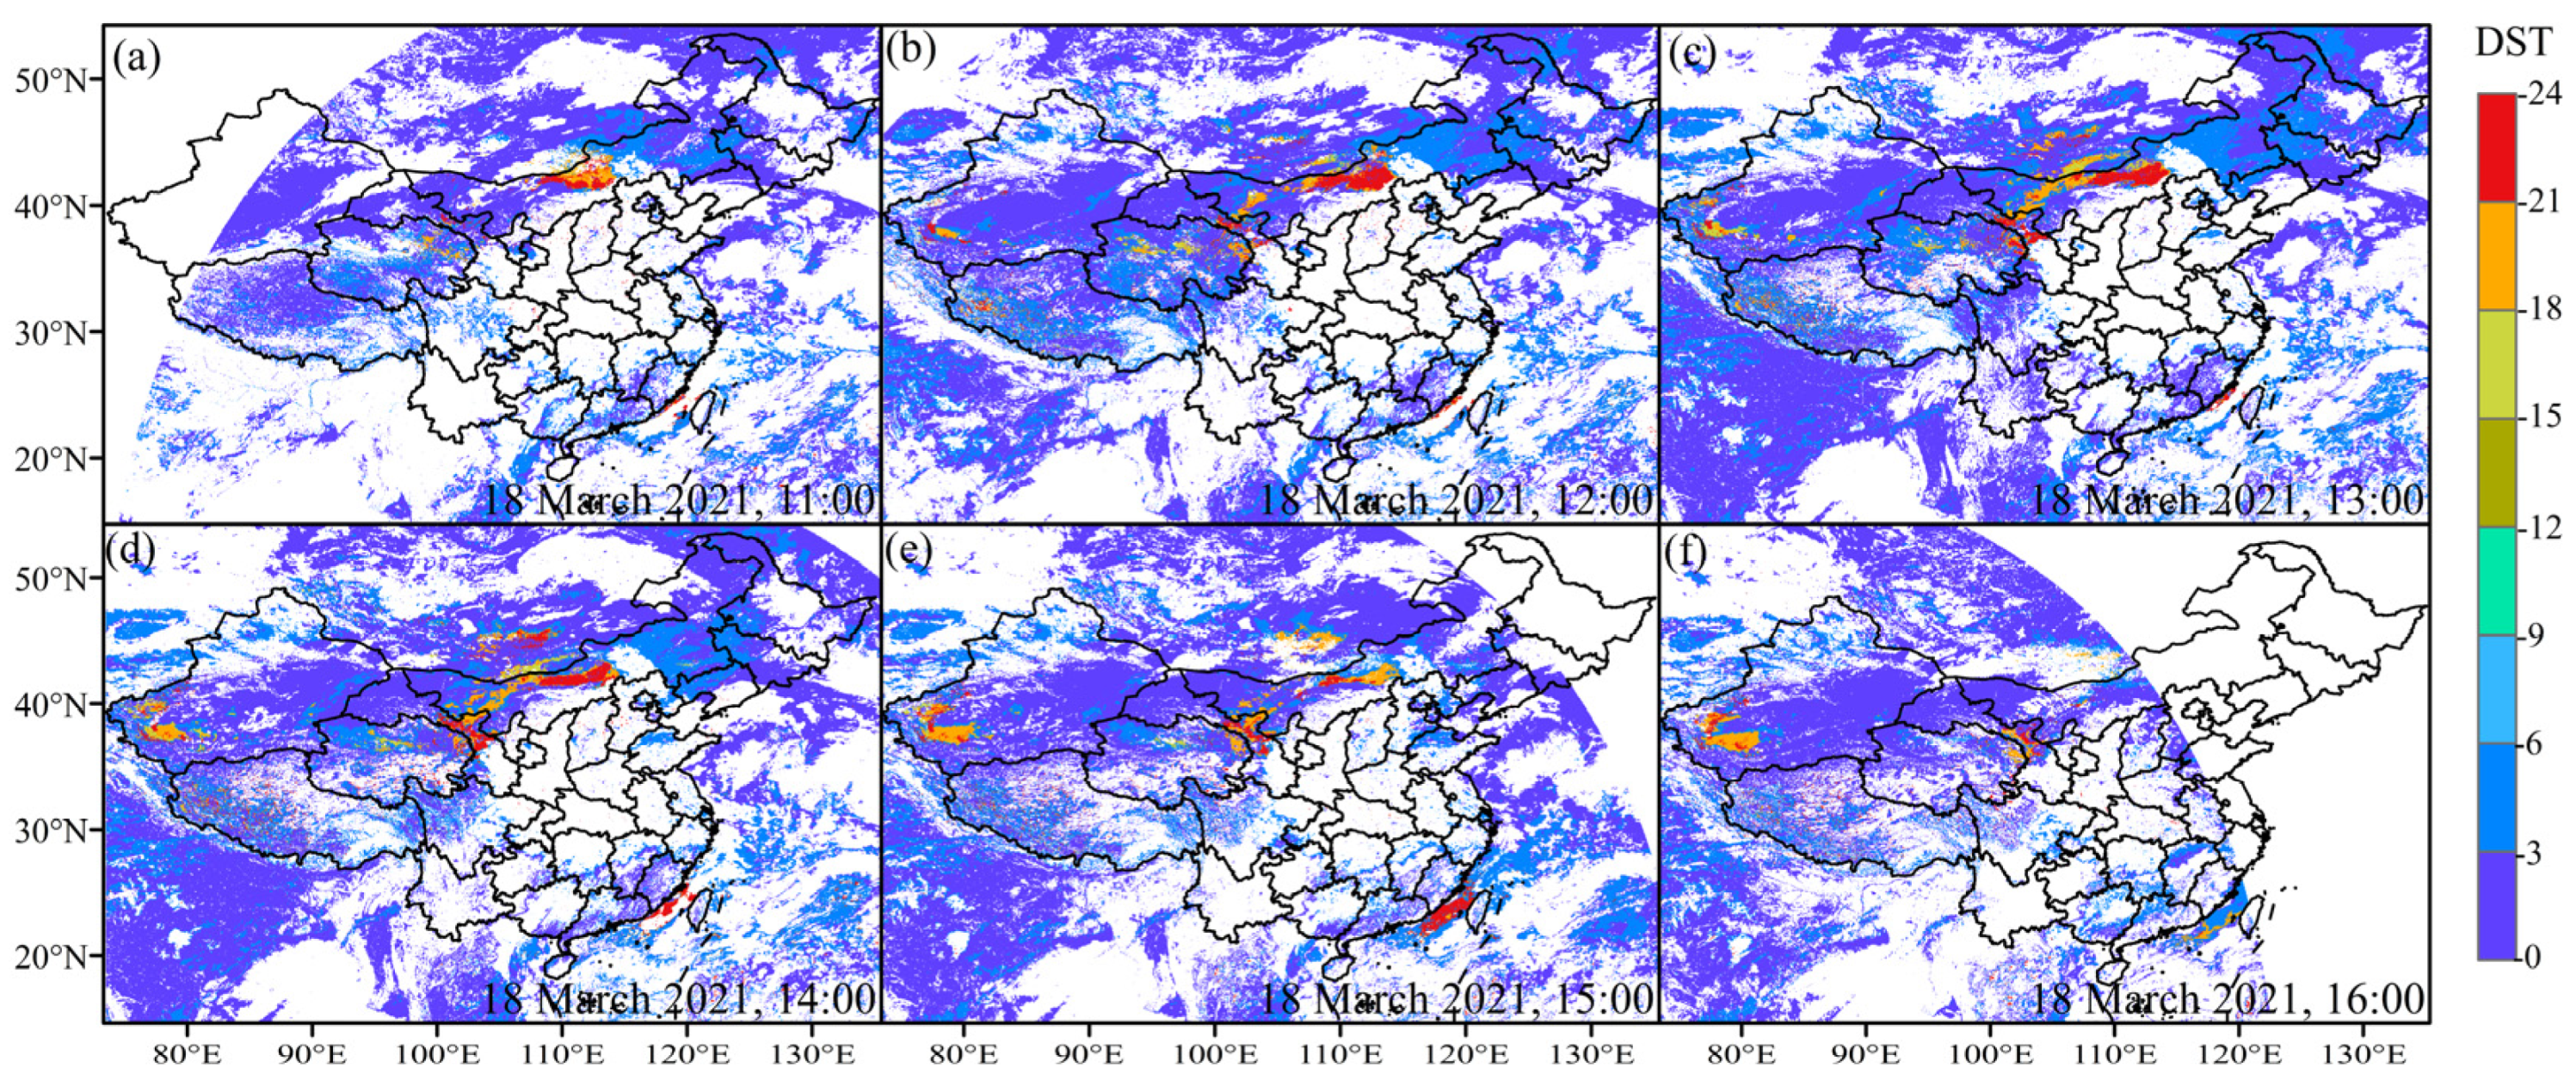
3.3. Observation of Dust Variation with High Temporal Frequency

Geostationary satellites allow for large-range, high-frequency observations. We selected the DST data of FY-4A from 14–18 March 2021, at 11:00, 12:00, 13:00, 14:00, 15:00 and 16:00 to analyze the specific changes in the spatial distribution of dust during this dust storm. FY-4A DST clearly shows the evolution of dust storms (Figure 7, Figure 8, Figure 9, Figure 10 and Figure 11). However, the analysis is constrained by the geostationary satellites’ inability to observe during the night and their inability to exclude cloud influence completely. In terms of distribution area and pattern, FY-4A DST’s high-value distribution area was very similar to MODIS AOD. Therefore, this study concluded that the FY-4A DST could accurately reflect the spatial and temporal distribution of dust.
On 14 March, the dust first appeared in the western part of Inner Mongolia and the northern part of Qinghai Province, when the dust intensity was small and the DST was below 20. By 15 March, the intensity of dust increased significantly. The dust was distributed in a stripe from west to east, with high concentrations covering many provinces in northern China and northwest China, such as Xinjiang Autonomous Region, Gansu Province, Inner Mongolia, Ningxia Autonomous Region, Shaanxi Province, Shanxi Province, Hebei Province, Liaoning Province and Jilin Province. At 11:00, high values of DST (reaching above 20) were observed in Ningxia Autonomous Region, southern Inner Mongolia, northern Shanxi Province, central and southern Hebei Province, western Liaoning Province and Tianjin. The Taklamakan Desert, located in the southwest of Xinjiang Autonomous Region, detected dust at 13:00 and it gradually spread to the east. After 14:00, there was an obvious trend of dust transmission to the southeast, and the dust belt changed from a northwest–southeast direction to a northwest–southeast direction. By 16:00, the northern region’s intensity of dust had weakened significantly. The dust in Inner Mongolia and around Shanxi Province disappeared. Western Gansu Province, northern Shaanxi Province, southern Hebei Province and others still had a small amount of dust. High-value dust areas were mainly concentrated in the Ningxia Autonomous Region, where the DST remained above 20.
On the 16th, a small amount of dust appeared in the western Taklamakan Desert, and dust storms were continuously observed in the Gobi region. Some dust appeared in the western Taklamakan Desert on the 16th, and dust storms were continuously observed in the Gobi region. A lot of dust was concentrated in the eastern part of Inner Mongolia, southern Gansu Province and Ningxia Autonomous Region. From 11:00–14:00, the dust belt in western Inner Mongolia and the dust belt across Southern Gansu Province, Ningxia Autonomous Region and southwestern Inner Mongolia extended to the northeast. At 15:00, the dust intensity of the dust belt began to decrease gradually from west to east. By 17 March, the center of the dust storm had moved to the Taklamakan Desert. At 11:00 on 18 March, there was only a little dust in the central north of Inner Mongolia, and it gradually spread to the west and southwest of central Gansu Province. By 14:00, a small amount of dust also appeared in the southwestern Taklamakan Desert. By 15:00, the intensity of the dust was reduced in Gansu Province and Inner Mongolia, and the scope of the impact of the dust also decayed. At 16:00, the dust around Inner Mongolia disappeared, with scattered dust remaining in central Gansu Province and a small amount of sand and dust still present in the southwestern Taklamakan Desert.

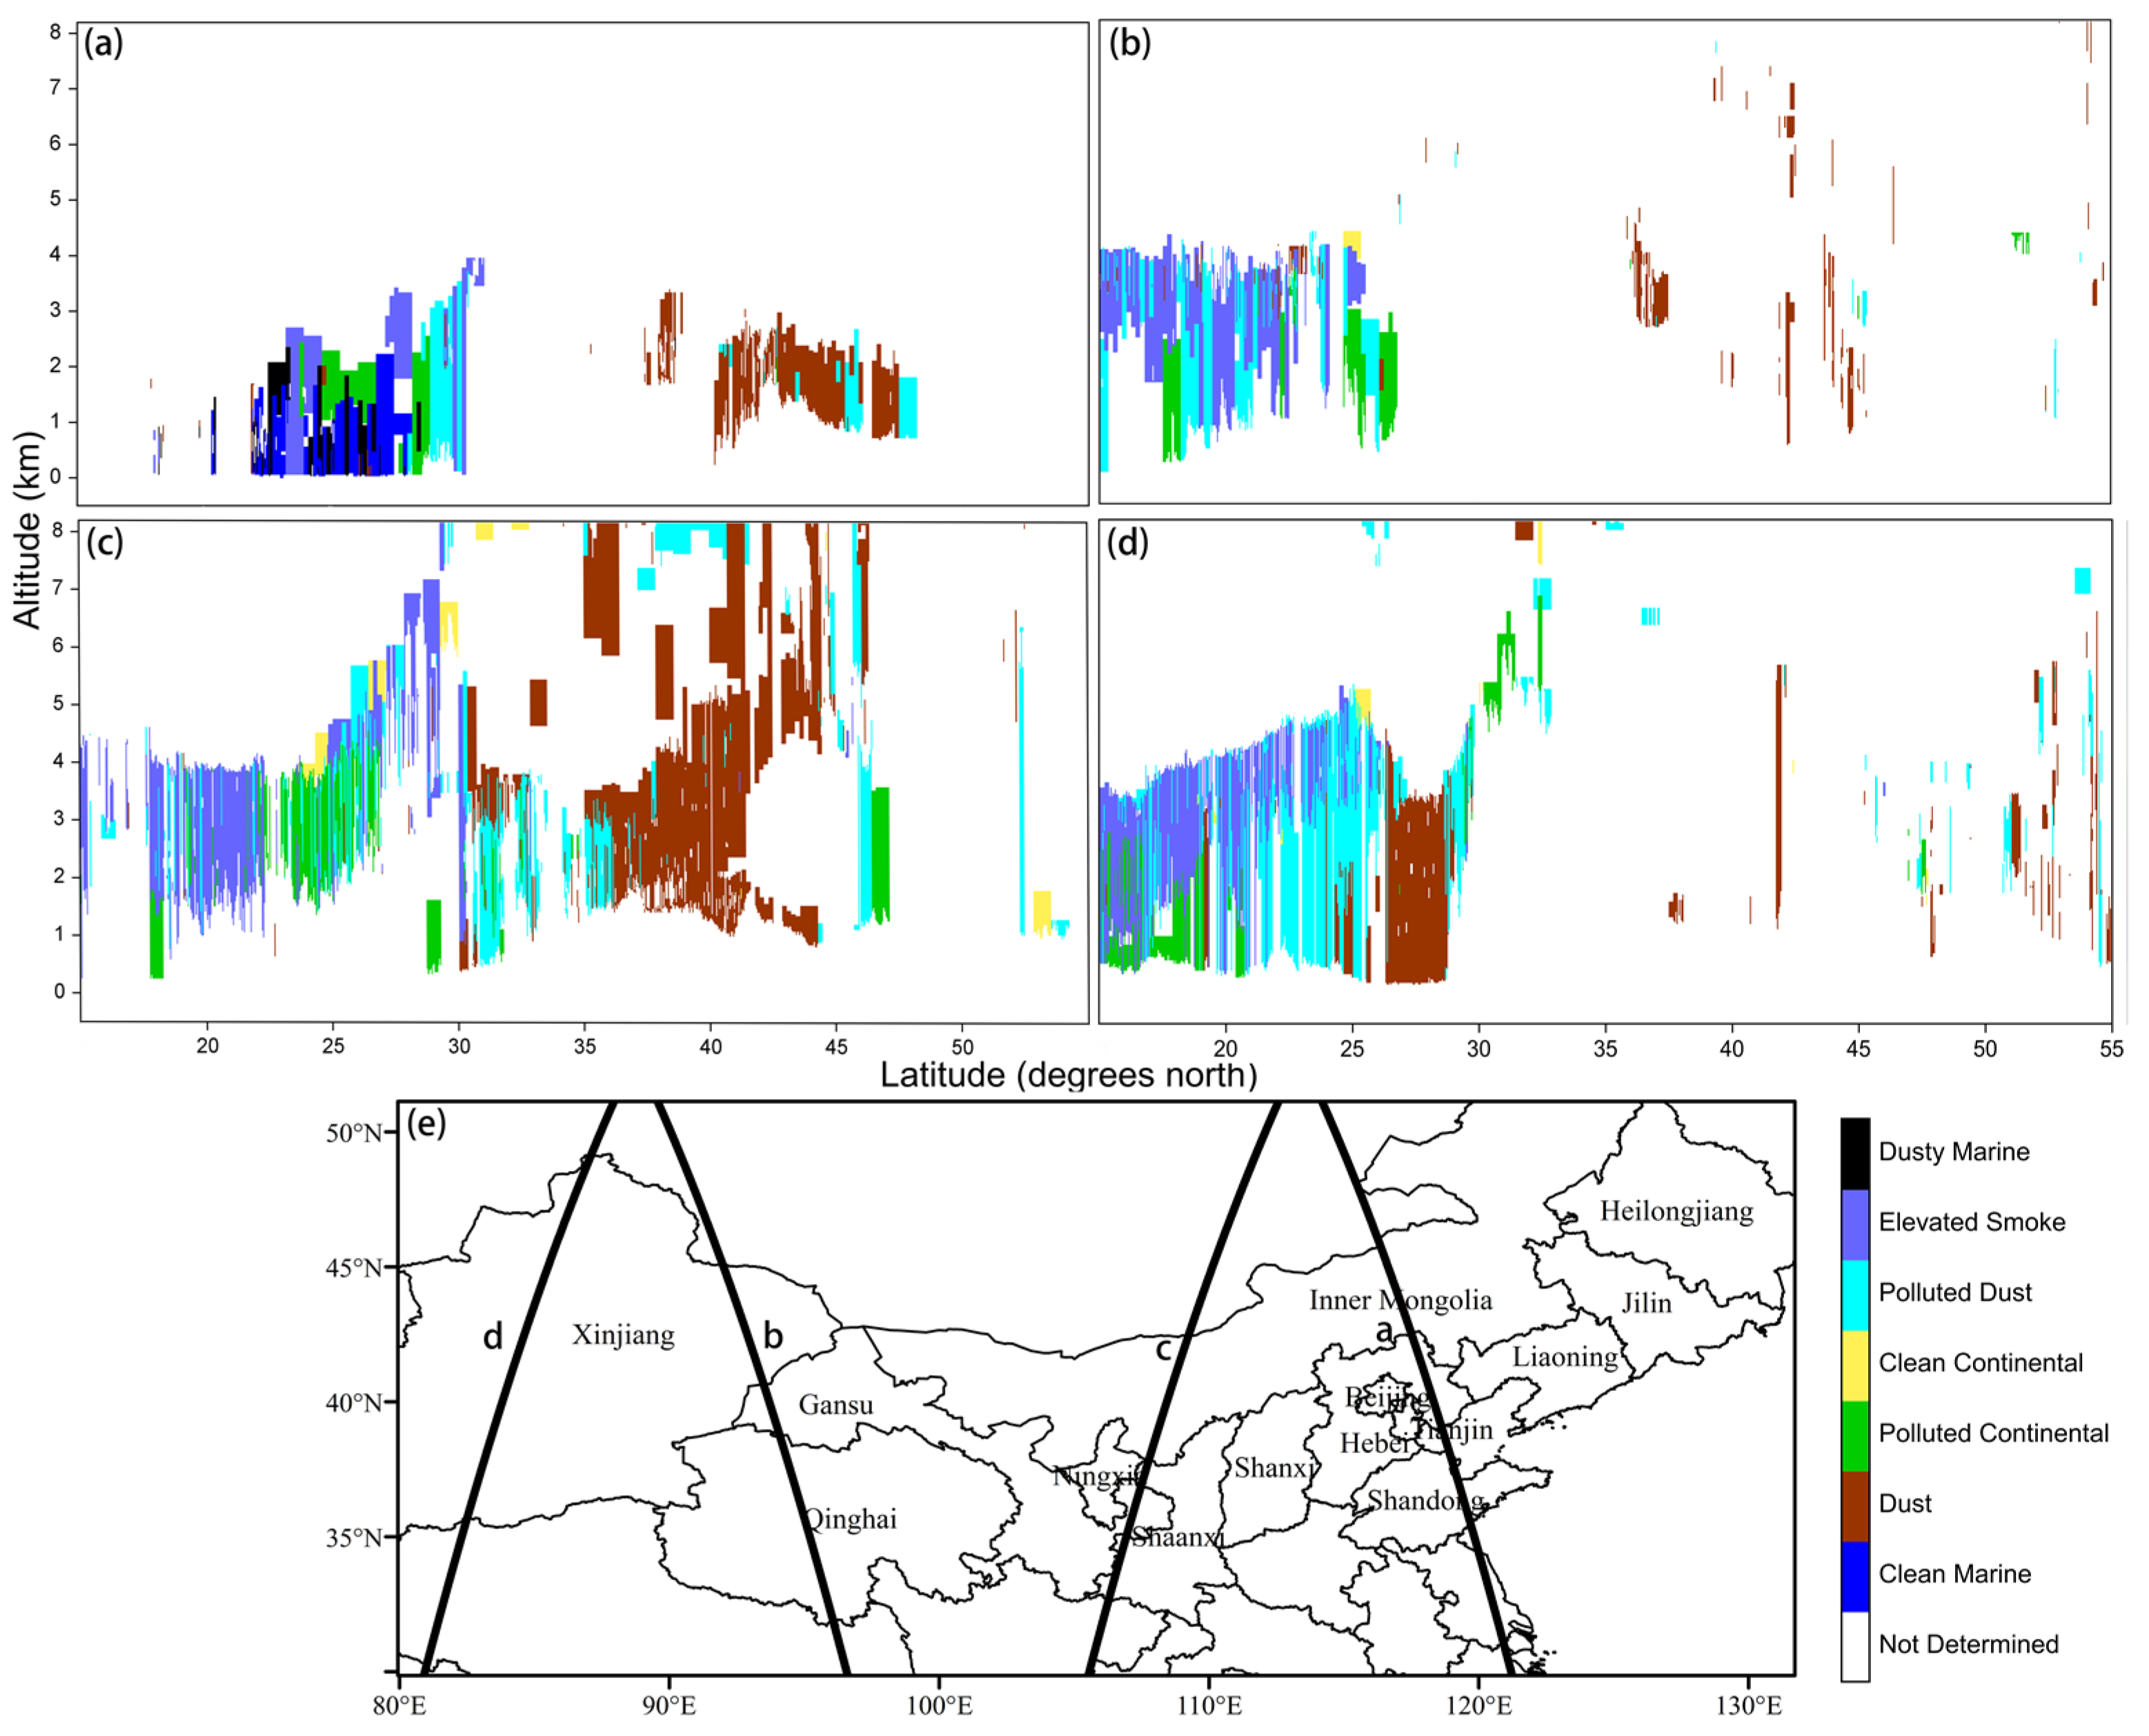
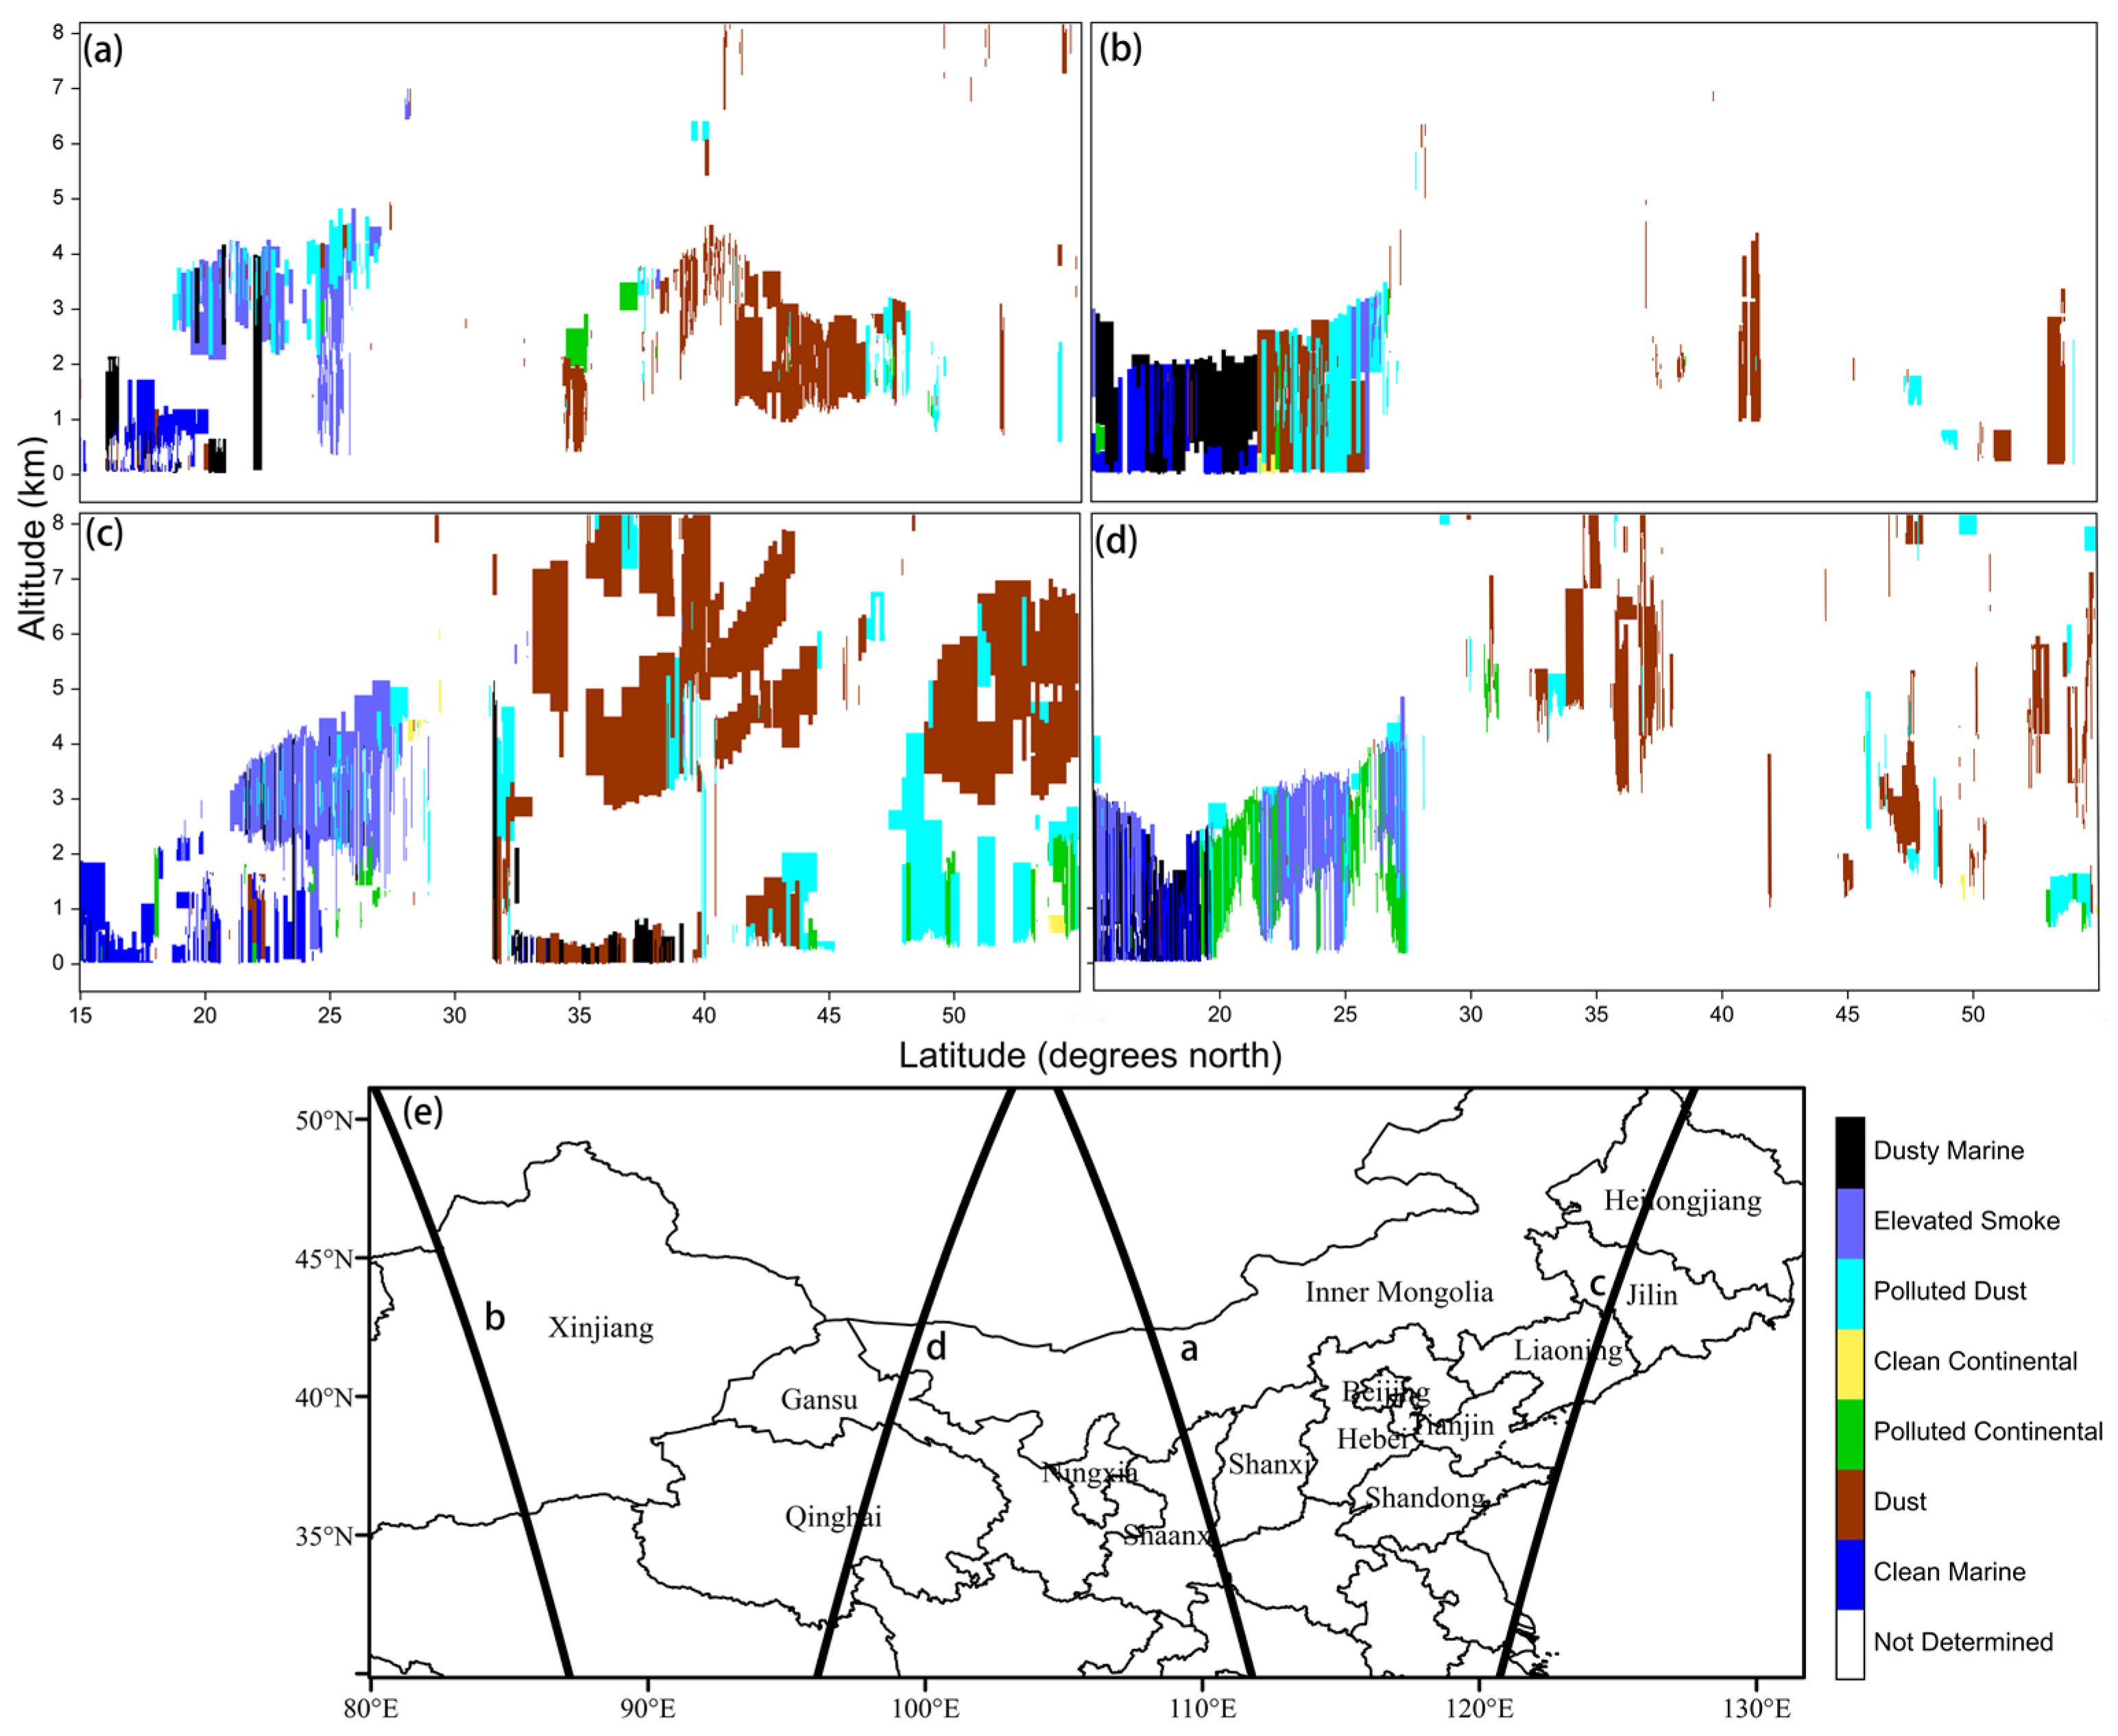
3.4. Vertical Structure Characteristics of Aerosols

MODIS AOD and FY-4A DST can effectively monitor the horizontal distribution characteristics and transport processes of dust. However, they cannot observe the vertical distribution characteristics of dust aerosols, nor can they do so at night. Therefore, our study used the CALIPSO Version 4.21 VFM data to investigate types of aerosols and vertical distribution characteristics during the dust storm event. Figure 12 and Figure 13 show the vertical distributions of aerosol types derived from CALIPSO satellite VFM data for flight tracks from 15–16 March.
In the region traversed by the CALIPSO satellite orbit as of 5:00 on 15 March, there were only aerosol layers at low altitudes of 0–4 km. There was a blank area of aerosols from 30° to 40° N, and dust aerosols accumulated at low altitudes from 40° to 50° N, with a few polluted dust aerosols above Hebei Province, Inner Mongolia, Beijing and Tianjin at low altitudes. At 7:00, the eastern part of Tibet, located at 25°~30° N, was dominated by elevated smoke, polluted dust and polluted continental aerosols gathered at low altitudes and concentrated at 0–4 km. Some dust aerosols were scattered 0–8 km near the Hami area. At 19:00 on 15 March, when the CALIPSO satellite orbit passed through this region of 35°~45° N, thick dust aerosols were distributed on the vertical layer, involving Gansu Province, Shaanxi Province, Ningxia Autonomous Region and Inner Mongolia in northern China and Mongolia. The dust settled from high altitudes and mixed with local dust, and the dust aerosol extended from the surface to an altitude of 8 km.
Combined with MODIS and FY-4A observations, high-value AOD and DST areas did exist along 35°~45° N during the daytime on 15 March, so we can conclude that the severe dust storm in the above area lasted from daytime to night. Polluted continental aerosols were distributed at low altitudes of 0–4 km in eastern Sichuan Province, southwestern Shaanxi Province and southeastern Gansu Province. Dust aerosols were sporadically distributed at a 4–6 km altitude, which may be caused by dust transported from high altitudes in areas with higher latitudes. At 21:00, the CALIPSO satellite orbited through the Chinese region within the range of 30°~50° N, and there was a little bit of polluted dust, polluted continental aerosols and dust aerosols from 0–8 km. CALIPSO showed the presence of a dense layer of dust 1–6 km over 42° N 84.5° E. This phenomenon was consistent with the observations of the MODIS AOD and the FY-4A DSD product.
At 06:00 on 16 March, the CALIPSO satellite orbit covering 35°~47° N gathered a large amount of dust, which was obvious in northern and southeastern Shaanxi Province, western Inner Mongolia in northern China and Mongolia at an altitude of 0–5 km. At 7:33, the satellite orbit crossed within the range of 28°~45° N in the Chinese region, most of the area was a blank area for aerosols, but a large number of dust aerosols existed over 42°~43° N for 1–5 km. At 18:00 on 16 March, the dust had risen into the atmosphere of Jilin Province, Heilongjiang Province and Liaoning Province, with a large number of dust aerosols present at 3–8 km. CALIPSO data showed that 35°~40° N eastern coastal areas of China were also affected by sand and dust, mainly distributed at altitudes of 3–8 km. At 20:00, the eastern part of Tibet Autonomous Region was dominated by polluted continental and elevated smoke aerosols, while dust aerosols were mainly distributed at 4–8 km in Qinghai Province and Gansu Province.
It is noteworthy that CALIPSO data showed that dust had risen into the atmosphere of Jilin, Heilongjiang and Liaoning at 18:00 on 16 March (Figure 13), and a large amount of dust-type aerosols were present at a 3–8 km altitude. However, no high PM10 values were recorded at ground level. The maximum PM10 concentration in Heilongjiang did not exceed 400 μg/m3 on 15 March, and the maximum PM10 concentration in Shenyang did not exceed 300 μg/m3. It can be seen that the combination of ground station data and satellite data for the analysis of dust events can contribute to monitoring the large-scale and long-distance dust transport processes comprehensively.

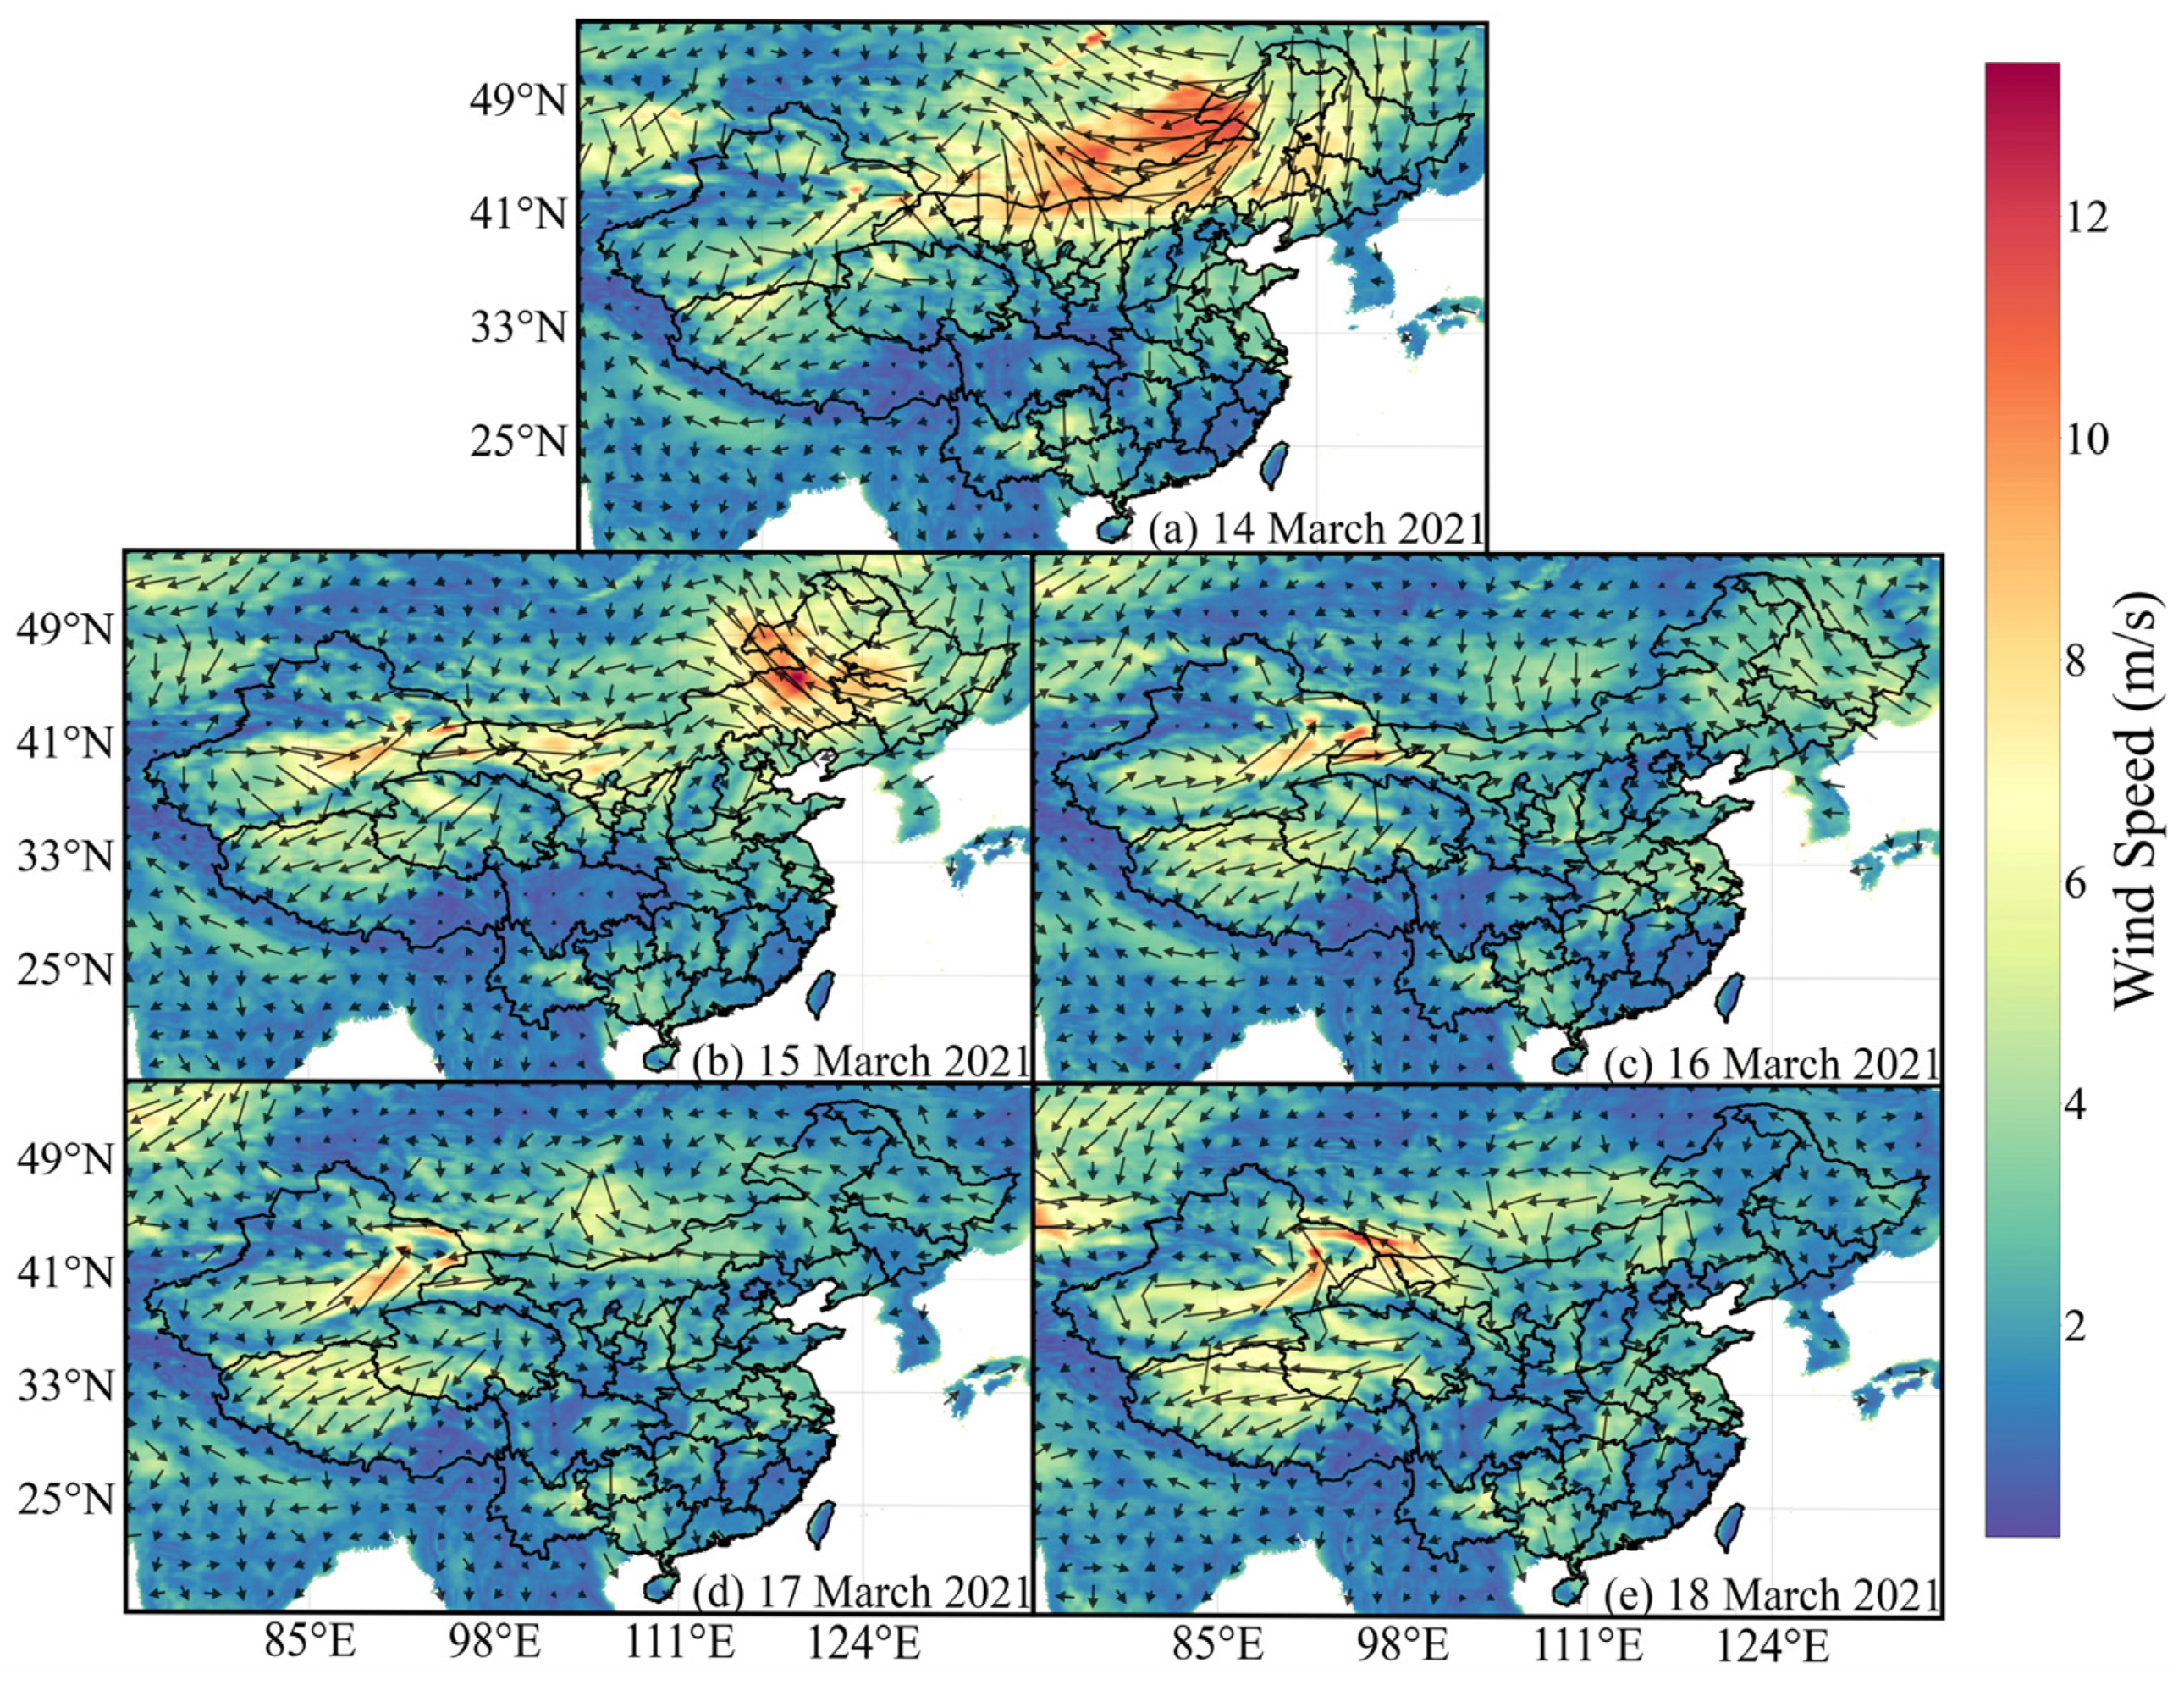
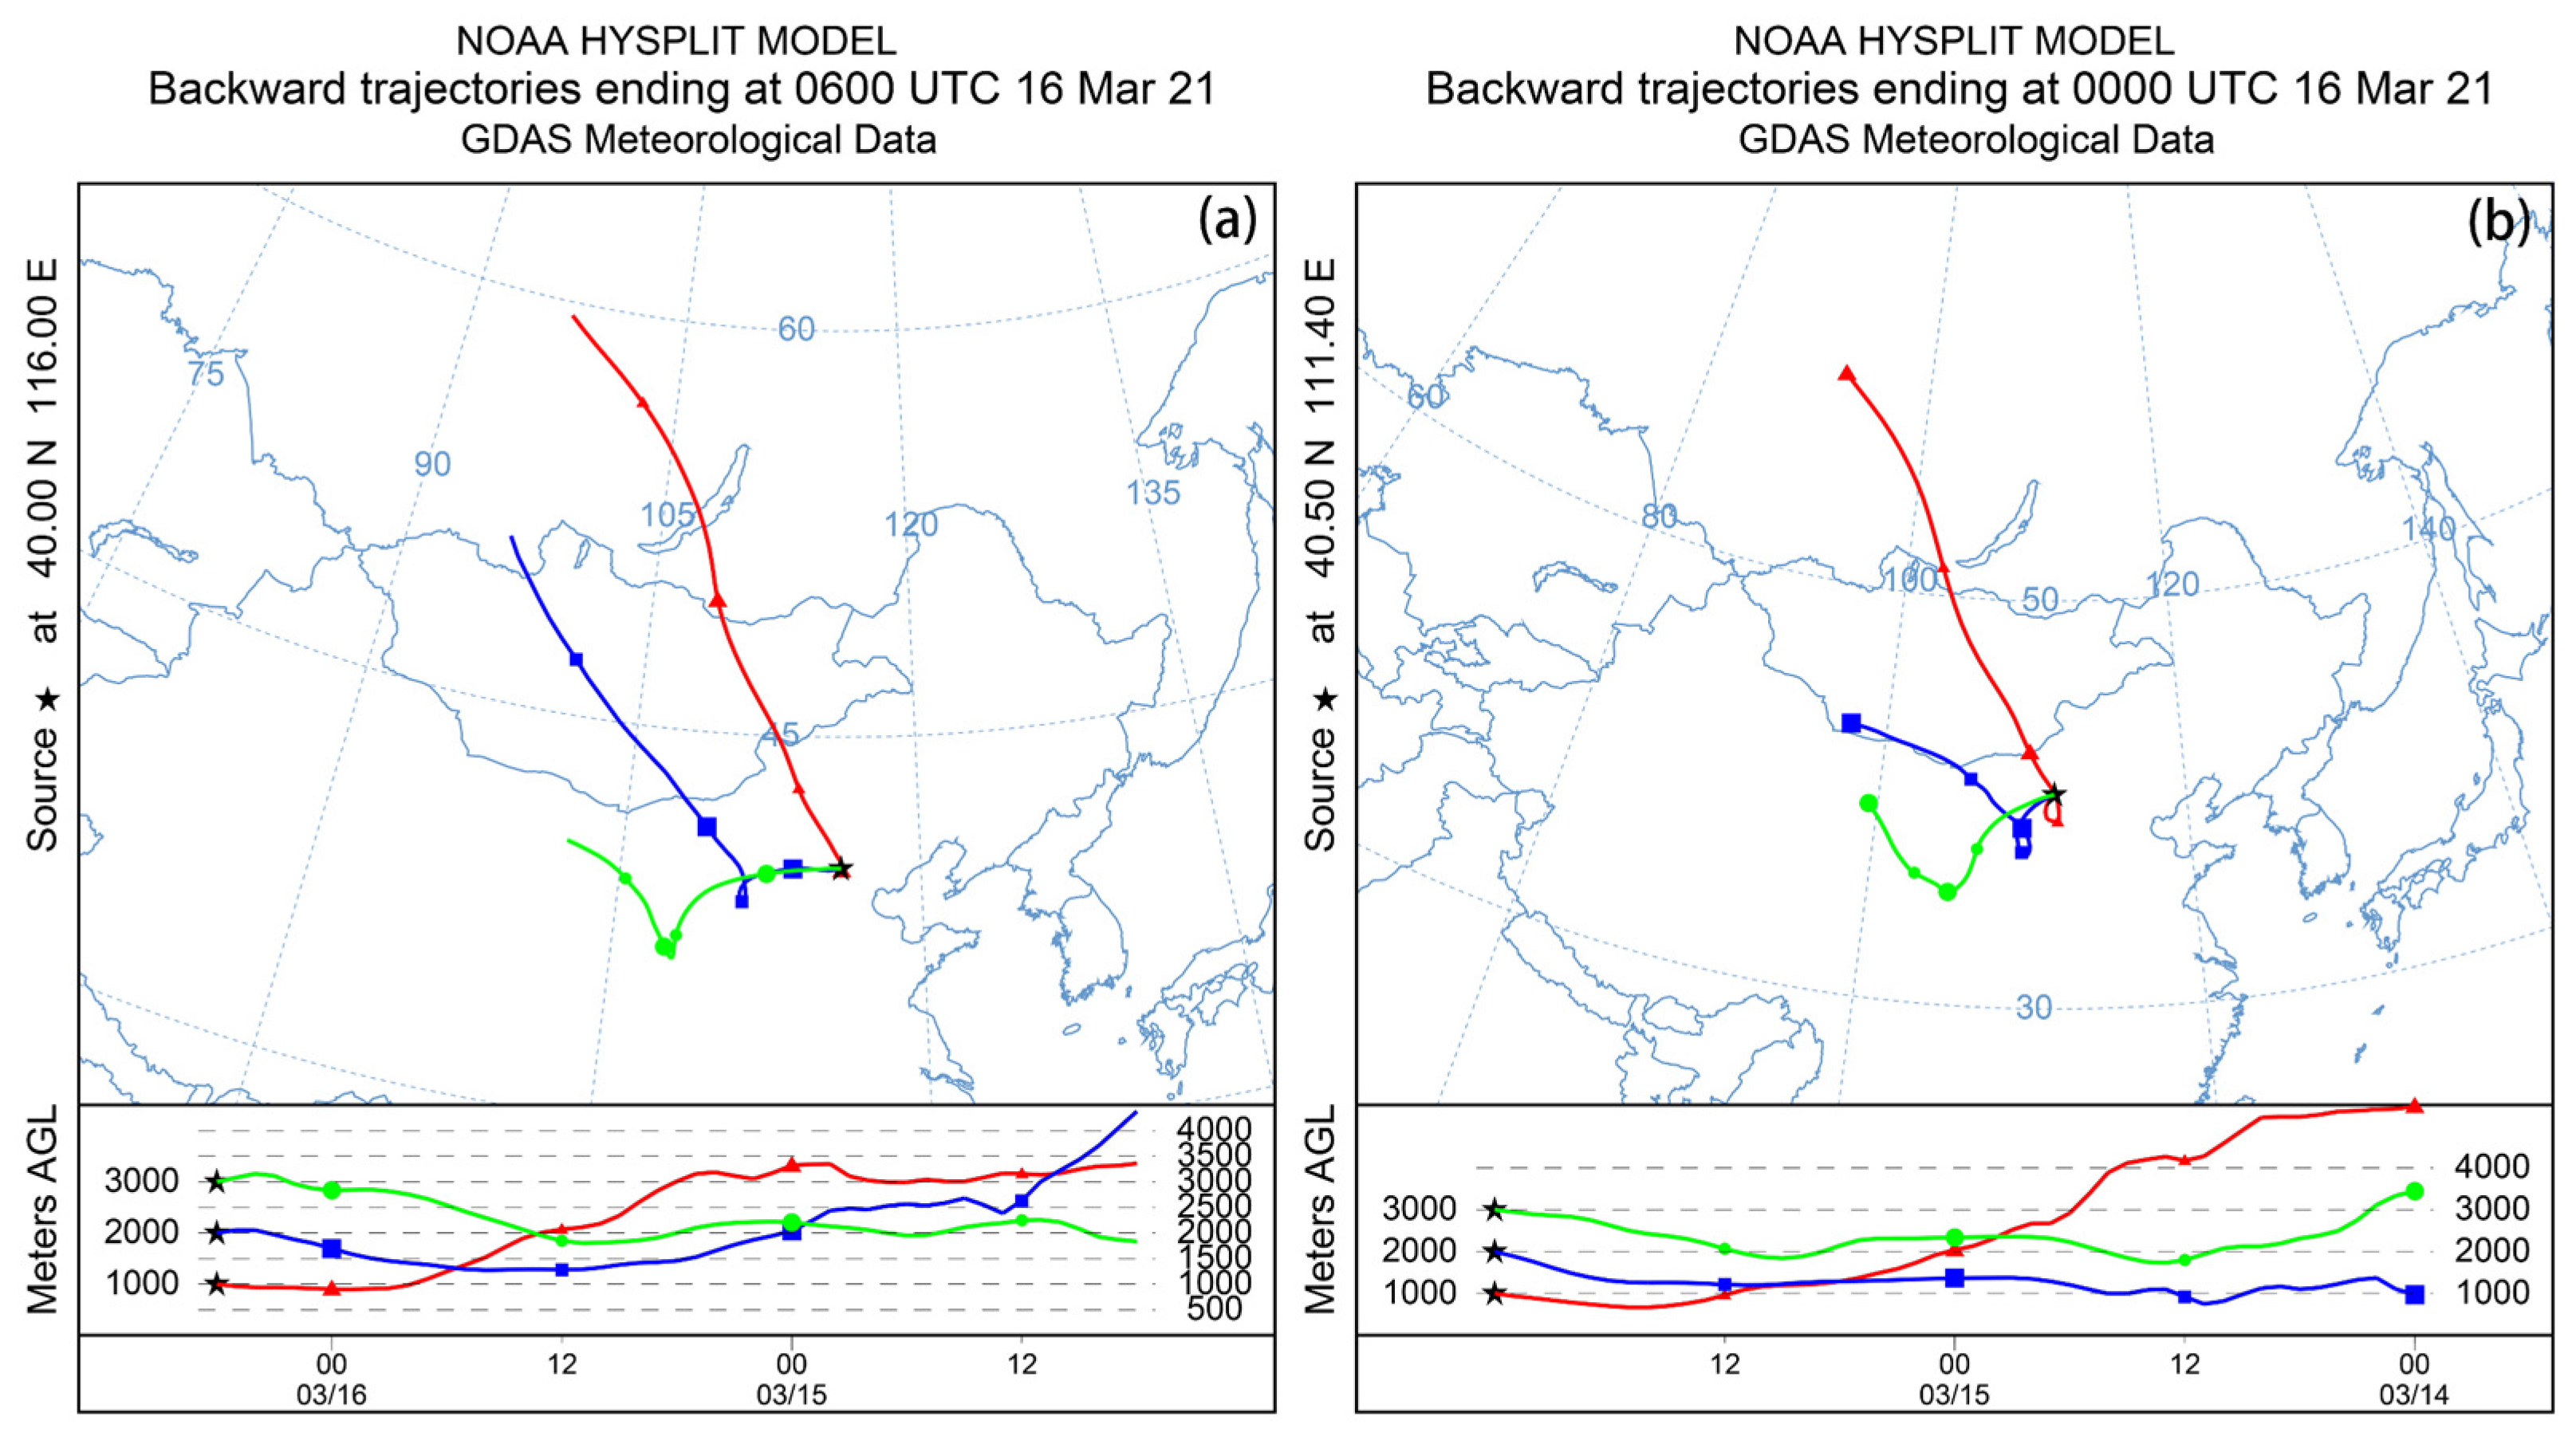
3.5. Wind and HYSPLIT Tracking Analysis

Factors affecting dust pollution include horizontal winds in addition to vertical motion. Wind speed and direction assessment are essential factors for monitoring the transport of dust aerosols. Generally, the higher the wind speed near the ground, the easier it is to raise sand in the horizontal direction. Our study used wind vectors at the height of 10 m from ground level to investigate the effect of wind driving on dust transport. When dusty weather occurs, dust from the ground spreads into the atmosphere by strong winds. The wind direction determines the direction of dust propagation and transport, and the speed of the wind determines the speed of dust dispersion. In Figure 14, the wind speed and direction at 10 m above the ground may be a vivid indication of desert dust emission [29].
On 14 March, high wind speeds (>8 m/s) prevailed in Mongolia and northern China, which were very favorable for the spread of dust. In eastern Mongolia, airflow moved significantly from southeast to northwest and then turned northerly in western Mongolia. The north wind prevailed near the western part of Mongolia. Dust from the Mongolian source area was carried south by this wind and continued to spread to northern China, and mixed with the dust from the Mongolian desert, then continued transporting southward and, finally, affected most parts of China. On 15 March, the wind direction near the ground shifted significantly from north to southeast in northeastern China. The wind speed also increased significantly, accelerating the transport of pollutants. On the 16th, the wind speed decreased to less than 4 m/s in Mongolia and Inner Mongolia, which made it difficult for pollutants to spread and caused the accumulation of pollutants. The wind speed increased slowly in the area on the 17th, providing favorable conditions for transporting pollutants. On the whole, the wind speed decreased significantly from March 16th to 18th compared with the 14th and 15th, and the north wind from Mongolia was more favorable to the transmission and diffusion of dust. This shows that the surface wind direction and speed have a significant influence on the polluted weather in northern China.
We also used NOAA’s Global Data Assimilation System (GDAS) 1° × 1° meteorological field data to determine this dust process’s origin and transport path through the HYSPLIT backward trajectory model. As shown in Figure 15, we selected Beijing and Hohhot as the starting points of the model to trace the origin and transmission of dust storms for 48 h. The simulated altitudes were 1000 m, 2000 m and 3000 m (AGL), respectively.
According to the HYSPLIT analysis, the dust storm was of highly mixed dust particles from western Mongolia and northwestern China. The long airflow allowed for the widespread transport of suspended dust particles, thus severely affecting the air quality in northern China. All three trajectories in Beijing and Hohhot were mainly transmitted from northwest to southeast. Sand and dust at a height of 3 km gradually fell to the ground after a long period of transport. The trajectories of these dust particles were mainly concentrated between 35° N and 50° N and the upper air masses were mainly from Siberia. The results of the HYSPLIT analysis were in high agreement with the satellite observations.
To validate the precipitation for the five days before the dust storm outbreak at the source of the dust storm, daily precipitation of the WMO ground observation data was acquired during the period of interest and then processed. We selected 29 sites in western Mongolia and 9 sites in northwestern China.
The precipitation data showed there was no occurrence of precipitation events in northwestern China for the five days before the dust storm. In western Mongolia, 22 of the 28 sites received no precipitation and 6 sites received one precipitation of less than 1 mm.
To further validate the dry soil condition of the deduced emission source area surface, which is the decisive factor for the outbreak of dust storm events, we obtained the soil moisture data of the China and Mongolia area from the NASA–USDA SMAP global soil moisture data (Figure 16).
From Figure 16, the soil moisture in western Mongolia and northwestern China is nearly 0, at most lower than 3.0, indicating arid soil conditions in these areas from 7–15 March, a few days before the dust storm outbreak, which again validates the HYSPLIT analysis inferring that the dust originated in western Mongolia and northwestern China and was transported along the northwest–southeast direction.

4. Conclusions

In this study, a complete application frame of integrating hybrid methods based on multi-source data is proposed for remote sensing monitoring and process analysis of dust storms. Synoptic analysis of the dust storm event from 14–18 March 2021 was conducted using multi-source data such as ground station data, multi-source remote sensing data and reanalysis datasets combined with the HYSPLIT model. We comprehensively studied the process of its occurrence and extinction, spatial and temporal distribution, vertical structure characteristics, primary emission sources and transportation pathways. The conclusions are as follows:
(1)
The dust storm originated in western Mongolia and northwestern China. The overall transportation path is from the source along the northwest–southeast movement direction, with a wide range and heavy pollution.
(2)
The dust storm formed on 15 March and peaked on 16 March, severely affecting air quality in a dozen provinces in northern and northwestern China. The maximum hourly PM10 concentration at ground stations in Beijing, Jinchang, Wuwei, Zhongwei, Yinchuan and other cities exceeded 6000 μg/m3, more than 40 times the China Ambient Air Quality Standards.
(3)
Satellite remote sensing observation shows that the AOD exceeded 2.0 in some areas of northern China, and DST monitored by FY-4A exceeded 20. The spatial distribution of the two is very consistent. Using the FY-4A geostationary satellite can realize continuous monitoring of dust transport processes over a large area and high frequency in China, providing crucial information for our understanding of dust emission sources, dust transportation paths and impact areas.
(4)
By employing the LIDAR active observation CALIPSO data, we could effectively yield information on the vertical distribution of sand and dust. During the dust transportation, the dust was deposited from high altitudes and mixed with local near-ground particles, and the dust aerosol extended from the ground to an altitude of 8 km. During the weakening period of dusty weather, the vertical distribution height of dust aerosol was 1–4 km.
(5)
The study of individual cases of dust events through joint observation of multi-source data contributes to the comprehensive monitoring of large-scale and long-distance dust transport processes, which showed good potential of the hybrid methods’ integration for remote sensing monitoring and process analysis of dust storms.

Author Contributions

Conceptualization, Y.W. and J.T.; methodology, Y.W. and J.T.; validation, Y.W. and J.T.; formal analysis, Y.W. and Z.Z.; investigation, Y.W. and J.T.; writing—original draft preparation, Y.W.; writing—review and editing, Y.W., J.T., W.W., Z.Z., J.W. and Z.W. All authors have read and agreed to the published version of the manuscript.

Funding

This work was jointly supported by the National Key Research and Development Program of China (No. 2020YFC1807102) and the Strategic Priority Research Program of the Chinese Academy of Sciences (XDA20050103).

Institutional Review Board Statement

Not applicable.

Informed Consent Statement

Not applicable.

Data Availability Statement

Not applicable.

Acknowledgments

Not applicable.

Conflicts of Interest

The authors declare no conflict of interest.

References

  1. Li, J.; Wong, M.S.; Lee, K.H.; Nichol, J.; Chan, P. Review of dust storm detection algorithms for multispectral satellite sensors. Atmos. Res. 2020, 250, 105398. [Google Scholar] [CrossRef]
  2. Kaufman, Y.J.; Tanré, D.; Dubovik, O.; Karnieli, A.; Remer, L.A. Absorption of sunlight by dust as inferred from satellite and ground-based remote sensing. Geophys. Res. Lett. 2001, 28, 1479–1482. [Google Scholar] [CrossRef] [Green Version]
  3. Su, Q.; Sun, L.; Yang, Y.; Zhou, X.; Li, R.; Jia, S. Dynamic Monitoring of the Strong Sandstorm Migration in Northern and Northwestern China via Satellite Data. Aerosol Air Qual. Res. 2017, 17, 3244–3252. [Google Scholar] [CrossRef] [Green Version]
  4. Schepanski, K.; Tegen, I.; Macke, A. Comparison of satellite based observations of Saharan dust source areas. Remote Sens. Environ. 2012, 123, 90–97. [Google Scholar] [CrossRef]
  5. Chiapello, I.; Prospero, J.M.; Herman, J.R.; Hsu, N.C. Detection of mineral dust over the North Atlantic Ocean and Africa with the Nimbus 7 TOMS. J. Geophys. Res. Earth Surf. 1999, 104, 9277–9291. [Google Scholar] [CrossRef]
  6. Herman, J.R.; Bhartia, P.K.; Torres, O.; Hsu, C.; Seftor, C.; Celarier, E. Global distribution of UV-absorbing aerosols from Nimbus 7/TOMS data. J. Geophys. Res. Atmos. 1997, 102, 16911–16922. [Google Scholar] [CrossRef]
  7. Wald, A.E.; Kaufman, Y.J.; Tanré, D.; Gao, B.-C. Daytime and nighttime detection of mineral dust over desert using infrared spectral contrast. J. Geophys. Res. Earth Surf. 1998, 103, 32307–32313. [Google Scholar] [CrossRef]
  8. Sowden, M.; Mueller, U.; Blake, D. Review of surface particulate monitoring of dust events using geostationary satellite remote sensing. Atmos. Environ. 2018, 183, 154–164. [Google Scholar] [CrossRef]
  9. Prata, A.J. Observations of volcanic ash clouds in the 10–12 μm window using AVHRR/2 data. Int. J. Remote Sens. 1989, 10, 751–761. [Google Scholar] [CrossRef]
  10. Sowden, M.; Mueller, U.; Blake, D. What temporal resolution is required for remote sensing of regional aerosol concentrations using the Himawari-8 geostationary satellite. Atmos. Environ. 2019, 216, 116914. [Google Scholar] [CrossRef]
  11. Liu, G.-R.; Lin, T.-H. Application of Geostationary Satellite Observations for Monitoring Dust Storms of Asia. Terr. Atmos. Ocean. Sci. 2004, 15, 825–837. [Google Scholar] [CrossRef] [Green Version]
  12. El-Askary, H. On the Detection and Monitoring of the Transport of an Asian Dust Storm Using Multi-Sensor Satellite Remote Sensing. J. Environ. Inform. 2015, 25, 99–116. [Google Scholar] [CrossRef]
  13. Shin, Y.-R.; Sohn, E.-H.; Park, K.-H.; Ryu, G.-H.; Lee, S.; Lee, S.-Y.; Park, N.-Y. Correction to: Improved Dust Detection over East Asia Using Geostationary Satellite Data. Asia-Pacific J. Atmos. Sci. 2021, 57, 863. [Google Scholar] [CrossRef]
  14. Hu, X.Q.; Lu, N.M.; Niu, T.; Zhang, P. Operational retrieval of Asian sand and dust storm from FY-2C geostationary meteorological satellite and its application to real time forecast in Asia. Atmos. Chem. Phys. 2008, 8, 1649–1659. [Google Scholar] [CrossRef] [Green Version]
  15. Di, A.; Xue, Y.; Yang, X.; Leys, J.; Guang, J.; Mei, L.; Wang, J.; She, L.; Hu, Y.; He, X.; et al. Dust Aerosol Optical Depth Retrieval and Dust Storm Detection for Xinjiang Region Using Indian National Satellite Observations. Remote Sens. 2016, 8, 702. [Google Scholar] [CrossRef] [Green Version]
  16. Akhlaq, M.; Sheltami, T.R.; Mouftah, H.T. A review of techniques and technologies for sand and dust storm detection. Rev. Environ. Sci. Bio/Technol. 2012, 11, 305–322. [Google Scholar] [CrossRef]
  17. Washington, R.; Todd, M.; Middleton, N.J.; Goudie, A.S. Dust-Storm Source Areas Determined by the Total Ozone Monitoring Spectrometer and Surface Observations. Ann. Assoc. Am. Geogr. 2003, 93, 297–313. [Google Scholar] [CrossRef]
  18. Attiya, A.A.; Jones, B.G. An extensive dust storm impact on air quality on 22 November 2018 in Sydney, Australia, using satellite remote sensing and ground data. Environ. Monit. Assess. 2022, 194, 1–18. [Google Scholar] [CrossRef]
  19. Ashrafi, K.; Shafiepour-Motlagh, M.; Aslemand, A.; Ghader, S. Dust storm simulation over Iran using HYSPLIT. J. Environ. Health Sci. Eng. 2014, 12, 9. [Google Scholar] [CrossRef] [Green Version]
  20. Middleton, N.; Kashani, S.S.; Attarchi, S.; Rahnama, M.; Mosalman, S.T. Synoptic Causes and Socio-Economic Consequences of a Severe Dust Storm in the Middle East. Atmosphere 2021, 12, 1435. [Google Scholar] [CrossRef]
  21. Lin, Z.; Levy, J.K.; Lei, H.; Bell, M.L. Advances in Disaster Modeling, Simulation and Visualization for Sandstorm Risk Management in North China. Remote Sens. 2012, 4, 1337–1354. [Google Scholar] [CrossRef] [Green Version]
  22. Li, X.; Liu, X.; Yin, Z.-Y. The Impacts of Taklimakan Dust Events on Chinese Urban Air Quality. Atmosphere 2018, 9, 281. [Google Scholar] [CrossRef] [Green Version]
  23. Li, R.; Gong, J.; Zhou, J.; Sun, W.; Ibrahim, A.N. Multi-Satellite Observation of an Intense Dust Event over Southwestern China. Aerosol Air Qual. Res. 2015, 15, 263–270. [Google Scholar] [CrossRef] [Green Version]
  24. Guo, J.; Niu, T.; Wang, F.; Deng, M.; Wang, Y. Integration of multi-source measurements to monitor sand-dust storms over North China: A case study. Acta Meteorol. Sin. 2013, 27, 566–576. [Google Scholar] [CrossRef]
  25. Cao, G.Z.; Zhang, P.; Hou, P.; Hu, X.Q.; Chen, L. Investigation and validation of a dust data fusion method based on monitoring data from geostationary and polar-orbiting satellites. In Proceedings of the Conference on Remote Sensing of the Atmosphere, Clouds, and Precipitation V, Beijing, China, 13–15 October 2014. [Google Scholar] [CrossRef]
  26. Wang, F.; Yang, T.; Wang, Z.; Cao, J.; Liu, B.; Liu, J.; Chen, S.; Liu, S.; Jia, B. A Comparison of the Different Stages of Dust Events over Beijing in March 2021: The Effects of the Vertical Structure on Near-Surface Particle Concentration. Remote. Sens. 2021, 13, 3580. [Google Scholar] [CrossRef]
  27. Wu, Z.; Jiang, Q.; Yu, Y.; Xiao, H.; Freese, D. Spatio-Temporal Evolution of a Typical Sandstorm Event in an Arid Area of Northwest China in April 2018 Based on Remote Sensing Data. Remote Sens. 2022, 14, 3065. [Google Scholar] [CrossRef]
  28. Yang, J.; Zhao, T.; Cheng, X.; Ren, Z.; Meng, L.; He, Q.; Tan, C.; Zhu, Y.; Zhu, C.; Wu, Z. Temporal and spatial variations of sandstorm and the related meteorological influences over northern China from 2000 to Acta. Sci. Circumst. 2021, 41, 2966–2975. [Google Scholar]
  29. Filonchyk, M. Characteristics of the severe March 2021 Gobi Desert dust storm and its impact on air pollution in China. Chemosphere 2021, 287, 132219. [Google Scholar] [CrossRef]
  30. Luo, J.; Huang, F.; Gao, S.; Liu, S.; Liu, R.; Devasthale, A. Satellite Monitoring of the Dust Storm over Northern China on 15 March 2021. Atmosphere 2022, 13, 157. [Google Scholar] [CrossRef]
  31. Liang, P.; Chen, B.; Yang, X.; Liu, Q.; Li, A.; Mackenzie, L.; Zhang, D. Revealing the dust transport processes of the 2021 mega dust storm event in northern China. Sci. Bull. 2021, 67, 21–24. [Google Scholar] [CrossRef]
  32. Yang, X.; Zhang, Q.; Ye, P.; Qin, H.; Xu, L.; Ma, L.; Gong, C. Characteristics and causes of persistent sand-dust weather in mid-March 2021 over Northern China. J. Desert Res. 2021, 41, 245–255. [Google Scholar]
  33. Wang, N.; Zhang, Q.; Sun, S.; Wang, H.; He, M.; Zheng, P.; Wang, R. A sandstorm extreme event from the Yellow River Basin in March 2021: Accurate identification and driving cause. Sci. Total Environ. 2022, 846, 157424. [Google Scholar] [CrossRef]
  34. Wang, N.; Chen, J.; Zhang, Y.; Xu, Y.; Cui, J. Multi-source remote sensing analysis of the first sand and dust weather in Northern China in China. Environ. Sci. 2022, 42, 2002–2014. [Google Scholar]
  35. Sun, X.; Fan, X.; Zhang, T.; Wang, Y.; Wang, Y.; Lyu, D.; Zheng, M. Tempo-Spatial Distributions and Transport Characteristics of Two Dust Events over Northern China in March. Remote. Sens. 2022, 14, 5967. [Google Scholar] [CrossRef]
  36. Filonchyk, M.; Peterson, M. Development, progression, and impact on urban air quality of the dust storm in Asia in March 15–18. Urban Clim. 2022, 41, 101080. [Google Scholar] [CrossRef]
  37. Xu, D.; Qu, J.J.; Niu, S.; Hao, X. Sand and dust storm detection over desert regions in China with MODIS measurements. Int. J. Remote Sens. 2011, 32, 9365–9373. [Google Scholar] [CrossRef]
  38. Wang, Y.Q.; Zhang, X.Y.; Gong, S.L.; Zhou, C.H.; Hu, X.Q.; Liu, H.L.; Niu, T.; Yang, Y.Q. Surface observation of sand and dust storm in East Asia and its application in CUACE/Dust. Atmos. Chem. Phys. Discuss. 2008, 8, 545–553. [Google Scholar] [CrossRef] [Green Version]
  39. Nair, M.; Dey, S.; Bherwani, H.; Ghosh, A.K. Long-term changes in aerosol loading over the ‘BIHAR’ State of India using nineteen years (2001–2019) of high-resolution satellite data (1 × 1 km2). Atmos. Pollut. Res. 2022, 13, 101259. [Google Scholar] [CrossRef]
  40. Xia, X.; Min, J.; Shen, F.; Wang, Y.; Xu, D.; Yang, C.; Zhang, P. Aerosol data assimilation using data from Fengyun-4A, a next-generation geostationary meteorological satellite. Atmos. Environ. 2020, 237, 117695. [Google Scholar] [CrossRef]
  41. Tan, S.-C.; Li, J.; Che, H.; Chen, B.; Wang, H. Transport of East Asian dust storms to the marginal seas of China and the southern North Pacific in spring. Atmos. Environ. 2017, 148, 316–328. [Google Scholar] [CrossRef]
  42. Valipour, M.; Dietrich, J. Developing ensemble mean models of satellite remote sensing, climate reanalysis, and land surface models. Theor. Appl. Climatol. 2022, 150, 909–926. [Google Scholar] [CrossRef]
  43. Tsai, Y.I.; Chen, C.-L. Characterization of Asian dust storm and non-Asian dust storm PM2.5 aerosol in southern Taiwan. Atmos. Environ. 2006, 40, 4734–4750. [Google Scholar] [CrossRef]
  44. Stein, A.F.; Draxler, R.R.; Rolph, G.D.; Stunder, B.J.B.; Cohen, M.D.; Ngan, F. NOAA’s HYSPLIT Atmospheric Transport and Dispersion Modeling System. Bull. Am. Meteorol. Soc. 2015, 96, 2059–2077. [Google Scholar] [CrossRef]
  45. Peng, S.; Ju, T.; Liang, Z.; Li, M.; Liu, S.; Pan, B. Analysis of atmospheric ozone in Fenwei Plain based on remote sensing monitoring. Environ. Monit. Assess. 2022, 194, 412. [Google Scholar] [CrossRef] [PubMed]
Figure 1. The study area focused on the northern regions of China affected by this dust storm event.
Atmosphere 14 00003 g001
Figure 2. The application frame of integrating hybrid methods based on multi-source data for remote sensing monitoring and process analysis of dust storms.
Atmosphere 14 00003 g002
Figure 3. Locations of the ground stations for PM observation in the cities (the background is the DEM of the study area).
Atmosphere 14 00003 g003
Figure 4. Hourly PM10 concentration in cities severely affected by the dust storm from 14–18 March 2021. (a) Changes in PM10 concentrations in Tianjin, Taiyuan, Baoding, Shijiazhuang and Bayingolin, (b) Changes in PM10 concentrations in Hohhot, Hami, Yan’an, Alashan, Shuozhou and Binzhou, (c) Changes in PM10 concentrations in Beijing, Jinchang, Wuwei, Zhongwei, Yinchuan and Cangzhou.
Atmosphere 14 00003 g004
Figure 5. Hourly PM2.5 concentration in cities severely affected by the dust storm from 14–18 March 2021. (a) Changes in PM2.5 concentrations in Tianjin, Taiyuan, Baoding, Shijiazhuang and Bayingolin, (b) Changes in PM2.5 concentrations in Hohhot, Hami, Yan’an, Alashan, Shuozhou and Binzhou, (c) Changes in PM2.5 concentrations in Beijing, Jinchang, Wuwei, Zhongwei, Yinchuan and Cangzhou.
Atmosphere 14 00003 g005
Figure 6. Spatial distribution of aerosol optical depth from 14–18 March 2021. (ae) correspond to MODIS AOD images from 14–18 March 2021, respectively.
Atmosphere 14 00003 g006
Figure 7. Spatial distribution of FY-4A dust fraction (DST) from 11:00 to 16:00 on 14 March. (af) represent 14 March at 11:00, 12:00, 13:00, 14:00, 15:00 and 16:00 respectively.
Atmosphere 14 00003 g007
Figure 8. Spatial distribution of FY-4A dust fraction (DST) from 11:00 to 16:00 on 15 March. (af) represent 15 March at 11:00, 12:00, 13:00, 14:00, 15:00 and 16:00 respectively.
Atmosphere 14 00003 g008
Figure 9. Spatial distribution of FY-4A dust fraction (DST) from 11:00 to 16:00 on 16 March. (af) represent 16 March at 11:00, 12:00, 13:00, 14:00, 15:00 and 16:00 respectively.
Atmosphere 14 00003 g009
Figure 10. Spatial distribution of FY-4A dust fraction (DST) from 11:00 to 16:00 on 17 March. (af) represent 17 March at 11:00, 12:00, 13:00, 14:00, 15:00 and 16:00 respectively.
Atmosphere 14 00003 g010
Figure 11. Spatial distribution of FY-4A dust fraction (DST) from 11:00 to 16:00 on 18 March. (af) represent 18 March at 11:00, 12:00, 13:00, 14:00, 15:00 and 16:00 respectively.
Atmosphere 14 00003 g011
Figure 12. Vertical distribution of aerosol types shown by CALIPSO VFM data on 15 March 2021: (a) 05:17 a.m., (b) 06:55 a.m., (c) 19:18 p.m., (d) 20:56 p.m. (e) Satellite track of CALIPSO crossing the northern part of China on 15 March 2021.
Atmosphere 14 00003 g012
Figure 13. Vertical distribution of aerosol types shown by CALIPSO VFM data on 16 March 2021: (a) 05:55 a.m., (b) 07:33 a.m., (c) 18:17 p.m., (d) 19:56 p.m. (e) Satellite track of CALIPSO crossing the northern part of China on 16 March 2021.
Atmosphere 14 00003 g013
Figure 14. Spatial distribution of wind vector at 10 m height above ground during dust storm. (ae) represent the wind vector from 14–18 March 2021 respectively.
Atmosphere 14 00003 g014
Figure 15. The 48 h HYSPLIT backward trajectories for the dust storm. (a,b) are trajectories with the start time at 14:00 of 16 March (UTC) in Beijing and 00:00 of 16 March (UTC) in Hohhot, respectively.
Atmosphere 14 00003 g015
Figure 16. Three-day SMAP global soil moisture data for China and Mongolia from 7–15 March 2021. (a) 7–9 March 2021, (b) 10–12 March 2021 and (c) 13–15 March 2021.
Atmosphere 14 00003 g016
Table 1. Sources of data.
Data CategoryData SourceProducts
Ground station dataAir quality monitoring station dataHourly PM10 and PM2.5 concentration data
World Meteorological Organization (WMO)Daily precipitation data
Remote sensing imagesMODISMCD19A2 aerosol optical depth products
FY-4A satelliteDust detection (DSD) level-2 product
CALIPSO satellite dataLevel 2 Version 4.21 vertical feature mask (VFM)
SMAP global soil moisture dataSurface soil moisture
Reanalysis datasetsERA5 datasetsWind vectors at 10 m above ground
NCEPGDAS
Disclaimer/Publisher’s Note: The statements, opinions and data contained in all publications are solely those of the individual author(s) and contributor(s) and not of MDPI and/or the editor(s). MDPI and/or the editor(s) disclaim responsibility for any injury to people or property resulting from any ideas, methods, instructions or products referred to in the content.

