
An Empirical Relationship among Characteristics of Severe Convective Storms, Their Cloud-Top Properties and Environmental Parameters in Northern Eurasia

Abstract
:1. Introduction
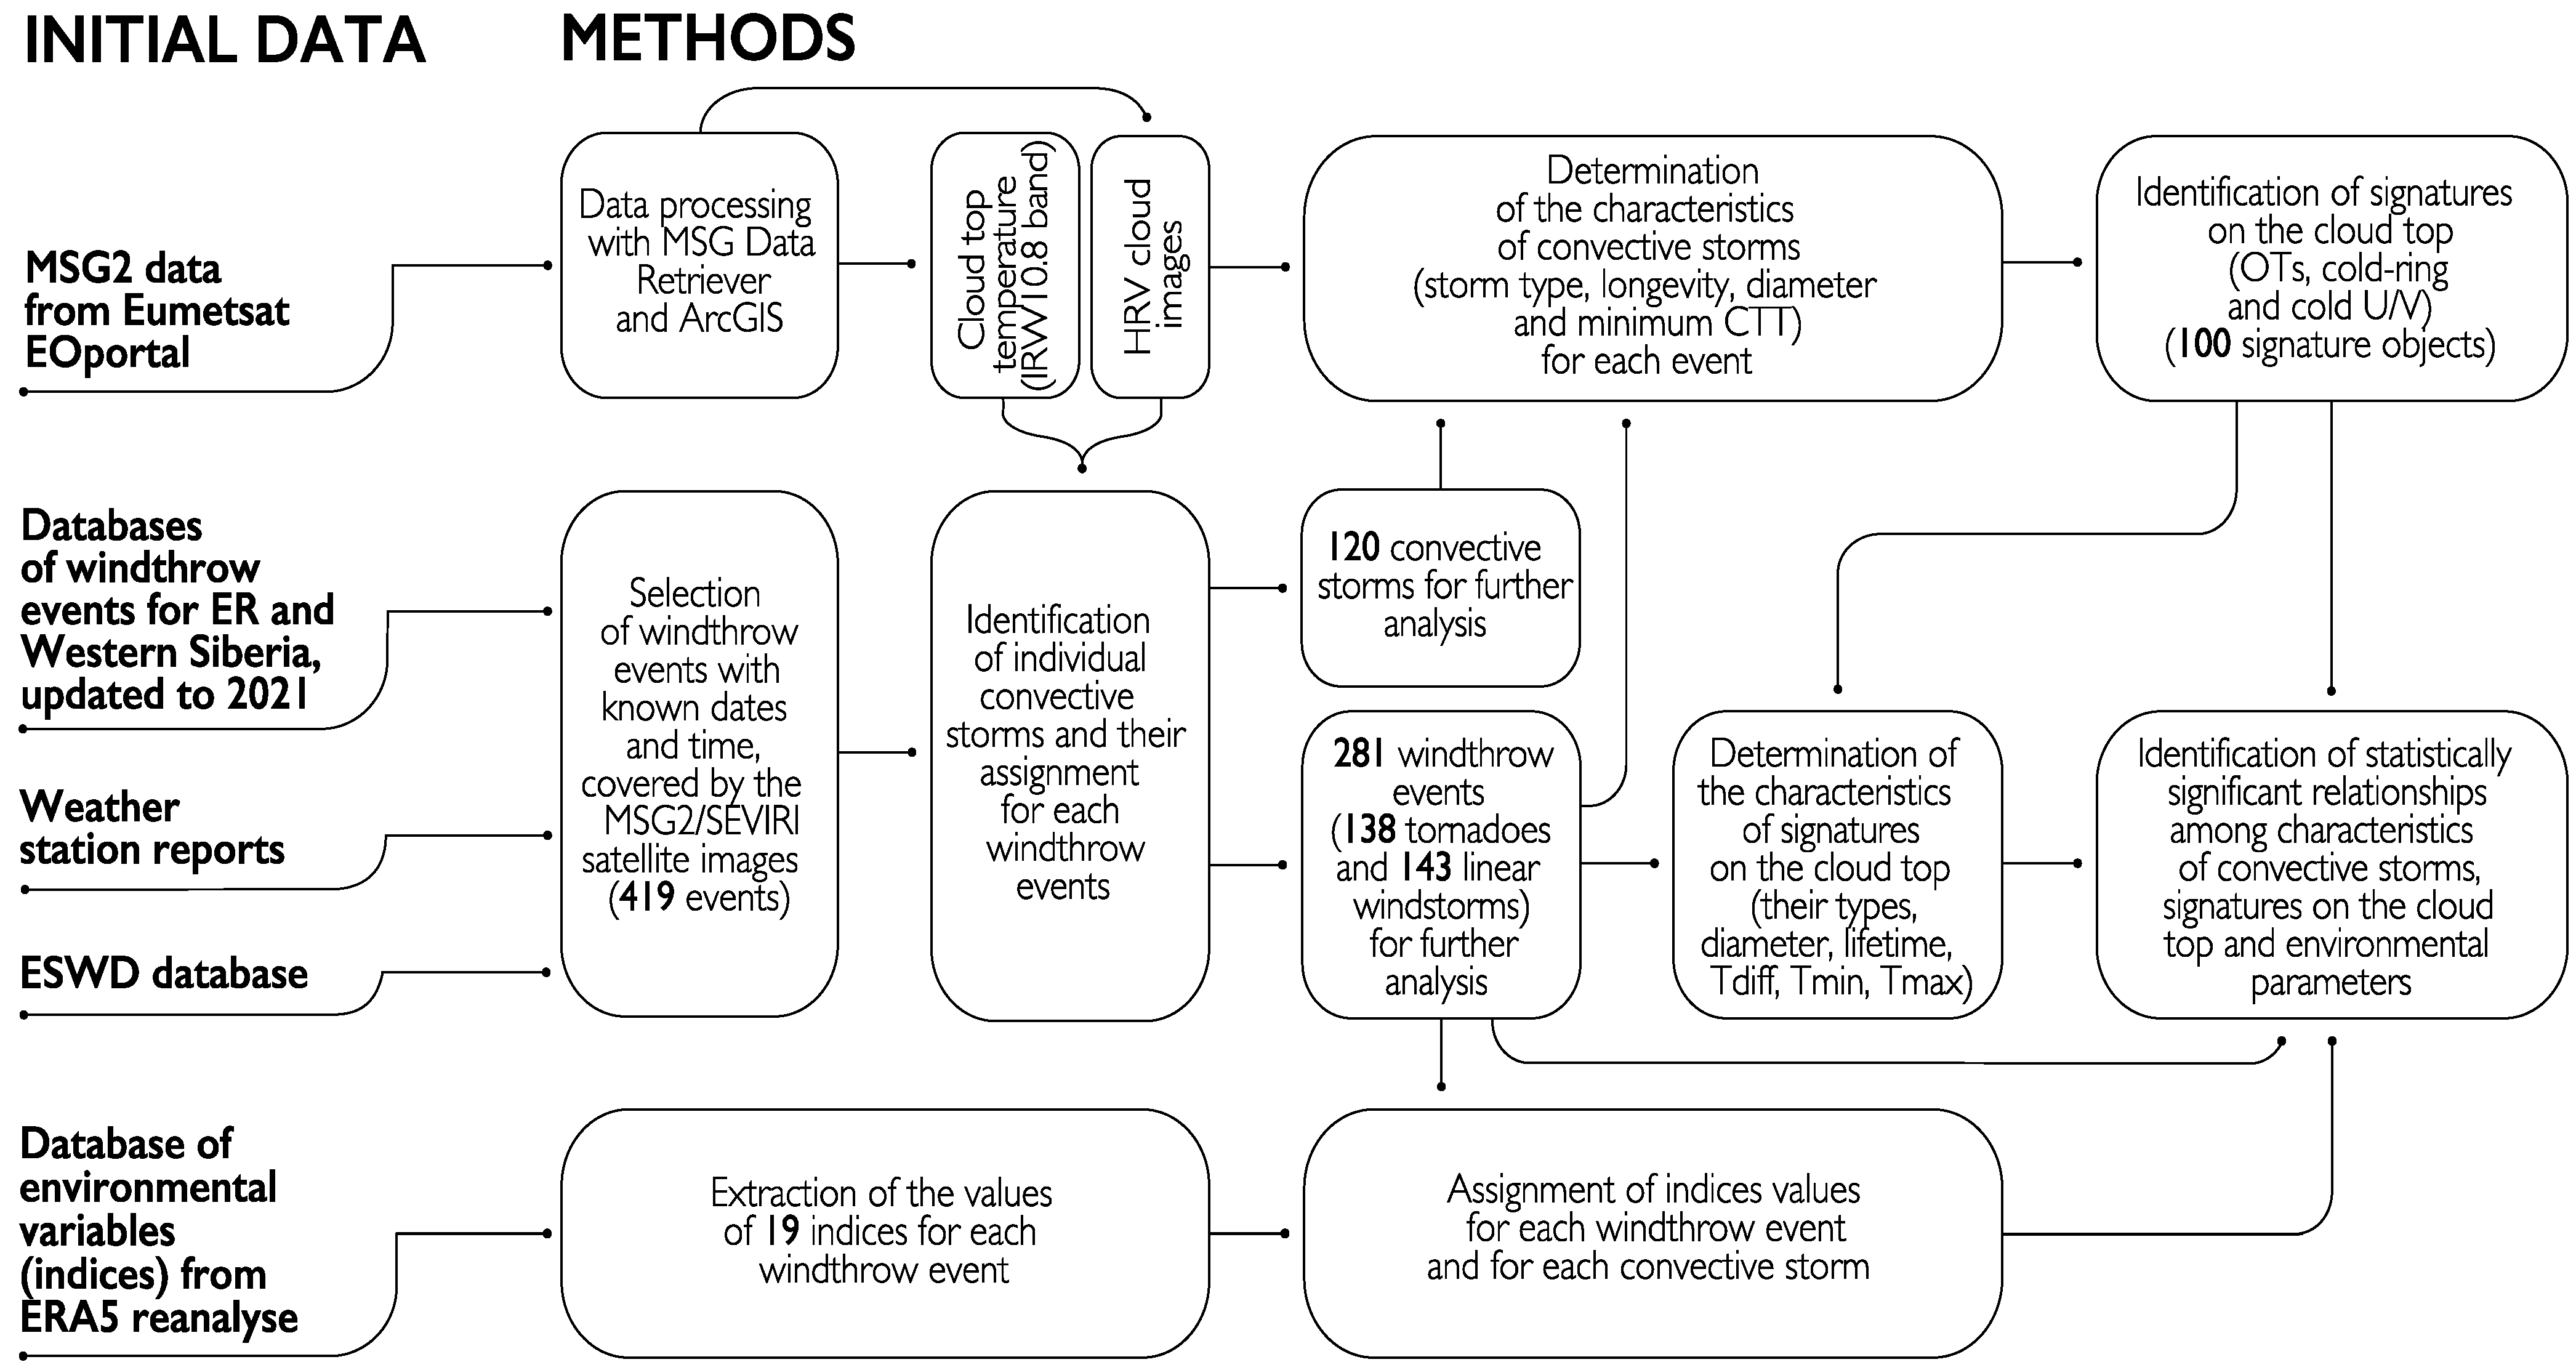
2. Data and Methods
2.1. Specification of the Sample for Storm Events
2.2. Determination of the Convective Storms Characteristics and Cloud Top Features
2.3. Calculation of Environmental Variables
3. Results
3.1. Features of Convective Storms Generating Tornadoes and Straight-Line Winds
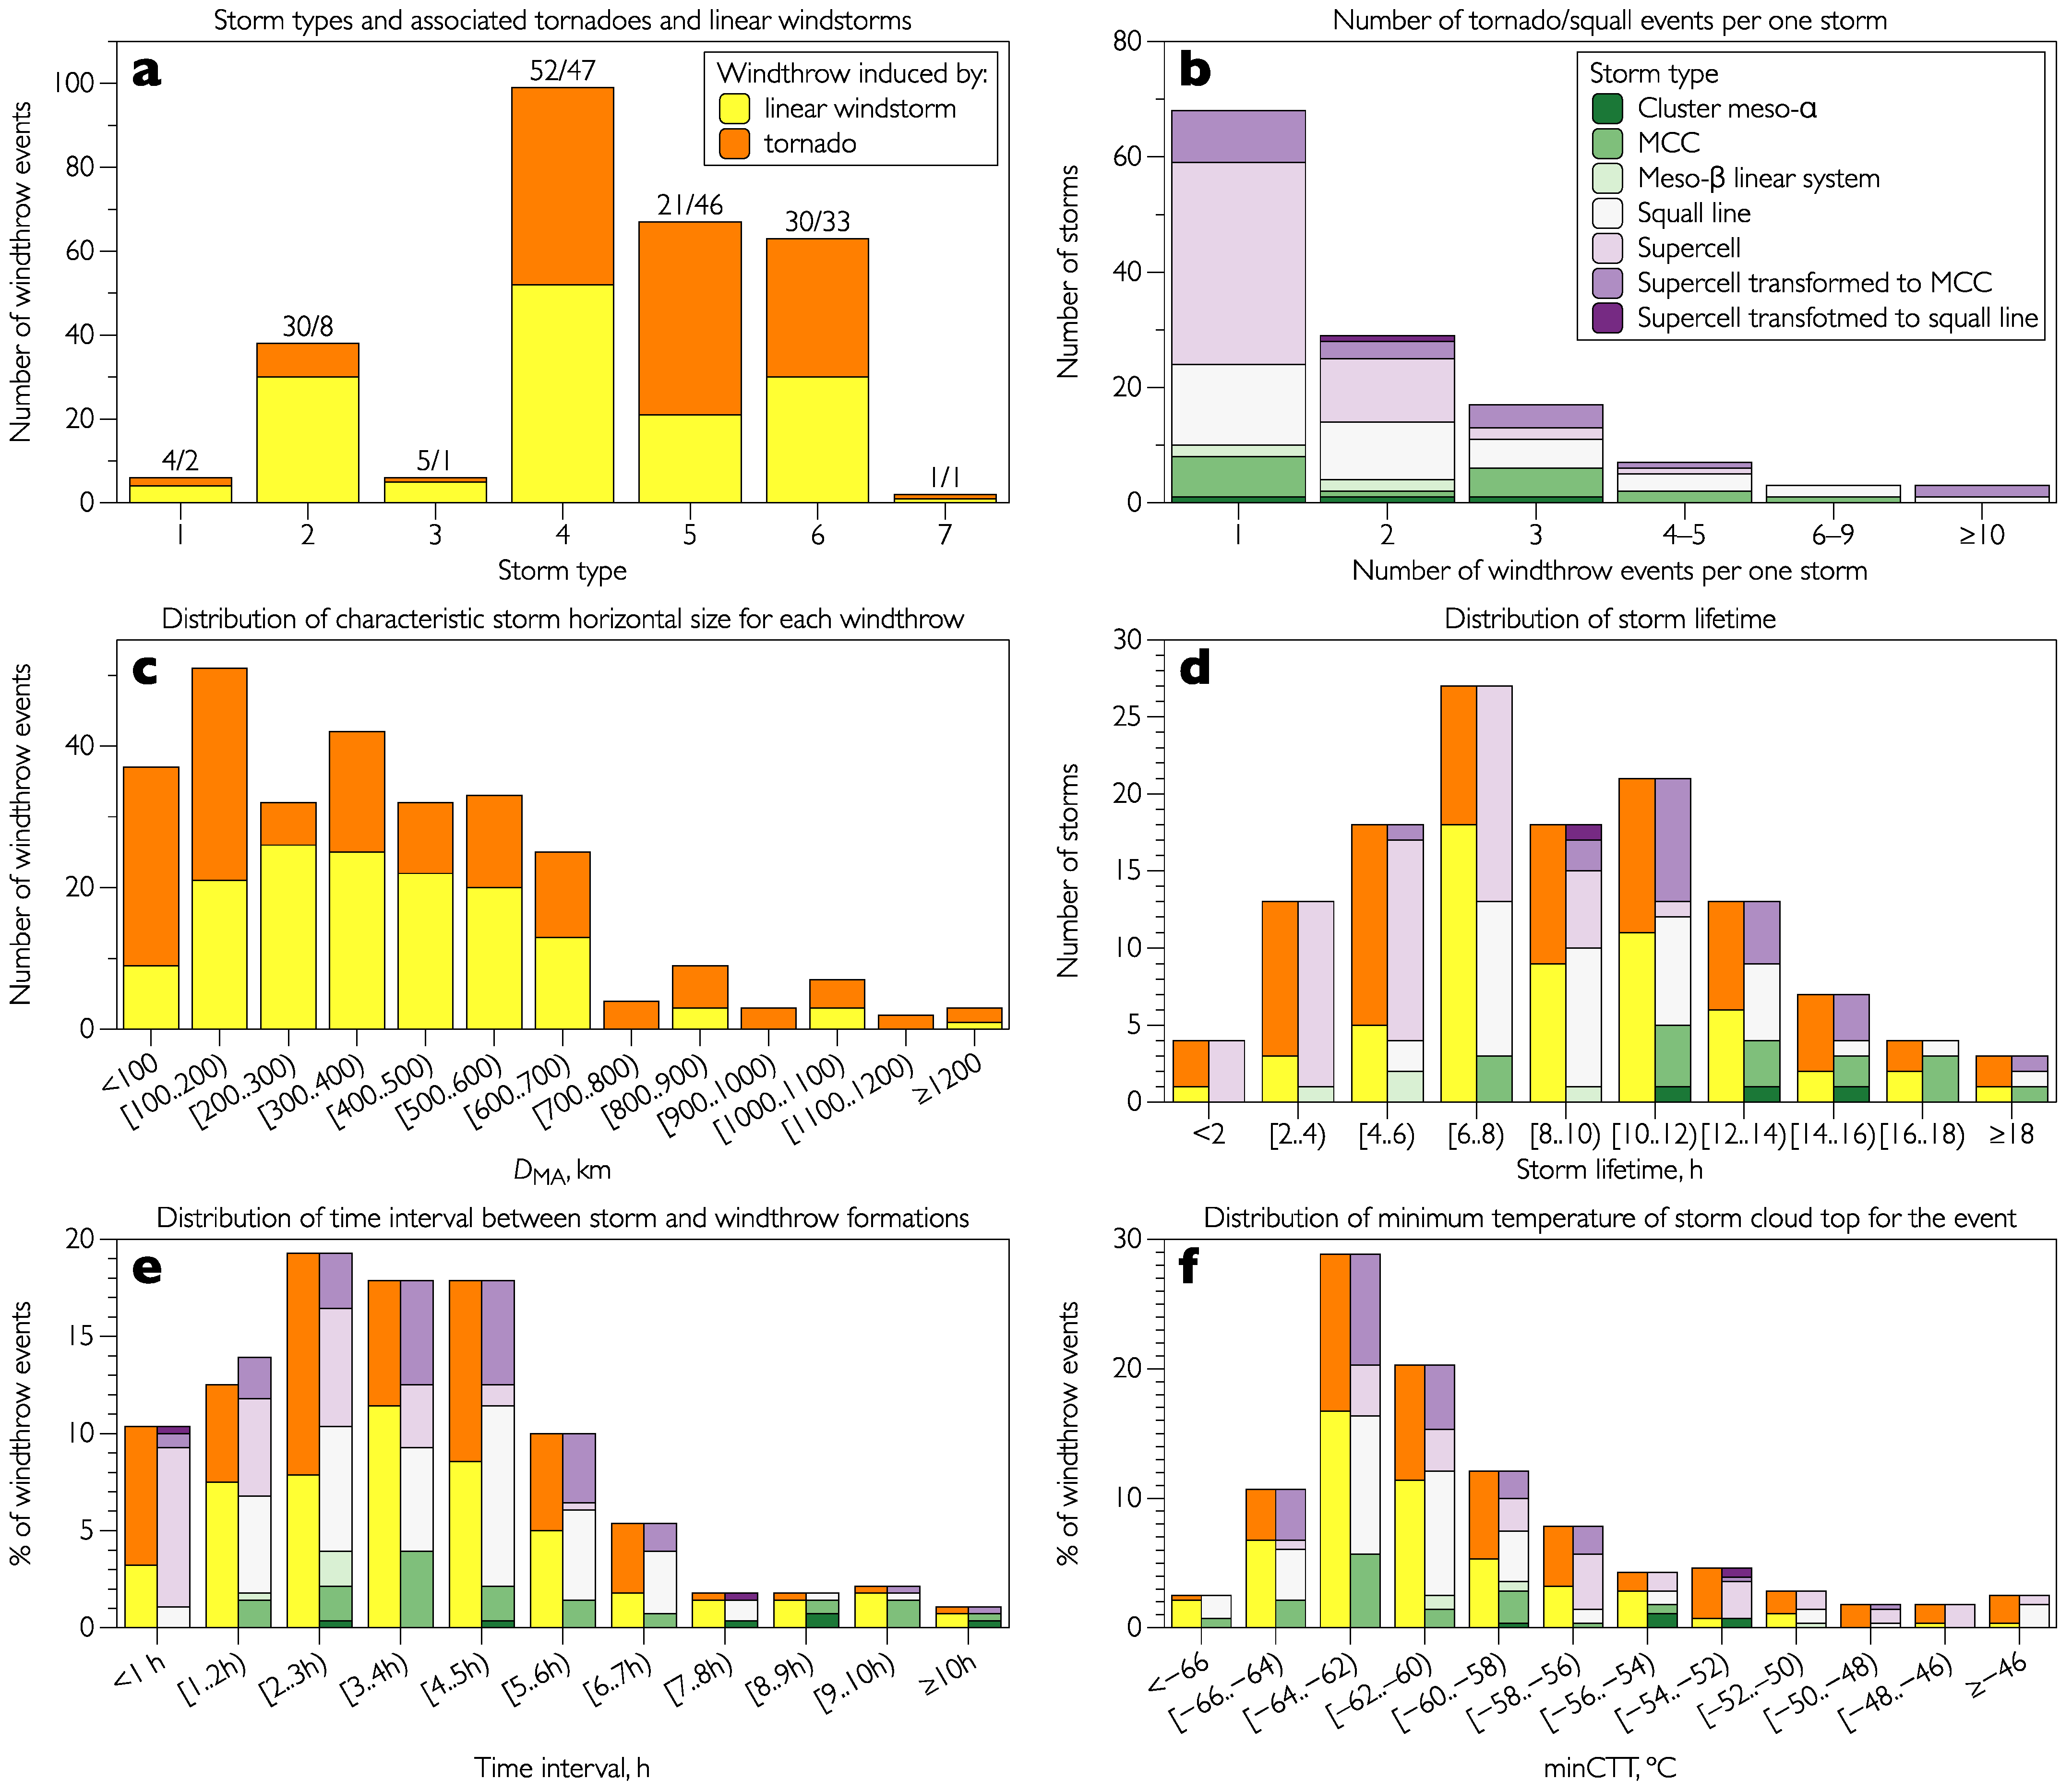
3.1.1. Satellite-Derived Characteristics of Convective Storms
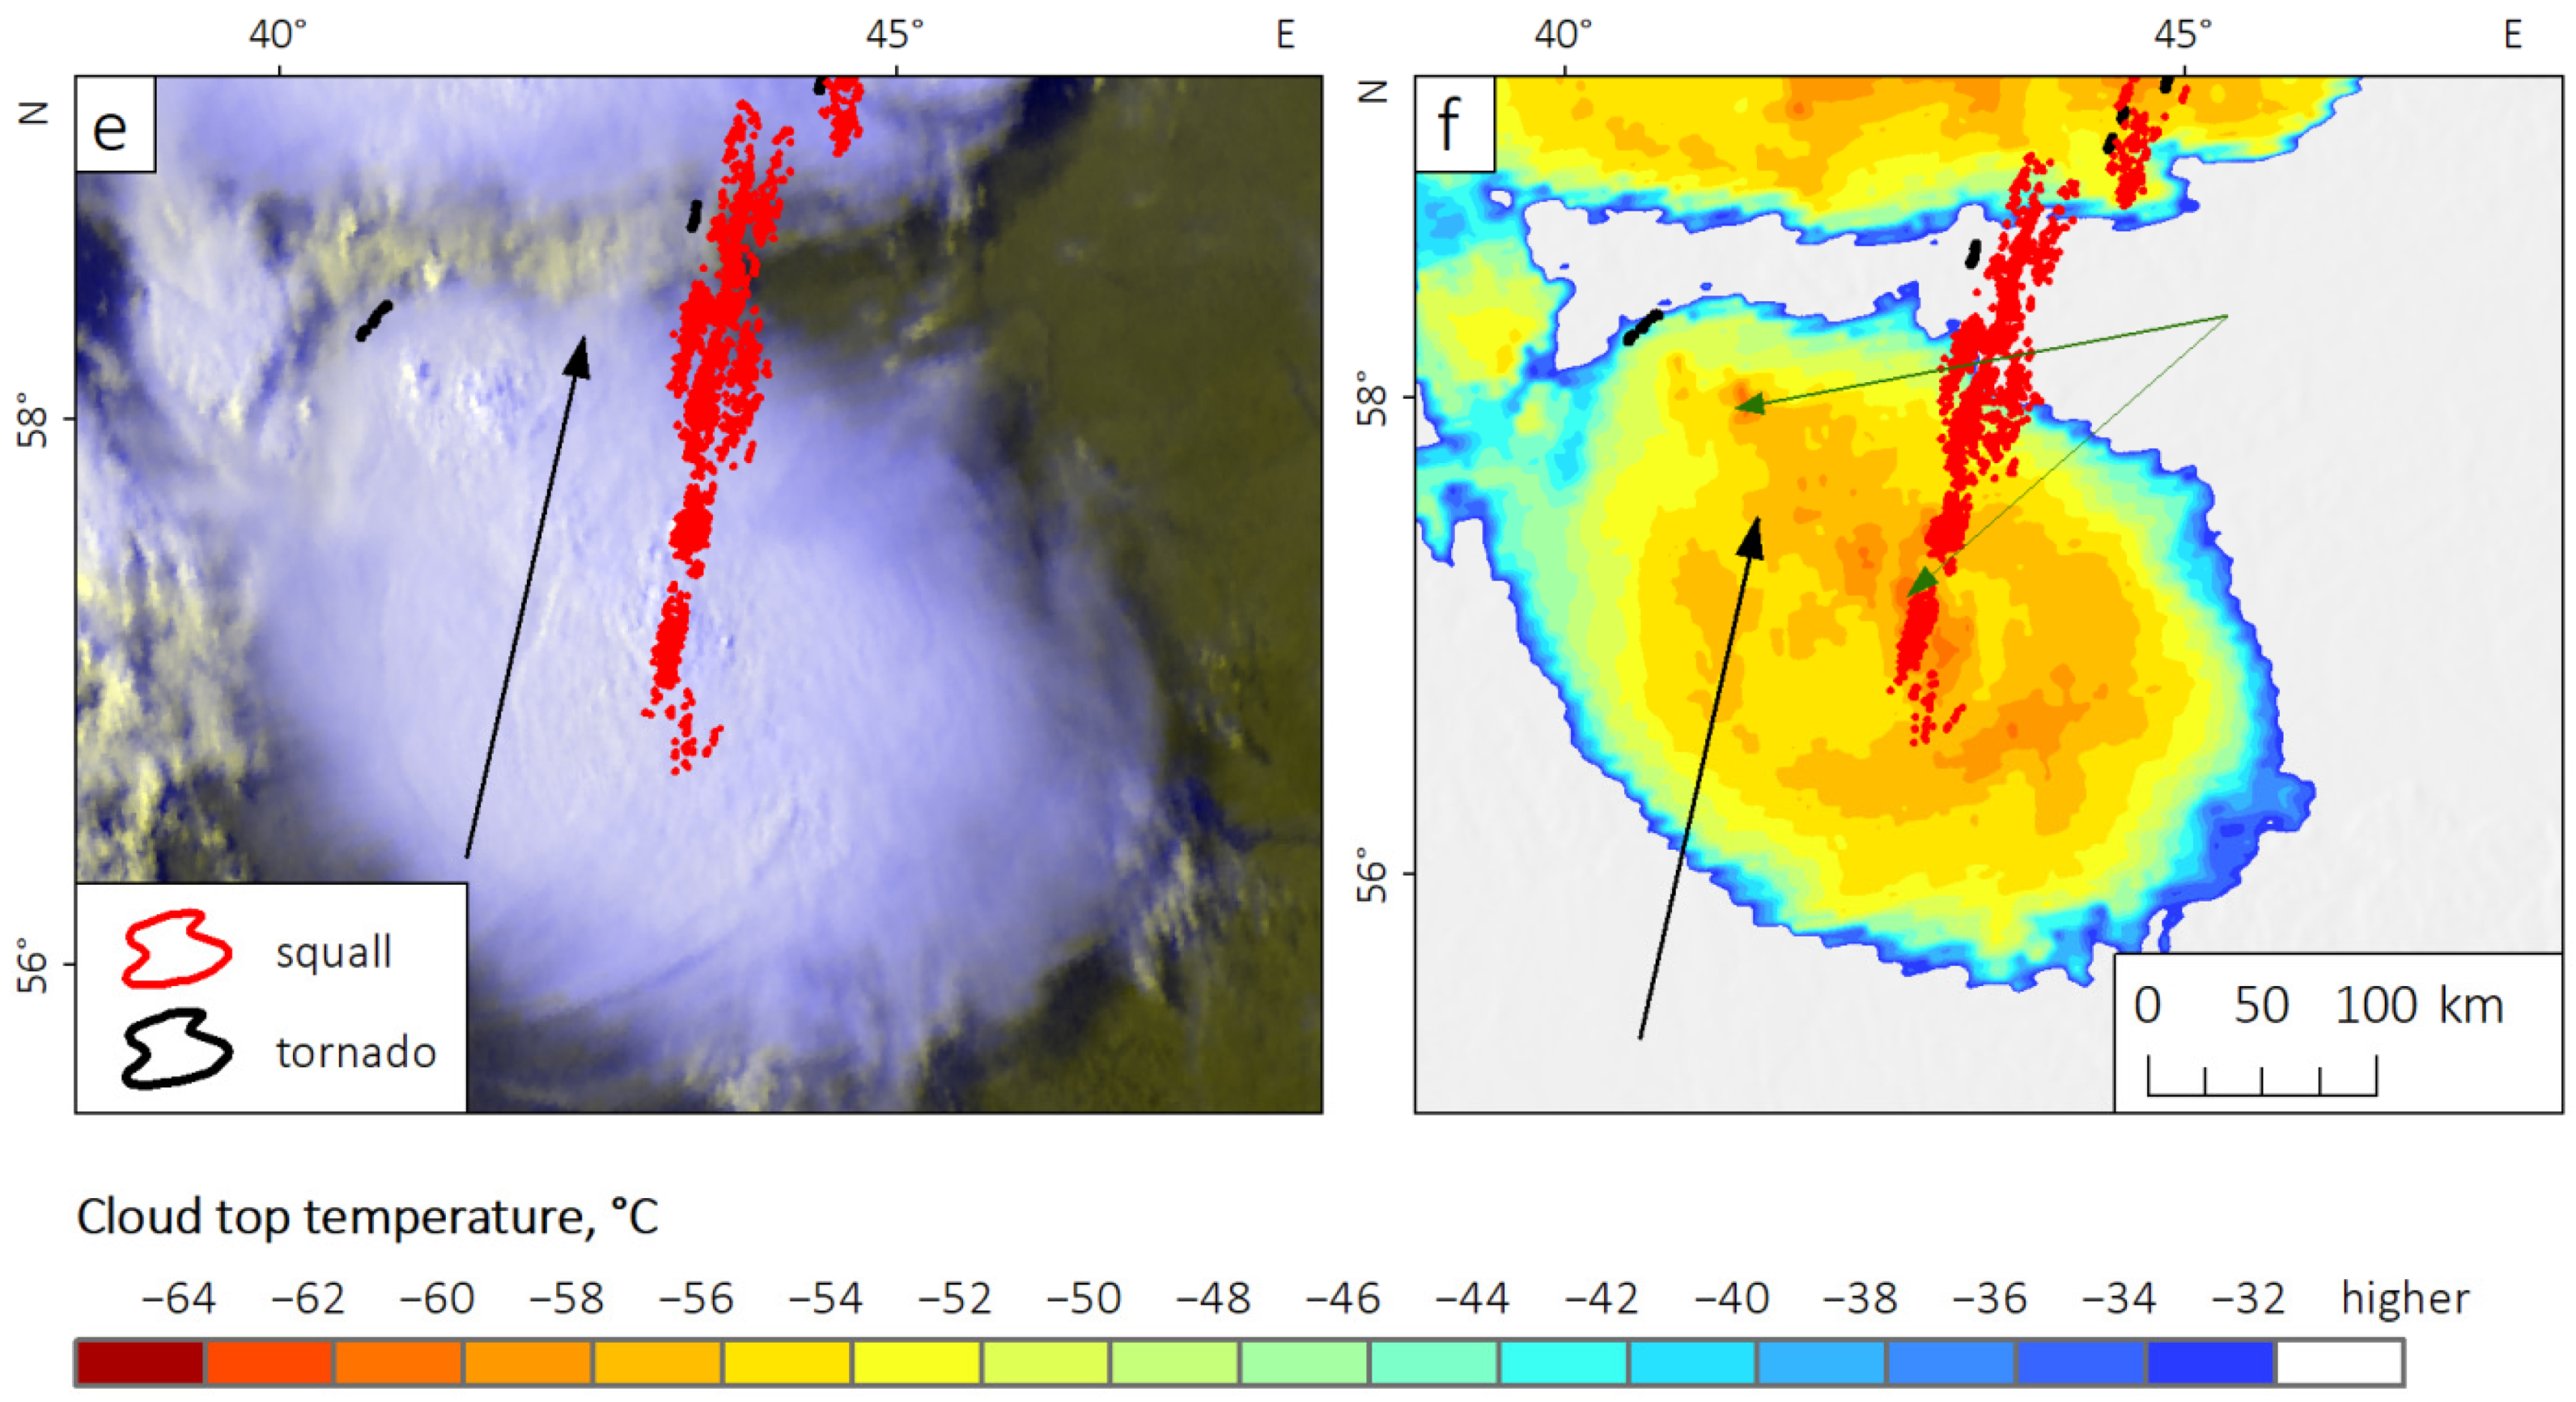
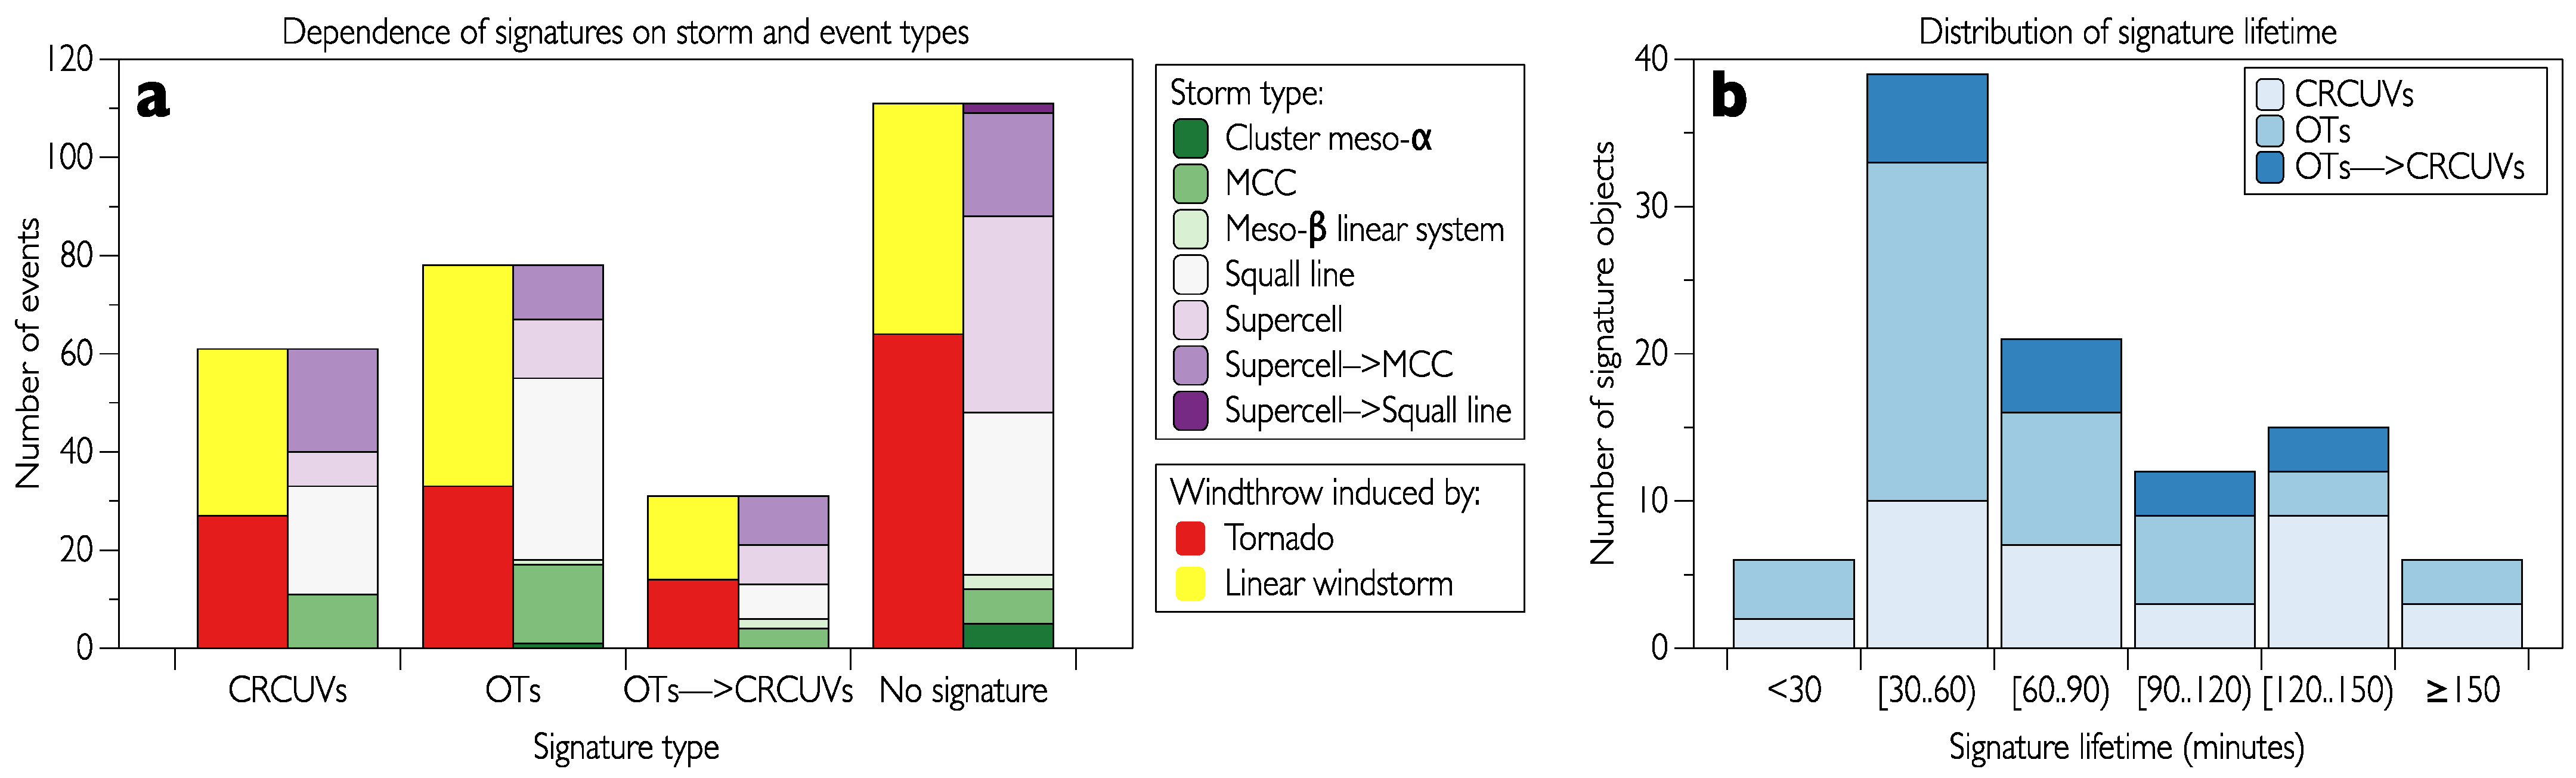
3.1.2. Signatures on the Cloud Tops
3.2. Analysis of Environmental Variables Differences for Various Events, Types of Storms, and Types of Signatures
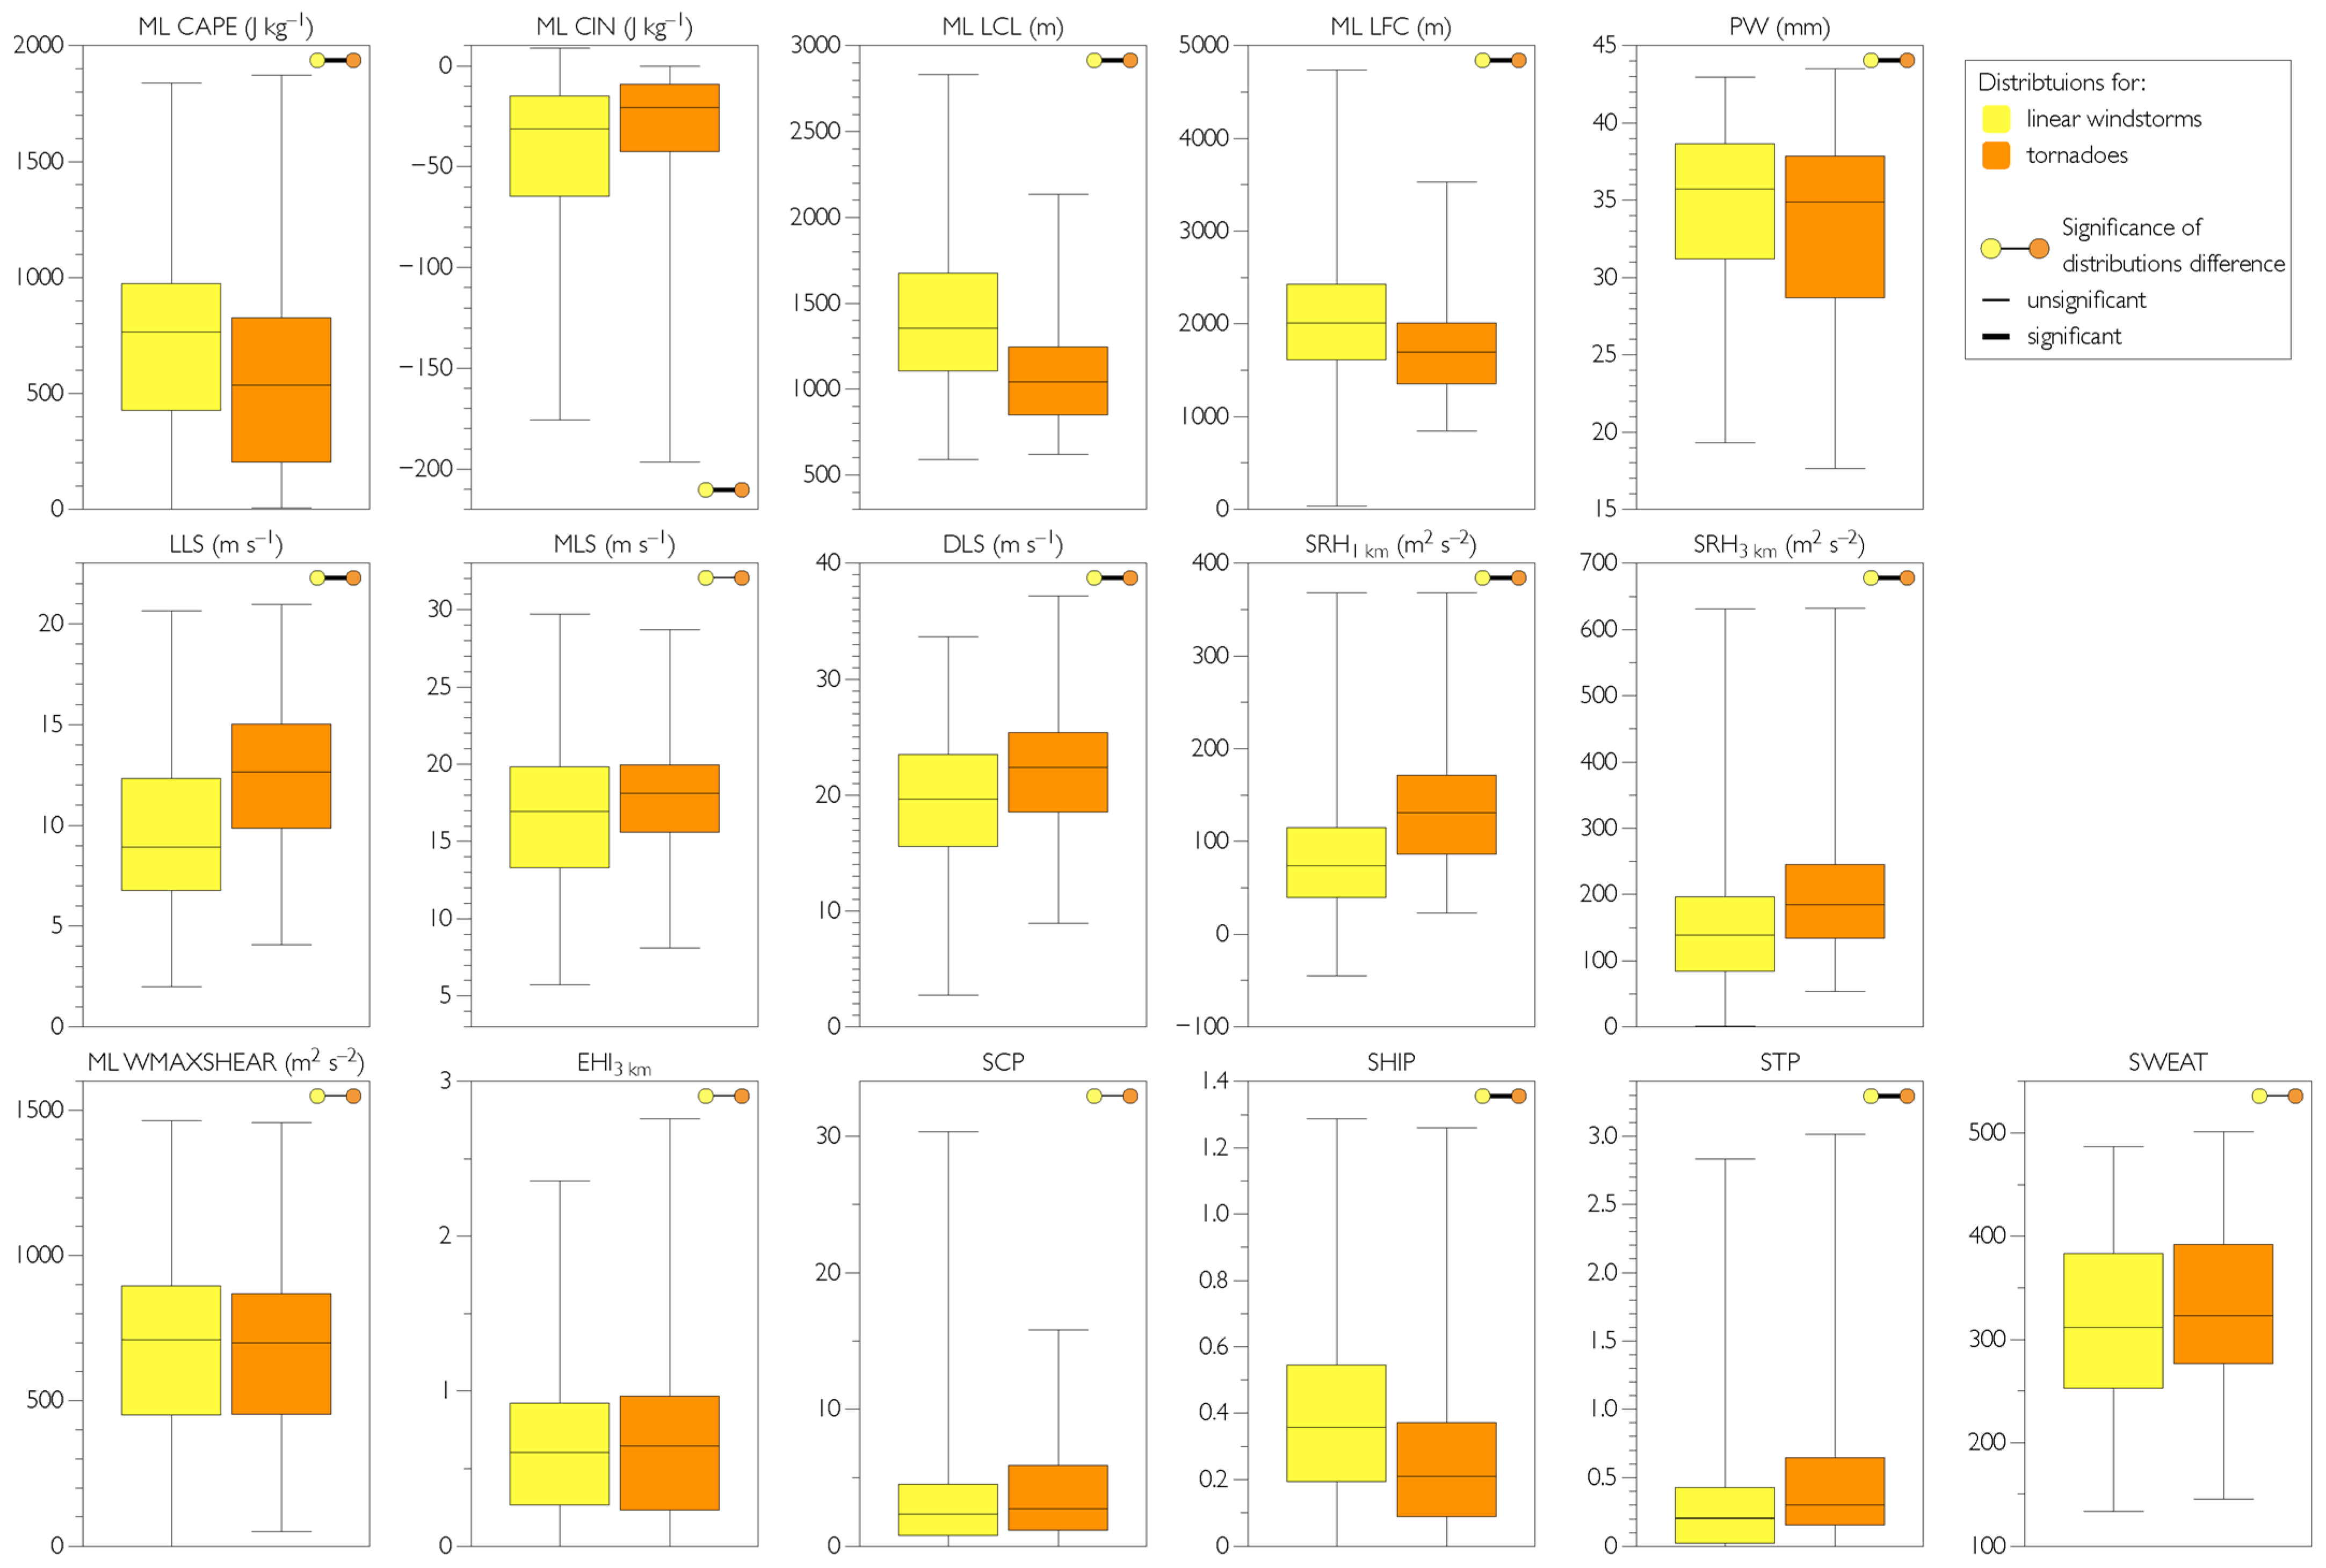
3.2.1. Differences in Convective Environmental Variables Associated with Linear Windstorms and Tornadoes
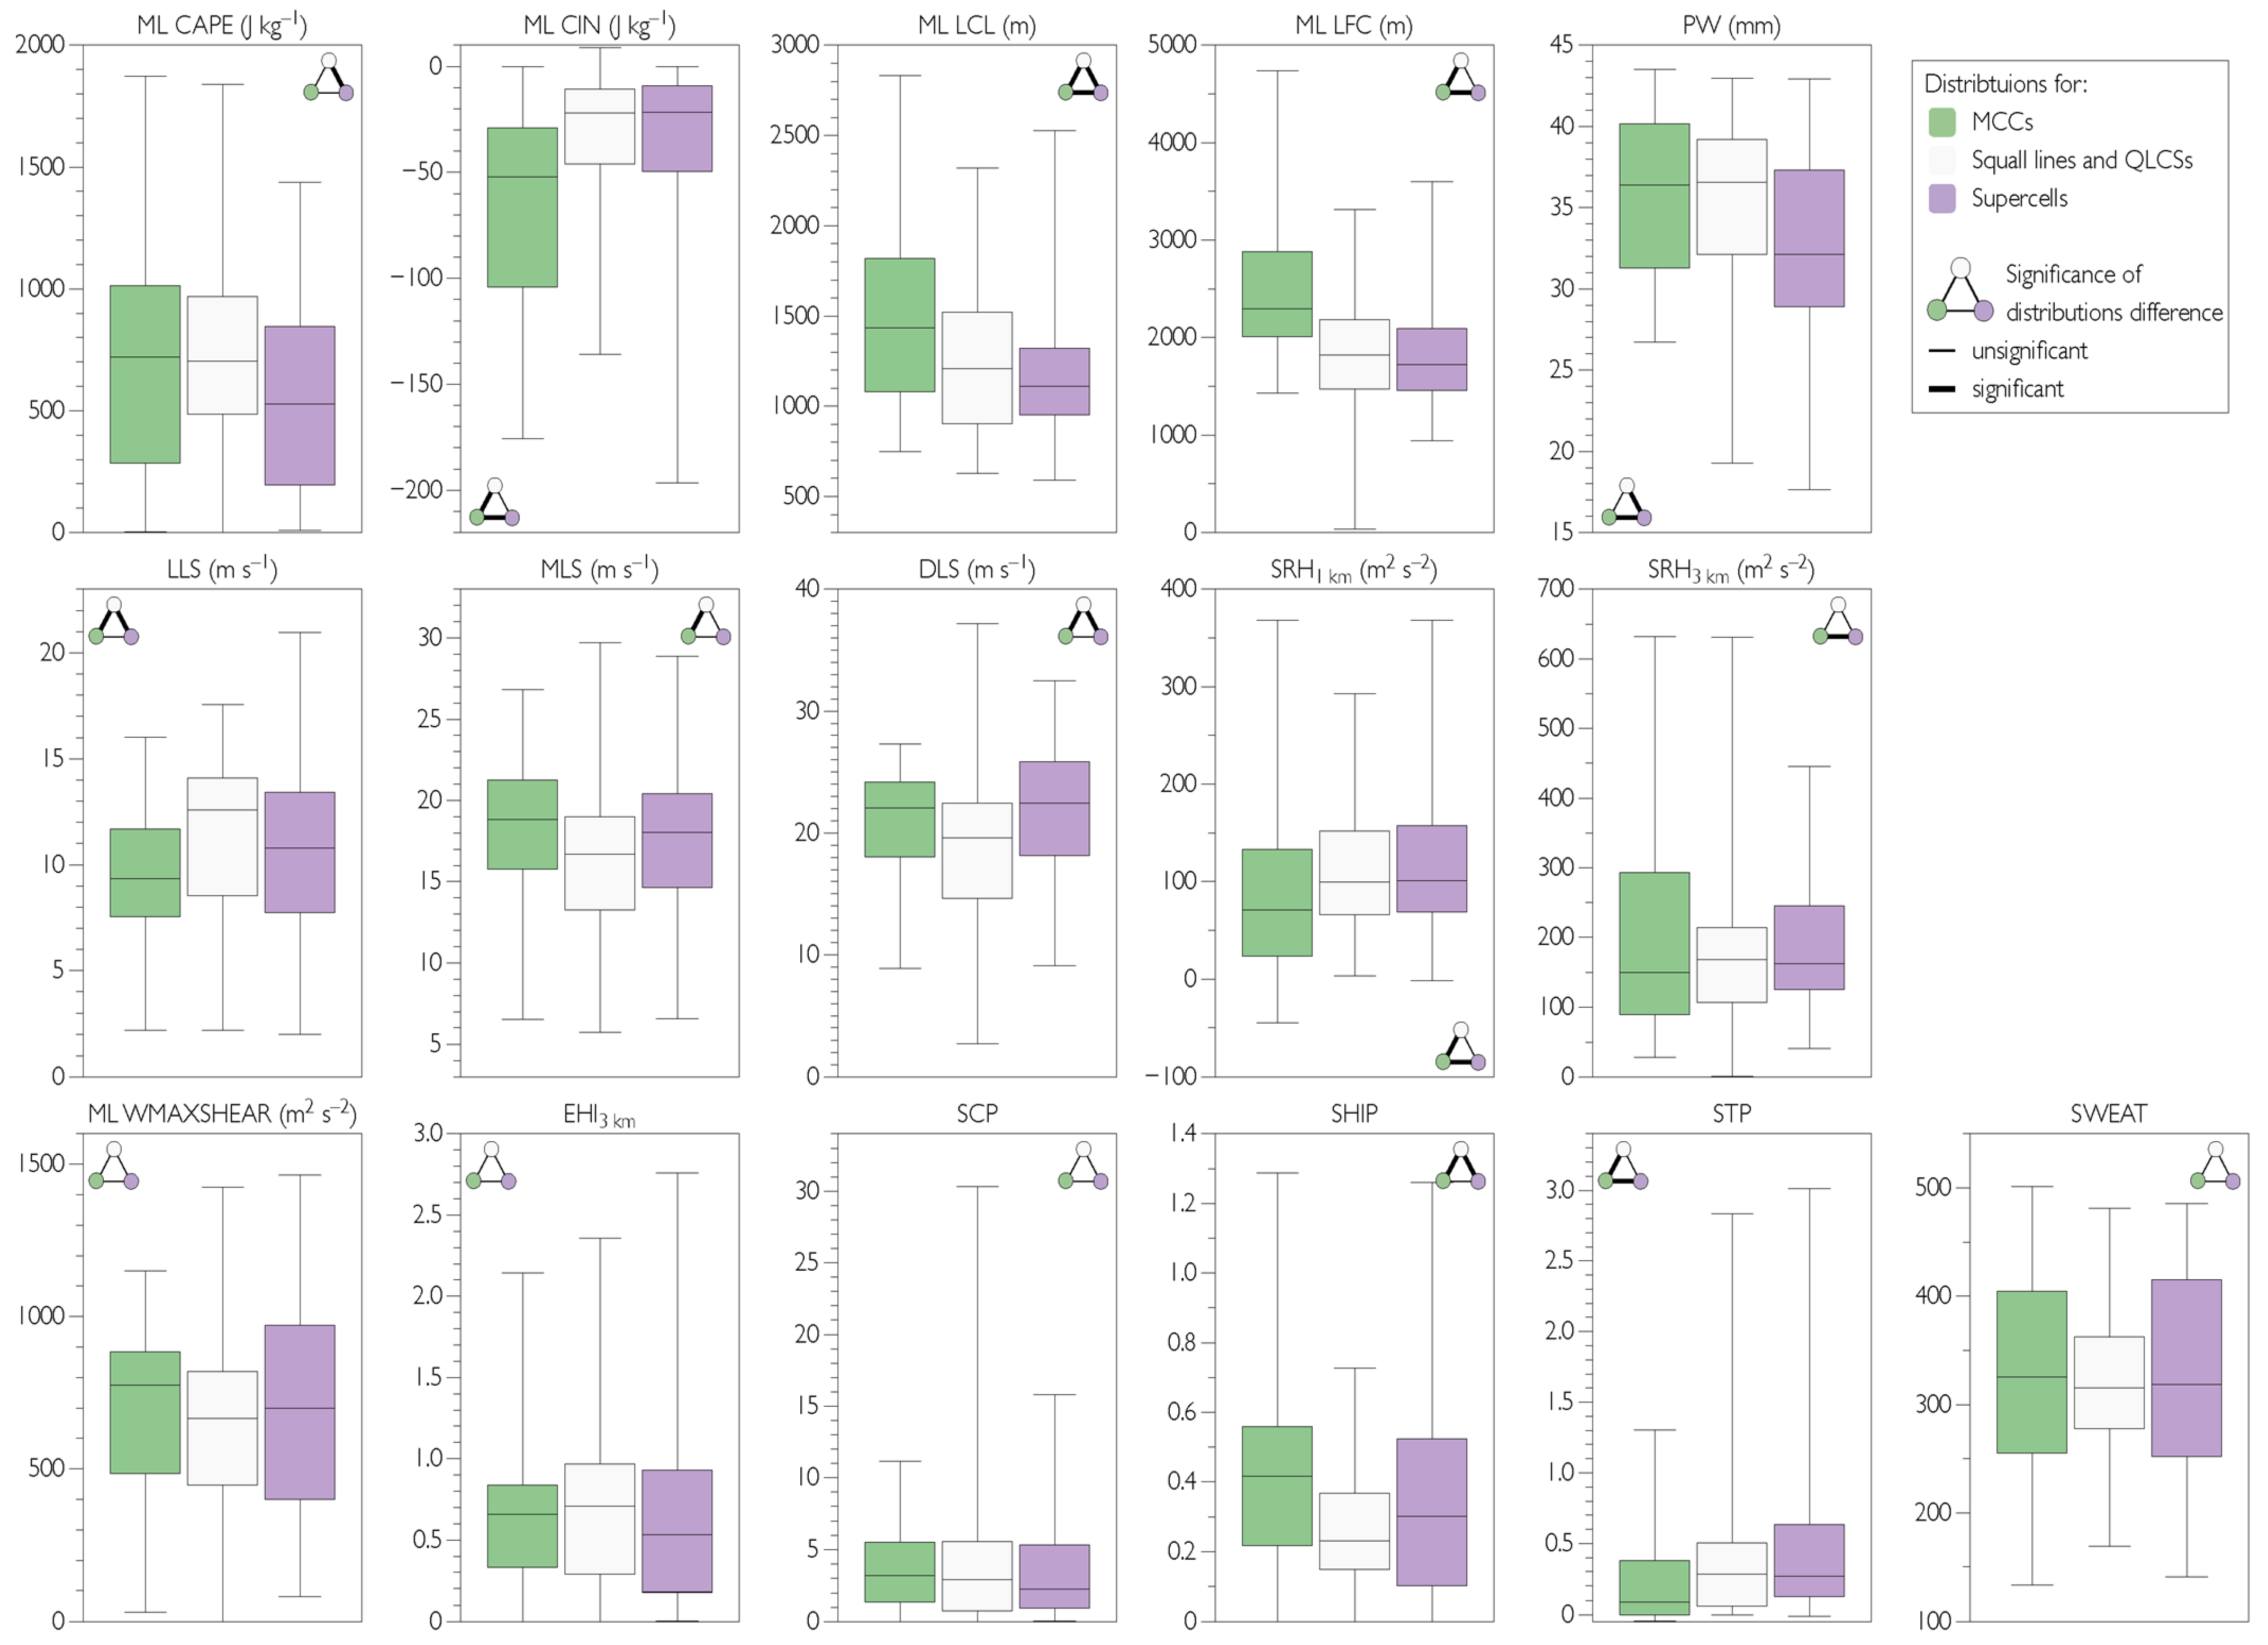
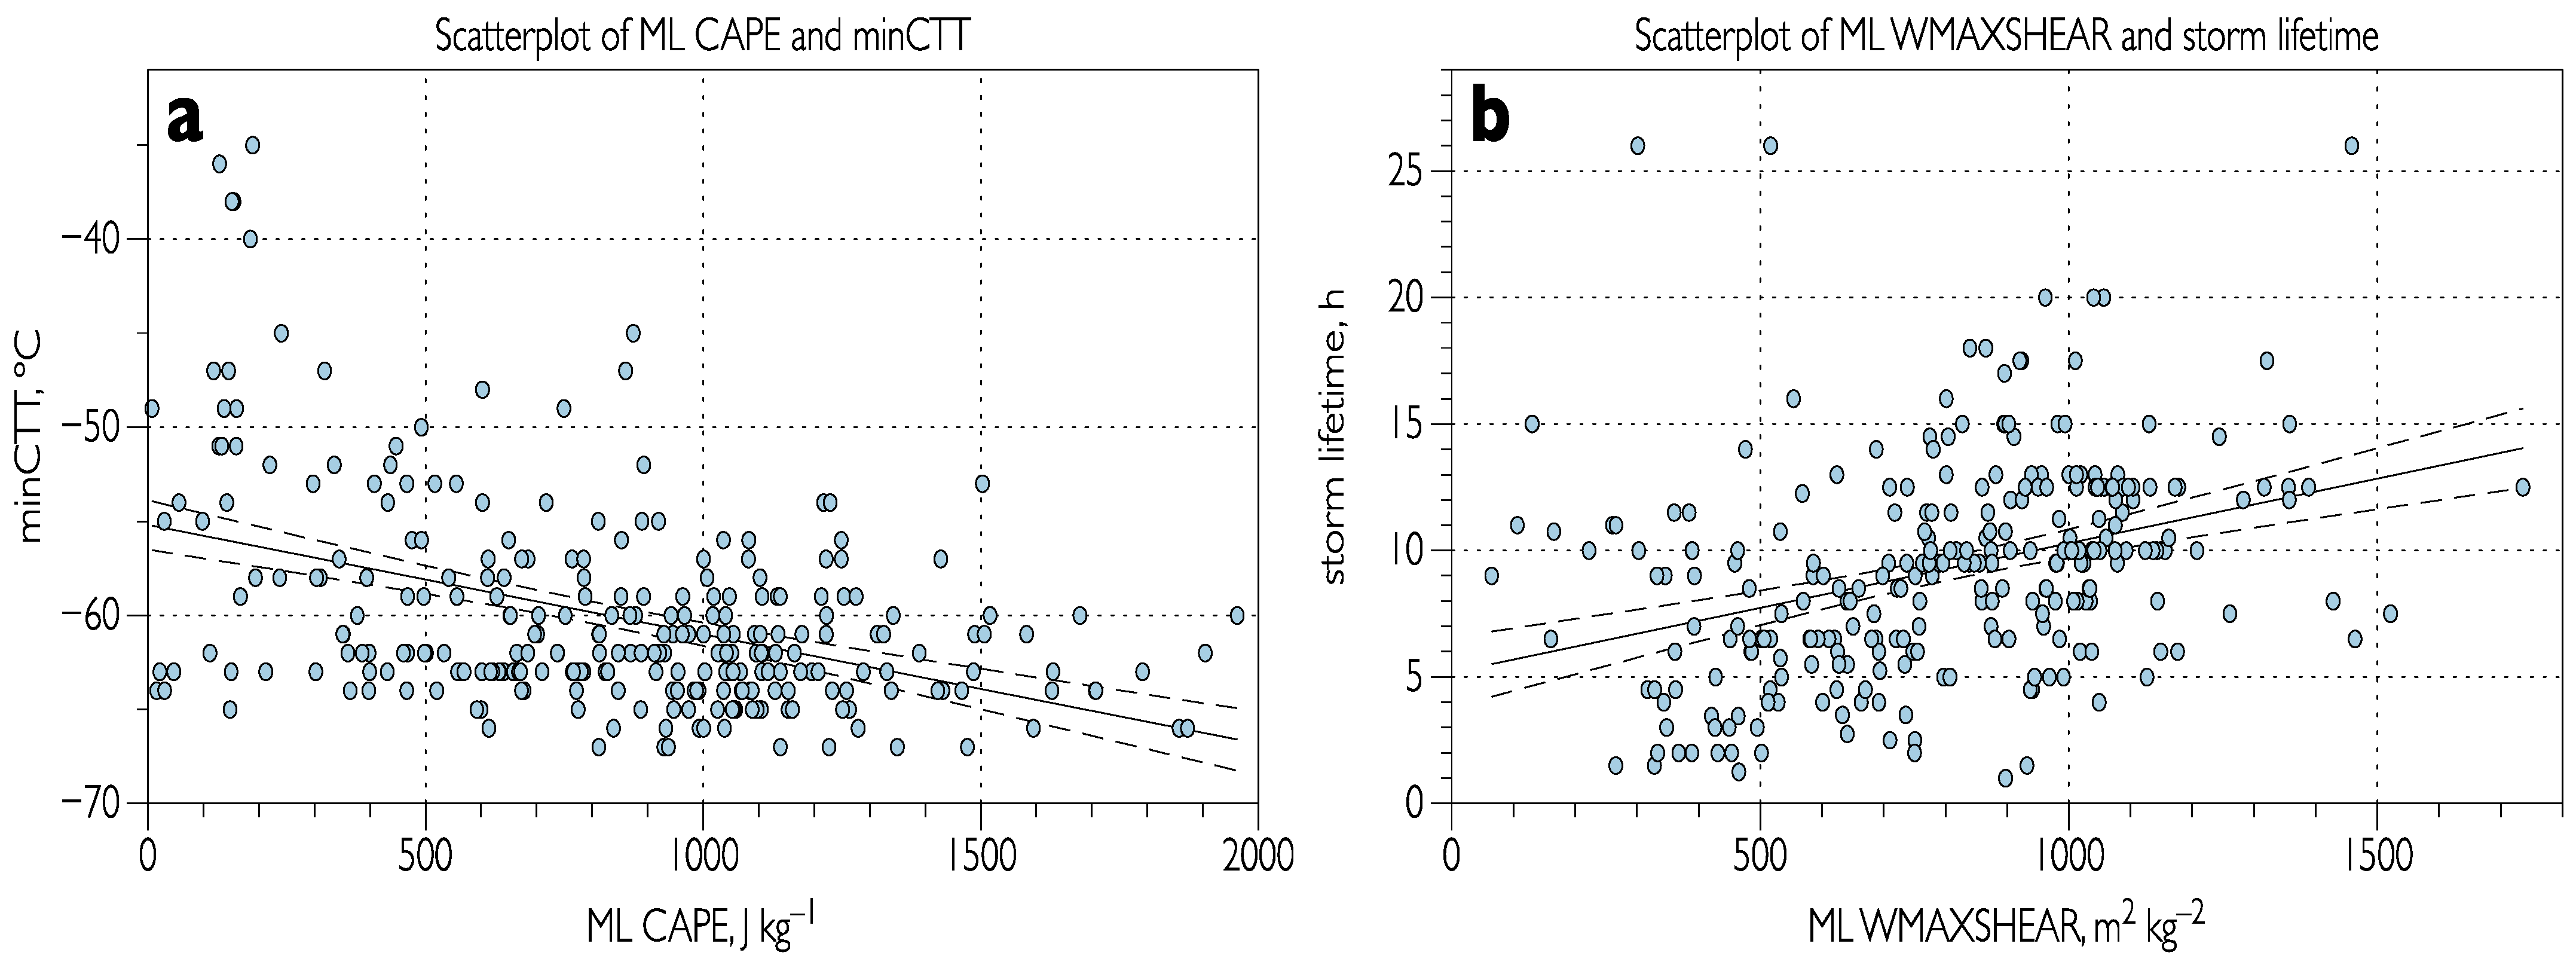
3.2.2. Dependence of Environmental Variables Associated with Types of Storms and Storm Characteristics
3.2.3. Links of Environmental Variables with Cloud-Top Signatures
4. Discussion and Concluding Remarks
Supplementary Materials
Author Contributions
Funding
Institutional Review Board Statement
Informed Consent Statement
Data Availability Statement
Acknowledgments
Conflicts of Interest
References
- Brooks, H.E.; Doswell, C.A., III; Zhang, X.; Chernokulsky, A.; Tochimoto, E.; Hanstrum, B.; Nascimento, E.; Sills, D.; Antonescu, B.; Barrett, B. A century of progress in severe convective storm research and forecasting. Meteorol. Monographs 2018, 59, 18.1–18.41. [Google Scholar] [CrossRef]
- Chernokulsky, A.; Kurgansky, M.; Mokhov, I.; Shikhov, A.; Azhigov, I.; Selezneva, E.; Zakharchenko, D.; Antonescu, B.; Kühne, T. Tornadoes in Northern Eurasia: From the Middle Age to the Information Era. Mon. Weather Rev. 2020, 148, 3081–3111. [Google Scholar] [CrossRef] [Green Version]
- Pacey, G.P.; Schultz, D.M.; Garcia-Carreras, L. Severe convective windstorms in Europe: Climatology, preconvective environments, and convective mode. Weather Forecast. 2021, 36, 237–252. [Google Scholar] [CrossRef]
- Chernokulsky, A.V.; Shikhov, A.N. 1984 Ivanovo tornado outbreak: Determination of actual tornado tracks with satellite data. Atmos. Res. 2018, 207, 111–121. [Google Scholar] [CrossRef]
- Blanchard, D.O. Mesoscale convective patterns of the southern High Plains. Bull. Am. Meteorol. Soc. 1990, 71, 994–1005. [Google Scholar] [CrossRef]
- Surowiecki, A.; Taszarek, M. A 10-Year Radar-Based Climatology of Mesoscale Convective System Archetypes and Derechos in Poland. Mon. Weather Rev. 2020, 148, 3471–3487. [Google Scholar] [CrossRef]
- Bedka, K. Overshooting cloud-top detections using MSG SEVIRI infrared brightness temperatures and their relationship to severe weather over Europe. Atmos. Res. 2011, 99, 175–189. [Google Scholar] [CrossRef]
- Marion, G.R.; Trapp, R.J.; Nesbitt, S.W. Using Overshooting Top Area to Discriminate Potential for Large, Intense Tornadoes. Geophys. Res. Lett. 2019, 46, 12520–12526. [Google Scholar] [CrossRef]
- Putsay, M.; Simon, A.; Szenyán, I.; Kerkmann, J.; Horváth, G. Case study of the 20 May 2008 tornadic storm in Hungary-Remote sensing features and NWP simulation. Atmos. Res. 2011, 100, 657–679. [Google Scholar] [CrossRef]
- Purdom, J. Some uses of high-resolution GOES imagery in mesoscale forecasting of convection and its behavior. Mon. Weather Rev. 1976, 104, 1474–1483. [Google Scholar] [CrossRef]
- Mills, P.; Astling, E. Detection of tropopause penetrations by intense convection with GOES enhanced infrared imagery. In Proceedings of the 10th Conference on Severe Local Storms, Omaha, NE, USA, 18–21 October 1977; pp. 61–64. [Google Scholar]
- Reynolds, D.W. Observations of damaging hailstorms from geosynchronous satellite digital data. Mon. Weather Rev. 1980, 108, 337–348. [Google Scholar] [CrossRef]
- Negri, A.J.; Adler, R.F. Relation of satellite-based thunderstorm intensity to radar-estimated rainfall. J. Appl. Meteorol. 1981, 20, 288–300. [Google Scholar] [CrossRef]
- Glickman, T. (Ed.) Gloss. Meteorology, 2nd ed.; American Meteorological Society: Boston, MA, USA, 2000; p. 855. [Google Scholar]
- Negri, A.J. Cloud-top structure of tornado storms on 10 April 1979 from rapid scan and stereo satellite observations. Bull. Am. Meteorol. Soc. 1982, 63, 1851–1859. [Google Scholar] [CrossRef] [Green Version]
- McCann, D.W. The enhanced-V: A satellite observable severe storm signature. Mon. Weather Rev. 1983, 111, 887–894. [Google Scholar] [CrossRef]
- Brunner, J.C.; Ackerman, S.A.; Bachmeier, A.S.; Rabin, R.M. A quantitative analysis of the enhanced-V feature in relation to severe weather. Weather Forecast. 2007, 22, 853–872. [Google Scholar] [CrossRef]
- Setvák, M.; Lindsey, D.T.; Novák, P.; Wang, P.K.; Radová, M.; Kerkmann, J.; Grasso, L.; Su, S.-H.; Rabin, R.M.; Šťástka, J.; et al. Satellite observed cold-ring-shaped features atop deep convective clouds. Atmos. Res. 2010, 97, 80–96. [Google Scholar] [CrossRef]
- Homeyer, C.R.; McAuliffe, J.D.; Bedka, K.M. On the development of above-anvil cirrus plumes in extratropical convection. J. Atmos. Sci. 2017, 74, 1617–1633. [Google Scholar] [CrossRef]
- Bedka, K.; Murillo, E.M.; Homeyer, C.R.; Scarino, B.; Mersiovsky, H. The above-anvil cirrus plume: An important severe weather indicator in visible and infrared satellite imagery. Weather Forecast. 2018, 33, 1159–1181. [Google Scholar] [CrossRef]
- Heymsfield, G.M.; Fulton, R.; Spinhirne, J.D. Aircraft overflight measurements of Midwest severe storms: Implications on geosynchronous satellite interpretations. Mon. Weather Rev. 1991, 119, 436–456. [Google Scholar] [CrossRef]
- Heymsfield, G.M.; Blackmer, R.H., Jr. Satellite-observed characteristics of Midwest severe thunderstorm anvils. Mon. Weather Rev. 1988, 116, 2200–2224. [Google Scholar] [CrossRef]
- Fujita, T.T. The Teton–Yellowstone tornado of 21 July 1987. Mon. Weather Rev. 1989, 117, 1913–1940. [Google Scholar] [CrossRef]
- Dworak, R.; Bedka, K.M.; Brunner, J.; Feltz, W. Comparison between GOES-12 overshooting top detections, WSR-88D radar reflectivity, and severe storm reports. Weather Forecast. 2012, 27, 684–699. [Google Scholar] [CrossRef] [Green Version]
- Brooks, H.E.; Lee, J.W.; Craven, J.P. The spatial distribution of severe thunderstorm and tornado environments from global reanalysis data. Atmos. Res. 2003, 67, 73–94. [Google Scholar] [CrossRef]
- Kunz, M. The skill of convective parameters and indices to predict isolated and severe thunderstorms. Nat. Hazards Earth Syst. Sci. 2007, 7, 327–342. [Google Scholar] [CrossRef] [Green Version]
- Taszarek, M.; Allen, J.T.; Púcik, T.; Hoogewind, K.A.; Brooks, H.E. Severe convective storms across Europe and the United States. Part II: ERA5 environments associated with lightning, large hail, severe wind, and tornadoes. J. Clim. 2020, 33, 10263–10286. [Google Scholar] [CrossRef]
- Taszarek, M.; Brooks, H.E.; Czernecki, B. Sounding-derived parameters associated with convective hazards in Europe. Mon. Weather Rev. 2017, 145, 1511–1528. [Google Scholar] [CrossRef]
- Pilguj, N.; Taszarek, M.; Kryza, M.; Brooks, H.E. Reconstruction of Violent Tornado Environments in Europe: High-Resolution Dynamical Downscaling of ERA5. Geophys. Res. Lett. 2022, 49, e2022GL098242. [Google Scholar] [CrossRef]
- Rodríguez, O.; Bech, J. Tornadic environments in the Iberian Peninsula and the Balearic Islands based on ERA5 reanalysis. Int. J. Climatol. 2021, 41, E1959–E1979. [Google Scholar] [CrossRef]
- Avolio, E.; Miglietta, M.M. Tornadoes in the Tyrrhenian regions of the Italian peninsula: The case study of 28 July 2019. Atmos. Res. 2022, 278, 106285. [Google Scholar] [CrossRef]
- Chernokulsky, A.; Shikhov, A.; Bykov, A.; Kalinin, N.; Kurgansky, M.; Sherstyukov, B.; Yarinich, Y. Diagnosis and modelling of two destructive derecho events in European Russia in the summer of 2010. Atmos. Res. 2022, 267, 105928. [Google Scholar] [CrossRef]
- Chernokulsky, A.V.; Eliseev, A.V.; Kozlov, F.A.; Korshunova, N.N.; Kurgansky, M.V.; Mokhov, I.I.; Semenov, V.A.; Shvets’, N.V.; Shikhov, A.N.; Yarinich, Y.I. Atmospheric severe convective events in Russia: Changes observed from different data. Russ. Meteorol. Hydrol. 2022, 47, 343–354. [Google Scholar] [CrossRef]
- Chernokulsky, A.V.; Shikhov, A.N.; Azhigov, I.O.; Eroshkina, N.A.; Korenev, D.P.; Bykov, A.V.; Kalinin, N.A.; Kurgansky, M.V.; Pavlyukov, Y.B.; Sprygin, A.A.; et al. Squalls and Tornadoes in the European Part of Russia on 15 May 2021: Diagnostics and Modeling. Russ. Meteorol. Hydrol. 2022, in press. [Google Scholar]
- Hersbach, H.; Bell, B.; Berrisford, P.; Hirahara, S.; Horányi, A.; Muñoz-Sabater, J.; Nicolas, J.; Peubey, C.; Radu, R.; Schepers, D.; et al. The ERA5 global reanalysis. Q. J. R. Meteorol. Soc. 2020, 146, 1999–2049. [Google Scholar] [CrossRef]
- Coffer, B.E.; Taszarek, M.; Parker, M.D. Near-ground wind profiles of tornadic and nontornadic environments in the United States and Europe from ERA5 reanalyses. Weather Forecast. 2020, 35, 2621–2638. [Google Scholar] [CrossRef]
- Punge, H.J.; Bedka, K.M.; Kunz, M.; Reinbold, A. Hail frequency estimation across Europe based on a combination of overshooting top detections and the ERA-INTERIM reanalysis. Atmos. Res. 2017, 198, 34–43. [Google Scholar] [CrossRef]
- Bukharov, M.V.; Kukharskii, A.V.; Misnik, L.A. Automated work place “Planeta-Meteoobzor” for monitoring hazardous weather associated with convective clouds. Russ. Meteorol. Hydrol. 2008, 33, 102–105. [Google Scholar] [CrossRef]
- Volkova, E.V.; Uspensky, A.B.; Kukharsky, A.V. Specialized complex of programs for retrieving and validating satellite estimates of cloud and precipitation. Sovrem. Probl. Distantsionnogo Zondirovaniya Zemli Iz Kosm. 2015, 12, 7–26. (In Russian) [Google Scholar]
- Klaes, K.D.; Holmlund, K. An update on EUMETSAT programmes and plans. In Proceedings of the SPIE Optical Engineering + Applications, San Diego, CA, USA, 9–13 August 2015. [Google Scholar] [CrossRef]
- Shikhov, A.N.; Chernokulsky, A.V.; Sprygin, A.A.; Azhigov, I.O. Identification of mesoscale convective cloud systems with tornadoes using satellite data. Sovrem. Probl. Distantsionnogo Zondirovaniya Zemli Iz Kosm. 2019, 16, 223–236. (In Russian) [Google Scholar] [CrossRef]
- Sprygin, A.A. Parameters of long-lived severe convective structures in the European part of Russia and neighboring territories and the possibility to unify their forecast. Hydrometeorol. Stud. Forecast. 2020, 375, 21–47. (In Russian) [Google Scholar] [CrossRef]
- Chernokulsky, A.; Shikhov, A.; Bykov, A.; Azhigov, I. Satellite-based Study and Numerical Forecasting of Two Tornado Outbreaks in the Ural Region in June 2017. Atmosphere 2020, 11, 1146. [Google Scholar] [CrossRef]
- Chernokulsky, A.V.; Kurgansky, M.V.; Mokhov, I.I.; Shikhov, A.N.; Azhigov, I.O.; Selezneva, E.V.; Zakharchenko, D.I.; Antonescu, B.; Kuhne, T. Tornadoes in the Russian Regions. Russ. Meteorol. Hydrol. 2021, 46, 69–82. [Google Scholar] [CrossRef]
- Shikhov, A.N.; Chernokulsky, A.V.; Azhigov, I.O.; Semakina, A.V. A satellite-derived database for stand-replacing windthrow events in boreal forests of European Russia in 1986–2017. Earth Syst. Sci. Data 2020, 12, 3489–3513. [Google Scholar] [CrossRef]
- Shikhov, A.N.; Chernokulsky, A.V.; Azhigov, I.O. Spatio-temporal distribution and origins of windthrow events in the forest zone of Western Siberia in 2001–2020. Sovrem. Probl. Distantsionnogo Zondirovaniya Zemli Iz Kosm. 2022, 19, 186–202. (In Russian) [Google Scholar] [CrossRef]
- Hansen, M.C.; Potapov, P.V.; Moore, R.; Hancher, M.; Turubanova, S.A.; Tyukavina, A.; Thau, D.; Stehman, S.V.; Goetz, S.J.; Loveland, T.R.; et al. High-Resolution Global Maps of 21st-Century Forest Cover Change. Science 2013, 342, 850–853. [Google Scholar] [CrossRef] [PubMed] [Green Version]
- Wind Science and Engineering Center (WSEC). A Recommendation for an Enhanced Fujita Scale (EFscale). 2006. Available online: https://www.spc.noaa.gov/faq/tornado/EFScale.pdf (accessed on 31 August 2022).
- The International Fujita (IF) Scale. Tornado and Wind Damage Assessment Guide. Draft Version 0.1 of 15 October 2018. Available online: https://www.essl.org/media/publications/IF-scale_v0.10.pdf (accessed on 31 August 2022).
- Groenemeijer, P.; Púčik, T.; Holzer, A.M.; Antonescu, B.; Riemann-Campe, K.; Schultz, D.M.; Kühne, T.; Feuerstein, B.; Brooks, H.E.; Doswell, C.A.; et al. Severe convective storms in Europe: Ten years of research and education at the European Severe Storms Laboratory. Bull Am. Meteorol. Soc. 2017, 98, 2641–2651. [Google Scholar] [CrossRef]
- EUMETSAT Earth Observation Portal. Available online: https://eoportal.eumetsat.int/userMgmt/login.faces (accessed on 31 August 2022).
- SEVIRI HRV Cloud RGB Quick Guide. Available online: https://www-cdn.eumetsat.int/files/2020-04/pdf_rgb_quick_guide_hrv_cloud.pdf (accessed on 31 August 2022).
- Radová, M.; Seidl, J. Parallax applications when comparing radar and satellite data. In Proceedings of the 2008 EUMETSAT Meteorological Satellite Conference, Darmstadt, Germany, 8–12 September 2008; p. 52, ISBN 978-92-9110-082-8. [Google Scholar]
- Orlanski, I. A rational subdivision of scales for atmospheric processes. Bull. Am. Meteorol. Soc. 1975, 56, 527–530. [Google Scholar]
- Maddox, R.A. Mesoscale convective complexes. Bull. Am. Meteorol. Soc. 1980, 61, 1374–1387. [Google Scholar] [CrossRef]
- National Severe Storms Laboratory. Thunderstorm Types. Available online: https://www.nssl.noaa.gov/education/svrwx101/thunderstorms/types/ (accessed on 7 July 2021).
- NWS. National Weather Service. What Is a Supercell? 2021. Available online: https://www.weather.gov/ama/supercell. (accessed on 31 August 2022).
- Apke, J.M.; Mecikalski, J.R.; Jewett, C.P. Analysis of Mesoscale Atmospheric Flows above Mature Deep Convection Using Super Rapid Scan Geostationary Satellite Data. J. Appl. Meteorol. Climatol. 2016, 55, 1859–1887. [Google Scholar] [CrossRef]
- Levizzani, V.; Setvák, M. Multispectral, High-Resolution Satellite Observations of Plumes on Top of Convective Storms. J. Atmos. Sci. 1996, 53, 361–369. [Google Scholar] [CrossRef]
- Weaver, J.; Knaff, J.; Bikos, D.; Wade, G.; Daniels, J. Satellite Observations of a Severe Supercell Thunderstorm on 24 July 2000 Made during the GOES-11 Science Test. Weather Forecast. 2002, 17, 124–138. [Google Scholar] [CrossRef]
- Mikuš, P.; Strelec Mahović, N. Satellite-based overshooting top detection methods and an analysis of correlated weather conditions. Atmos. Res. 2013, 123, 268–280. [Google Scholar] [CrossRef]
- Adler, R.F.; Markus, M.M.; Fenn, D.D. Detection of severe Midwest thunderstorms using geosynchronous satellite data. Mon. Weather Rev. 1985, 113, 769–781. [Google Scholar] [CrossRef]
- Schmetz, J.; Tjemkes, S.A.; Gube, M.; van de Berg, L. Monitoring deep convection and convective overshooting with METEOSAT. Adv. Space Res. 1997, 19, 433–441. [Google Scholar] [CrossRef]
- Bedka, K.M.; Brunner, J.; Dworak, R.; Feltz, W.; Otkin, J.; Greenwald, T. Objective satellite-based overshooting top detection using infrared window channel brightness temperature gradients. J. Appl. Meteorol. Climatol. 2010, 49, 181–202. [Google Scholar] [CrossRef]
- Kim, M.; Im, J.; Park, H.; Park, S.; Lee, M.-I.; Ahn, M.-H. Detection of tropical overshooting cloud tops using himawari-8 imagery. Remote Sens. 2017, 9, 685. [Google Scholar] [CrossRef] [Green Version]
- Lee, J.; Kim, M.; Im, J.; Han, H.; Han, D. Pre-trained feature aggregated deep learning-based monitoring of overshooting tops using multi-spectral channels of GeoKompsat-2A advanced meteorological imagery. GIScience Remote Sens. 2021, 58, 1052–1071. [Google Scholar] [CrossRef]
- Wang, G.; Wang, H.; Zhuang, Y.; Wu, Q.; Chen, S.; Kang, H. Tropical overshooting cloud-top height retrieval from himawari-8 imagery based on random forest model. Atmosphere 2021, 12, 173. [Google Scholar] [CrossRef]
- Kim, M.; Lee, J.; Im, J. Deep learning-based monitoring of overshooting cloud tops from geostationary satellite data. GIScience Remote Sens. 2018, 55, 763–792. [Google Scholar] [CrossRef]
- Cintineo, J.L.; Pavolonis, M.J.; Sieglaff, J.M.; Wimmers, A.; Brunner, J.; Bellon, W. A deep-learning model for automated detection of intense midlatitude convection using geostationary satellite images. Weather Forecast. 2020, 35, 2567–2588. [Google Scholar] [CrossRef]
- Proud, S.R. Analysis of overshooting top detections by Meteosat Second Generation: A 5-year dataset. Q. J. R. Meteorol. Soc. 2015, 141, 909–915. [Google Scholar] [CrossRef]
- Punge, H.; Bedka, K.; Kunz, M.; Werner, A. A new physically based stochastic event catalog for hail in Europe. Nat. Hazards 2014, 73, 1625–1645. [Google Scholar] [CrossRef]
- Taszarek, M.; Pilguj, N.; Allen, J.T.; Gensini, V.; Brooks, H.E.; Szuster, P. Comparison of Convective Parameters Derived from ERA5 and MERRA-2 with Rawinsonde Data over Europe and North America. J. Clim. 2021, 34, 3211–3237. [Google Scholar] [CrossRef]
- Potvin, C.K.; Elmore, K.L.; Weiss, S.J. Assessing the impacts of proximity sounding criteria on the climatology of significant tornado environments. Weather Forecast. 2010, 25, 921–930. [Google Scholar] [CrossRef]
- Marion, G.R.; Trapp, R.J. Controls of Quasi-Linear Convective System Tornado Intensity. J. Atmos. Sci. 2021, 78, 1189–1205. [Google Scholar] [CrossRef]
- Sherburn, K.D.; Parker, M.D.; King, J.R.; Lackmann, G.M. Composite environments of severe and nonsevere high-shear, low-CAPE convective events. Weather Forecast. 2016, 31, 1899–1927. [Google Scholar] [CrossRef]
- Shikhov, A.N.; Kalinin, N.A.; Bykov, A.V.; Azhigov, I.O.; Shumikhina, A.V. Tornadoes in the environments of weak convective instability: Analysis of two cases in the eastern part of the European Russia. Sovrem. Probl. Distantsionnogo Zondirovaniya Zemli Iz Kosm. 2020, 17, 255–268. (In Russian) [Google Scholar] [CrossRef]
- Taszarek, M.; Groenemeijer, P.; Allen, J.T.; Edwards, R.; Brooks, H.E.; Chmielewski, V.; Enno, S.E. Severe convective storms across Europe and the United States. Part I: Climatology of lightning, large hail, severe wind, and tornadoes. J. Clim. 2020, 33, 10239–10261. [Google Scholar] [CrossRef]
- Kalinin, N.A.; Shikhov, A.N.; Chernokulsky, A.V.; Kostarev, S.V.; Bykov, A.V. Environments of Formation of Severe Squalls and Tornadoes Causing Large-scale Windthrows in the Forest Zone of European Russia and the Ural. Russ. Meteorol. Hydrol. 2021, 46, 83–93. [Google Scholar] [CrossRef]
- Dmitrieva, T.G.; Peskov, B.E. Numerical forecast with the mesosynoptic specification of extremely severe squalls in the European part of Russia (Case study for 13 June and 29 July 2010). Russ. Meteorol. Hydrol. 2013, 38, 71–79. [Google Scholar] [CrossRef]
- Rotunno, R.; Klemp, J.B.; Weisman, M.L. A Theory for strong, Long-Lived Squall Lines. J. Atmos. Sci. 1988, 45, 463–485. [Google Scholar] [CrossRef]
- Jurković, P.M.; Mahović, N.S.; Počakal, D. Lightning, overshooting top and hail characteristics for strong convective storms in central Europe. Atmos. Res. 2015, 161, 153–168. [Google Scholar] [CrossRef]
- Droegemeier, K.K.; Lazarus, S.M.; Davies-Jones, R. The influence of helicity on numerically simulated convective storms. Mon. Weather Rev. 1993, 121, 2005–2029. [Google Scholar] [CrossRef]
- Moscow Storm Kills 16, Injures Nearly 170. Available online: https://edition.cnn.com/2017/05/30/europe/moscow-storm/index.html (accessed on 31 August 2022).
- Grieser, J. Convection Parameters. 2012. Available online: http://www.juergen-grieser.de/CovectionParameters/ConvectionParameters.pdf (accessed on 11 October 2022).


| ML LCL, m | ML LFC. m | MLCAPE, J kg−1 | ML CIN, J kg−1 | PW, mm | DLS, m s−1 | MLS, m s−1 | LLS, m s−1 | ML EHI0–3 km | ML WMS | SRH1, m2 s−2 | SRH3, m2 s−2 | SCP | SHIP | STP | SWEAT | |
|---|---|---|---|---|---|---|---|---|---|---|---|---|---|---|---|---|
| Values for starting point of a windthrow | ||||||||||||||||
| DMA | 0.08 | 0.09 | 0.23 | −0.13 | 0.31 | 0.00 | 0.01 | 0.33 | 0.31 | 0.19 | 0.22 | 0.17 | 0.20 | 0.06 | 0.08 | 0.30 |
| minCTT | −0.11 | −0.14 | −0.38 | 0.16 | −0.36 | −0.02 | −0.08 | 0.02 | −0.37 | −0.33 | −0.07 | −0.16 | −0.21 | −0.32 | −0.16 | −0.44 |
| Storm lifetime | 0.15 | 0.35 | 0.44 | −0.26 | 0.29 | 0.17 | 0.20 | 0.01 | 0.50 | 0.47 | 0.15 | 0.26 | 0.43 | 0.52 | 0.30 | 0.35 |
| Maximum values for 100 km radius around the starting point of a windthrow | ||||||||||||||||
| DMA | 0.10 | −0.03 | 0.20 | 0.21 | −0.06 | −0.01 | 0.31 | 0.28 | 0.17 | 0.18 | 0.12 | 0.18 | −0.01 | 0.09 | 0.36 | |
| minCTT | −0.07 | 0.01 | −0.36 | −0.24 | 0.05 | −0.06 | 0.00 | −0.34 | −0.30 | −0.05 | −0.11 | −0.19 | −0.25 | −0.11 | −0.48 | |
| Storm lifetime | 0.18 | 0.16 | 0.52 | 0.34 | 0.08 | 0.17 | 0.06 | 0.53 | 0.48 | 0.13 | 0.25 | 0.39 | 0.57 | 0.32 | 0.41 | |
Disclaimer/Publisher’s Note: The statements, opinions and data contained in all publications are solely those of the individual author(s) and contributor(s) and not of MDPI and/or the editor(s). MDPI and/or the editor(s) disclaim responsibility for any injury to people or property resulting from any ideas, methods, instructions or products referred to in the content. |
© 2023 by the authors. Licensee MDPI, Basel, Switzerland. This article is an open access article distributed under the terms and conditions of the Creative Commons Attribution (CC BY) license (https://creativecommons.org/licenses/by/4.0/).
Share and Cite
Chernokulsky, A.; Shikhov, A.; Yarinich, Y.; Sprygin, A. An Empirical Relationship among Characteristics of Severe Convective Storms, Their Cloud-Top Properties and Environmental Parameters in Northern Eurasia. Atmosphere 2023, 14, 174. https://doi.org/10.3390/atmos14010174
Chernokulsky A, Shikhov A, Yarinich Y, Sprygin A. An Empirical Relationship among Characteristics of Severe Convective Storms, Their Cloud-Top Properties and Environmental Parameters in Northern Eurasia. Atmosphere. 2023; 14(1):174. https://doi.org/10.3390/atmos14010174
Chicago/Turabian StyleChernokulsky, Alexander, Andrey Shikhov, Yulia Yarinich, and Alexander Sprygin. 2023. "An Empirical Relationship among Characteristics of Severe Convective Storms, Their Cloud-Top Properties and Environmental Parameters in Northern Eurasia" Atmosphere 14, no. 1: 174. https://doi.org/10.3390/atmos14010174