Article

Impact of Various Disturbance Sources on the Atmospheric Electric Field and Thunderstorm Activity of the Northern Tien-Shan

Institute of the Ionosphere, JSC National Center for Space Research and Technology, Almaty 050010, Kazakhstan
*
Author to whom correspondence should be addressed.
Atmosphere 2023, 14(1), 164; https://doi.org/10.3390/atmos14010164
Submission received: 24 November 2022 / Revised: 5 January 2023 / Accepted: 5 January 2023 / Published: 12 January 2023
(This article belongs to the Special Issue Advances in Atmospheric Sciences ‖)

Abstract

:
Features of the manifestations of various sources of disturbances in the atmospheric electric field at the Tien-Shan high-mountain station have been studied, and the statistical relationship between solar and thunderstorm activity has been established. Air currents arising over the ocean, having overcome the mountain gorges of the Himalayas, carry moisture to the Northern Tien-Shan and determine the weather features and thunderstorm activity at the Tien-Shan high-mountain station. It was established that the maximum and minimum thunderstorm activity at the Tien-Shan high-mountain station corresponds to the distribution curve of daily thunderstorm activity for the Asia–Australia region. The investigation showed that coronal mass ejections (CMEs) affect the atmospheric electric field by increasing or decreasing its level or causing its fluctuations, depending on the features of manifestations in the near-Earth space and in the Earth’s magnetosphere. In at least 70% of cases, thunderstorm activity was observed with a 1–2-day delay after impact on the Earth’s magnetosphere by CMEs and HSSs. A number of cases were studied when thunderstorm activity was observed in a quiet geomagnetic field. In these cases, an increase in the values of fmin (the minimum frequency of reflection from the ionosphere) and foEs (the critical frequency of the sporadic E layer) was observed, which indicated an increase in the level of radio wave absorption in the ionospheric D-region and the level of electron density at altitudes of 100–120 km.

1. Introduction

The study of the interaction of dynamic processes occurring in different layers of the Earth’s atmosphere and ionosphere is one of the most important fundamental problems of the physics of near-Earth space. Over the past few decades, our knowledge has advanced far in understanding the problem of the relationship between perturbations in the lower atmosphere and the state of the near space, solar activity, and variations in the cosmic ray flux [1,2]. Various mechanisms of energy transfer and transformation from the Sun to the Earth’s atmosphere have been proposed: dynamic, electrical, optical (electromagnetic radiation and changes in atmospheric transparency), and condensation [3,4,5,6].
The problem of the Sun-–weather relationship, and particularly, possible relationship between solar activity and thunderstorm rate, is one which has been studied for many years [7,8,9,10,11] but still remains controversial until now. A large variation in the relationship between sunspots and thunderstorm activity was reported by Brooks [7]. Thunderstorm activity as a function of the Earth’s position in a solar magnetic sector during 15 solar rotations in 1963 and 1964 was studied by Markson [8]. His results showed maximum thunderstorm activity when the Earth was at the leading edge of a sector with magnetic field directed toward the Sun and at the trailing edge of a sector with magnetic field directed away from the Sun; that is, that thunderstorms maximized when the Earth was crossing from an away sector into a toward sector. Significant increases (up to 50 to 70 percent) in the global thunderstorm activity on the third and especially on the fourth day after the occurrence of a Ha flare were found by Bossolasco et al. [9]. A correlation between sunspot number and day on which thunder was heard (‘thunder days’) in the UK was reported by Stringfellow [10] while other studies [11] have found an anti-correlation between solar cycle variations and thunder days for the Brazil region. Interesting effects in the response of the lightning rate over Europe to the solar activity and an increase in lightning rates and thunder days that coincided with an increased flux of solar energetic particles (SEPs) were recently demonstrated by Scott et al. [6]. Based on the above, it can be concluded that the results of the study of the possible relationship between solar and thunderstorm activity are quite contradictory, obtained in different regions, in different periods, and using different characteristics of solar and thunderstorm activity.
Interest in the problems of atmospheric electricity is also not decreasing. First of all, this is due to the understanding of the electric field of the atmosphere as an important environmental factor, closely interconnected with other components in the Earth’s atmosphere and affecting human life [12]. Results of scientific research in recent years indicate that the influence of solar activity, the interplanetary magnetic field and galactic cosmic rays on atmospheric processes is carried out through a global electrical circuit. However, the mechanisms of such influence are still being discussed. There is no firm evidence of the connection between the processes in the atmosphere–ionosphere of the Earth during thunderstorm activity. A number of issues that require further theoretical and experimental research also remain unclear. Therefore, the continuation of experimental research in this direction is of undoubted interest.
The purpose of this work is to study the features of the manifestations of various sources of disturbances in the atmospheric electric field at the Tien-Shan high-mountain station of the Institute of the Ionosphere (Kazakhstan) and to determine the statistical relationship between solar and thunderstorm activity using data of the registration at the experimental complex. This work takes into account the regional features of the location of experimental complexes. The impact of coronal mass ejections and high-speed solar wind flows on the atmospheric electric field was carried out by taking into account features of their manifestations in the atmosphere and magnetosphere of the Earth, that gave new results. New tasks are defined.

2. Data and Methods

The experimental complex for measuring atmospheric electric fields, namely “ELIS-TS”, was installed at the high-mountain Tien-Shan station of cosmic rays (3340 m above sea level, 43°02′ N, 76°56′ E) in 2005. The complex consists of two detectors: a detector of the quasistatic electric field, Ez, and a detector of the high-frequency component of the electric field. The detector of the atmospheric electric field, Ez component, is an electrostatic fluxmeter (“field mill”) that was designed to measure the vertical component Ez in the range of +/−50 kV/m with a sensitivity of 10 V/m. The detector of the high-frequency component dE/dt registers a return lightning stroke in the range of +/−600 V/m and, at the moment of the lightning discharge, generates a control signal, i.e., a trigger, for a complex of installations that measures various geophysical parameters. Both measuring systems can work in two modes: “slow” and “fast”. The “slow” mode is intended for recording the measured parameters of the atmosphere in “fair weather” conditions and in the absence of lightning discharges (time resolution 0.05 s). The “fast” mode (time resolution 50 µs) is triggered by the trigger system due to a signal that comes from a sensor that measures dE/dt when a thunderstorm front approaches. The primary viewing of the results of measurements of the atmospheric electric field is carried out using the IDL program, which allows for a view of the recorded information with different time resolutions, draws preliminary results, and determines the time of occurrence and duration of thunderstorm events.
The state of the lower ionosphere was estimated by studying the variations in the minimum reflection frequencies from the ionosphere (fmin) and the critical frequencies of the sporadic layer E (foEs), which were obtained via vertical radio sounding of the ionosphere at the Alma-Ata station (43.25° N, 76.92° E) during the considered thunderstorm events. Information about solar events (flares and their class), coronal mass ejections (SMEs), high-velocity solar wind streams (HSSs), their geoeffectiveness, and the date of their arrival at the Earth’s magnetosphere boundary were obtained from weekly space weather surveys of the Space Weather Prediction Center (Space Weather Prediction Center) (ftp://ftp.swpc.noaa.gov/pub/warehouse/ (accessed on 1 January 2021)). The activity of the geomagnetic field was estimated according to the geomagnetic Dst index (http://wdc.kugi.kyoto-u.ac.jp/, (accessed on 9 January 2023)) in accordance with the generally accepted classifications: small (−50 ≤ Dst = −30), moderate (−100 ≤ Dst = −50), and big storms (Dst < −100).

3. Results and Discussion

3.1. Peculiarities of Regular Variations of the Atmospheric Electric Field

Variations in the atmospheric electric field due to regular, periodic sources of disturbances reflect its dynamics under “fair weather” conditions. The classic example of the global variation of the electric field is the unitary variation, which is characterized by the diurnal change in the magnitude of the electric field with a maximum of around 19:00 UT, which is known as the Carnegie curve [13]. The generally accepted explanation for this phenomenon is that both the number of thunderstorms and the magnitude of the atmospheric electric field E across the Earth reach a maximum at 19:00. The maximum thunderstorms at middle latitudes are observed in the summer afternoon hours, which is due to the creation of favorable conditions for their development at this time, and the minimum is observed for the time before sunrise. Figure 1 represents a comparison between total land thunderstorm area (thick solid line, left-hand axis) with its regional contributions [14], and the Carnegie curve (red dashed line, right-hand axis) calculated in percentage of mean. The seasonal range in timing of the Carnegie curve’s maximum and minimum is shown by horizontal bars at their annual mean values. The land thunder area is the land area over which storms occur and is accepted as a rough measure of the activity of thunderstorms in all parts of the world.
The dynamics of diurnal variations of the atmospheric electric field, Ez, under “fair weather” conditions was studied on the basis of continuous long-term measurements at the high-mountain Tien-Shan station. Explicit seasonal dependence can be traced both in the features of diurnal variations of the electric field, and in their magnitude (50 ÷ 200 V/m in the daytime). The average value of the electric field in winter is much higher than in summer. This feature of the electric field at the high-mountain Tien-Shan station coincides with observations at other stations. The typical daily course of the atmospheric electric field for different seasons is shown in Figure 2 [15].
The absence of the Carnegie effect in the diurnal variation of the electric field at the high-mountain Tien-Shan station was already established in the first few years of continuous measurements. The unitary variation was not detected during the entire period of measurements of the atmospheric electric field at the high-mountain station, regardless of the season. The obtained feature of the diurnal variation of the electric field at the Tien Shan high-mountain station does not agree with the measurements at the Borok medium-latitude lowland observatory or at the Marsta observatory in winter [16,17]. The high-mountain location of the station (3340 m above sea level) is also not a condition for the allocation of unitary variation, as follows from the conclusions of the authors [18].
We considered that the most probable explanation for this fact was the proximity to the thunderstorm source in the Himalayas, where the maximum thunderstorm activity occurs much earlier than in other regions at our latitude. The local features of the location of the station prevail over the global effects that affect the diurnal dynamics of the atmospheric electric field in this case.

3.2. Features of the Daily Distribution of Thunderstorms at the High-Mountain Station of the Northern Tien-Shan

The orography of the terrain, climatic and geological features significantly affect the dynamics of the surface atmospheric electric field and the occurrence of thunderstorms. An important and significant factor in the spatial distribution of thunderstorms in the region of the high-mountain Tien-Shan station is the presence of mountain ranges, gorges, valleys, rivers and lakes, and the direction of movement of air masses. One of the strongest thunderstorm centers affecting the global electrical circuit is located in the mountain regions of the Himalayas, https://ru.wikipedia.org/wiki/ (accessed on 9 January 2023).
Visual observations over many years at the high-mountain Tien-Shan station (confirmed by meteorologists) have shown that the prevailing movement of thunderclouds has a southwesterly direction; from the Issyk-Kul Lake through the Prokhodnoe gorge and the Dzhusaly-Kezen pass. The space station is located on the Dzhusaly-Kezen pass at an altitude of 3340 m above sea level. Thunderclouds pass very low over the station; lightning discharges are observed in the immediate vicinity of the recording complex. The catalog of thunderstorms with powerful lightning activity was compiled for the period from 2005 to 2015 to analyze the daily distribution of thunderstorm activity at the Tien-Shan high-mountain station. The catalog includes 125 thunderstorm events. The main catalog of lightning events has been divided into separate catalogs, in which thunderstorms are classified according to the types of lightning discharges: positive, negative, and mixed (positive and negative discharges).
Diagrams of the daily distribution of thunderstorm events for the period 2005–2015 according to catalogs are shown in Figure 3. From the diagram of the daily distribution of the total number of thunderstorm events at the Tien-Shan high-mountain station, it follows that the maximum and minimum thunderstorm activity correspond to the distribution curve of daily thunderstorm activity for the Asian region in Figure 1.
It is also obvious that there are much fewer thunderstorms with positive discharges than with negative discharges. Their number does not exceed 24%. However, this value is twice the generally accepted ideas about this value in the scientific literature [19,20].
Diagrams of the daily distribution of thunderstorm events based on 3-h data from Almaty meteorological station for the period 2005–2019 (archive weather from Almaty) and from Big Almaty Lake (BAL) meteorological station for the period 2011–2014 and 2017–2020 (archive weather from Big Almaty Lake (BAL)) are presented in Figure 4. The geographical coordinates of these stations differ slightly, but they are located below the high-mountain Tien-Shan station (BAL—43°07′ N, 76°54′ E, 2506 m above sea level; Almaty—43°15′ N, 76°55′ E, 787 ÷ 851 m above sea level).
It is clearly seen from the diagrams that the maximum daily distribution of thunderstorm activity falls in the afternoon time (at 15 ÷ 24 h local time, LT), both for the city of Almaty and for BAL. The difference between universal time and local time is 6 h. This result is consistent with the scientific literature data that the maximum thunderstorms at our latitudes for plains and mountain-valley objects occur in the afternoon hours, and the minimum, just like for mountains, is before sunrise.
Thus, it was established that the maximum thunderstorm activity at the Tien-Shan high-mountain station is observed much earlier than on the plain and mountain-valley objects at our latitude, despite the insignificance of the distance between the Tien-Shan high-mountain station and meteorological stations BAL (~5 km) and Almaty (~17 km). Air currents arising over the ocean, having traveled thousands of kilometers, convey moisture to the Tien-Shan and determine the weather features and thunderstorm activity at the Tien Shan high-mountain station.

3.3. Peculiarities of Manifestations of Sporadic Disturbance Sources on the Dynamics of the Atmospheric Electric Field

The problem of disturbances of the electric field of the surface atmosphere by sporadic sources is one of the tasks of atmospheric electricity. Giant coronal mass ejections (CMEs) and high-velocity solar wind streams from coronal holes (HSSs) are the most geoeffective sporadic manifestations of solar activity. Their collision with the Earth’s magnetosphere and atmosphere leads to magnetic and ionospheric storms, a Forbush decrease in the intensity of cosmic rays, and other phenomena. Forbush effects (Forbush decreases) and magnetic storms are often considered inseparable from each other as a consequence of one source of disturbances. Contradictory results appear in studies of the impact of sporadic solar activity phenomena on geophysical parameters in connection with this [21]. However, the most significant difference between them is that the Forbush effect is determined by the conditions in the extended heliospheric region, while geomagnetic activity depends on the local situation near the Earth [22]. Our studies were carried out by taking into account features of manifestations of geoeffective sporadic phenomena of solar activity in the atmosphere and magnetosphere of the Earth for three different cases: 1—large Forbush effects and large magnetic storms, 2—large Forbush effects and weak magnetic disturbance, and 3—large magnetic storms and Forbush effects of less 1%. Only periods of “fair weather” were analyzed in this case.
In the first case, both an increase and a decrease in the electric field were observed after the impact of powerful coronal mass ejections (CMEs) and were simultaneously accompanied by large magnetic storms and Forbush decrease in cosmic rays, Figure 5.
It should be noted that the increases in the atmospheric electric field in these events were rarer. Perhaps the increase was due to a lower background level the day before. However, it is obvious that it is incorrect to apply the epoch superimposition method to study the response to the impact of such events on the atmospheric electric field. The solid vertical line in the figures is the arrival of a CME into the Earth’s orbit.
In the second case, an obvious decrease in the atmospheric electric field was observed after the impact of powerful coronal mass ejections on the near-Earth space, accompanied by a significant decrease in galactic cosmic rays (Forbush effect), but an insignificant magnetic disturbance. Values of the atmospheric electric field after CMEs, accompanied by the significant Forbush decreases and weak magnetic disturbances are shown in Figure 6, where the Dst and FE values are shown in the figure field.
Galactic cosmic rays are the main source of ionization up to altitudes of 60 km. Near the Earth’s surface, radioactive gases serve as an additional source of ionization; above 60 km, ultraviolet radiation dominates [23]. The high stability of the intensity of cosmic rays ensures relatively small variations in the electric field. During Forbush effects, the current in the Earth–ionosphere column decreases due to a decrease in atmospheric ionization, which should lead to a decrease in Ez according to estimates [24]. Our results did not contradict the statements of the authors [23,24]; however, the relative contribution of radioactive gases to the ionization of the surface atmosphere needs to be clarified.
For the third case, the values of the atmospheric electric field at the high-mountain station under the influence of the large geomagnetic storm, Dst = −103, and under “fair weather” conditions for the 14 November 2012 event are shown in Figure 7 (left panel). The values of the electric field characteristic of “fair weather” conditions were not observed in this event, but significant field fluctuations were observed from 40 to 120 V/m. The results of calculations of the normalized power spectra of variations in the atmospheric electric field during magnetic storms (dashed line curve) against the background of spectral estimates of the undisturbed atmosphere (solid line) are presented in the right panel of Figure 7. Spectral peaks exceeding the 95% confidence interval were observed in the minute ranges 10−3 ÷ 10−2 Hz and 10−2 ÷ 10−1 Hz.
Thus, coronal mass ejections affect the atmospheric electric field by increasing or decreasing its level or causing its fluctuations, depending on the features of manifestations in the near-Earth space and in the Earth’s magnetosphere.

3.4. Investigation of the Statistical Relationship between Thunderstorm Activity and Processes on the Sun

In general, 125 cases of thunderstorm events were recorded in the 2005–2015 period; of these, 55 cases were characterized by the appearance of negative, 30 cases by the appearance of positive, and 40 cases by the appearance of mixed discharges. The results of a joint analysis of geomagnetic, solar and thunderstorm activity showed that there is a tendency for thunderstorm activity to appear during periods of increased geomagnetic activity (geomagnetic storms) with the highest probability in the recovery phase to the level of a quiet geomagnetic field, as well as during the impact of geoeffective coronal mass ejections on the Earth’s magnetosphere and high-velocity solar wind streams (HSS) observed during the considered periods. It was found that 21 events of lightning activity with positive discharges, 39 out 55 events with negative discharges, and 24 out of 40 events with mixed discharges were accompanied or preceded by the CME and HSS effects. Figure 8 shows an example of the occurrence of thunderstorm activity in July 2013.
In this figure, the symbols “↑”, “▼”, and “◆” indicate the dates of thunderstorm events with positive, negative, and mixed discharges, respectively; powerful events are highlighted in red. The horizontal arrows in the figures mark the time intervals when the Earth was under the influence of the effects of CMEs and HSSs, where the length of each arrow indicates the duration of greatest impact.
As a result, it has been observed that in no less than 70% of cases, thunderstorm activity was found during periods of impact on the Earth’s magnetosphere by CMEs and HSSs, and this suggests that the increase in thunderstorm activity occurs under the influence of high-speed flows of energetic particles of the solar wind (protons and electrons).
Figure 9 shows the frequency of occurrence of the thunderstorm events as a function of time delay between an observed thunderstorm and the arrival of geoeffective CMEs and HSSs to the Earth. One can see that thunderstorm activity was most likely to increase during or 1–2 days after the arrival of geoeffective CMEs and HSSs to the Earth.
It is known that the main necessary condition for the formation of thunderclouds is the state of instability of the atmosphere, which forms updrafts. Sporadic manifestations of solar activity modify the state of atmosphere, change atmospheric pressure, and contribute to the formation of clouds, cyclones and the formation of thunderclouds. 
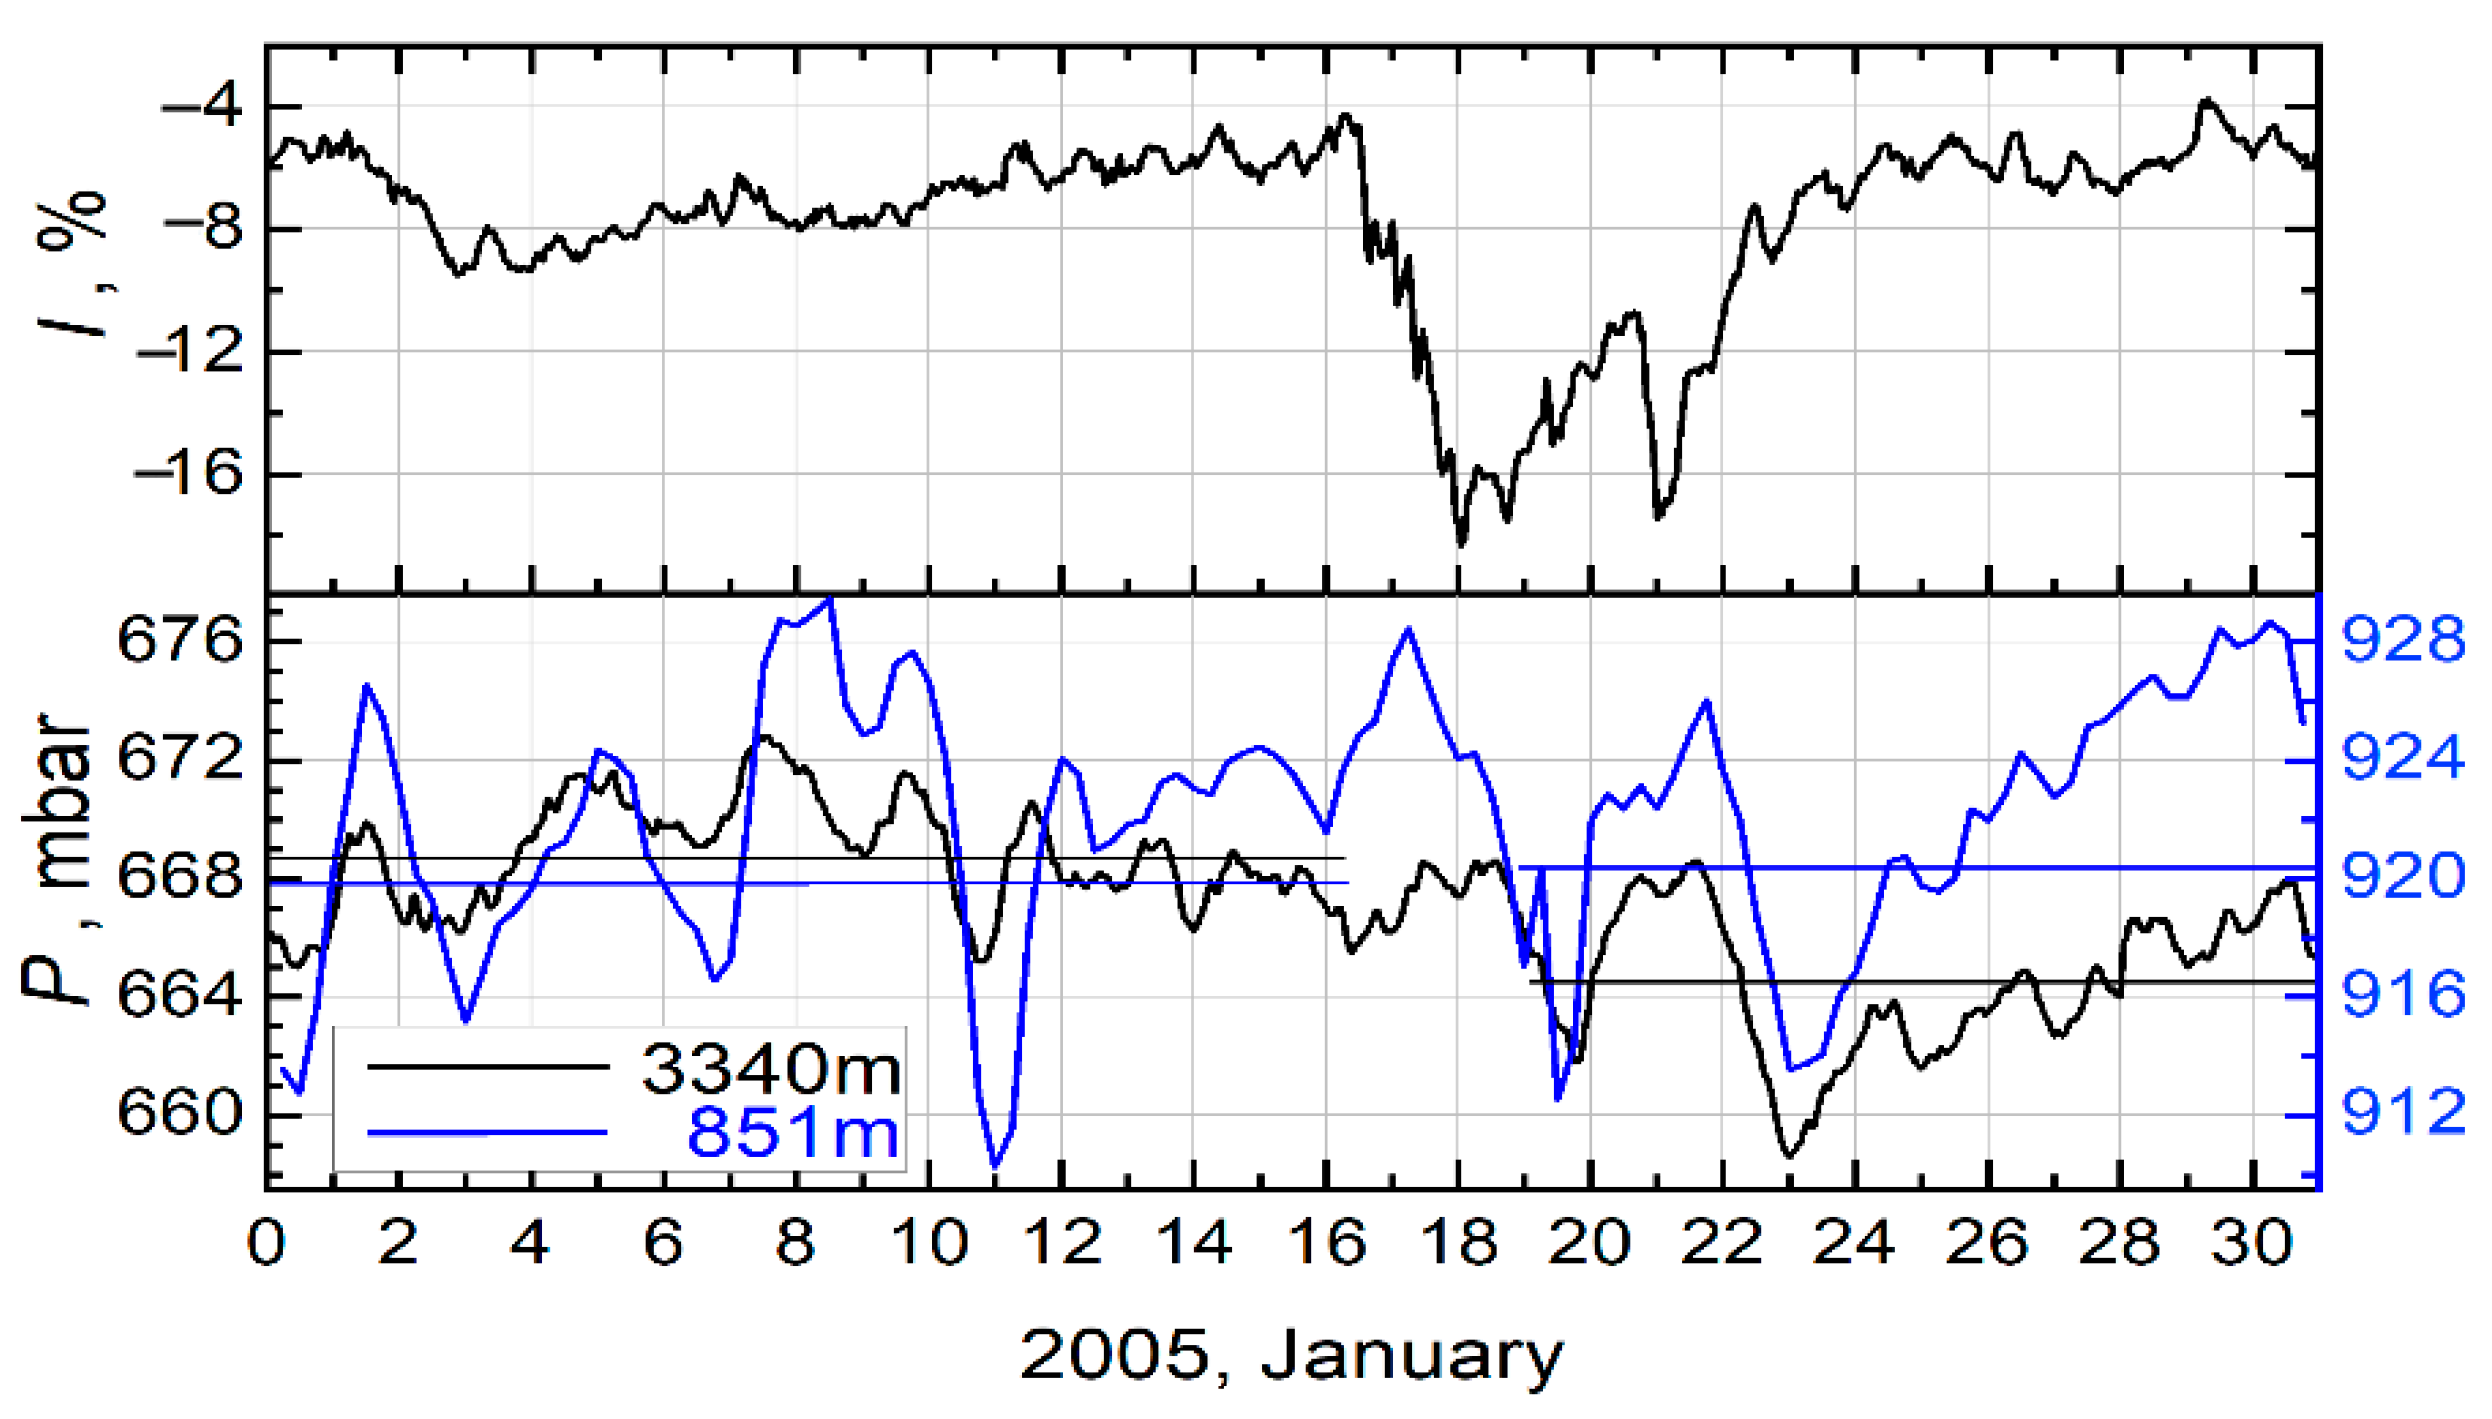
Figure 10 is a striking example of the influence of a powerful coronal mass ejection in January 2005 on a decrease in the intensity of cosmic rays and a change in atmospheric pressure at different altitudes with a delay of two days.
This event is interesting because in atmospheric pressure, as well as in the intensity of cosmic rays, two characteristic minimums are observed with a delay of two days. This fact confirms the causal relationship between Forbush decreases and changes in atmospheric pressure. It has been established that after coronal mass ejections, ~80% of Forbush decreases of cosmic rays with modulation amplitude of ≥3% are accompanied by a change in atmospheric pressure after 0.5 ÷ 2 days. The depth of pressure reduction can reach 14 mb [25].
At present, two possible physical mechanisms of the influence of cosmic rays on cloudiness variations in the lower atmosphere are considered according to the authors of [26]. One physical mechanism is directly related to the ionization of the upper layers of the troposphere by cosmic rays [27]. According to another hypothesis, the atmospheric conductivity is modulated by cosmic rays and, as a result, the intensity of currents in the global current circuit varies, which can also lead to a change in the cloud formation rate [3,28].
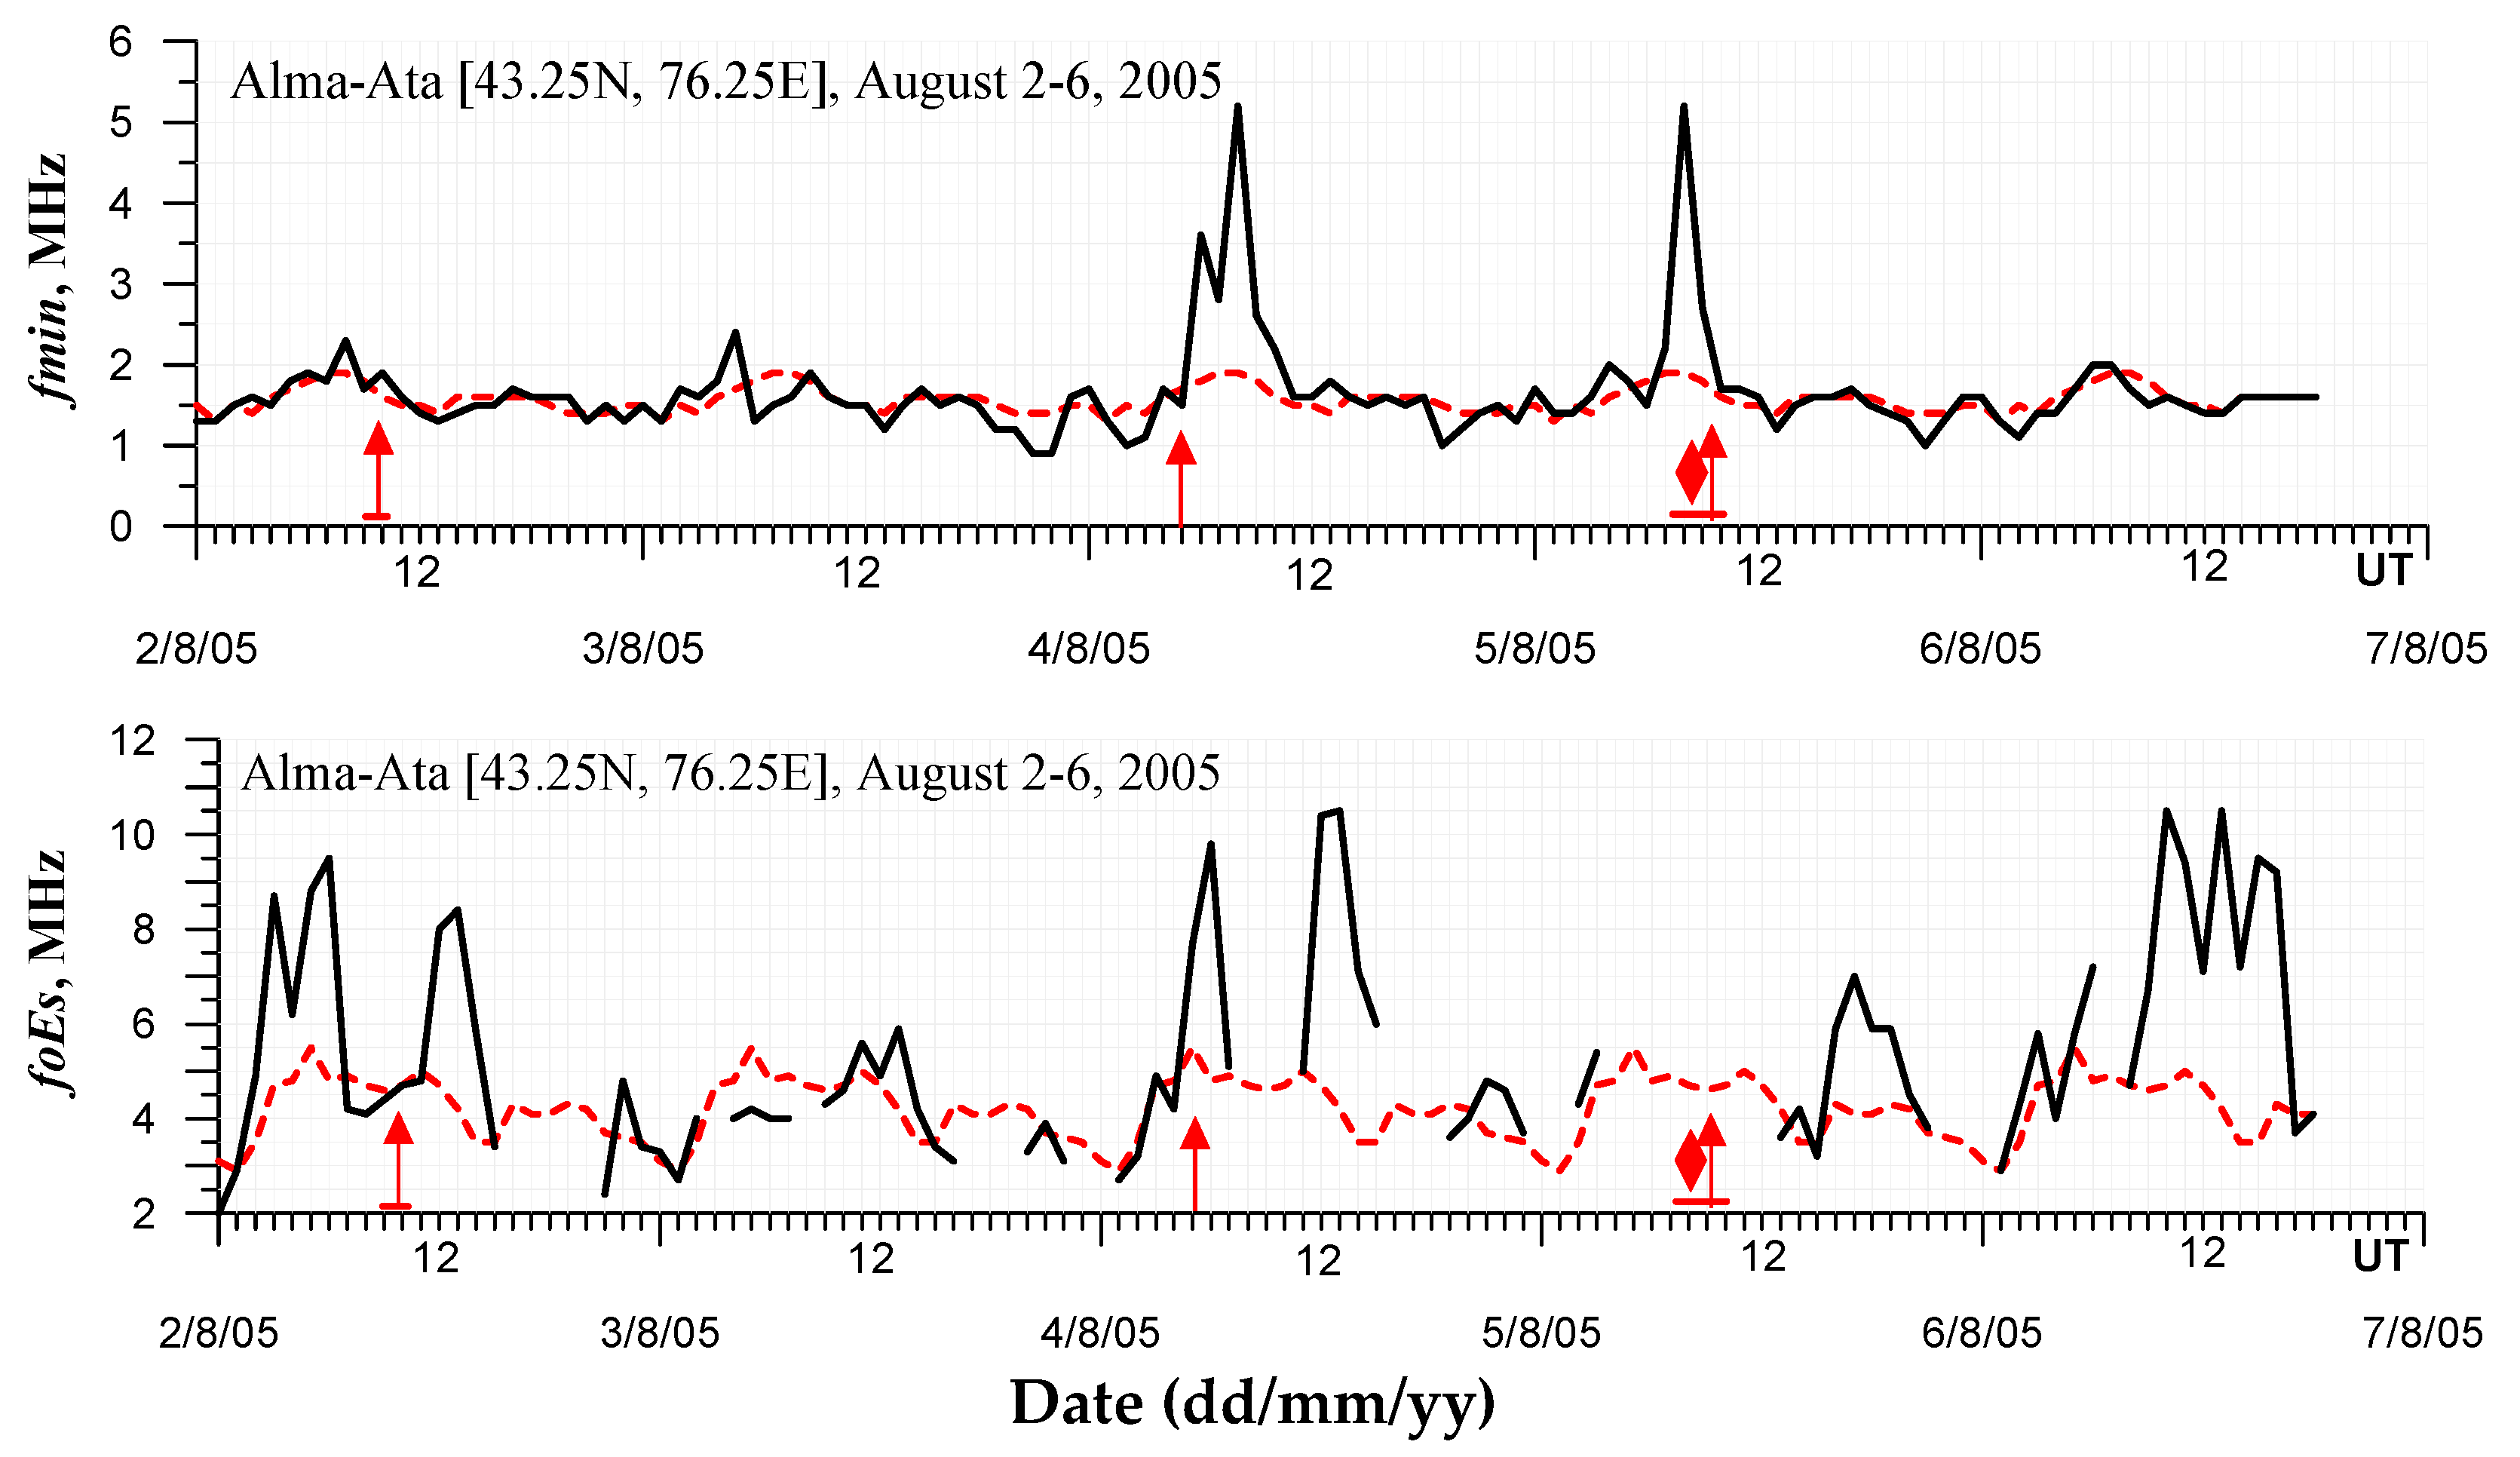
A number of cases has been studied when thunderstorm activity was observed in a quiet geomagnetic field, for example, when CMEs and HSSs events are not observed or these events are not geoeffective, Figure 11. Solid curve—current values of fmin and foEs, dashed curve—median values, powerful thunderstorm events are highlighted in red. In these cases, an increase in the values of fmin and intensification of the sporadic layer Es were observed, which indicated an increase in the level of absorption of radio waves in the D-region of the ionosphere and the level of electron density at altitudes of 100–120 km.
However, the analysis of thunderstorm events under quiet helio-geomagnetic conditions and the study of the ionospheric response to thunderstorm activity are beyond the scope of the present work, which requires further work in this direction and study of the relationship between processes in the Sun–Earth system.

4. Conclusions

The absence of the Carnegie effect in the diurnal variation of the electric field at the high-mountain Tien-Shan station was established. We considered that the most probable explanation for this fact was the proximity to the thunderstorm source in the Himalayas, where the maximum thunderstorm activity occurs much earlier than in other regions at our latitude. It was established that the maximum and minimum thunderstorm activity observed at the Tien-Shan high-mountain station in the period 2005–2015 correspond to the distribution curve of daily thunderstorm activity for the Asian region. The local features of the location of the station prevail over the global effects that affect the diurnal dynamics of the atmospheric electric field in this case. Air currents arising over the ocean, having traveled thousands of kilometers, convey moisture to the Tien-Shan and determine the weather features and thunderstorm activity at the Tien Shan high-mountain station.
Coronal mass ejections (CMEs) affect the atmospheric electric field by increasing or decreasing its level or causing its fluctuations, depending on the features of manifestations in the near-Earth space and in the Earth’s magnetosphere. Atmospheric electric field fluctuations (40 ÷ 120 V/m) in the range of 10−3 ÷ 10−1 Hz were observed under the impact of large geomagnetic storms.
In at least 70% of cases, thunderstorm activity was observed with a 1–2-day delay after impact on the Earth’s magnetosphere by CMEs and HSSs. A number of cases of changes in the parameters of the lower layers of the ionosphere during thunderstorms have been identified, which will be the subject of further work in this direction.

Author Contributions

V.A. conceived, designed, and performed the evaluation; wrote Section 3.1 and Section 3.2; and corrected the manuscript. G.G. guided the current research work related to the ionosphere, prepared the tables and figures, and wrote Section 3.3 of the manuscript. V.L. and S.K. guided the measurement collection, collected the data related to the atmosphere, and prepared the tables and figures. All authors have read and agreed to the published version of the manuscript.

Funding

This research was financially supported by the Science Committee of the Ministry of Education and Science of the Republic of Kazakhstan (Nur-Sultan, Kazakhstan), grant no. AP09259375.

Institutional Review Board Statement

Not applicable.

Informed Consent Statement

Not applicable.

Data Availability Statement

Not applicable.

Conflicts of Interest

The authors declare no conflict of interest.

References

  1. Veretenenko, S.V.; Pudovkin, M.I. Effects of the galactic cosmic ray variations on the solar radiation input in the lower atmosphere. J. Atmos. Sol.-Terr. Phys. 1997, 59, 1739–1746. [Google Scholar] [CrossRef]
  2. Pudovkin, M.I.; Babushkina, S.V. Influence of solar flares and disturbances of the interplanetary medium on the atmospheric circulation. J. Atmos. Sol.-Terr. Phys. 1992, 54, 841–846. [Google Scholar] [CrossRef]
  3. Tinsley, B.A. Influence of solar wind on the global electric current, and inferred effects on cloud microphysics, temperature and dynamics in the troposphere. Space Sci. Rev. 2000, 94, 231–258. [Google Scholar] [CrossRef]
  4. Ermakov, V.I.; Stozhkov, Y.I. Influence of active regions of the Sun on the global thunderstorm activity and weather on Earth. Short Commun. Phys. FIAN 2003, 3, 9–25. (In Russian) [Google Scholar]
  5. Reiter, R. Phenomena in Atmospheric and Environmental Electricity; Elsevier: Amsterdam, The Netherlands; New York, NY, USA, 1992; p. 541. [Google Scholar]
  6. Scott, C.J.; Harrison, R.G.; Owens, M.J.; Lockwood, M.; Barnard, L. Evidence for solar wind modulation of lightning. Environ. Res. Lett. 2014, 9, 055004. [Google Scholar] [CrossRef]
  7. Brooks, C.E.P. The variation of the annual frequency of thunderstorms in relation to sunspots. Q. J. R. Meteorol. Soc. 1934, 60, 53–166. [Google Scholar] [CrossRef]
  8. Markson, R. Considerations Regarding Solar and Lunar Modulation of Geophysical Parameters, Atmospheric Electricity and Thunderstorms. Pure Appl. Geophys. 1971, 84, 161–202. [Google Scholar] [CrossRef]
  9. Bossolasco, M.; Dagnino, I.; Elena, A.; Flocchini, G. Solar Flare Control of Thunderstorm Activity. Meteorol. E Oceanogr. 1972, 1, 213–218. [Google Scholar]
  10. Stringfellow, M.F. Lightning incidence in Britain and the solar cycle. Nature 1974, 3, 249–332. [Google Scholar] [CrossRef]
  11. Pinto, N.O.; Pinto, I.R.C.A.; Pinto, O., Jr. The relationship between thunderstorm and solar activity for Brazil from 1951 to 2009. J. Atmos. Sol.-Terr. Phys. 2013, 98, 12–21. [Google Scholar] [CrossRef]
  12. Pulinets, S.A.; Liu, J.-Y. Ionospheric variability unrelated to solar and geomagnetic activity. Adv. Space Res. 2004, 34, 1826–1933. [Google Scholar] [CrossRef]
  13. Harrison, R.G. The Carnegie curve. Surv. Geophys. 2013, 34, 209–232. [Google Scholar] [CrossRef]
  14. Harrison, R.G.; Nicoll, K.A. Fair weather criteria for atmospheric electricity measurements. J. Atmos. Sol.-Terr. Phys. 2018, 179, 239–250. [Google Scholar] [CrossRef]
  15. Antonova, V.P.; Drobzhev, V.I.; Shlyugaev, Y.V. Observations of variations in the electric field in the Tien Shan under different geophysical conditions, including seismic. In Proceedings of the All-Russian Conference on Atmospheric Electricity, St. Petersburg, Russia, 24–28 September 2012; pp. 29–30. (In Russian). [Google Scholar]
  16. Anisimov, S.V. Dynamics of electricity in the undisturbed atmosphere of middle latitudes. In Proceedings of the All-Russian Conference on Atmospheric Electricity, St. Petersburg, Russia, 24–28 September 2012; pp. 18–21. (In Russian). [Google Scholar]
  17. Israelsson, S.; Tammet, H. Variation of fair weather atmospheric electricity at Marsta Observatory, Sweden, 1993–1998. J. Atmos. Sol.-Terr. Phys. 2001, 16, 1693–1703. [Google Scholar] [CrossRef]
  18. Aleshkov, V.M.; Molodykh, S.I. Seasonal changes in the diurnal variation of atmospheric electricity parameters at high-mountain stations. Mater. In Proceedings of the All-Russian Conference on Global Electric Circuit, Borok, Russia, 28 October–1 November 2013; pp. 35–36. (In Russian). [Google Scholar]
  19. Pierce, E.T. Electrostatic field-changes due to lightning discharges. Q. J. R. Meteorol. Soc. 1955, 81, 211–228. [Google Scholar] [CrossRef]
  20. Pierce, E.T. The development of lightning discharges. Q. J. R. Meteorol. Soc. 1955, 81, 229–240. [Google Scholar] [CrossRef]
  21. Smirnov, S.E.; Mikhailova, G.A.; Kapustina, O.V. Response of the quasi-static electric field and meteorological parameters in the surface atmosphere in Kamchatka to geomagnetic storms in November 2004. Geomagn. Aeron. 2013, 53, 532–545. (In Russian) [Google Scholar] [CrossRef]
  22. Belov, A.V. Forbush effects and their connection with solar, interplanetary and geomagnetic phenomena. Univers. Heliophys. Process. Proc. Int. Astron. Union IAU Symp. 2009, 257, 439–450. [Google Scholar] [CrossRef] [Green Version]
  23. Anisimov, S.V.; Chulliat, A.; Dmitriev, E.M. Information-measuring complex and database of mid-latitude Borok Geophysical Observatory. Russ. J. Earth. Sci. 2008, 10, ES3007. [Google Scholar] [CrossRef] [Green Version]
  24. Ponomarev, E.A.; Cherneva, N.V.; Firstov, P.P. Formation of the local electric field of the atmosphere. Geomagn. Aeron. 2011, 51, 405–411. (In Russian) [Google Scholar] [CrossRef]
  25. Antonova, V.; Kryukov, S. Forbush-effects and atmospheric pressure dynamics at high-altitude Tien Shan station. J. Phys. Conf. Ser. 2013, 409, 012226. Available online: http://iopscience.iop.org/1742-6596/409/1/012226 (accessed on 9 January 2022). [CrossRef] [Green Version]
  26. Artamonova, I.V.; Veretenenko, S.V. Galactic cosmic ray variation influence on baric system dynamics at middle latitudes. J. Atmos. Solar.-Terr. Phys. 2011, 73, 366–370. [Google Scholar] [CrossRef]
  27. Dickinson, R.E. Solar variability and the lower atmosphere. Bull. Am. Meteorol. Soc. 1975, 56, 1240–1248. [Google Scholar] [CrossRef]
  28. Tinsley, B.A. The global atmospheric electric circuit and its effects on cloud microphysics. Rep. Prog. Phys. 2008, 71, 66801–66900. [Google Scholar] [CrossRef]
Figure 1. Carnegie curve and distribution of thunderstorms over the Earth’s surface.
Atmosphere 14 00164 g001
Figure 2. Diurnal variations in the electric field at the high-mountain Tien-Shan station under “fair weather” conditions for different seasons.
Atmosphere 14 00164 g002
Figure 3. Diurnal distribution of thunderstorms at the high-mountain Tien-Shan station for various types of lightning discharges.
Atmosphere 14 00164 g003
Figure 4. Diurnal distribution of thunderstorms at the Almaty meteorological station and the Big Almaty Lake (BAL) meteorological station.
Atmosphere 14 00164 g004
Figure 5. Values of the atmospheric electric field after the CME 27.02.2014 and 17.03.2013. The Dst and FE values are shown in the figure field. The vertical solid line indicates the boundaries of the day; the dashed vertical line indicates the beginning of the FE.
Atmosphere 14 00164 g005
Figure 6. Values of the atmospheric electric field after the CMEs 29 March 2011 and 1 December 2014. The vertical solid line indicates the boundaries of the day, the dashed vertical line indicates the beginning of the FE.
Atmosphere 14 00164 g006
Figure 7. The values of the atmospheric electric field under the impact of the large (Dst = −103) geomagnetic storm (left panel) and power spectra of variations in the atmospheric electric field during magnetic storms (right panel, dashed line curve).
Atmosphere 14 00164 g007
Figure 8. Variations of the Dst index and the thunderstorm activity in July 2013.
Atmosphere 14 00164 g008
Figure 9. The number of thunderstorms after the arrival of geoeffective coronal mass ejections and high-speed solar wind streams to the Earth.
Atmosphere 14 00164 g009
Figure 10. Variations in the intensity of the neutron component of cosmic rays and atmospheric pressure at different heights.
Atmosphere 14 00164 g010
Figure 11. Variations of fmin and foEs for 2–6 August 2005.
Atmosphere 14 00164 g011
Disclaimer/Publisher’s Note: The statements, opinions and data contained in all publications are solely those of the individual author(s) and contributor(s) and not of MDPI and/or the editor(s). MDPI and/or the editor(s) disclaim responsibility for any injury to people or property resulting from any ideas, methods, instructions or products referred to in the content.

