Article

Grain Size Characteristics of MIS 5 Sediments and Evolution of the East Asian Summer Monsoon in the Zhifu Section, Yantai City, Shandong Province, China

1
School of Environmental and Chemical Engineering, Foshan University, Foshan 528000, China
2
State Key Laboratory of Loess and Quaternary Geology, Institute of Earth Environment, Chinese Academy of Sciences, Xi’an 710061, China
3
Key Laboratory of Desert and Desertification, Northwest Institute of Eco-Environment and Resources, Chinese Academy of Sciences, Lanzhou 730000, China
4
Institute of Geology and Geophysics, Chinese Academy of Sciences, Beijing 100029, China
*
Author to whom correspondence should be addressed.
Atmosphere 2023, 14(1), 153; https://doi.org/10.3390/atmos14010153
Submission received: 27 November 2022 / Revised: 29 December 2022 / Accepted: 6 January 2023 / Published: 10 January 2023
(This article belongs to the Special Issue Quaternary Westerlies and Monsoon Interaction in Asia)

Abstract

:
The North Yellow Sea, located at the intersection of the Eurasian continent and North Pacific Ocean at mid-latitudes, is a sensitive area subjected to the joint actions of the ocean, land, and monsoons. On its southern shore, loess and paleosol sedimentary sequences were widely developed during the last interglacial period, which is of great significance for revealing patterns of climate change and dynamic conditions. In this paper, we focus on the Zhifu section (ZFS) on Zhifu Island within the Shandong Province of China. The optically stimulated luminescence (OSL) dating method was used to construct our chronological framework. Grain size and its endmember (EM) components were then analyzed; EM1 is a clay component EM, which represents a weak dynamic environment and strong weathering pedogenesis, while EM2 and EM3 are silt and very fine sand component EMs, respectively, representing a strong dynamic environment and weak weathering pedogenesis. Maximum EM1, mean grain size, clay content, and pH values occur in the paleosol layers (ZF4, ZF6, and ZF8), with minimum values in the loess layers (ZF5 and ZF7); EM3 values show the opposite pattern. This indicates that the ZF4, ZF6, and ZF8 layers represent warm and humid environments with abundant precipitation, where the East Asian summer monsoon (EASM) was enhanced, corresponding to Marine Isotope Stages (MIS) 5a, 5c, and 5e. In contrast, ZF5 and ZF7 represent sub-warm and humid environments with less precipitation, where the EASM was weakened, corresponding to MIS 5b and 5d. Among these stages, MIS5e is the warmest and wettest. These climatic events reveal the pattern of climate fluctuation over a ten-thousand-year timescale; they are synchronous with climate changes recorded in other geological repositories, such as cave stalagmites in southern China and sea-level fluctuations in the Yellow-Bohai Sea, which result from changes in global solar radiation.

1. Introduction

Marine Isotope Stage (MIS) 5, often referred to as the last interglacial period, was a period of minimum ice volume that expanded from 130 to 75 ka BP [1], and was the most recent climatological warm period. Ice cores in central Greenland [2,3], desert [4,5], loess [6,7], lake sediments [8], and stalagmites [9,10] in Eurasia, and deep-sea sediments in the oceans [11,12,13] record their climate fluctuations on a ten-thousand-year timescale, which includes three warm and two cold intervals. Consequently, sea levels also experienced three significant rises and two falls during this period [12,14,15]. The coastal zone of eastern Eurasia is a typical area of ocean-land-monsoon interaction, experiencing frequent climate change and sea-level fluctuations. The northern coastal zone of the Shandong Peninsula, which is adjacent to the North Yellow Sea, has developed a patchy distribution of eolian sand-dust sequences under the influence of Quaternary climate and sea-level fluctuation. These are of great significance in revealing patterns of climate change, sea-level fluctuation, and monsoon evolution over a specific geological period, as well as their interrelationships. For example, climate change and sea-level fluctuation during the Pleistocene have been studied using marine sediments in the Yellow and Bohai seas [14,16,17], while Late Pleistocene material sources and climate change have been discussed using data from loess and sandy deposits in coastal zones [18,19,20,21,22]. Such studies have mainly focused on the last glacial period, and there have been relatively few studies on the last interglacial period.
Zhifu Island, located on the southern margin of the North Yellow Sea, is a typical continental island. During the Late Quaternary period, under the joint action of the ocean, land, and monsoons, loess-like deposits with a thickness of several meters up to >10 m accumulated in some areas. Previous studies have mainly discussed its genesis, provenance, and environmental characteristics from the perspectives of mineralogy and grain size composition [23,24,25]; they also determined the geological age of the upper loess in southeast Zhifu Island to be 30,210 ± 2410 years ago using the thermoluminescence dating method [17]. Such work provided a preliminarily understanding of climate change and sea-level fluctuations during the last glacial period. However, these studies did not include a detailed analysis of chronology or climate events through high-density sampling, owing especially to the scarcity of sedimentary sequences and related climate records from the last interglacial period. Here, on the basis of detailed investigations on Zhifu Island, a relatively continuous sedimentary section was selected in the Xikou village valley in the northwest of Zhifu Island. We construct a chronological framework for the last interglacial period using the OSL dating method, perform grain size and pH analysis, and discuss patterns of environmental change and EASM evolution.

2. Geological Background

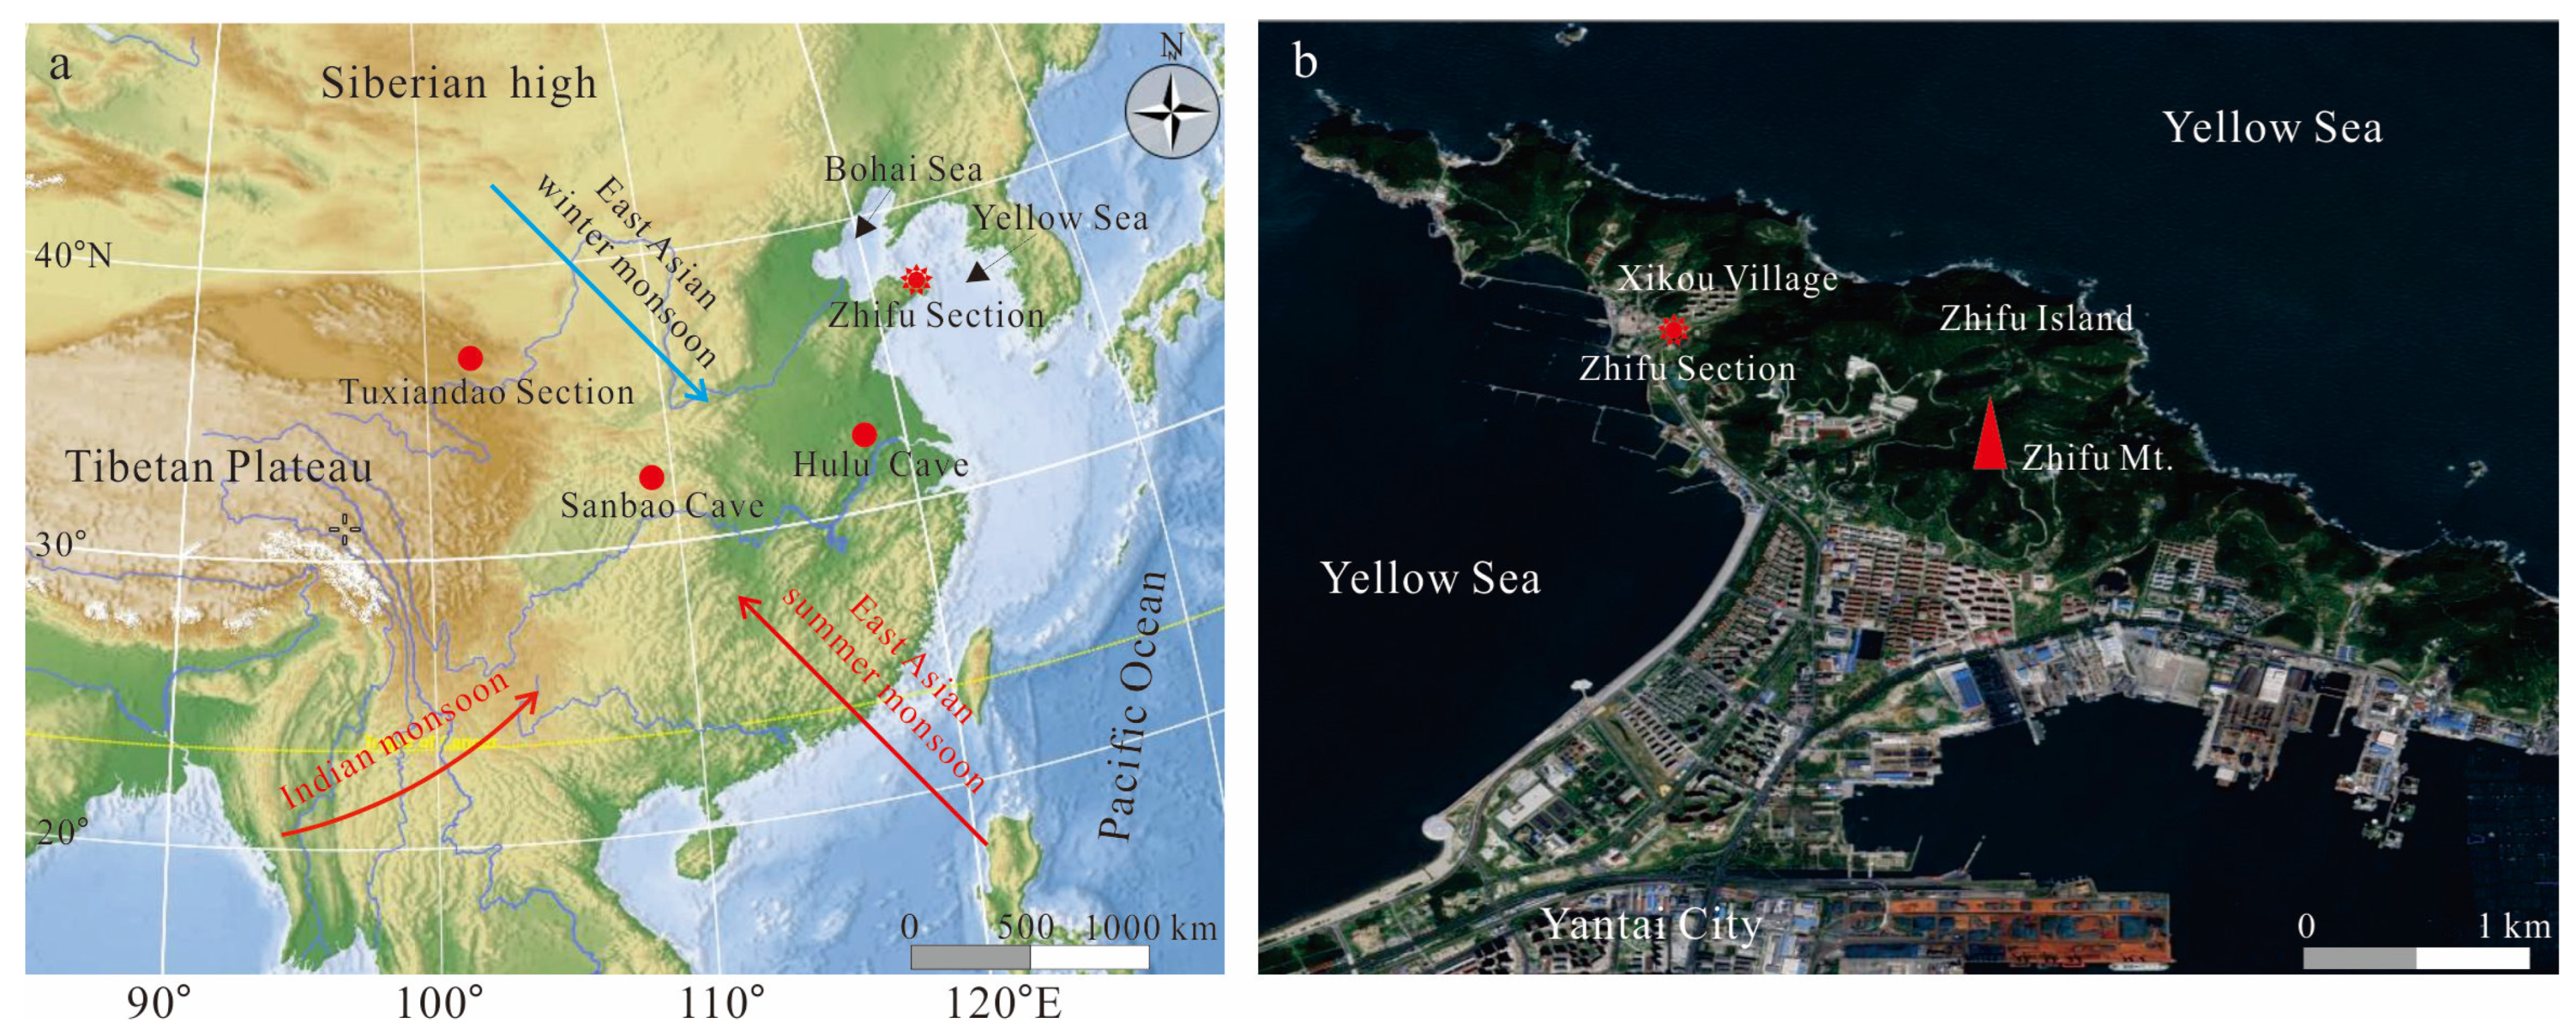
2.1. Geological and Geographical Overview

Zhifu Island, located to the north of Yantai City, Shandong Province, China, is surrounded by the North Yellow Sea on three sides and connected to the mainland to the south. It is the largest continental island of China (Figure 1). Its geological structures are complex; exposed rocks mainly comprise a metamorphic rock series of quartzite, gneiss, and schist, with high hardness and well-developed joints, which weather to form precipitous geomorphology [25]. Under the control of northwest-by-west (WNW)-trending faults, the northeastern coastline is relatively linear. Long-term wave erosion has resulted in bedrock bays, with widely distributed sea cliffs (10–30 m in height) and gravel beaches. The island landform comprises a long spindle shape, high in the middle and low at both ends. The east-west and north-south axes are 9.2 and 1.5 km in length, respectively, and the main peak in the center of the island is 298 m above sea level [26,27].
On the southern slopes—and in valleys and low-lying areas—of Zhifu Mountain, Laoye Mountain, and other hills, aeolian, deluvial, and proluvial deposits are widely developed. Loess (silty, loess-like deposits in lithology) deposits are also found in these areas, having a gentle slope, with a thickness of several meters to >10 m and no columnar jointing; gravel layers or mixed layers composed of gravel and clay are also common in the section. The color of the loess section gradually deepens from top to bottom, being mostly yellowish-brown and reddish-brown, while also becoming more dense and compact [24]. The climate type is warm temperate monsoon, with a prevailing East Asian monsoon; the East Asian winter monsoon (EAWM) is mostly related to a northerly wind, originating from the Mongolia-Siberian High, while the East Asian summer monsoon (EASM) is mostly related to a southerly wind, originating from the Hawaiian High in the North Pacific Ocean (Figure 1a). The average annual rainfall is 651.9 mm, the average annual temperature is 12.7 °C, and the average annual wind speed is 4–6 m/s. The vegetation is warm temperate deciduous broad-leaved forest, and the main tree types are black locust, black pine, poplar, and bamboo; shrubs are rhododendron and Carpinus turczanioides. The zonal soil is mainly brown soil and cinnamon soil [28].

2.2. Stratigraphy of the Zhifu Section

The Zhifu section (ZFS) is located in the Xikou village valley in the northwest of Zhifu Island (37°37′04″ N, 121°21′44″ E) (Figure 1b); it faces hills to the northeast and the North Yellow Sea to the southwest. The top of the ZFS is approximately 17 m above sea-level, and it has a total thickness of approximately 6 m. According to differences in lithology, the section can be divided into eight stratigraphic units. the stratigraphic division and lithological description from top to bottom are shown in Table 1. Because ZF1 is a mixed cultivation layer, ZF2 is a sandy loess layer containing abundant gravel; so, we collected 213 samples sequentially from ZF3 to ZF8 at equal intervals of 2 cm. Grain size and pH were analyzed at the State Key Laboratory of Nuclear Resources and Environment, China.

3. Experimental Methods

3.1. Geological Age Analysis

Seven samples were collected for OSL dating; the top and bottom of the ZF3 were analyzed at the Key Laboratory of Crustal Dynamics, Institute of Crustal Stress, China Earthquake Administration. The bottom of ZF3, ZF4, and ZF8, and the top of ZF6 and ZF8 were analyzed at the Qinghai Institute of Salt Lakes, Chinese Academy of Sciences. The samples were analyzed by an American Daybreak 2200 OSL analyzer.
The sampling and pretreatment process was as follows: Prepare steel pipes with a diameter of 10 cm and a length of 40 cm for sampling. First, throw away the topsoil layer and expose the fresh soil layer. Then put the black plastic bag into the steel pipe, and use the hammer to vertically drop the steel pipe into the soil layer in the horizontal direction. After the soil in the steel pipe is full, take it out, quickly wrap the other end with the black plastic bag, and seal it with tape. The sample shall not be exposed to sunlight during the whole process. Take the samples to the laboratory, open the sample under red light (wavelength 640 ± 10 nm) conditions, and take about 20 g of the central sample to determine the water, U, Th, and K content. Then take the central sample and pass it through the 180 mesh sieve. Put the sieved sample into the beaker, remove the organic matter and carbonate with 40% H2O2 and 30% HCl, add 30% fluorosilicic acid for corrosion for 5 days, and then clean to neutral with distilled water. Pour the neutral suspension into the beaker and separate the 4~11 μm particles according to the principle of hydrostatic sedimentation. Shake the separated fine particle components well, and then pour them into a funnel with stainless steel sheets. After the particles completely settled on the sheets, slowly drip all the water, and then dry in the oven at the temperature of 40 °C. The sample on each steel sheet weighs about 1 mg.

3.2. Grain Size Analysis

Grain size analysis was conducted at the State Key Laboratory of Nuclear Resources and Environment, using a Mastersizer 2000 M laser grain size analyzer with a measurement range of 0.02–2000 µm. Pretreatment carefully followed the method of Konert and Vandenberghe [29]. HCl was added to air-dried samples to remove carbonate; excess H2O2 was then added to remove organic matter, followed by 10 mL of 0.05 mol/L (NaPO3)6 dispersant. After standing for 24 h, the supernatant was removed and the sample was diluted to an appropriate concentration. Further disaggregation was conducted using an ultrasonic cleaner for 1 min before measurement. The grain sizes were divided into 101 grades: Sizes of 100–2000 μm refer to the decimal system, while sizes of <100 μm refer to the general classification principle of Chinese loess [30]. Grain size sub-populations were classified as clay (<5 μm), fine silt (5–10 μm), coarse silt (10–50 μm), very fine sand (50–100 μm), fine sand (100–250 μm), medium sand (250–500 μm), and coarse sand (500–1000 μm). The mean grain size (Mz), Sorting coefficient (σ), Skewness (Sk), and Kurtosis (Kg) were calculated based on the formula of Folk and Ward [31]: Mz = (Φ16 + Φ50 + Φ84)/3; σ = (Φ84−Φ16)/4−(Φ95−Φ5)/6.6; Sk = (Φ84 + Φ16−2Φ50)/2(Φ84−Φ16) + (Φ95 + Φ5−2Φ50)/2(Φ95−Φ5); Kg = (Φ95−Φ5)/2.44(Φ75−Φ25).

3.3. pH Analysis

The pH was analyzed using a Shanghai Leici PHS-3C acidity meter. The pretreatment and analysis procedures were as follows. Air-dried samples were fully mixed through an 18-mesh sieve, then weighed into 5 g samples and placed in a 50 mL beaker. According to a 5:1 water/soil ratio, 25 mL pure water was added to fully soak the sample, then stirred with a glass rod for 3–5 min and left to settle for 30 min prior to analysis. Each sample was tested three times and the average value was taken.

4. Results

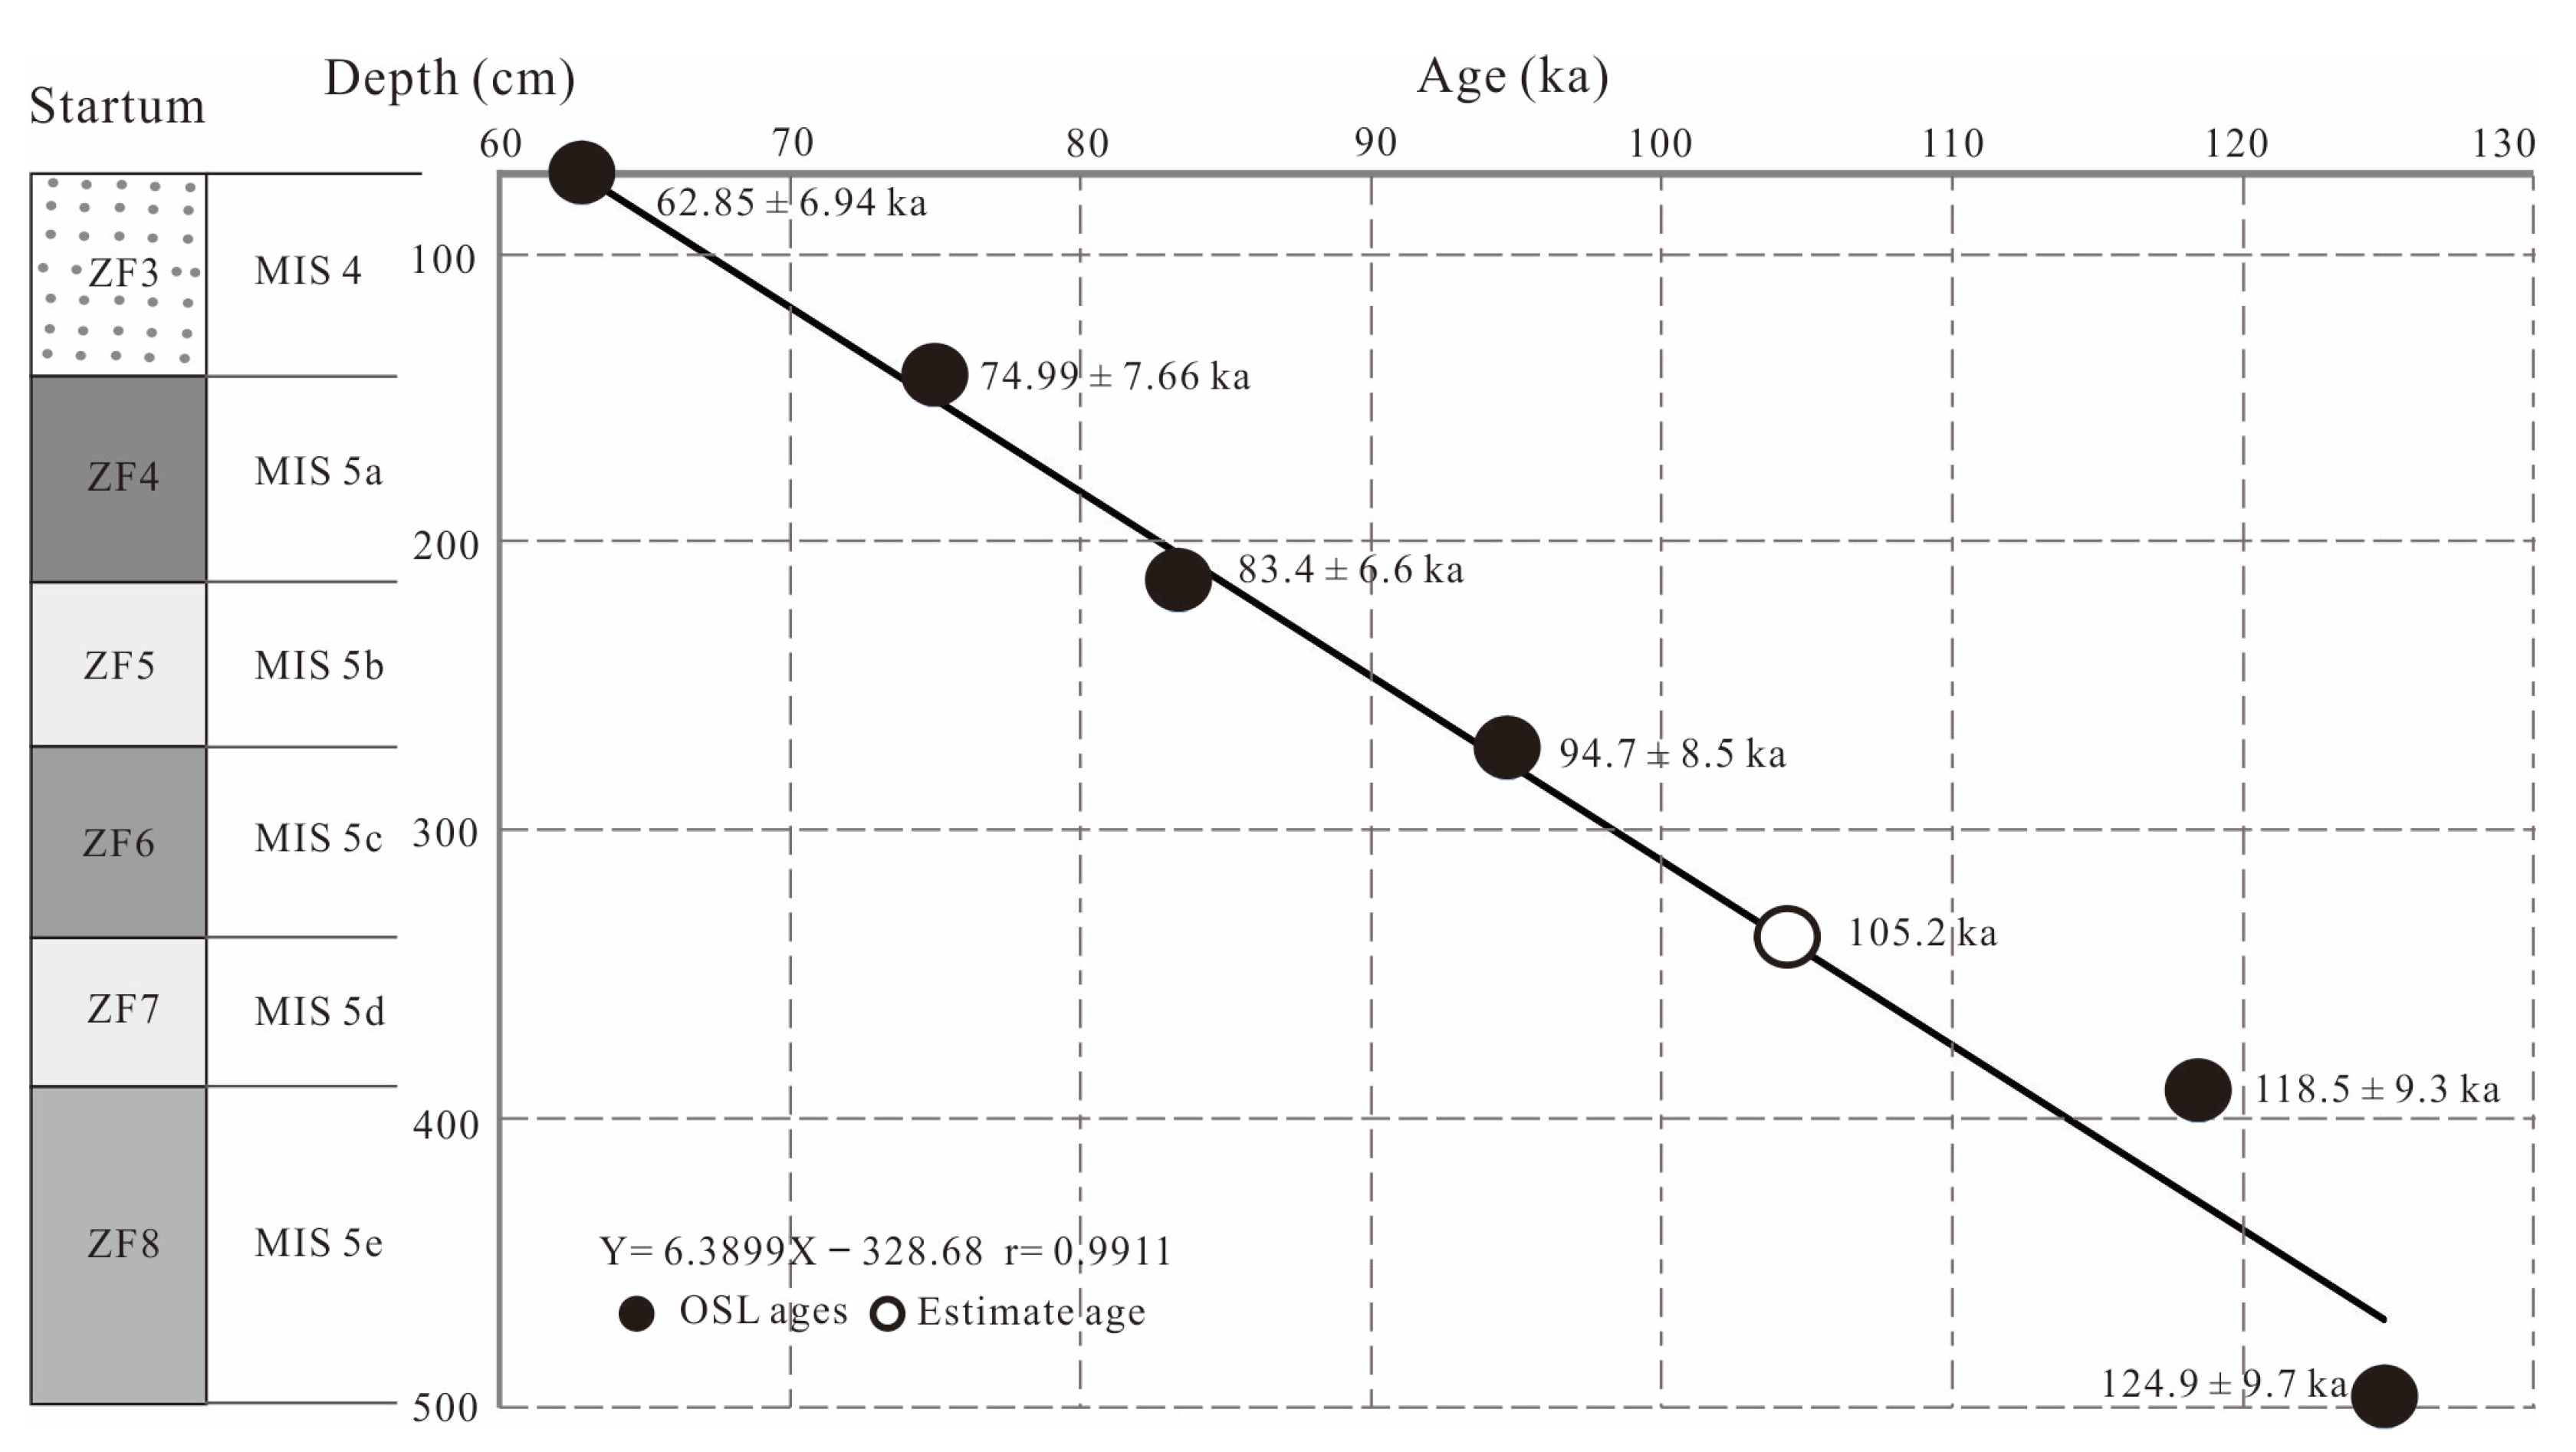
4.1. Chronological Framework

The ages obtained from OSL dating of seven samples are listed in Table 2, while the relationship between chronology and depth is shown in Figure 2, where a strong linear relationship with a correlation coefficient of r = 0.9904 can be observed. The geological age at the base of the ZF8 was 124.9 ± 9.7 ka, and parallel samples at the base of ZF3 gave dates of 70.18 ± 9.67 and 79.8 ± 5.64 ka, respectively; their average value of 74.99 ka corresponds to the beginning of MIS 5 [32]. The sedimentation rate was calculated according to the ages of the top of ZF6 and ZF8, and then used to infer the age of the base of ZF7 (Figure 2). On the basis of the lithological characteristics and ages of each stratum, and comparison with MISs, we consider ZF3 as deposited at 62.85–74.99 ka, corresponding to early-middle MIS 4. Hence, units ZF4-ZF8 belong to MIS 5. All chronological ranges and corresponding MISs of each stratum are shown in Table 3.

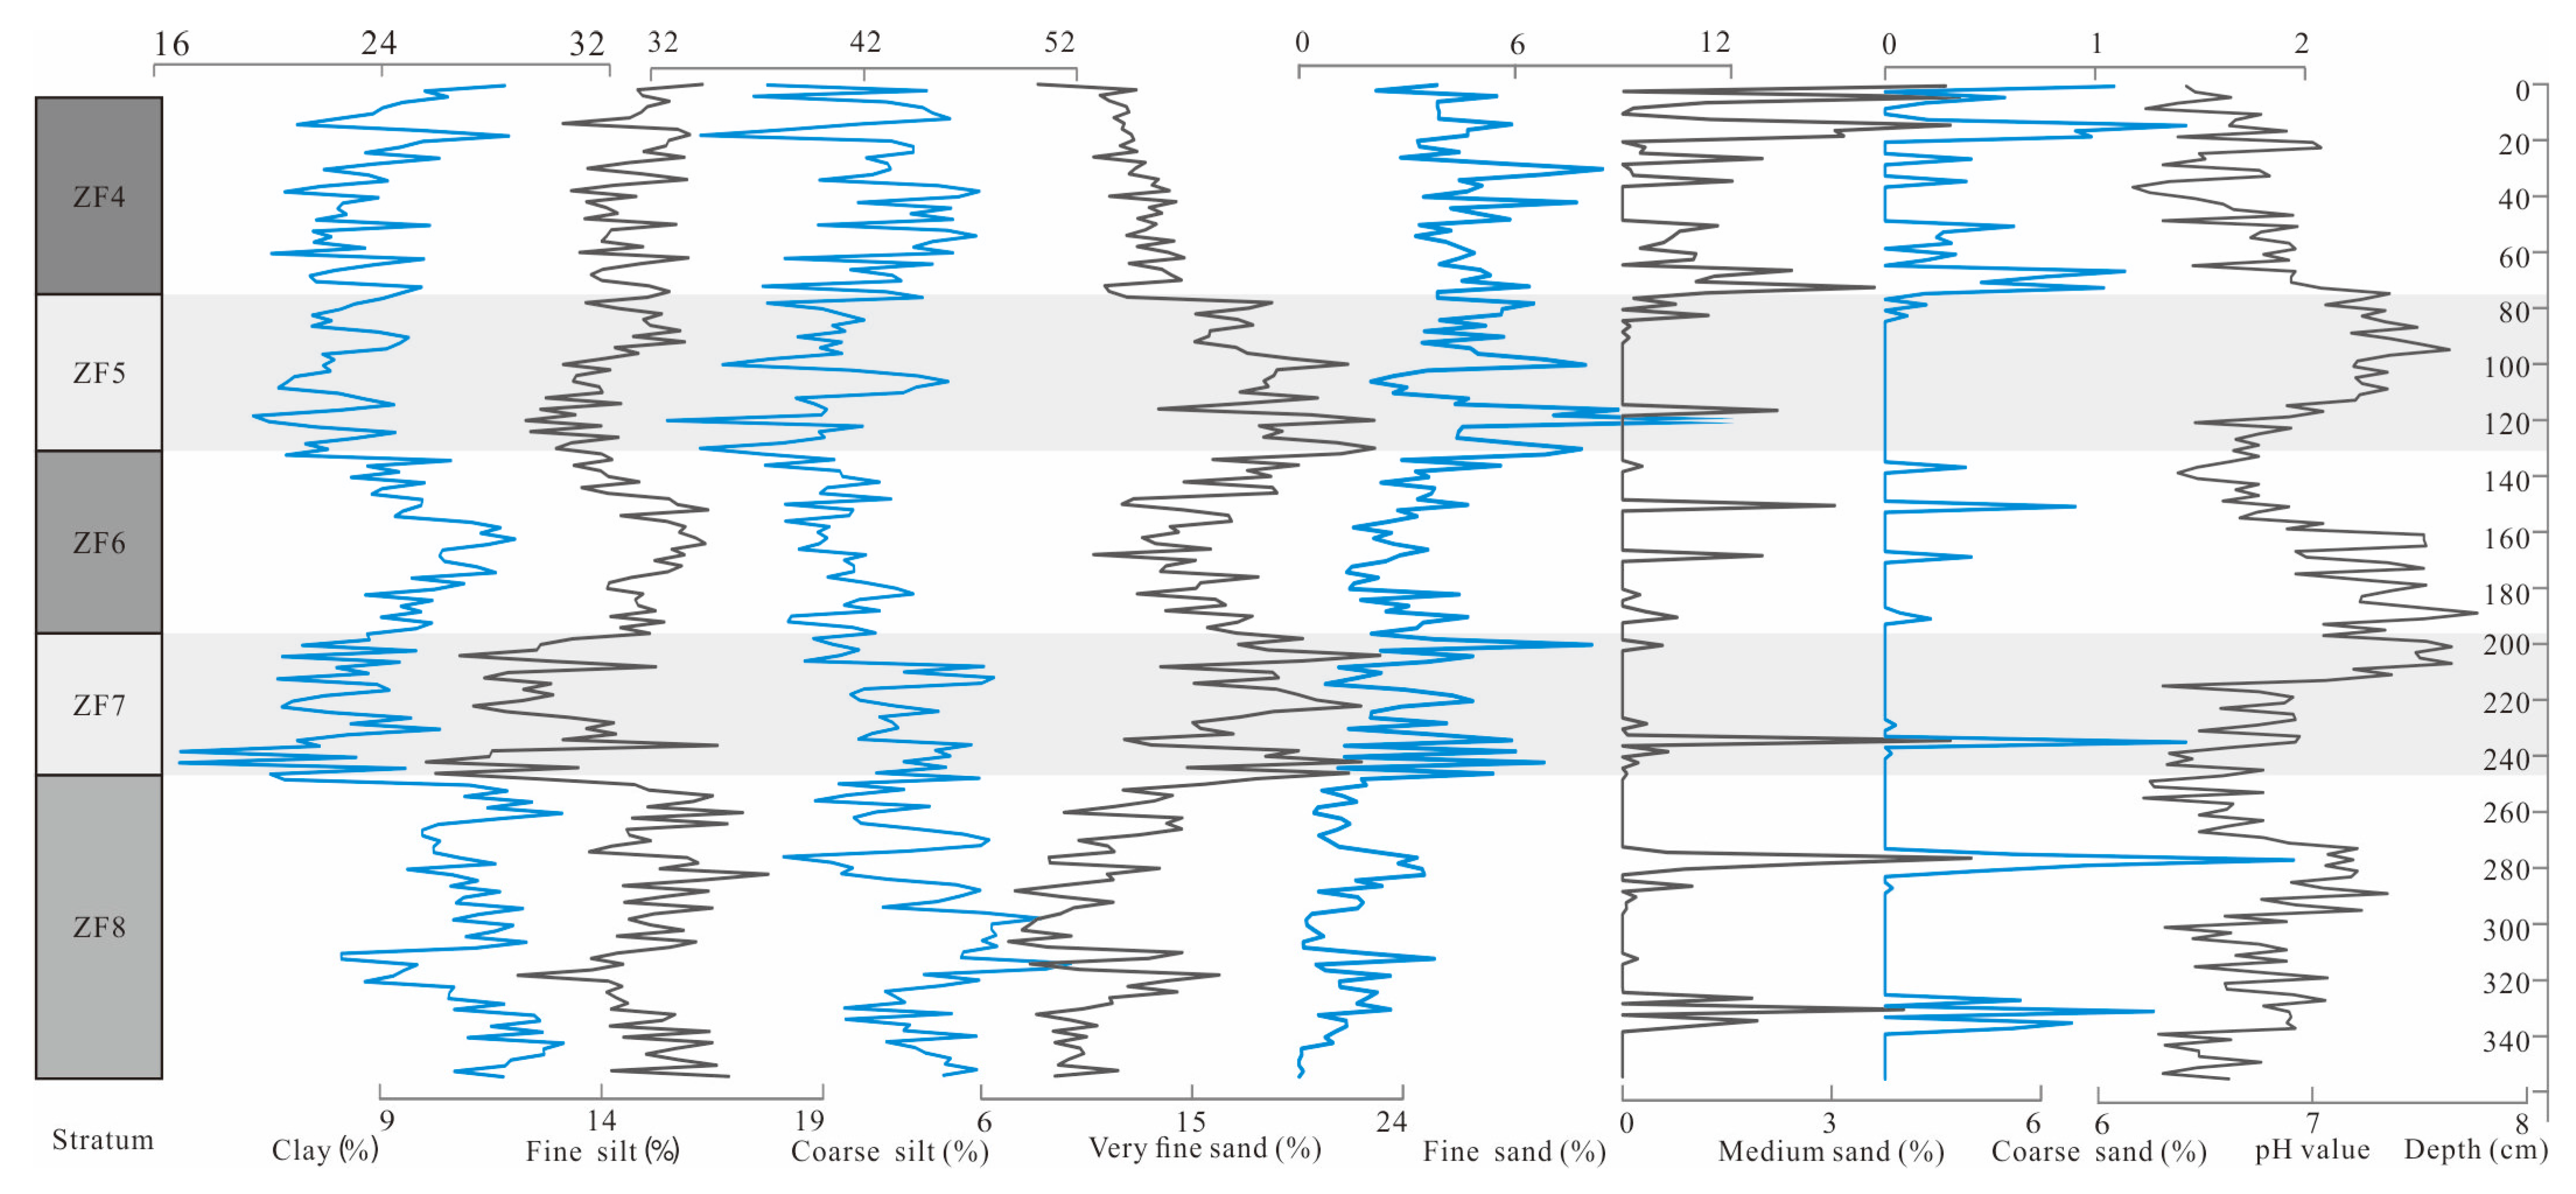
4.2. Grain Size Results

The grain size during MIS 5 mainly comprised silt (5–50 μm), followed by clay (<5 μm) and sand (50–2000 μm), with average proportions and distribution ranges of 57.32% (45.02–66.22%), 24.60% (16.87–30.38%), and 18.08% (7.36–34.98%), respectively; the Mz was 6.16 Φ (5.55–6.58 Φ). In the paleosol units ZF4, ZF6, and ZF8, these values were 58.35% (50.31–66.22%), 25.63% (20.10–30.38%), 16.01% (7.26–25.81%), and 6.25 Φ (5.85–6.58 Φ), respectively. In the loess units ZF5 and ZF7, these values were 55.13% (45.02–63.67%), 22.42% (16.87–27.08%), 22.45% (14.52–34.98%), and 5.96 Φ (5.55–6.26 Φ), respectively. The changes in each sub-grain size component with stratigraphic depth are shown in Figure 3.
EM analysis can accurately extract the sensitive grain sizes of sediments with different provenances and transport strengths, and can decode grain size characteristics to reflect the sedimentary environment [33]. In this paper, the AnalySize plug-in designed by Paterson and Heslop [34] was imported into MATLAB for calculation, and the Weibull function parametric method was used to extract the grain size EM components. During the analysis, the number of EMs was determined by linear correlation and angular deviation (Figure 4). A higher linear correlation and smaller angular deviation equates to a better fitting degree between the parameterized grain size EM curve and grain size frequency curve. When the linear correlation is >0.95 and angular deviation is <5°, this indicates a good extraction effect of the EM number quantity [34,35]. Figure 4a shows that the linear correlation increased with a greater number of EMs. When the number of EMs increased from 1 to 3, the slope of the linear segment was relatively steep, and the multiple correlation coefficient (R2) value increased rapidly to 0.988, reflecting a good overall fitting degree. The R2 growth trend was not obvious when the number of EMs was ≥4. Figure 4b shows that the angular deviation decreased with an increase in the number of EMs. When the number of EMs increased from 1 to 3, the angular deviation value decreased rapidly to 4.9°, but the decrease rate slowed substantially when the number of EMs was ≥4. Therefore, we determined the optimal number of grain size EMs to be 3; these were named EM1, EM2, and EM3, respectively.
Figure 5a shows the frequency distribution curves of representative samples of each stratum. Each sample exhibited a bimodal state: a main mode was located in the coarse silt-fine sand interval of 20–70 μm, and a secondary mode was located in the silt interval of 3–10 μm, representing two different dynamic environments. Figure 5b shows three EM components of the ZFS; the modal grain size of EM1 was 6.45 μm and Mz was 4.86 μm, belonging to the clay-fine silt fraction; σ was 2.87, indicating poor sorting (clay content was 41.17%, silt content was 58.70%, and sand content was 0.14%); Sk was −0.44, representing an extremely negative deviation distribution; Kg was 3.14, indicating a very narrow peak. The modal grain size of EM2 was 35.62 μm and Mz was 27.11 μm, belonging to the coarse silt grain size; the σ was 1.94, indicating poor sorting (clay content was 1.14%, silt content was 92.90%, and sand content was 5.96%); Sk was −0.78, being extremely negative; and Kg was 3.97, representing a very narrow peak, and significantly narrower than EM1. The modal grain size of EM3 was 65.58 μm and Mz was 53.61 μm, belonging to very fine sand; the σ was 1.91, indicating poor sorting (clay content was 0.18%, silt content was 58.53%, and sand content was 41.29%); Sk was −0.82, again extremely negative; and Kg was 4.09, again representing a very narrow peak. In summary, it can be seen that EM1 was finer-grained, equating to a fine clay EM component; EM2 and EM3 were similar to each other, equating to coarse silt and very fine sand component endmembers, respectively.
The average percentages of EM1, EM2, and EM3 were 49.57%, 26.95%, and 23.48%, respectively. The content within different sedimentary facies varied greatly. EM1 content was lower in the loess than in the paleosol, with an average content of 44.76% in the former, comprising 47.02% in ZF5 and 42.42% in ZF7. The average EM1 content in the paleosol was 51.83%, comprising 51.66% in ZF4, 52.15% in ZF6, and 51.78% in ZF8. In contrast, EM2 and EM3 contents were relatively high in the loess (averages of 21.77% and 33.47%, respectively) and relatively low in the paleosol (averages of 29.72% and 18.44%, respectively). The average contents of EM2 in ZF5 and ZF7 were 17.15% and 25.66%, respectively, and those of EM3 were 35.83% and 31.02%, respectively. In the paleosol units ZF4, ZF6, and ZF8, the average contents of EM2 were 28.15%, 21.79%, and 35.48%, respectively, and those of EM3 were 20.19%, 26.06%, and 12.74%, respectively.
In order to clarify the relationships between EMs, we performed correlation analyses, which showed significant negative correlations between EM3 and EM2 (r = −0.8447) and between EM3 and EM1 (r = −0.5456); there was no correlation between EM2 and EM1. Simultaneously, we performed correlation analyses between Mz and EM1 as well as between Mz and EM3, which gave correlation coefficients of 0.6522 and −0.8338, respectively (Figure 6). Therefore, we infer that these EMs represent at least two different transport forces; EM1 represents a weak dynamic environment, and EM3 represents a strong dynamic environment.

4.3. pH Results

The average pH value and variation range was 6.87 (6.16–7.77), and the variation curve with depth is shown in Figure 3. In the paleosol units ZF4, ZF6, and ZF8, pH values were 6.68 (6.16–7.36), 7.07 (6.37–7.77), and 6.76 (6.21–7.35), respectively. In the loess units ZF5 and ZF7, they were 7.09 (6.45–7.64) and 6.87 (6.24–7.65), respectively.

5. Discussion

The ZFS was composed of loess and paleosol during the MIS 5 period; the above experimental results show that the climate proxies fluctuated frequently (Table 4 and Figure 7). Their environmental significance and climatic characteristics are described below.

5.1. Environmental Significance of Climate Proxies

The Mz value reflects the average condition of the sediment grain size, which can indicate the transport intensity, degree of drought in the source area, and transport distance [37,38]. Variations in Mz are not only affected by weathering pedogenesis of the EASM, but also reflect the dust influx rate and dust-bearing strength of the EAWM [6]. A high Mz value represents weak transport intensity and a long transport distance, indicating a warm-humid environment, and a low value represents a strong transport effect and short transport distance, indicating a cold-dry environment [6,30]. The clay content mainly represents fine-particle material formed in the later weathering process, and is used to reflect weathering intensity [30]. EM1 was finer-grained; its Mz was 4.86 μm, equating to a fine clay EM component. EM3 equates to a coarse silt EM component; its Mz is 53.61 μm. Overall, larger values of Mz, EM1, and clay content and smaller values of EM3 equate to weaker dynamic conditions, a warmer climate, and a stronger weathering pedogenesis effect. In contrast, smaller values of Mz, EM1, and clay content and larger values of EM3 equate to stronger dynamic conditions, a colder and drier climate, and a weaker weathering pedogenesis effect.
The pH value is a good indicator for describing the process of soil development and maturation, which mainly reflects changes in precipitation. When the climate is humid, luxuriant vegetation grows, biochemical weathering and leaching is strong, and a large quantity of K+, Na+, Ca2+, and other metal ions adsorbed by soil colloids are leached, leading to an increase in free H+ in the soil, which then results in an enhancement of acidity and decrease in pH value. When the climate is dry and cold, vegetation is sparse, biochemical weathering and leaching is weak, and the leaching degree of K+, Na+, Ca2+, and other metal ions is low, leading to a reduction in free H+ in the soil, which then results in a weakening of acidity and increase in pH value [39]. Related research on the Chinese Loess Plateau (CLP) shows that a high pH corresponds to a strong EAWM and loess deposition period, with a cold-dry climate and weak leaching effect. A low pH corresponds to a strong EASM and paleosol deposition period, with a warm-humid climate and enhanced leaching process, which is conducive to the leaching of soluble elements and accumulation of insoluble elements [39].

5.2. Evolution of the EASM in the ZFS

5.2.1. ZF4

The geological age of ZF4 is 74.99–83.4 ka, corresponding to MIS 5a. In this stage, the average Mz was 6.13 Φ, slightly lower than the average Mz of MIS 5 (6.16 Φ); the average clay content was 23.63%, also slightly lower than the average of MIS 5 (24.60%), showing a slight peak (Figure 2). Among the three EMs, the average EM1 content was 51.66%, significantly higher than the MIS 5 average of 49.57%, and showed a significant peak. In contrast, the average EM3 content was 20.19%, lower than the MIS 5 average of 23.26%, showing a significant trough. These patterns indicate a strong weathering pedogenesis effect. The pH also gradually increased from top to bottom, with an average of 6.50; this is lower than MIS 5 average of 6.87, and shows the lowest value and weak acidity. This indicates a strong leaching effect and high concentration of free H+ in the soil, related to a climatic environment with abundant precipitation.
This climatological feature corresponds to a peak value of Northern Hemisphere summer insolation in July (NHSI) at 30° N [36], indicating that the received solar radiation was high, climate was warm, Hawaiian High originating in the Pacific Ocean was enhanced, EASM intensity was enhanced, and precipitation increased. It also corresponds to the strong summer monsoon period of MIS 5a in the δ18O record of stalagmites in the subtropical zone of China [10]. In the western part of the CLP, the Tuxiandao (TXD) Section developed S1S1 paleosol, and the median particle size (Md) showed a valley, indicating a weak EAWM [7]. It also corresponds to the Upper Cangzhou transgression in the Yellow and Bohai Seas [14], reflecting a warm and humid climate with abundant precipitation. Therefore, we consider that this stage was a warm and humid period under the background of an enhanced summer monsoon.

5.2.2. ZF5

The geological age of ZF5 is 83.4–94.7 ka, corresponding to MIS 5b. In this stage, the average Mz was 5.95 Φ, average clay content was 22.44%, and average EM1 content was 47.02%, all being significantly lower than the MIS 5 averages and corresponding to distinct troughs. The average EM3 content was 35.83%, the highest value observed throughout MIS 5. These characteristics indicate a cold–dry environment with strong transport power and weak weathering pedogenesis effect. The pH showed a trend of increasing at first and then decreasing with depth; it was >7 in the upper part of the unit and <7 in the lower part, varying from 6.45 to 7.64, with an average of 7.09. This is higher than the MIS 5 average and weakly alkaline. This indicates that the leaching effect was weak, leading to a decrease in the concentration of free H+ in the soil, corresponding to a climatic environment with less precipitation.
This climatic feature corresponds to a trough value of NHSI at 30° N [36], indicating that the received solar radiation was low, leading to a temperature decrease and climate cooling, together with a strengthening of the Mongolia–Siberian High, leading to an enhancement of the EAWM. It also corresponds to the weakening summer monsoon period of MIS 5b in the δ18O record of stalagmites in the subtropical zone of China [10]. In the western part of the CLP, the TXD Section developed S1L1 loess, and the Md showed a peak value, indicating a strong EAWM [7]. In this stage, the sea level of the Yellow and Bohai Seas dropped; the Bohai Sea was exposed as land and a thin layer of continental deposits was formed [14]. Therefore, we consider this stage as a relatively cold and dry period under the background of an enhanced EAWM, with relatively low precipitation and a weak leaching effect.

5.2.3. ZF6

The geological age of ZF6 is 94.7–105.2 ka, corresponding to MIS 5c. In this stage, the average Mz was 6.20 Φ and average clay content was 25.63%, both being slightly higher than the MIS 5 average. The average EM1 content was 52.15%, the highest value observed in MIS 5. The average EM2 + EM3 content was 47.85%, significantly lower than the MIS 5 average, indicating a warm-humid environment with strong weathering pedogenesis. The pH gradually decreased from top to bottom (from 7.77 to 6.37), with an average of 7.09; this is higher than the average MIS 5 pH, indicating that precipitation and leaching degree gradually increased and the free H+ concentration in the soil increased.
This variation corresponds to a peak value of BHSI at 30° N [36], indicating that the amount of solar radiation received by the land increased and the Hawaiian High strengthened, enhancing the strength of the EASM. It also corresponds to the strong summer monsoon period of MIS 5c in the δ18O record of stalagmites in the subtropical zone of China [10], and in the western part of the CLP, the TXD Section developed S1S2 paleosol, and Md showed a valley, indicating a weak EAWM [7]. It also corresponds to a sea-level rise period in the Yellow and Bohai Seas. The Bohai Sea had once again become ocean, via an event known as the Central Cangzhou transgression [14]. Therefore, we consider that this stage was a warm and humid period under the background of an enhanced EASM, and the leaching effect was strong.

5.2.4. ZF7

The geological age of ZF7 is 105.2–118.5 ka, corresponding to MIS 5d. In this stage, the average Mz was 5.98 Φ, average clay content was 22.40%, and average EM1 content was 42.42%, significantly lower than the MIS 5 averages, and corresponding to low troughs. The average EM3 content was 31.02%, significantly higher than MIS 5 average, and representing the second-highest value in the section. These patterns indicate a cold-dry environment with a weak weathering pedogenesis effect. The pH showed a peak value of >7 in the upper part of the unit, and decreased rapidly to <7 in the lower part; it had a range of 6.24–7.65 with an average of 6.87, which is close to the MIS 5 average, and indicates a climatic environment with low precipitation and weak eluviation.
This variation corresponds to a trough value of NHSI at 30° N [36], indicating that the amount of solar radiation received by the land decreased, temperature was reduced, and the Mongolian–Siberian High over Eurasia was enhanced, resulting in an enhanced EAWM. Chinese stalagmite δ18O records show that MIS 5d was a period of summer monsoon weakening [10], and in the western part of the CLP, the TXD Section developed S1L2 loess, and the Md showed a peak value, indicating a strong EAWM [7]. It is also corresponded to a period of sea-level decline in the Yellow and Bohai Seas. The Bohai Sea was once again exposed as land and a thin layer of continental sediment was deposited [14]. Therefore, we consider that this stage was a relatively cold–dry period under the background of summer monsoon weakening, with a weak leaching effect.

5.2.5. ZF8

The geological age of ZF8 is 118.5–124.9 ka, corresponding to MIS 5e. In this stage, the average Mz was 6.38 Φ, average clay content was 27.14%, and average EM1 content was 51.78%, all being significantly higher than the MIS 5 averages, showing the highest peaks in the section. The EM3 percentage content was 12.74%, significantly lower than the MIS 5 average, showing the lowest trough in the section; this phenomenon indicates a warm-humid environment with a particularly strong weathering pedogenesis effect. The pH showed alternating peaks and troughs, varying between 6.21 and 7.35, with an average of 6.83; this is lower than the MIS 5 average, corresponding to a significant trough value and indicating that the leaching effect was strong, concentration of free H+ in the soil was high, and the climatic environment was characterized by abundant precipitation.
This variation corresponds to the highest peak of NHSI at 30° N during the MIS 5 period [36], indicating that the amount of solar radiation received was at its highest and the climate was at its warmest. It also corresponds to the strong summer monsoon period of MIS 5e recorded in the stalagmite δ18O record of China [10], and in the western part of the CLP, the TXD Section developed S1S3 paleosol and Md showed a valley, indicating the weakest EAWM [7]. It also corresponds to a sea-level rise period of the Yellow and Bohai Seas. The Bohai Sea had once again become ocean via an event known as the Lower Cangzhou transgression [14]. Therefore, we consider the EASM during this stage as significantly enhanced, leading to the warmest and wettest geological period in MIS 5, and the leaching effect as particularly strong.
From the above analysis, it can be seen that MIS5e, 5c and 5a were three warm stages during the last interglacial period. In the MIS5e stage, Mz and clay content are the highest, and EM1 content is the second highest value, slightly lower than MIS5c. EM3 content presents the lowest value, and the pH is the second lowest value, slightly higher than MIS5a. This indicates the weakest transport force and the strongest weathering and eluviation, proving that the MIS5e stage is the warmest and wettest stage. At this stage, corresponding to the highest value of NHSI at 30° N [36], the most solar radiation energy is received and the global temperature rises. The stalagmite data shows that the EASM is the strongest [10], the TXD section of CLP shows that the EAWM is the weakest [7], and the polar ice core also shows that this stage is the warmest [2,3]. Therefore, MIS5e is the warmest and wettest stage of the last interglacial.

6. Conclusions

By analyzing variations in grain size and pH within a loess–paleosol sequence covering the MIS 5 period of the ZFS, and comparing these with other climatic indicators, we draw the following conclusions:
(1)
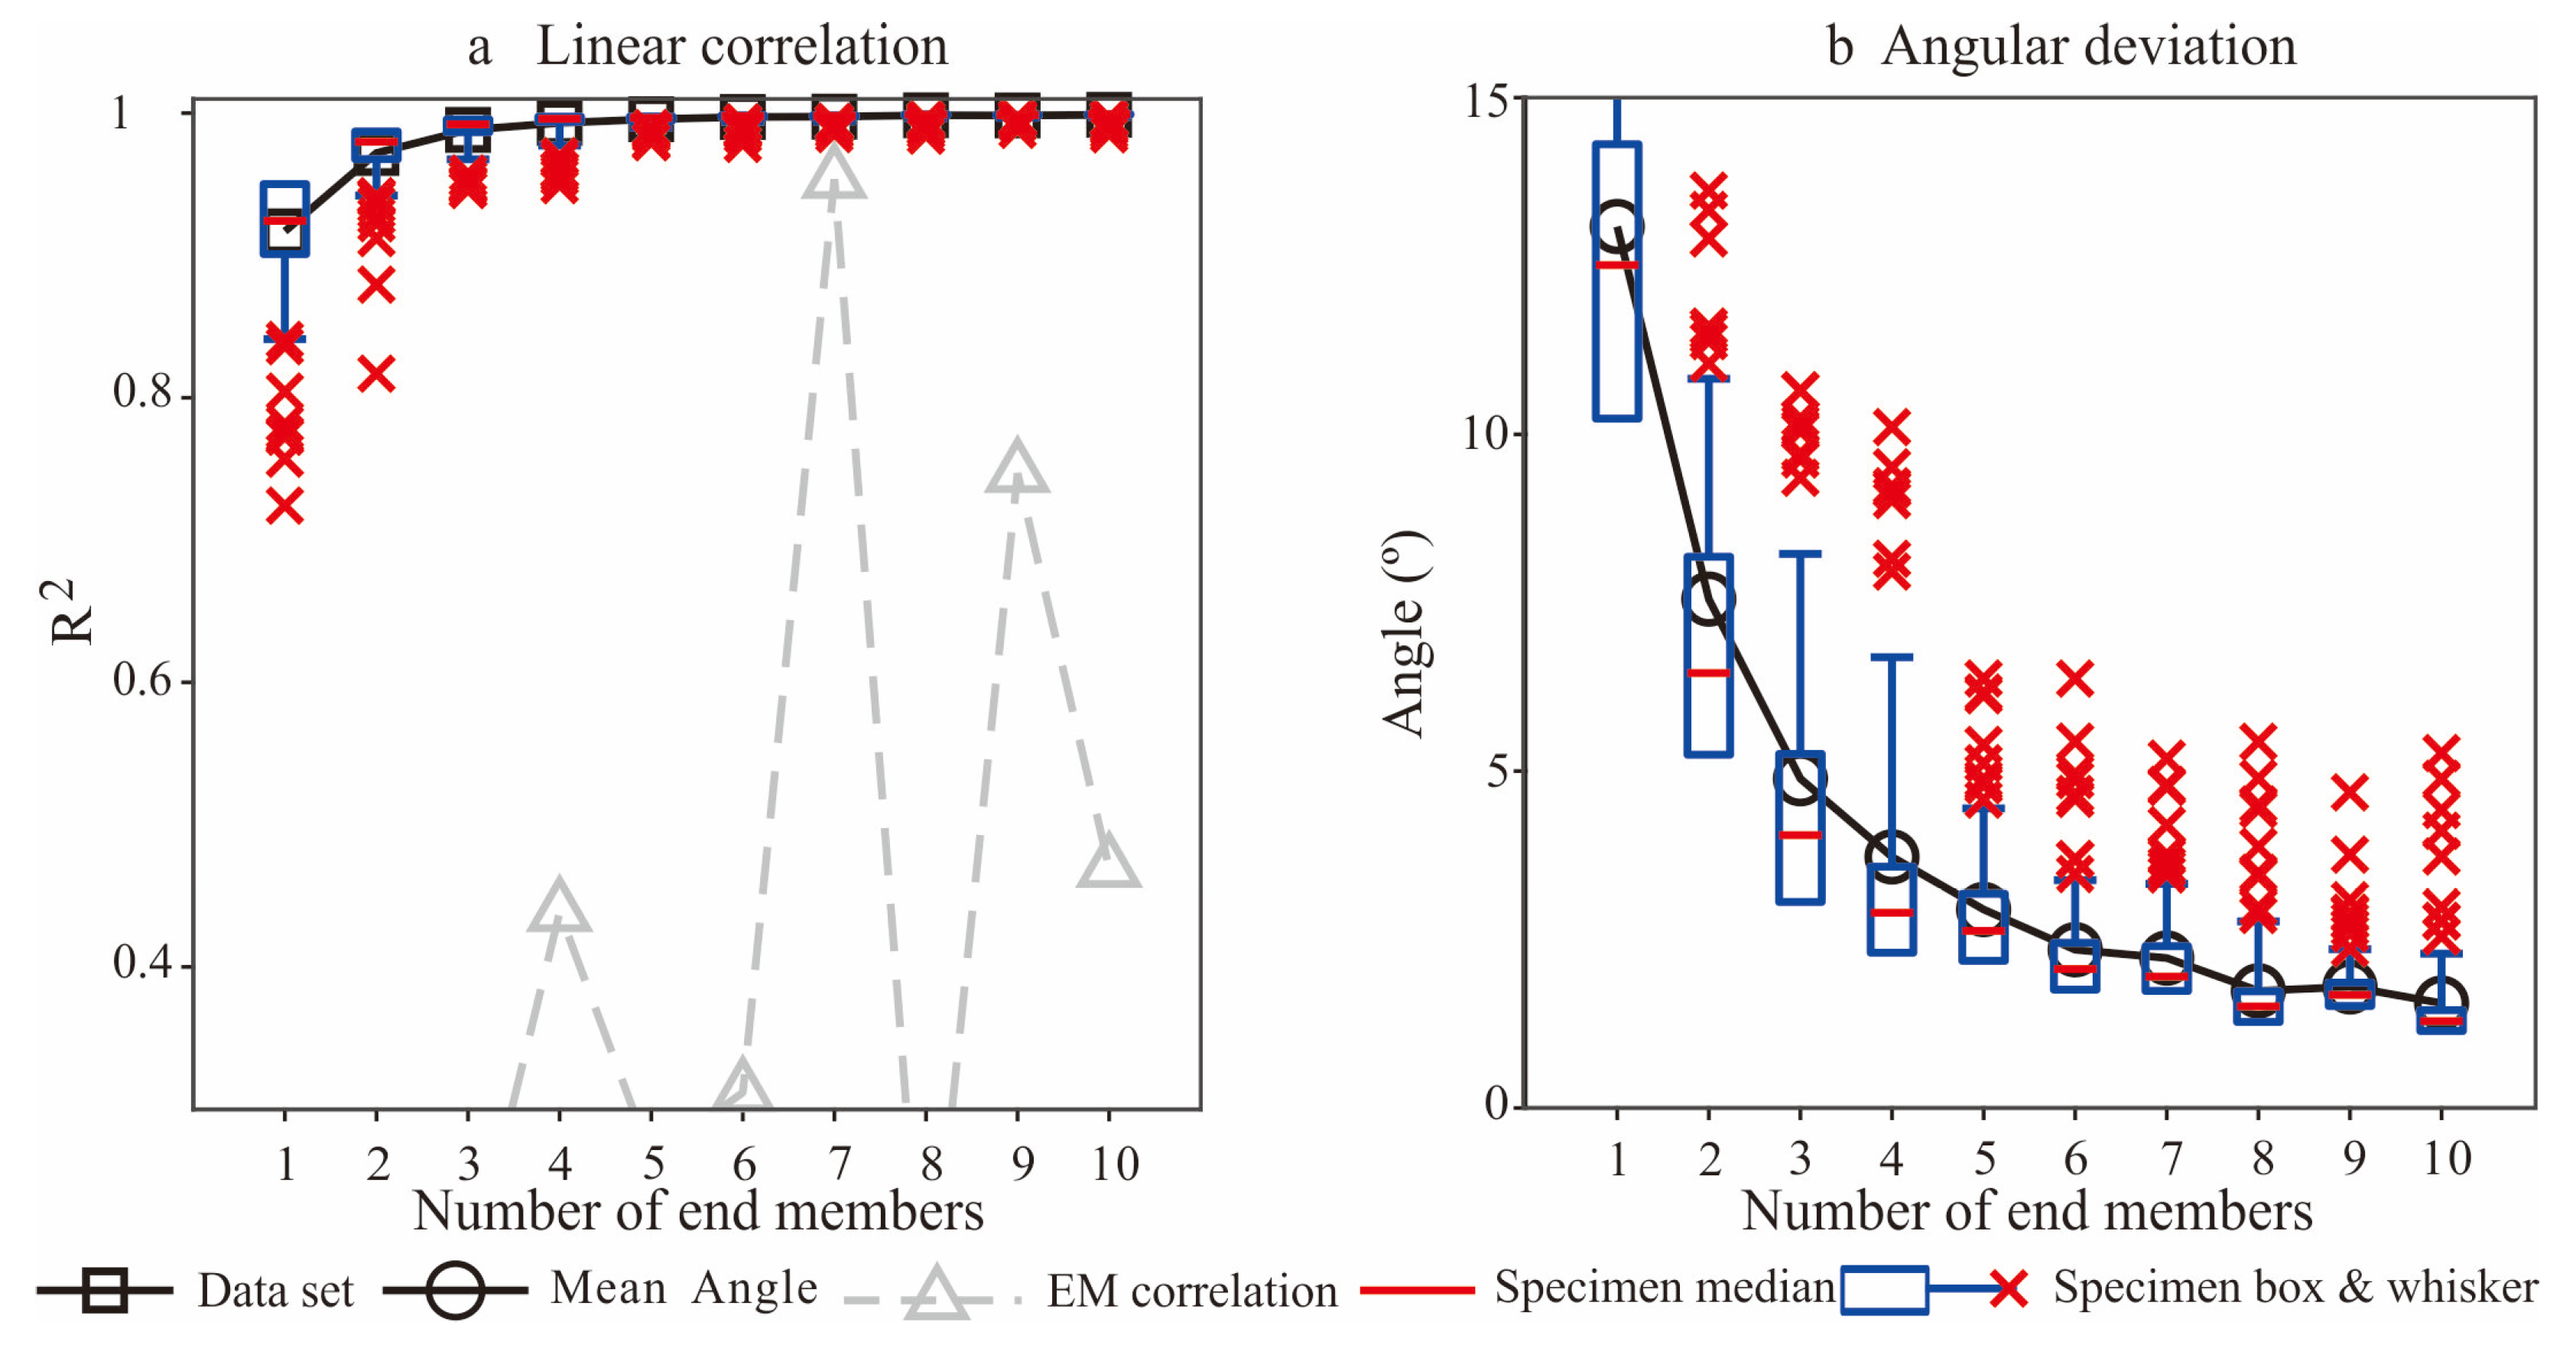
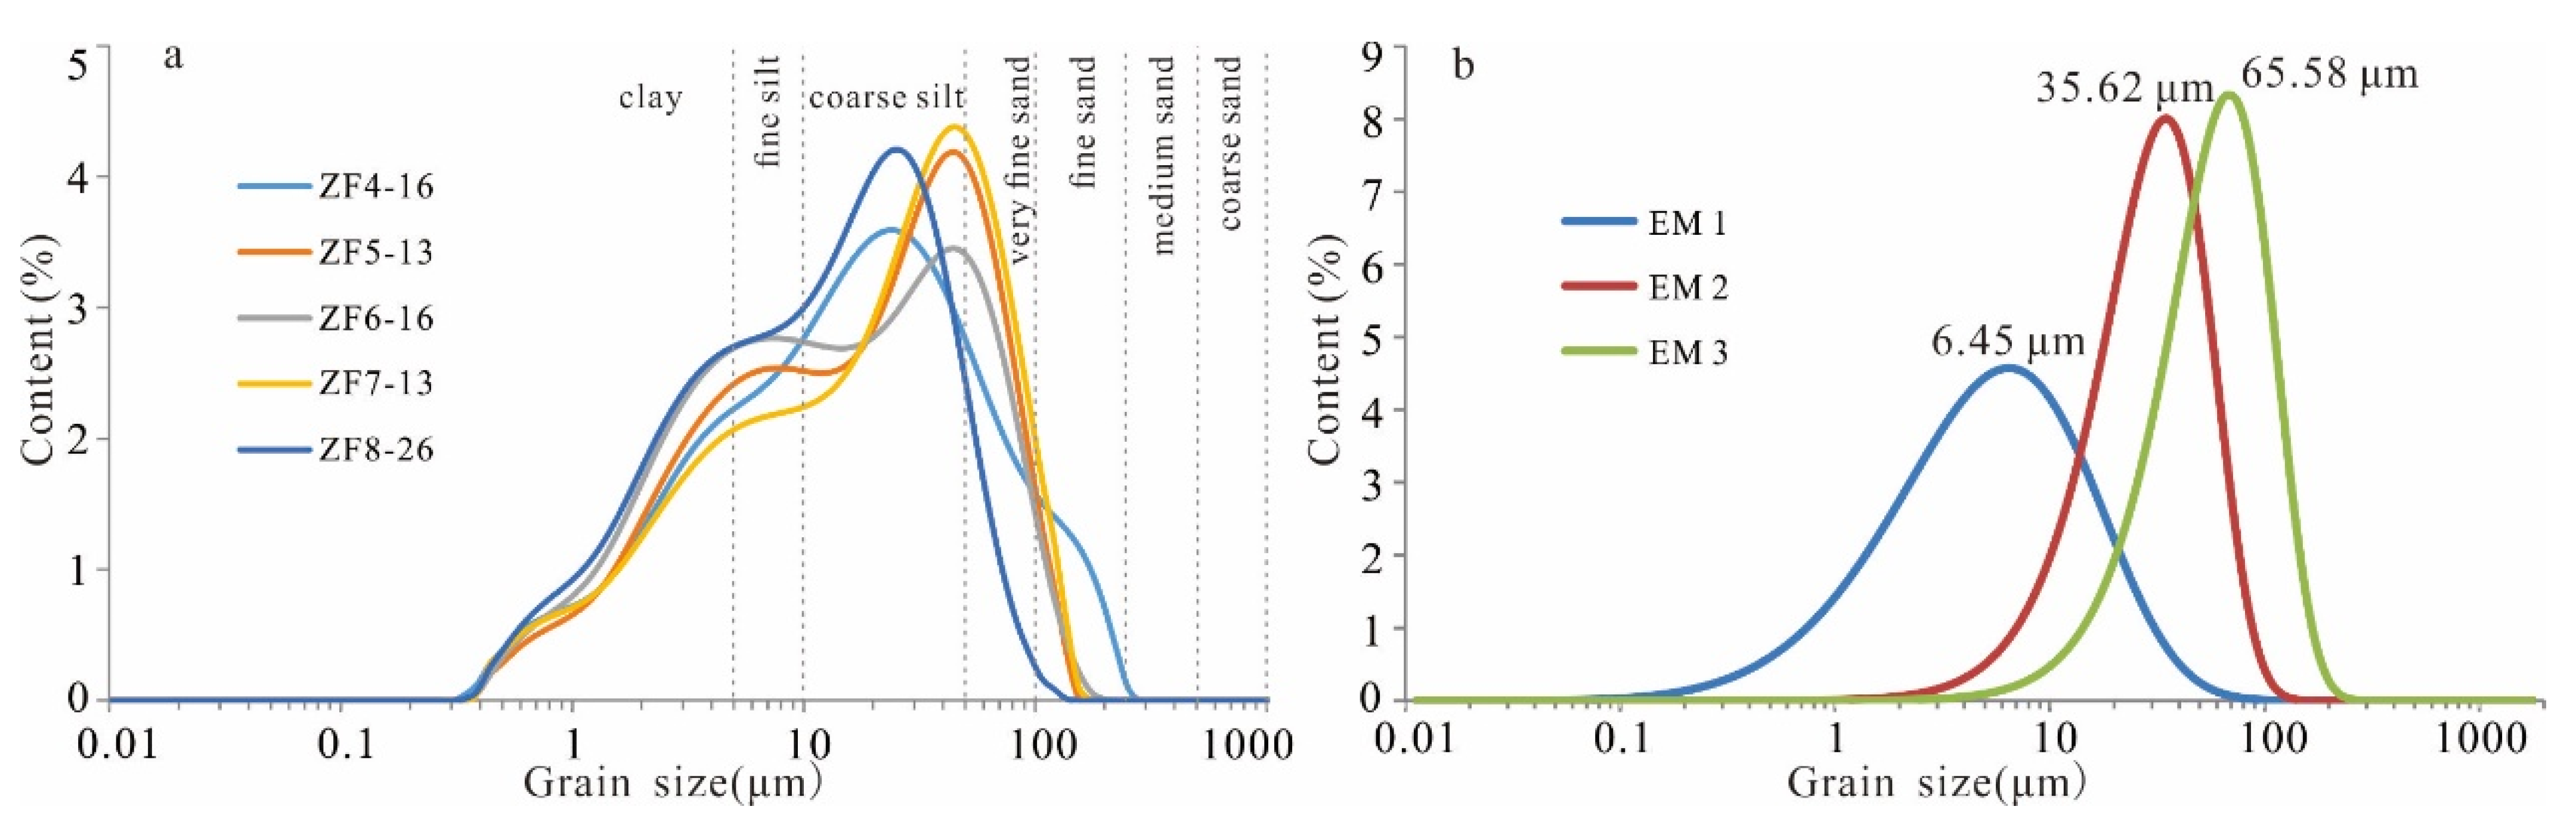
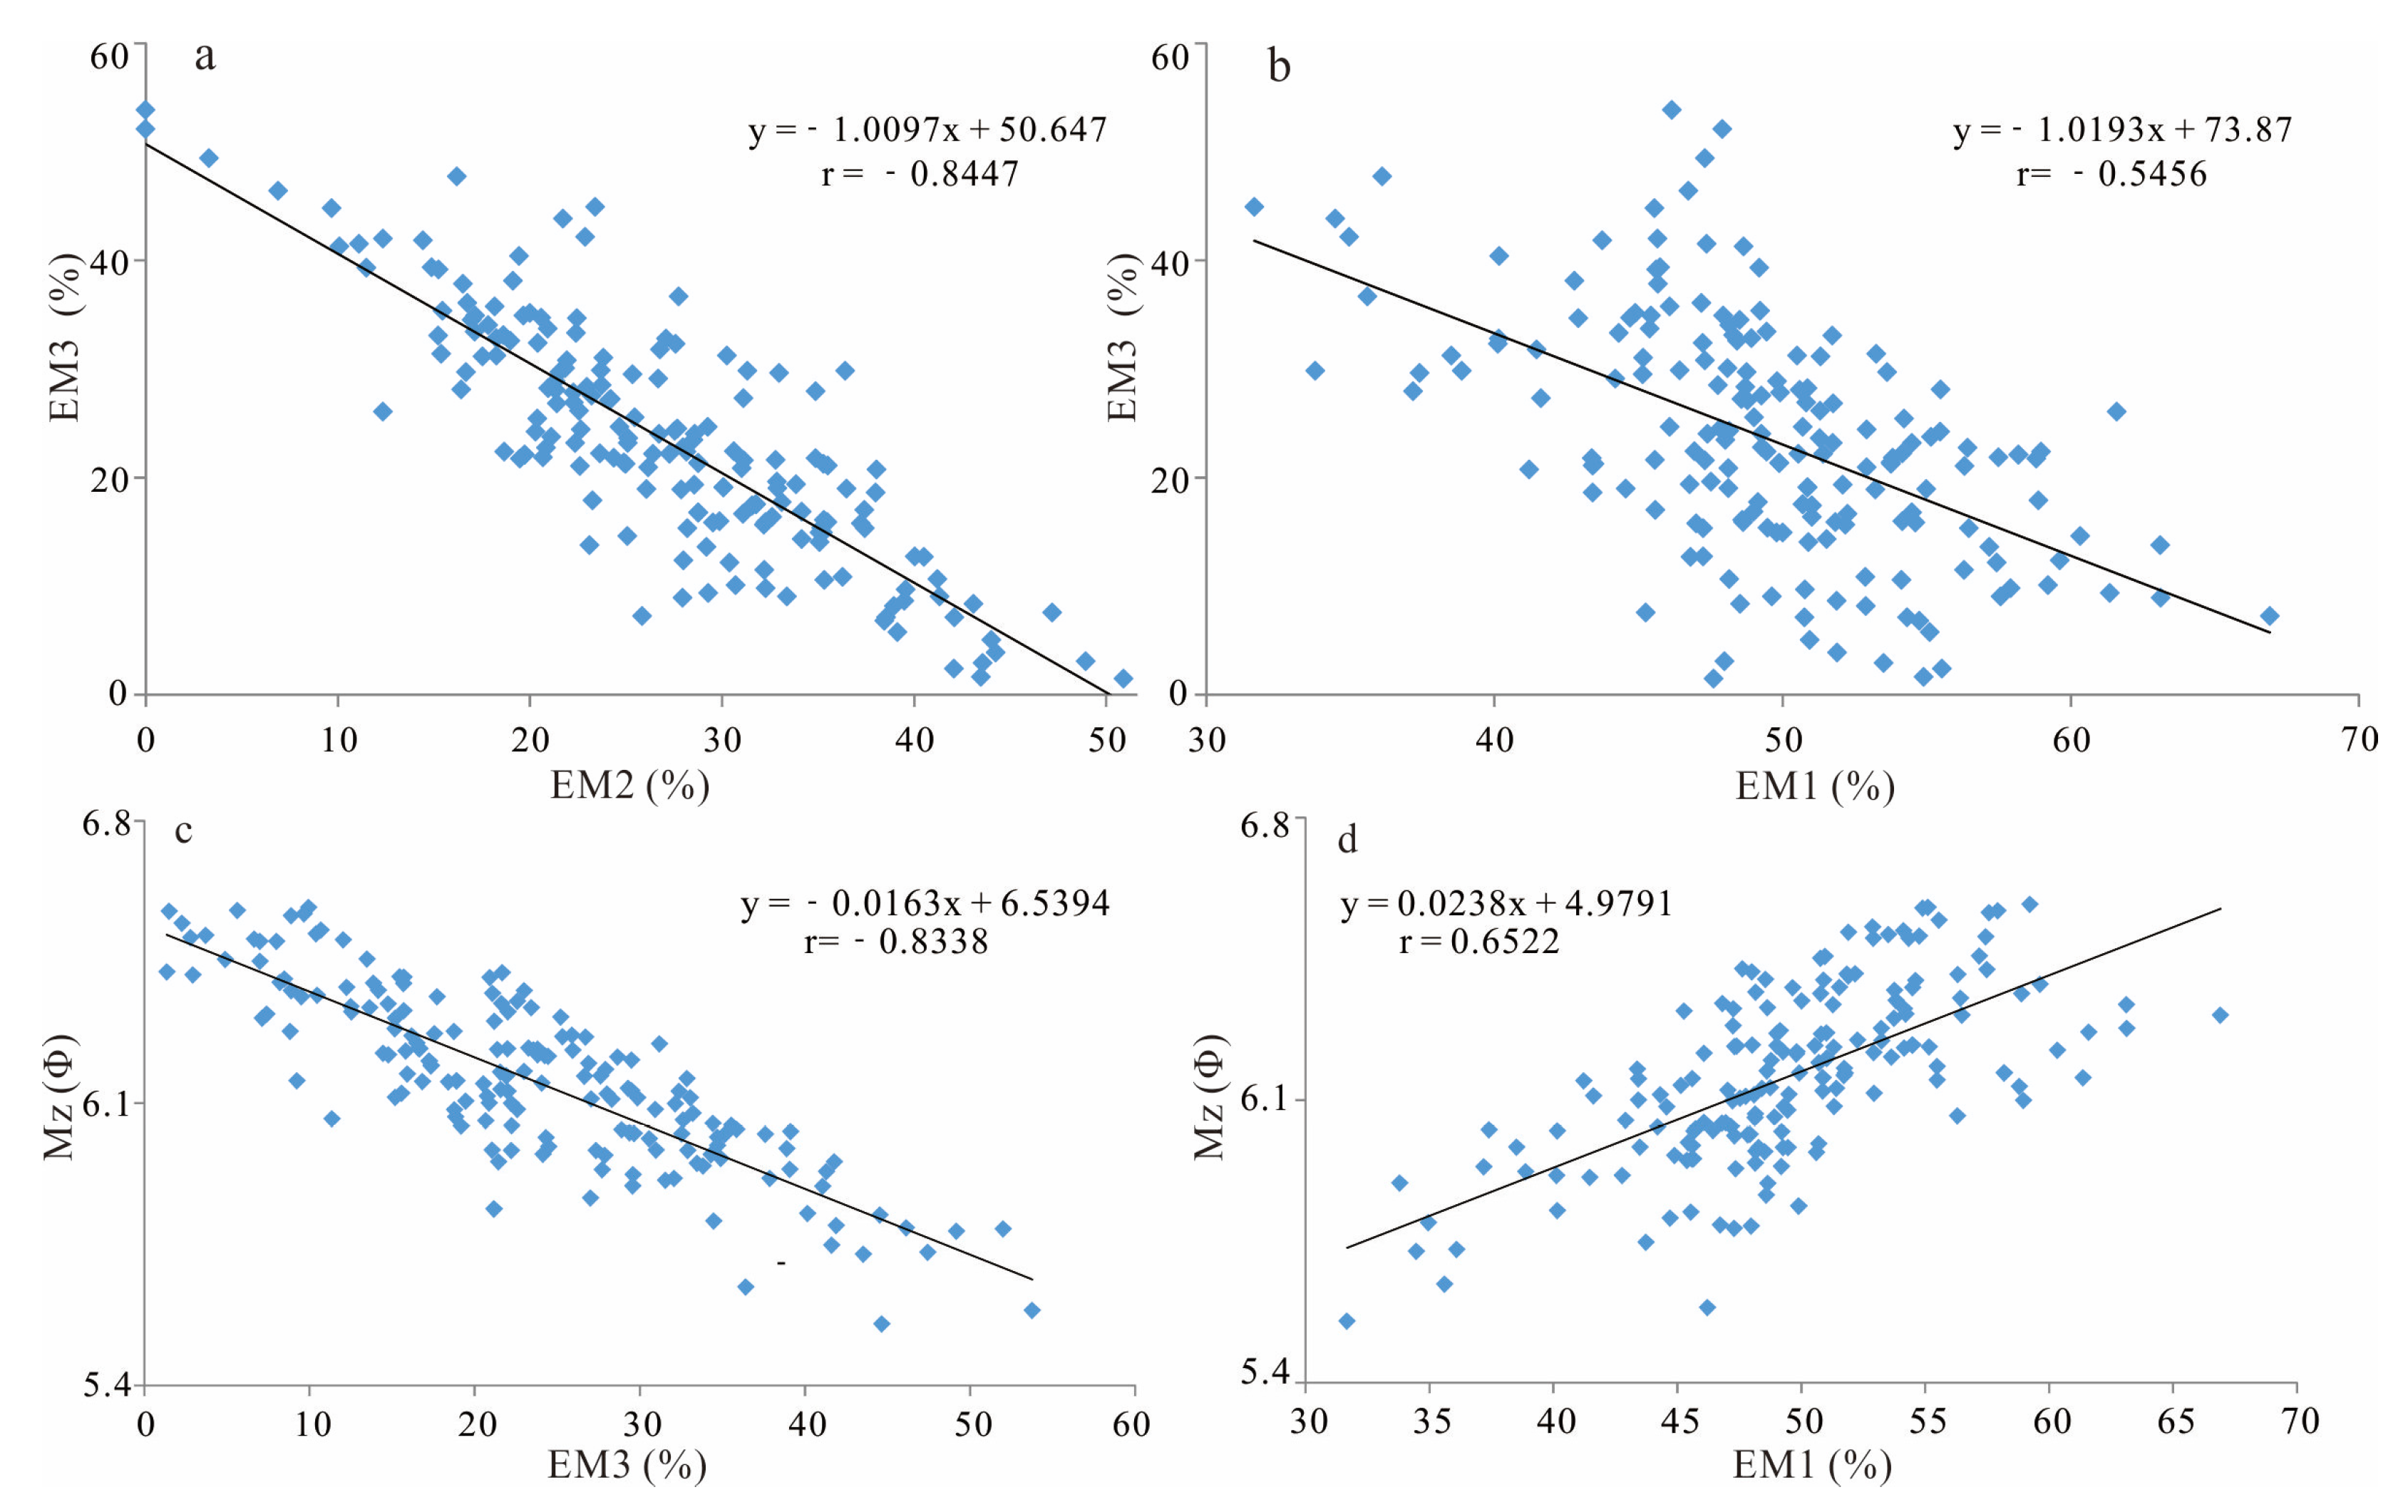
Through EM grain size analysis, EM1 was shown to be a clay component EM, representing a strong weathering pedogenesis effect and weak dynamic environment; EM2 and EM3 are coarse silt and very fine sand component EMs, respectively, representing a weak weathering pedogenesis effect and strong dynamic environment.
(2)
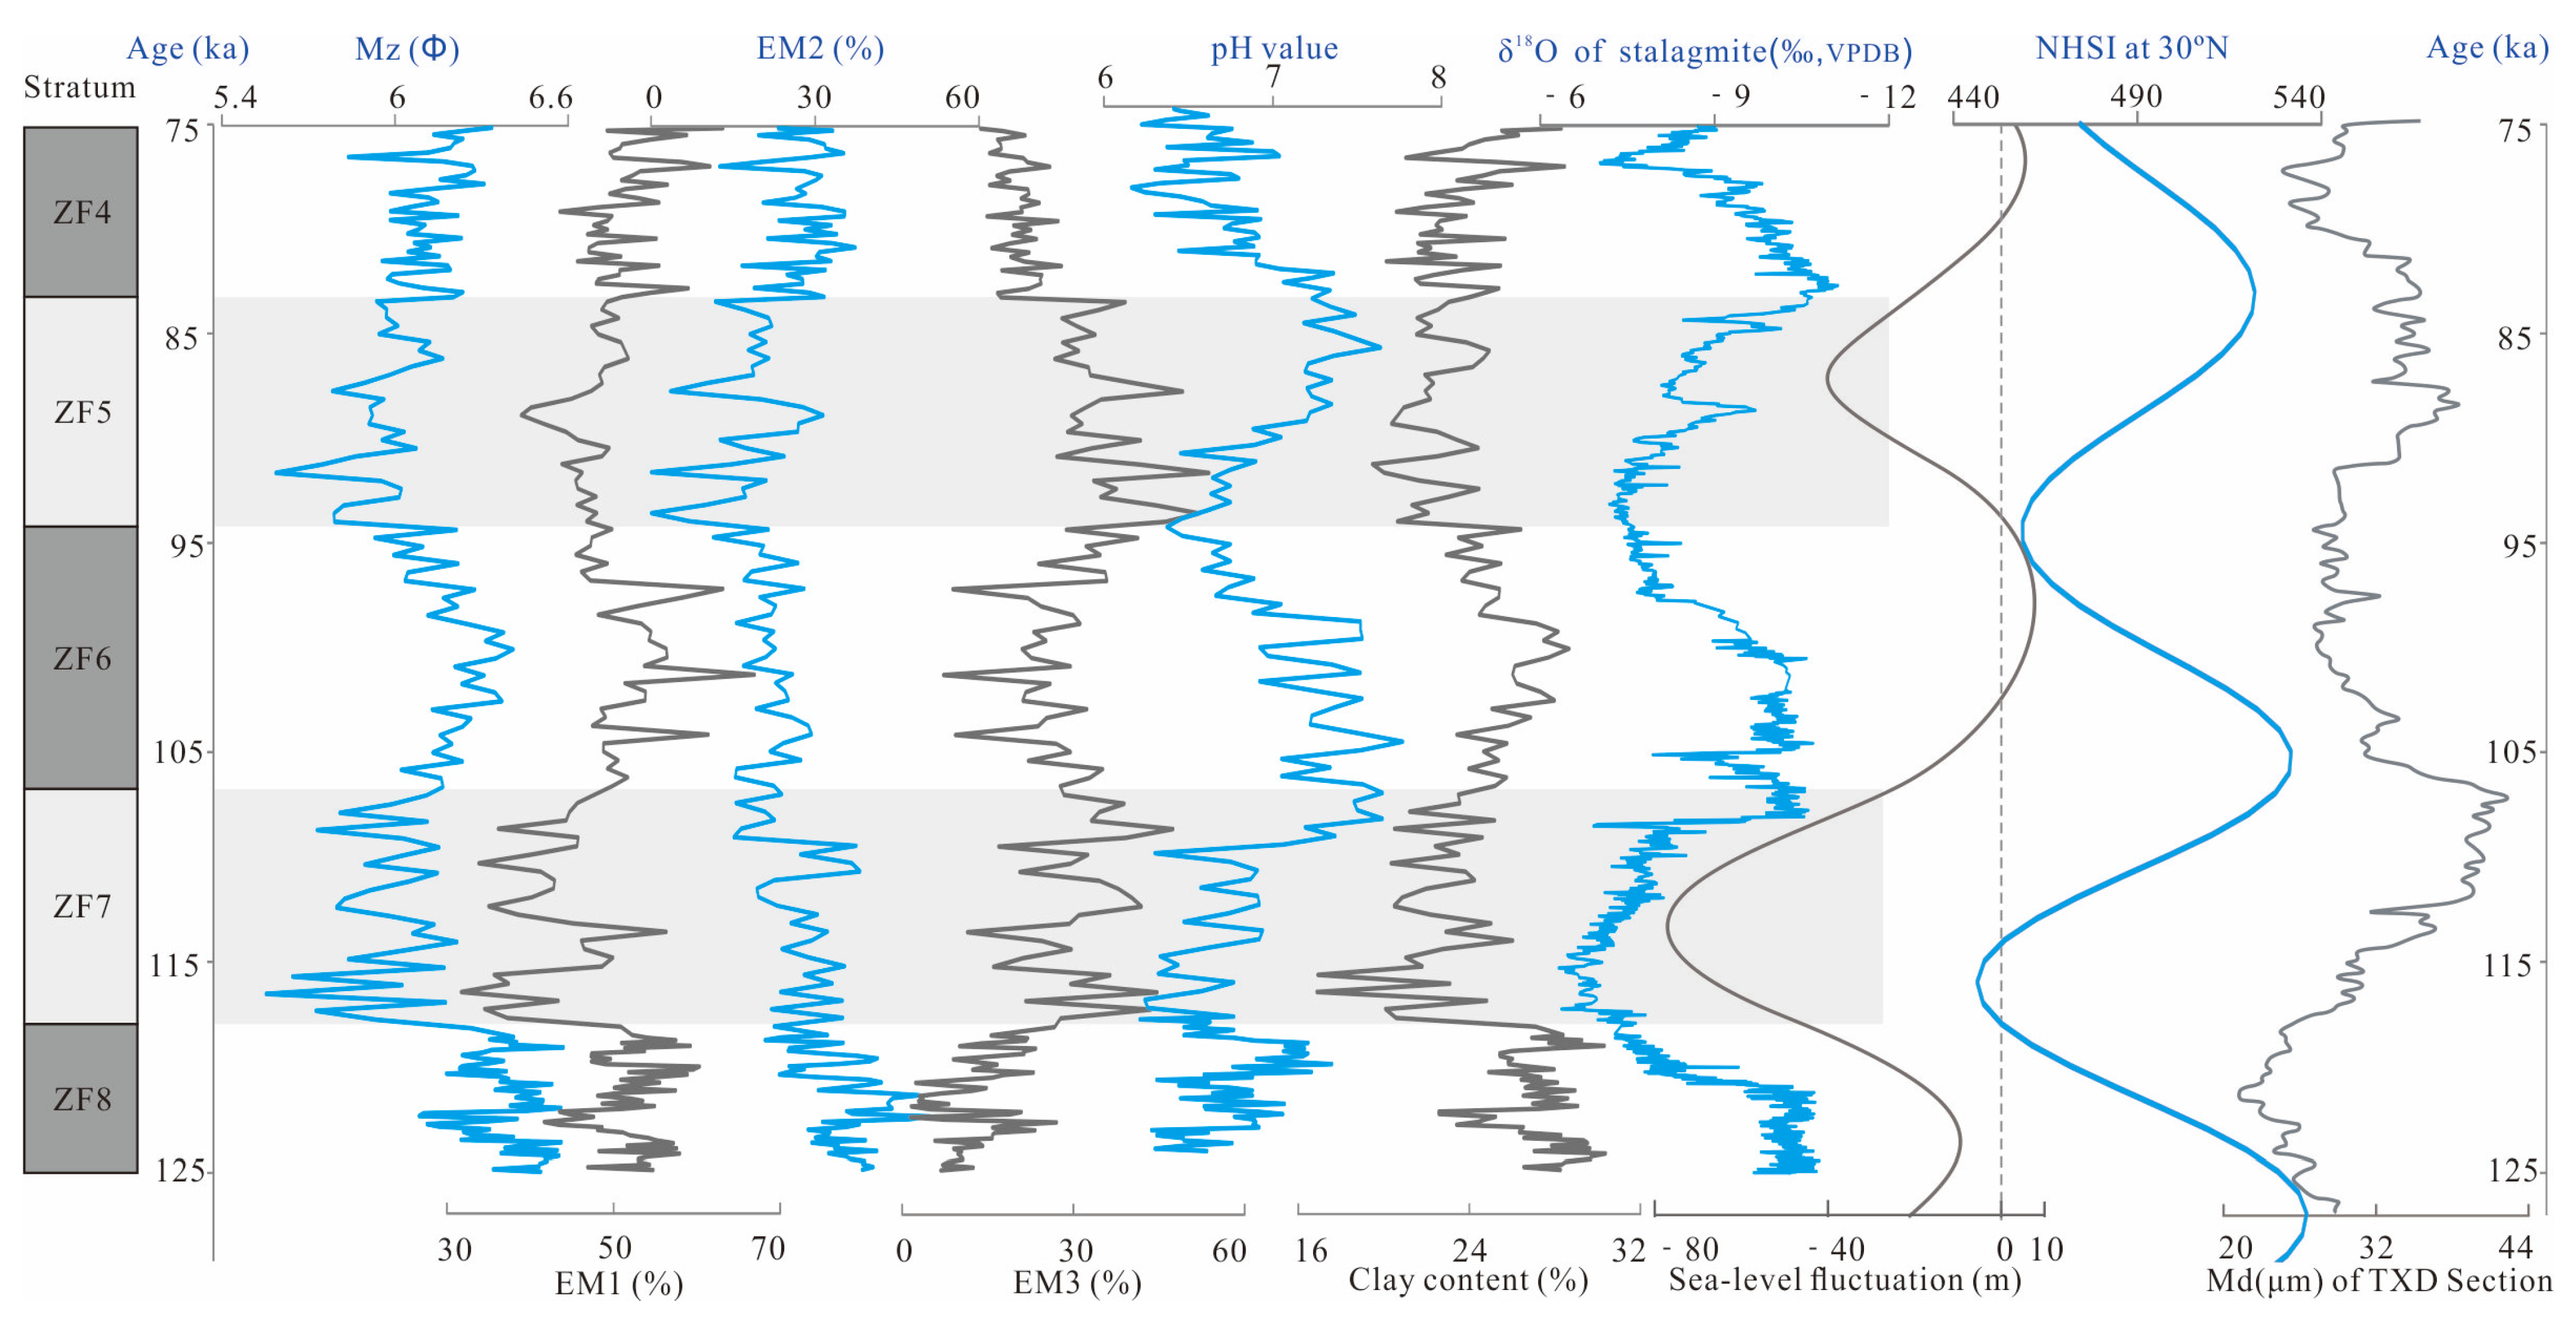
Average Mz, clay content, EM1, and pH showed trough values in the ZF5 and ZF7 (loess) units that correspond to MIS 5b and 5d, while EM3 content showed peaks, indicating a relatively cold–dry environment, reflecting a weakening period of the EASM. The paleosol units (ZF4, ZF6, and ZF8) correspond to MIS 5a, 5c, and 5e. Mz, clay content, EM1 content, and pH showed high values, and EM3 content was relatively low, indicating a humid environment with more abundant precipitation, reflecting a period of EASM enhancement; MIS5e is the warmest and wettest.
(3)
These climate fluctuation events over a ten-thousand-year timescale are consistent with the NHSI at 30° N, EASM intensity of stalagmite δ18O records in China, and sea-level fluctuation in the Yellow and Bohai Seas, indicating that they are the result of changes in global solar radiation and can be classed as global climate fluctuation events.

Author Contributions

Conceptualization, L.S., Z.L., Y.S. and Q.F.; Methodology, Z.L., Y.S. and W.L.; Software, L.S. and W.L.; Validation, Y.S. and H.Z.; Formal analysis, Q.F.; Investigation, L.S., Z.L. and W.L.; Resources, N.T.; Data curation, H.Z., W.L. and N.T.; Writing—original draft, L.S. and Y.S.; Writing—review & editing, Z.L. and Q.F.; Visualization, L.S.; Supervision, Q.F.; Project administration, Z.L.; Funding acquisition, L.S. and H.Z. All authors have read and agreed to the published version of the manuscript.

Funding

This research was funded by the National Natural Science Foundation of China (Grant Nos. 41571007 and 41201006); the Strategic Priority Research Program of the Chinese Academy of Sciences (Category B; No. XDB26000000).

Data Availability Statement

Data are available upon reasonable request from the corresponding author.

Conflicts of Interest

The authors declare no conflict of interest.

References

  1. Sánchez Goñi, M.F. Introduction to climate and vegetation in Europe during MIS5. Dev. Quat. Sci. 2007, 7, 197–205. [Google Scholar]
  2. Dansgaard, W.; Johnsen, S.J.; Clausen, H.B.; Dahl-Jensen, D.; Gundestrup, N.S.; Hammer, C.U.; Hvidberg, C.S.; Steffensen, J.P.; Sveinbjörnsdottir, A.E.; Jouzel, J.; et al. Evidence for general instability of past climate from a 250-kyr ice-core record. Nature 1993, 364, 218–220. [Google Scholar] [CrossRef]
  3. GRIP Members. Climate instability during the last interglacial period recorded in the GRIP ice core. Nature 1993, 364, 203–207. [Google Scholar] [CrossRef]
  4. Ou, X.J.; Li, B.S.; Jin, H.L.; Dong, G.R.; Zhang, D.D.; Wu, Z.; Wen, X.H.; Zeng, L.H.; Ouyang, C.T.; Yang, Y. Sedimentary characteristics of paleo-aeolian dune sands of Salawusu Formation in the Salawusu River Valley. J. Geogr. Sci. 2008, 18, 211–224. [Google Scholar] [CrossRef]
  5. Du, S.H.; Li, B.S.; Chen, M.H.; Zhang, D.D.; Xiang, R.; Niu, D.F.; Wen, X.H.; Ou, X.J. Kiloyear-scale climate events and evolution during the Last Interglacial, Mu Us Desert, China. Quat. Int. 2012, 263, 63–70. [Google Scholar] [CrossRef]
  6. An, Z.S.; Porter, S.C. Millennial-scale climatic oscillations during the last interglaciation in central China. Geology 1997, 25, 603–606. [Google Scholar] [CrossRef]
  7. Chen, F.H.; Feng, Z.D.; Zhang, J.W. Loess particle size data indicative of stable winter monsoons during the last interglacial in the western part of the Chinese Loess Plateau. Catena 2000, 39, 233–244. [Google Scholar] [CrossRef]
  8. Thouveny, N.; Beaulieu, J.L.; Bonifay, E.; Creer, K.M.; Guiot, J.; Icole, M.; Johnsen, S.; Jouzel, J.; Reille, M.; Williams, T.; et al. Climate variations in Europe over the past 140 kyr deduced from rock magnetism. Nature 1994, 371, 503–506. [Google Scholar] [CrossRef]
  9. Wang, Y.J.; Cheng, H.; Edwards, R.L.; Kong, X.G.; Shao, X.H.; Chen, S.T.; Wu, J.Y.; Jiang, X.Y.; Wang, X.F.; An, Z.S. Millennial- and orbital-scale changes in the East Asian monsoon over the past 224,000 years. Nature 2008, 451, 1090–1093. [Google Scholar] [CrossRef] [Green Version]
  10. Cheng, H.; Edwards, R.L.; Sinha, A.; Spötl, C.; Yi, L.; Chen, S.T.; Kelly, M.; Kathayat, G.; Wang, X.F.; Li, X.L.; et al. The Asian monsoon over the past 640,000 years and ice age terminations. Nature 2016, 534, 640–646. [Google Scholar] [CrossRef]
  11. Dutton, A.; Lambeck, K. Ice volume and sea level during the last interglacial. Science 2012, 337, 216–219. [Google Scholar] [CrossRef]
  12. Heinrich, H. Origin and consequences of cyclic ice rafting in the northeast Atlantic ocean during the past 130,000 years. Quat. Res. 1988, 29, 142–152. [Google Scholar] [CrossRef]
  13. Linsley, B.K. Oxygen-isotope record of sea level and climate variations in the Sulu Sea over the past 150,000 years. Nature 1996, 380, 234–237. [Google Scholar] [CrossRef]
  14. IOCAS (Marine Geology Laboratory, Institute of Oceanology, Chinese Academy of Sciences). Geology of Bohai Sea; Science Press: Beijing, China, 1985. (In Chinese) [Google Scholar]
  15. Spratt, R.M.; Lisiecki, L.E. A Late Pleistocene sea level stack. Clim. Past. 2016, 11, 1079–1092. [Google Scholar] [CrossRef] [Green Version]
  16. Yi, L.; Shi, Z.G.; Tan, L.C.; Deng, C.L. Orbital-scale nonlinear response of East Asian summer monsoon to its potential driving forces in the late Quaternanry. Clim. Dyn. 2017, 50, 2183–2197. [Google Scholar] [CrossRef]
  17. Yi, L.; Yu, H.J.; Ortiz, J.D.; Xu, X.Y.; Chen, S.L.; Ge, J.Y.; Hao, Q.Z.; Yao, J.; Shi, X.F.; Peng, S.Z. Late Quaternary linkage of sedimentary records to three astronomical rhythms and the Asian monsoon, inferred from a coastal borehole in the south Bohai Sea, China. Palaeogeogr. Palaeoclim. Palaeoecol. 2012, 329–330, 101–117. [Google Scholar] [CrossRef]
  18. Cao, J.X.; Li, P.Y.; Shi, N. Study on the Loess of Miaodao Islands in Shandong Province. Sci. China Ser. B Chem. Life Sci. Earth Sci. 1988, XXXI, 120–127. [Google Scholar]
  19. Du, S.H.; Li, B.S.; Li, Z.W.; Chen, M.H.; Xiang, R.; Zhang, D.D.; Niu, D.F.; Zhang, L.L. Rapid changes in the East Asian Monsoon during the Last Interglacial in the Bohai Sea coastal zone, China. J. Sediment. Res. 2014, 84, 88–96. [Google Scholar] [CrossRef]
  20. Li, Z.W.; Li, B.S.; Sun, L.; Wang, F.N. Climatic Characteristics indicated by the variations of Rb/Sr in the Liukuang Section during the last glacial period. Trop. Geogr. 2015, 35, 592–600. (In Chinese) [Google Scholar]
  21. Li, Z.W.; Wang, F.N.; Li, B.S.; Du, D.D.; Zhang, H.J.; Song, Y.G.; Du, S.H.; Sun, L. Paleoenvironmental changes and East Asian winter monsoon evolution: Evidence from coastal sedimentary sequence of the Last Glacial in the Shandong Peninsula, China. Front. Earth Sci. 2022. on line. [Google Scholar] [CrossRef]
  22. Miao, X.D.; Chongyi, E.; Xu, S.J.; Wang, Q.S.; Hanson, P.R.; Chen, H.T.; Shi, Y.K. Age and source of coastal loess in Shandong Peninsula, Bohai Sea, China: Implications for dust aggradation in respond to sea-level change. Aeolian Res. 2022, 54, 100767. [Google Scholar] [CrossRef]
  23. Wang, Q. The uplift rate over the past 124 ka along the North-east coast of Shandong Peninsula. Acta Sci. Nat. Univ. Pekin. 1998, 34, 106–113. (In Chinese) [Google Scholar]
  24. Niu, H.Y.; Jin, B.F.; Liu, C.N.; Gong, L.X. Origin of loess-like loess in Zhifu Island on mineralogic view and paleoclimatic change. Glob. Geol. 2009, 28, 476–484. (In Chinese) [Google Scholar]
  25. Niu, H.Y.; Jin, B.F.; Liu, C.N.; Zhong, J.W.; Zhang, Z.G. Sedimentary characteristics and provenance analysis of loess in the Zhifu Island, Shandong, China. Mar. Geol. Quat. Geol. 2010, 30, 115–123. (In Chinese) [Google Scholar] [CrossRef]
  26. Wang, Q.; Zhong, S.Y.; Mao, A.H.; Man, Z.Y. Geomorphologic and environmental evolutions in the region of the Zhifu island tombolo of the Shandong Peninsula. Mar. Geol. Quat. Geol. 2003, 23, 31–36. (In Chinese) [Google Scholar]
  27. Xing, X.C.; Du, G.Y.; Wei, X.H.; Li, Y. The erosion of gravel beaches in northern coast of Zhifu Island. Trans. Oceanol. Limnol. 2009, 1, 73–78. (In Chinese) [Google Scholar]
  28. YLHC (Yantai Local Historical Commission). Yantai City Annals; Popular Science Press: Beijing, China, 1994. (In Chinese) [Google Scholar]
  29. Konert, M.; Vandenberghe, J. Comparison of laser grain size analysis with pipette and sieve analysis: A solution for the underestimation of the clay fraction. Sedimentology 1997, 44, 523–535. [Google Scholar] [CrossRef]
  30. Liu, D.S. Loess and the Environment; Science Press: Beijing, China, 1985. (In Chinese) [Google Scholar]
  31. Folk, R.L.; Ward, W.C. Brazos River Bar: A study in the significance of grain size parameters. J. Sediment. Petrol. 1957, 29, 87–97. [Google Scholar] [CrossRef]
  32. Lisiecki, L.E.; Raymo, M.F. A Pliocene-Pleistocene stack of 57 globally distributed benthic δ18O records. Paleoceanography 2005, 20, PA1003. [Google Scholar] [CrossRef] [Green Version]
  33. Weltje, G.J.; Prins, M.A. Muddled or mixed? Inferring palaeoclimate from size distributions of deep-sea clastics. Sediment. Geol. 2003, 162, 39–62. [Google Scholar] [CrossRef]
  34. Paterson, G.A.; Heslop, D. New methods for unmixing sediment grain size data. Geochem. Geophys. Geosyst. 2015, 16, 4494–4506. [Google Scholar] [CrossRef] [Green Version]
  35. Li, Y.; Song, Y.G.; Zong, X.L.; Zhang, Z.P.; Cheng, L.Q. Dust accumulation processes of piedmont loess indicated by grain-size end members in northern Ili Basin. Acta Geogr. Sin. 2019, 74, 162–177. (In Chinese) [Google Scholar]
  36. Berger, A.; Loutre, M.F. Insolation values for the climate of the last 10 million years. Quat. Sci. Rev. 1991, 10, 297–317. [Google Scholar] [CrossRef]
  37. An, Z.S.; Kukla, G.; Porter, S.C.; Xiao, J.L. Late Quaternary dust flow on the Chinese Loess Plateau. Catena 1991, 18, 125–132. [Google Scholar] [CrossRef]
  38. Ding, Z.L.; Ren, J.Z.; Liu, D.S.; Sun, J.M.; Zhou, X.Q. The irregular millennial variations and its mechanism of monsoon-desert system during late Pleistocene. Sci. China Ser. D Earth Sci. 1996, 26, 385–391. (In Chinese) [Google Scholar]
  39. Jia, Y.F.; Pan, J.L.; Huang, C.C. PH value’s measurement and research of its palaeoclimatic meaning in the Holocene loess section. J. Shaanxi Norm. Univ. 2004, 32, 102–105. (In Chinese) [Google Scholar]
Figure 1. (a) Location of the study area in China and trajectories of the major wind systems. (b) Location of the Zhifu section within Shandong Province.
Atmosphere 14 00153 g001
Figure 2. Stratigraphic sequence and age-depth relationship of the ZFS during MIS 5 period.
Atmosphere 14 00153 g002
Figure 3. Grain size composition and pH of the ZFS during MIS 5 period.
Atmosphere 14 00153 g003
Figure 4. Relationships among linear correlation, angular deviation, and endmember numbers in the grain size EM analysis of the ZFS.
Atmosphere 14 00153 g004
Figure 5. Frequency distribution curves of each stratum (a) and endmember (b) in the ZFS during MIS 5 period.
Atmosphere 14 00153 g005
Figure 6. Correlations between (a) EM3 and EM2, (b) EM3 and EM1, (c) Mz and EM3, and (d) Mz and EM1 in the ZFS during MIS 5 period.
Atmosphere 14 00153 g006
Figure 7. Variations in EM1, EM2, EM3, pH, Mz, and clay content in the ZFS, and comparisons with Md of TXD section in the western part of the Chinese Loess Plateau [7], the δ18O record from stalagmites in China [10], sea-level fluctuations of the Yellow and Bohai Seas [14], and NHSI at 30° N [36].
Atmosphere 14 00153 g007
Table 1. Sedimentary facies of MIS 5 period within the ZFS.
StrataStratigraphic DescriptionThickness
ZF1Cultivation layerDark black, containing humus and undecomposed branches and leaves, relatively loose37 cm
ZF2Sandy loessLight brown, very fine sandy silt with medium sand, with gravel and plant roots35 cm
ZF3Sandy loess/loessBrown, very fine sand-medium sandy silt with clay, more compact70 cm
ZF4PaleosolReddish brown, clayey silt with very fine sand, with black iron-manganese cutan78 cm
ZF5LoessOchre yellow soil, very fine sandy silt with clay, occasional vertical distribution of iron-manganese cutan58 cm
ZF6PaleosolBright brown, clayey silt with very fine sand, compact60 cm
ZF7LoessDark brown, very fine sandy silt with clay, with small quantity of iron-manganese spots, compact56 cm
ZF8PaleosolBrown, clayey silt with very fine sand, with abundant iron-manganese spots, compact104 cm
Table 2. OSL ages and analysis parameters of the ZFS during MIS 5 period.
LayerDepth (m)U (ppm)Th (ppm)K (%)Dose Rate (Gy/Ka)De (Gy)Age (ka)
ZF3T0.722.0212.202.084.06255.46 ± 11.9562.85 ± 6.94
ZF3B1.282.0512.002.244.47313.66 ± 29.7170.18 ± 9.67
ZF3B1.282.1011.802.053.39 ± 0.14270.78 ± 15.4879.8 ± 5.64
ZF4B1.890.703.392.703.12 ± 0.24260.1 ± 5.983.4 ± 6.6
ZF6T2.632.4911.702.083.44 ± 0.24325.8 ± 18.494.7 ± 8.5
ZF8T3.911.326.781.782.55 ± 0.19318.5 ± 9.1118.5 ± 9.3
ZF8B4.961.667.442.032.72 ± 0.20322.1 ± 10.0124.9 ± 9.7
Note: “T” represents “top”, “B” represents “bottom”.
Table 3. Chronological range of each stratum in the ZFS and corresponding MISs.
LayerDepthInterval AgeEquivalent to MISs
ZF373–142 cm62.85–74.99 kaMIS 4
ZF4143–220 cm74.99–83.40 kaMIS 5a
ZF5221–278 cm83.40–94.70 kaMIS 5b
ZF6279–338 cm94.7–105.2 kaMIS 5c
ZF7339–394 cm105.2–118.5 kaMIS 5d
ZF8395–498 cm118.5–124.9 kaMIS 5e
Table 4. Average values and distribution ranges of climate indices of the last interglacial period in the ZFS.
EM1EM2EM3MzClay ContentpH Value
ZF4Average51.6628.1520.196.1323.636.68
Range43.50–63.1312.49–37.3513.67–27.945.84–6.3420.10–28.466.16–7.36
ZF5Average47.0217.1535.835.9522.447.09
Range38.89–51.780.00–31.5126.66–53.775.59–6.2119.47–26.426.45–7.64
ZF6Average52.1521.7926.066.2025.637.07
Range45.44–66.9211.31–29.377.16–41.325.93–6.4122.90–28.686.37–7.77
ZF7Average42.4226.5631.025.9822.406.87
Range31.69–56.3215.09–38.2111.37–47.465.55–6.2616.87–27.086.24–7.65
ZF8Average51.7835.4812.746.3827.146.76
Range41.64–60.3520.81–50.981.38–27.086.08–6.5822.57–30.386.21–7.35
MIS 5Average49.5727.1823.266.1624.606.87
Range31.69–66.920.00–50.981.38–53.775.55–6.5816.87–30.386.16–7.77
Disclaimer/Publisher’s Note: The statements, opinions and data contained in all publications are solely those of the individual author(s) and contributor(s) and not of MDPI and/or the editor(s). MDPI and/or the editor(s) disclaim responsibility for any injury to people or property resulting from any ideas, methods, instructions or products referred to in the content.

