Article

Characteristics and Sources of Water-Soluble Inorganic Ions in PM2.5 in Urban Nanjing, China

1
Emergency Management School, Nanjing University of Information Science and Technology, Nanjing 210044, China
2
School of Earth System Science, Tianjin University, Tianjin 300072, China
3
Key Laboratory for Aerosol-Cloud-Precipitation of China Meteorological Administration, Nanjing University of Information Science and Technology, Nanjing 210044, China
*
Author to whom correspondence should be addressed.
Atmosphere 2023, 14(1), 135; https://doi.org/10.3390/atmos14010135
Submission received: 2 December 2022 / Revised: 27 December 2022 / Accepted: 4 January 2023 / Published: 7 January 2023
(This article belongs to the Special Issue Investigate Secondary Aerosol Formation and Source by Stable Isotopes)

Abstract

:
In this study, the water-soluble inorganic ions (WSIIs) composition of fine particulate matter (PM2.5) was measured in the northern Nanjing city from 2015 to 2021. NH4+, NO3 and SO42− concentrations dominated in total WSIIs (Na+, NH4+, K+, Mg2+, Ca2+, Cl, NO3 and SO42−), accounting for 87.8%. The nitrate with highest average concentration among all ions was 11.0 μg·m−3. Total WSIIs concentrations were higher in winter and lower in summer, with the highest levels in December (45.6 μg·m−3) and the lowest levels in August (15.1 μg·m−3). NO3/SO42− was higher than 1, indicating the important contribution of mobile sources. The aerosols exhibited a weak acidic by the molar ratio of water-soluble anions and cations. Positive matrix factorization (PMF) analysis results showed that secondary nitrate and sulfate were the major pollution sources in December 2016 and 2020. The contribution of secondary nitrate in 2020 increased by 47.6% compared to 2016, while that of secondary sulfate decreased by 42.4%. The potential source contribution results demonstrated that for secondary aerosol concentrations, the contribution of regional transport from north of Anhui increased, while the contribution of local emissions decreased. The results from this study could contribute to the better prevention and control of regional air pollution in the future.

1. Introduction

Over the past decades, atmospheric fine particle (PM2.5, particulate matters with aerodynamic diameters equal to or less than 2.5 μm) pollution have had a significant impact on human health, atmosphere visibility, and the ecosystem in China [1,2,3]. Water-soluble inorganic ions have been considered as major components of PM2.5, accounting for 20% to 70% of them [4,5]. Research found that WSIIs, especially secondary inorganic aerosols (SNA, including SO42−, NO3 and NH4+), have effects on the hydroscopic nature and acidity of PM2.5 [6,7,8].
Many studies have suggested that the WSIIs of PM2.5 were the major pollutant in Chinese cities, especially in developed coastal areas such as Beijing–Tianjin–Hebei [9,10,11], the Yangtze River Delta region [12,13], and the Pearl River Delta region [5,14]. The wide range of WSIIs’ spatial variability may be associated with differences in the PM2.5 sources, economic development, population density, and the effect of meteorological conditions [15]. Nanjing is one of the important cities in the in Yangtze River Delta. Previous studies conducted in Nanjing have revealed the aerosol mass concentrations [16,17], chemical components [18], spatial and temporal variations [17,19], possible sources [18,20,21], chemical characteristics of haze episodes [22,23,24], the impact of aerosol on visibility [25], etc. These studies have provided knowledge for understanding the characteristics, the behavior, and the regional pollution of PM2.5. However, there has been limited study of the long-term measurement of WSIIs variability with 1-h time resolution. Their formation mechanisms and source apportionments have seldom been reported in the Nanjing industrial zone.
In the current work, the WSIIs of PM2.5 were monitored online in the Nanjing industrial district from 2015 to 2021. The characteristics of water-soluble components in PM2.5 were investigated and compared with different years. The secondary formation and potential sources were explored by positive matrix factorization (PMF) and the potential source contribution function (PSCF), respectively. Results from this study are essential to understanding the chemical compositions of PM2.5 and the potential impacts of anthropogenic sources. The unique datasets could improve the understanding of aerosol properties and thereby provide a valuable field measurement-based reference for mitigating particle pollution.

2. Materials and Methods

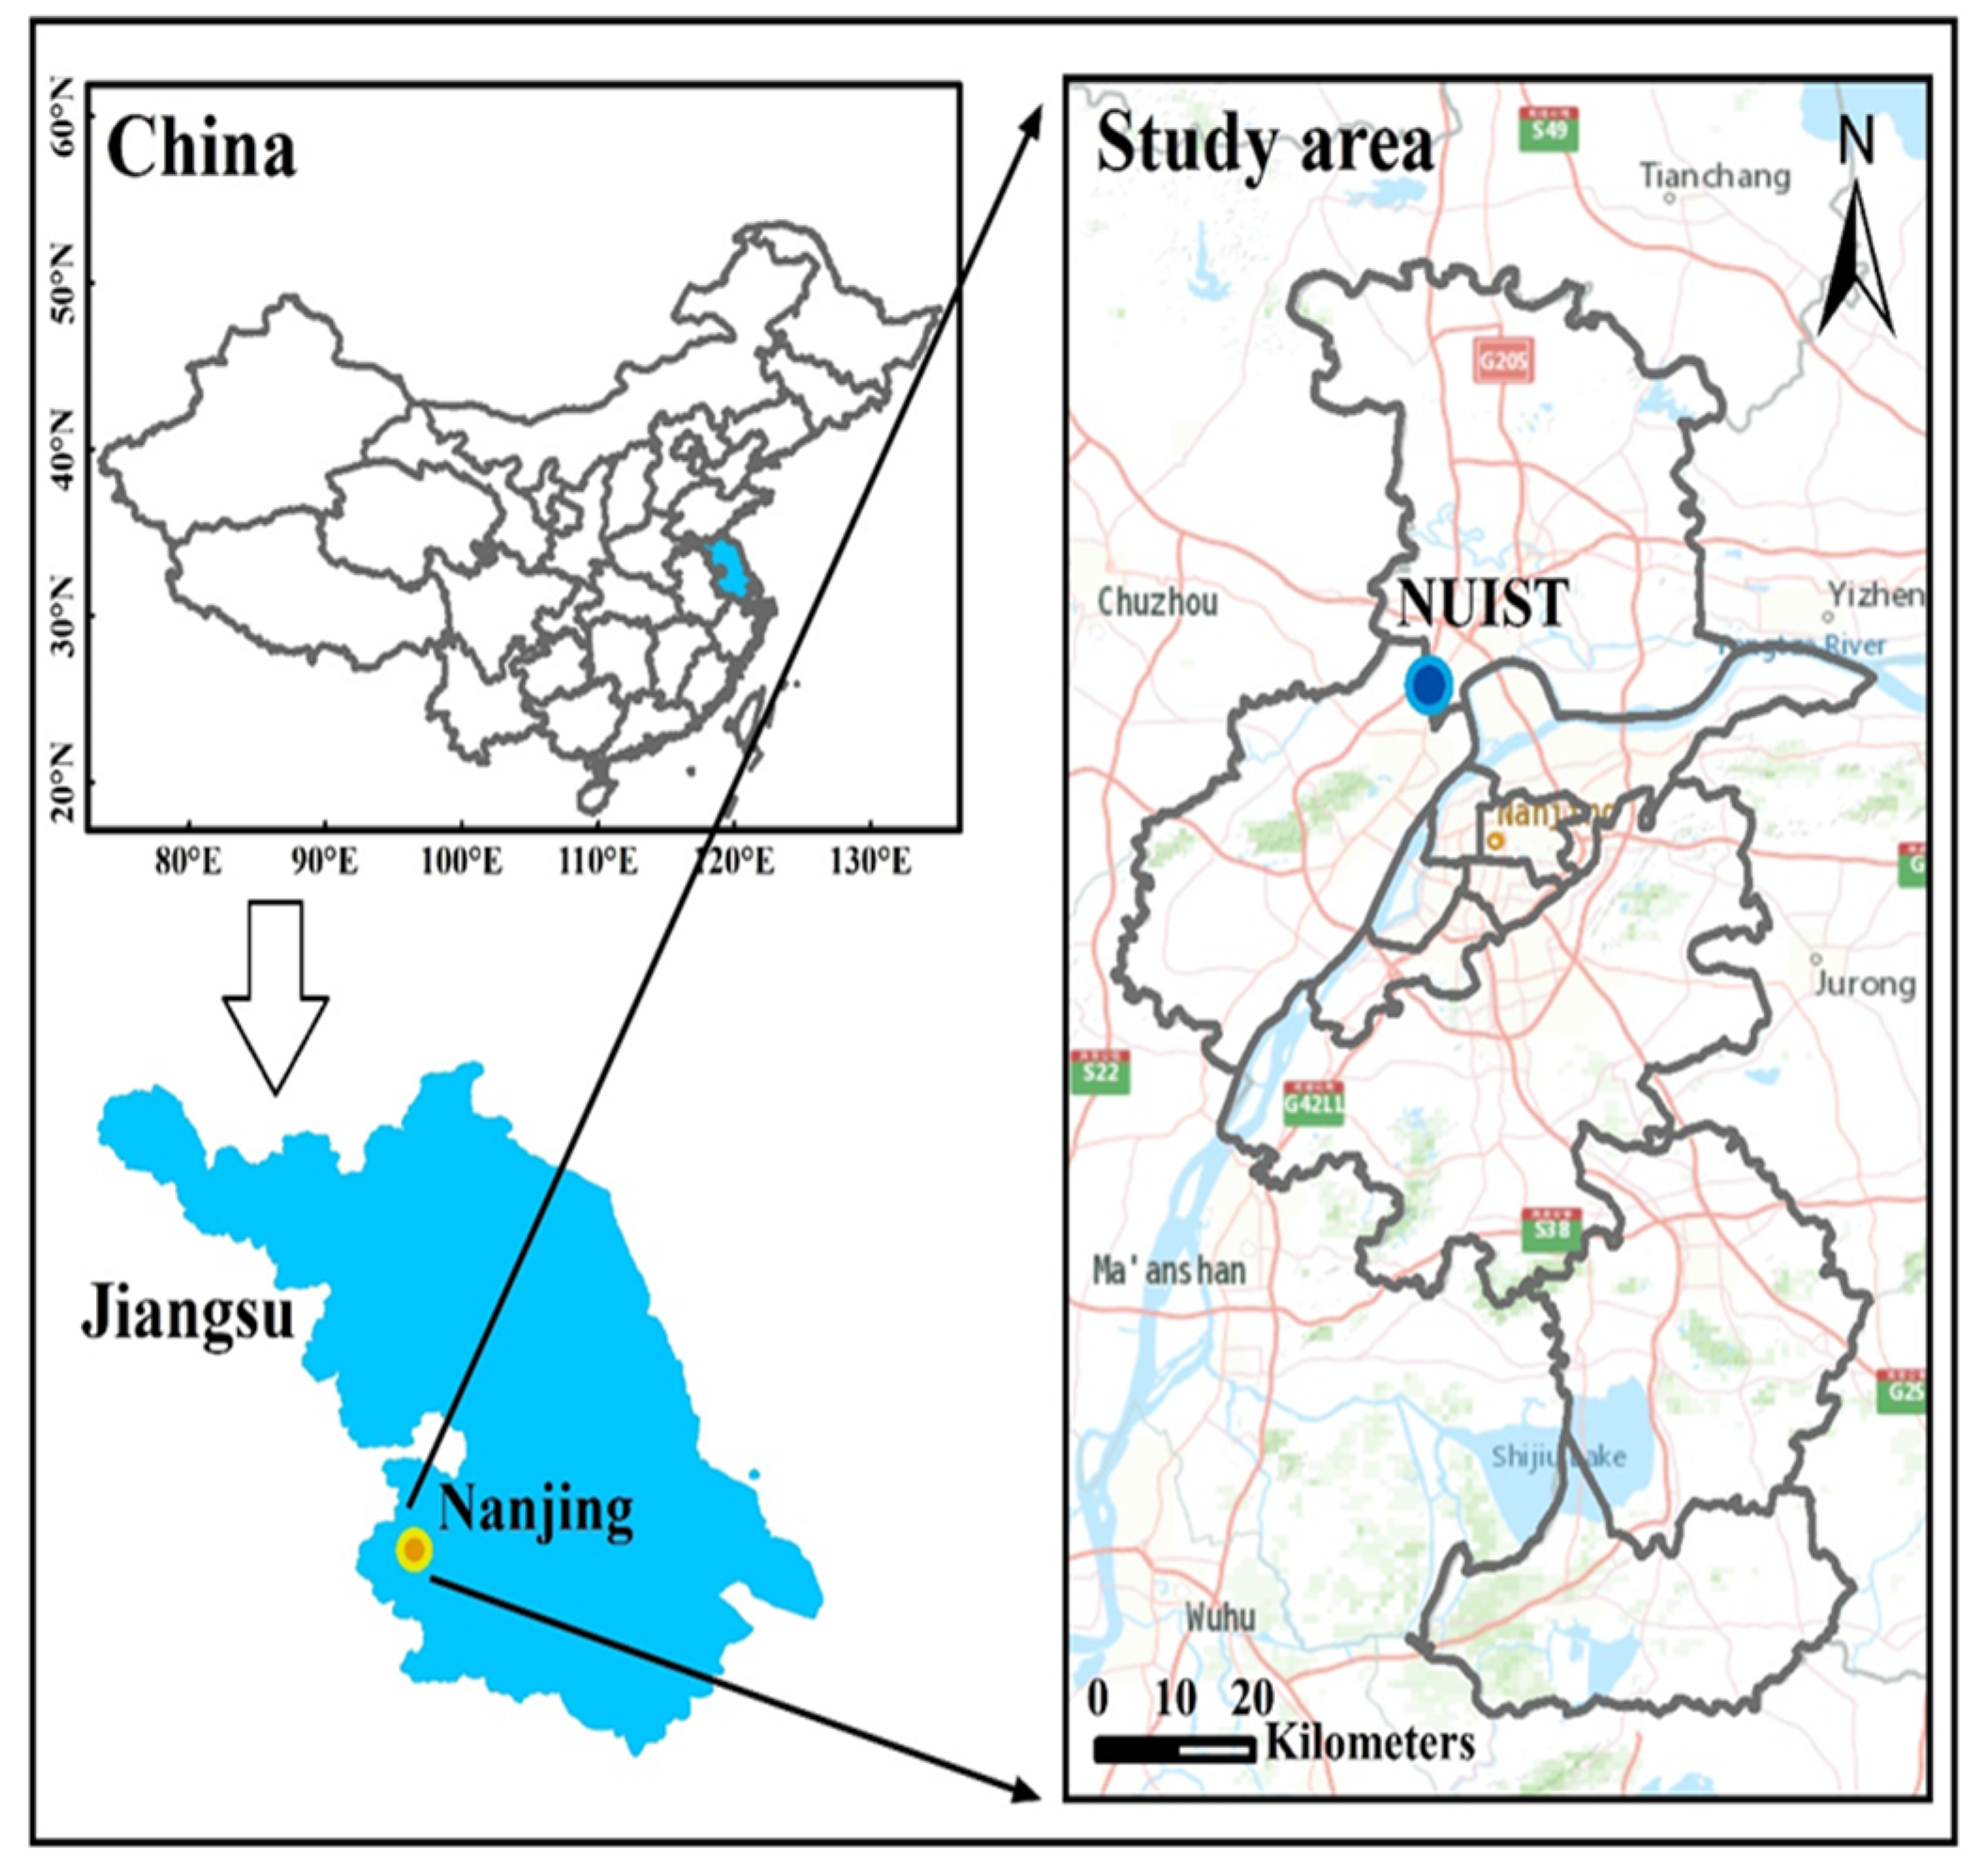
2.1. Site Description and Instrumentation

The city of Nanjing is located in the Eastern part of China, and is the capital city of Jiangsu Province. In this study, the sampling site for the measurement was set on top of the meteorological building at the Nanjing University of Information Science and Technology (NUIST, 32.21° N, 118.72° E, 62 m above ground level), northwest of Nanjing (Figure 1). The Yangtze River waterway is located approximately 12 km to the Southeast. The distance between the east and west sides of the sampling points is 1–2 km, which are the Ningliu Expressway (G205) and Hushan Highway (G40), respectively. Previous studies have found that vehicle exhaust on these roads can affect the observation location [26]. To the Southeast (approximately 5 km) of the sampling point are the Nanjing Chemical Industrial Park (NCIP), an iron and steel enterprise, and a coal-fired power plant. Thus, this region is in a mixed district of traffic and industry.
An online sampling instrument was set to measure the mass concentrations of the water-soluble inorganic ion components (Na+, NH4+, K+, Mg2+, Ca2+, Cl, NO3 and SO42−) at 1 h time resolution. The MARGA (Monitoring AeRosol and Gases in the ambient air, Metrohm Ltd., Switzerland) is mainly composed of three parts: a sample box, detector box, and connected pump. The sample box absorbs trace gases and collects aerosols of PM2.5 using a horizontal wet rotating denuder (WRD) and steam jet aerosol collector (SJAC), respectively. The ambient airflow into the sample box is regulated to a rate of 1 m3·h−1 by a mass flow controller. The detector box then analyzes these gases and aerosols by an ion chromatography (IC) system. The instrument is placed in an air-conditioned cabin to keep the temperature at 20–25 °C. The detection limits for Na+, NH4+, K+, Mg2+, Ca2+, Cl, NO3 and SO42− were 0.05, 0.05, 0.09, 0.06, 0.09, 0.01, 0.05 and 0.04 μg·m−3, respectively. Details about the principles of MARGA and the comparison with other instruments can be found in the published literature [27,28]. Meteorological data (ambient temperature (T) and relative humidity (RH) were obtained from the China Meteorological Administration (CMA), Nanjing University of Information Science & Technology (NUIST) station.

2.2. Positive Matrix Factorization Model

Positive matrix factorization (PMF) is an effective receptor model, which has been widely used in the source apportionment of air pollutants [29,30,31]. In this work, the EPA (United States Environmental Protection Agency) PMF 5.0 was applied to quantify the contribution of sources to PM2.5. The input data included the concentration data matrix of the eight species and the uncertainty data matrix. According to the published literature [32], the data uncertainty was calculated. Setting the parameters of PMF 5.0 was in accordance with the user guide and previous research [29,31,32,33,34]. The number of runs was set to twenty, and the factor number was set from three to six for testing. In addition, the diagnostic parameters were used for the selection on the best factor number.

2.3. Potential Source Contribution Function Analysis

To identify the probability of source regions, the potential source contribution function (PSCF) was calculated. The PSCF values were calculated using the following equation:
P S C F i j = m i j n i j
where mij is the number of trajectory endpoints of pollutant concentration exceeding a given criterion value and nij denotes the total number of trajectory endpoints in the ijth cell. The criterion values were chosen for the 70% percentile of hourly average values [35]. The spatial resolution was 0.5° × 0.5°. Furthermore, the arbitrary weight function Wij was multiplied to reduce uncertainty in cells with small nij values. More detailed information on PSCF can be found in the literature [36,37,38].

3. Results and Discussion

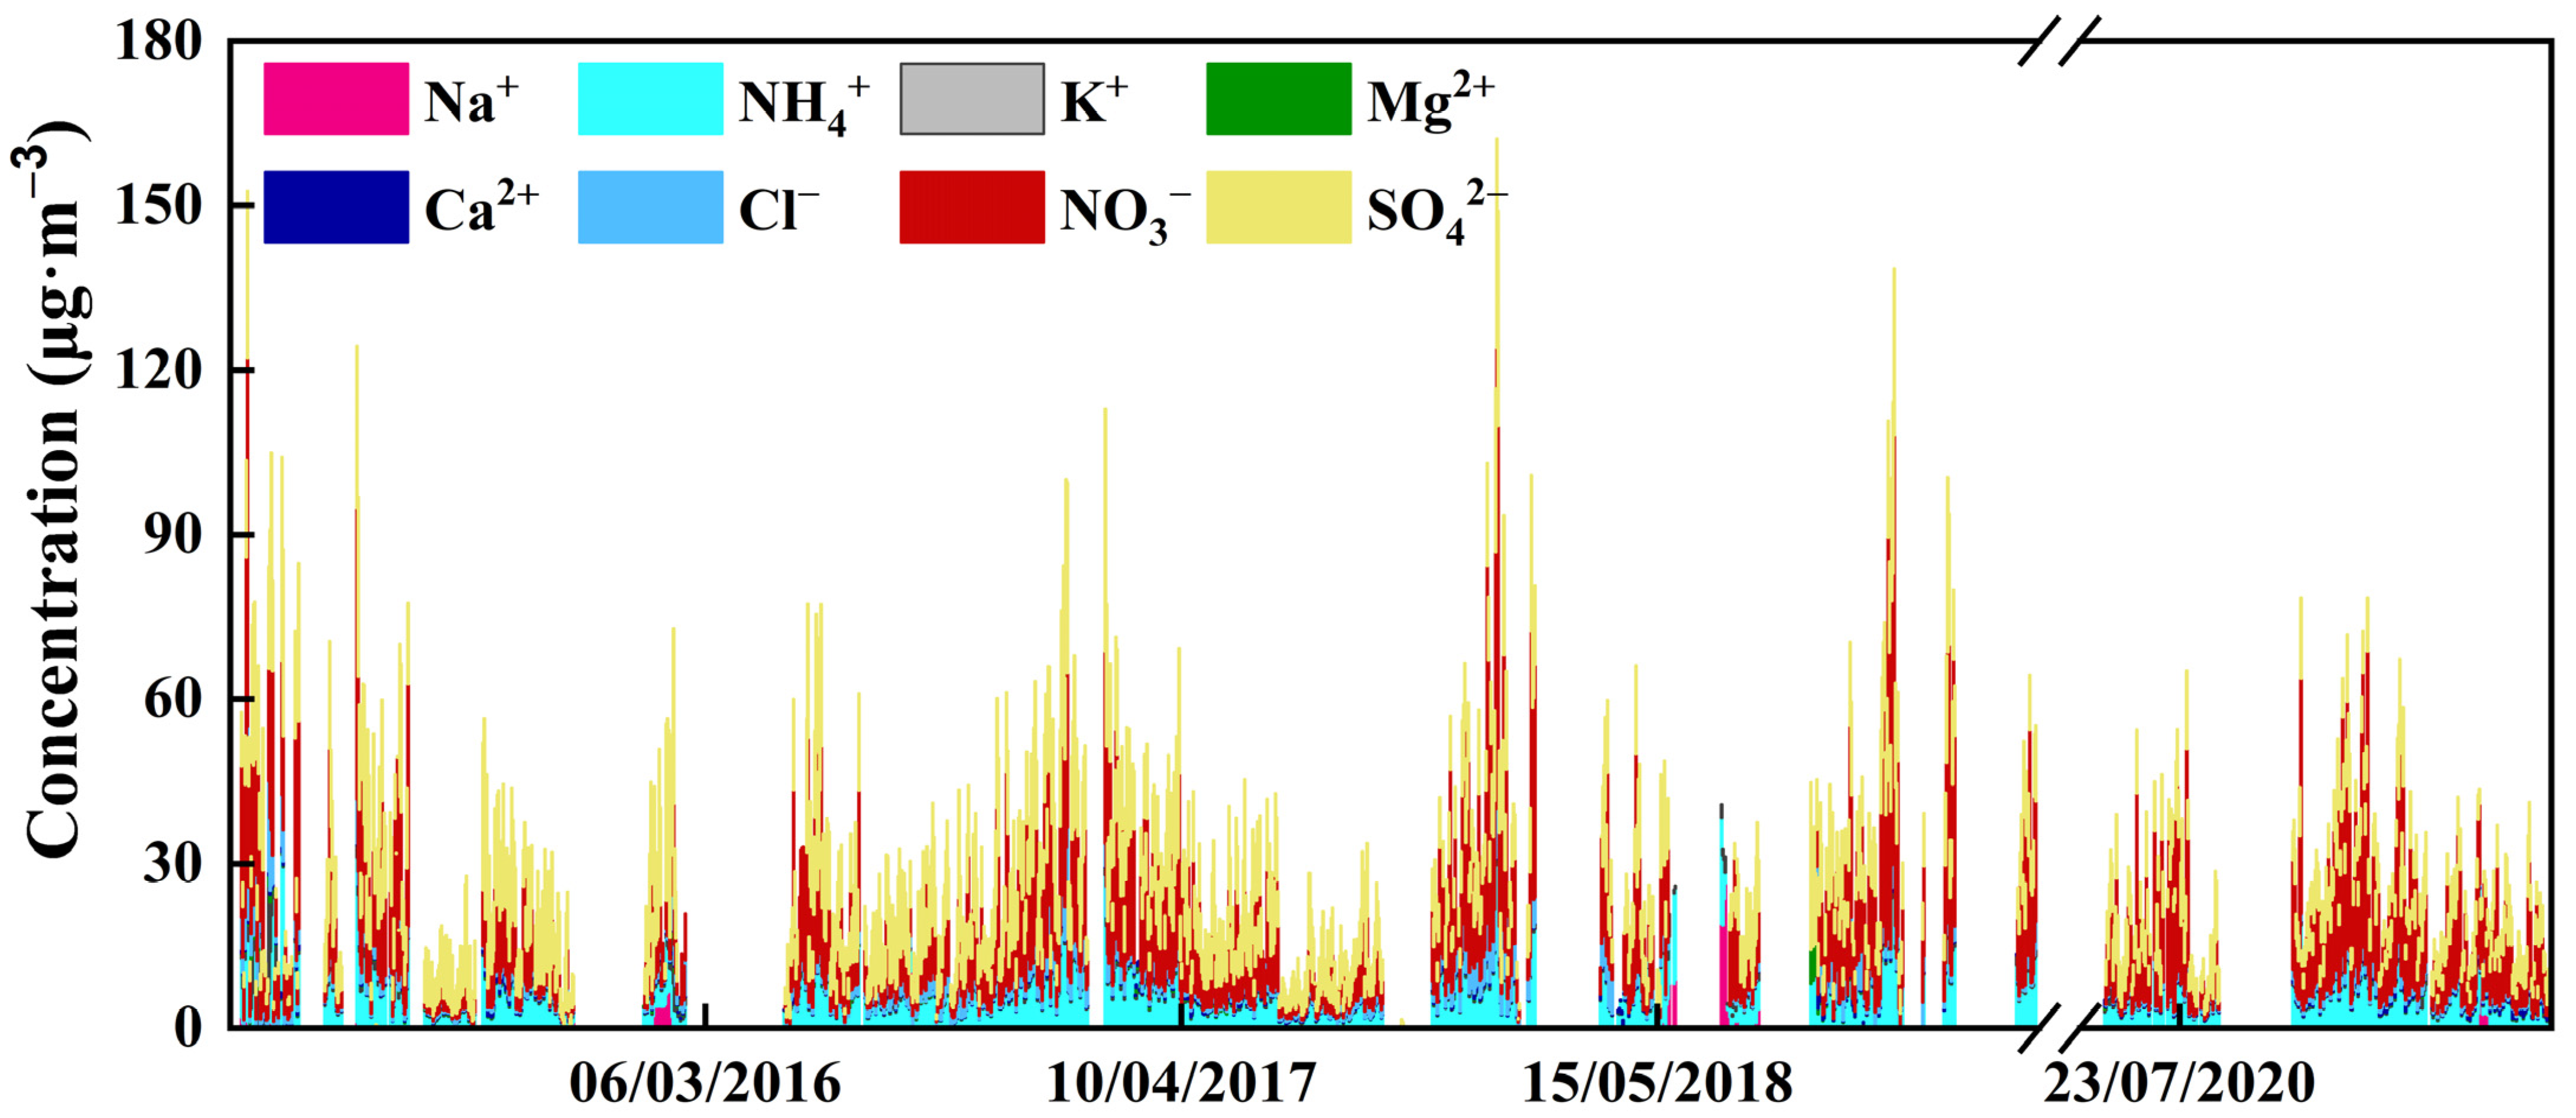
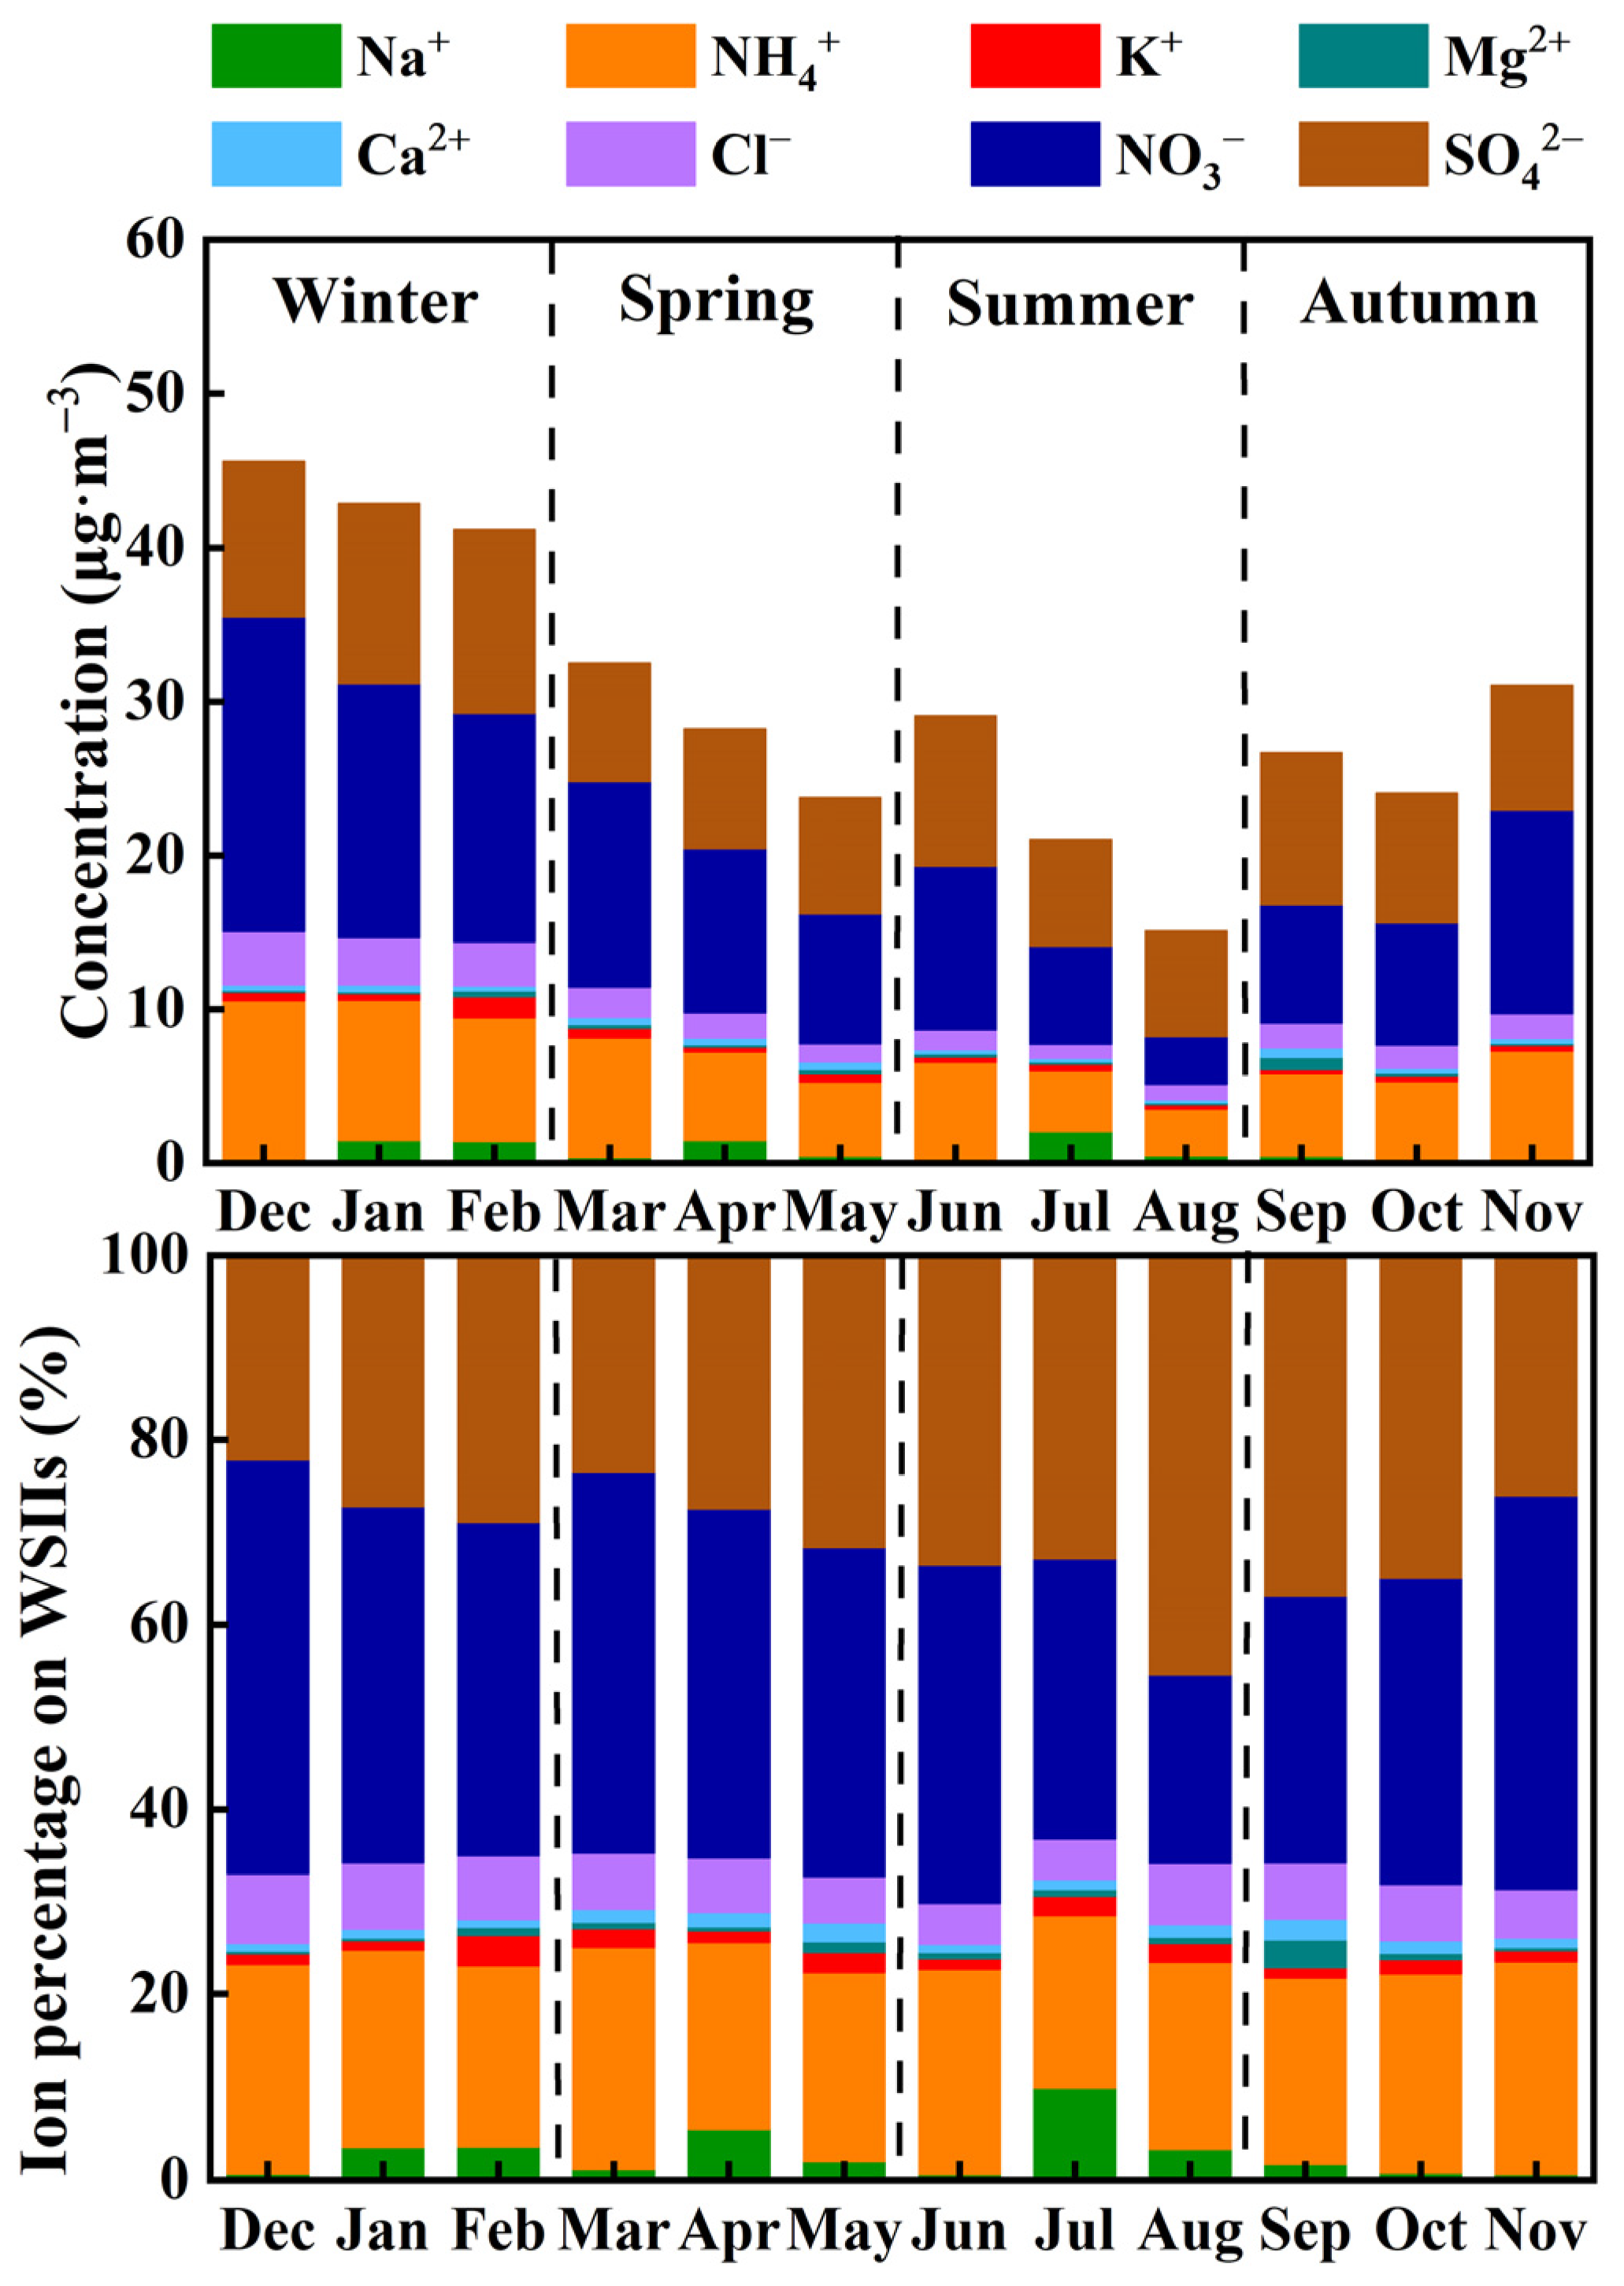
3.1. General Patterns of WSIIs in PM2.5

Figure 2 displays the time sequence of the concentrations of WSIIs during the observation period. The diurnal concentrations ranged from 0.96 to 162.1 μg·m−3, with the average value of 28.7 μg·m−3 (Table 1). Daily WSIIs concentrations changed over two orders of magnitude. The arrangement of daily average concentrations of eight ions was: NO3> SO42−> NH4+> Cl> Na+> K+> Ca2+>Mg2+. Among all the ions detected, nitrate, sulfate, and ammonium were the three most dominant species, accounting for 37.0%, 29.6%, and 21.2% of the total WSIIs, respectively. The large ratio of SNA (87.8%) implied that secondary formation was the prime pollution source of atmospheric particles in Nanjing.
The data of the ratio of nitrate to sulfate in this study were compared with those that had been measured in Nanjing in previously published studies (see Table 2). The mass ratio of NO3 to SO42− has been used to evaluate the importance of mobile sources vs stationary sources [39]. Previous studies have indicated that a ratio of NO3/SO42− greater than 1.0 suggests that mobile sources (vehicle emission) make a greater contribution [14]. It was indicated that mobile sources made more important contributions than stationary sources (coal burning) to the fine particle pollution of Nanjing in recent years. The main reasons may be the soaring number of vehicles and the operation of desulfurization engineering in the large cities [40,41]. Yu et al. [42] found that air pollution was reduced with the execution of the Air Pollution Prevention and Control Action Plan (APPCAP) in 2013.
Figure 3 presents the seasonal mass concentration and proportion of eight ion components in WSIIs. The seasonal variation of WSII in this work was in the decreasing order of winter (43.2 μg·m−3) > spring (28.1 μg·m−3) > autumn (24.2 μg·m−3) > summer (21.7 μg·m−3). Monthly average concentrations of WSIIs were the highest in December (45.6 μg·m−3) and the lowest in August (15.1 μg·m−3). Compared with summer, NH4+, NO3, and SO42− concentrations in winter all increased by up to 2.05, 2.58, and 1.43 times, respectively. It was likely that enhancing the use of fossil fuels in winter led to increased concentrations of pollutants such as SO2, NOX, and particulate matter, etc., further raising the concentration level of SNA [54]. In addition, high temperatures in summer promotes the volatilization of ammonium in particles and reduces NH4 in PM2.5 [55]. The seasonal variations of Cl mass concentrations were similar to that of SNA of the PM2.5 mass concentration; those contributions were greater in winter and lower in summer. The highest chloride concentration (3.1 μg·m−3) was due to the high emission sources in coal combustion in winter [13]. For K+ produced mainly from biomass burning, its average concentration was highest in winter (0.8 μg·m−3).

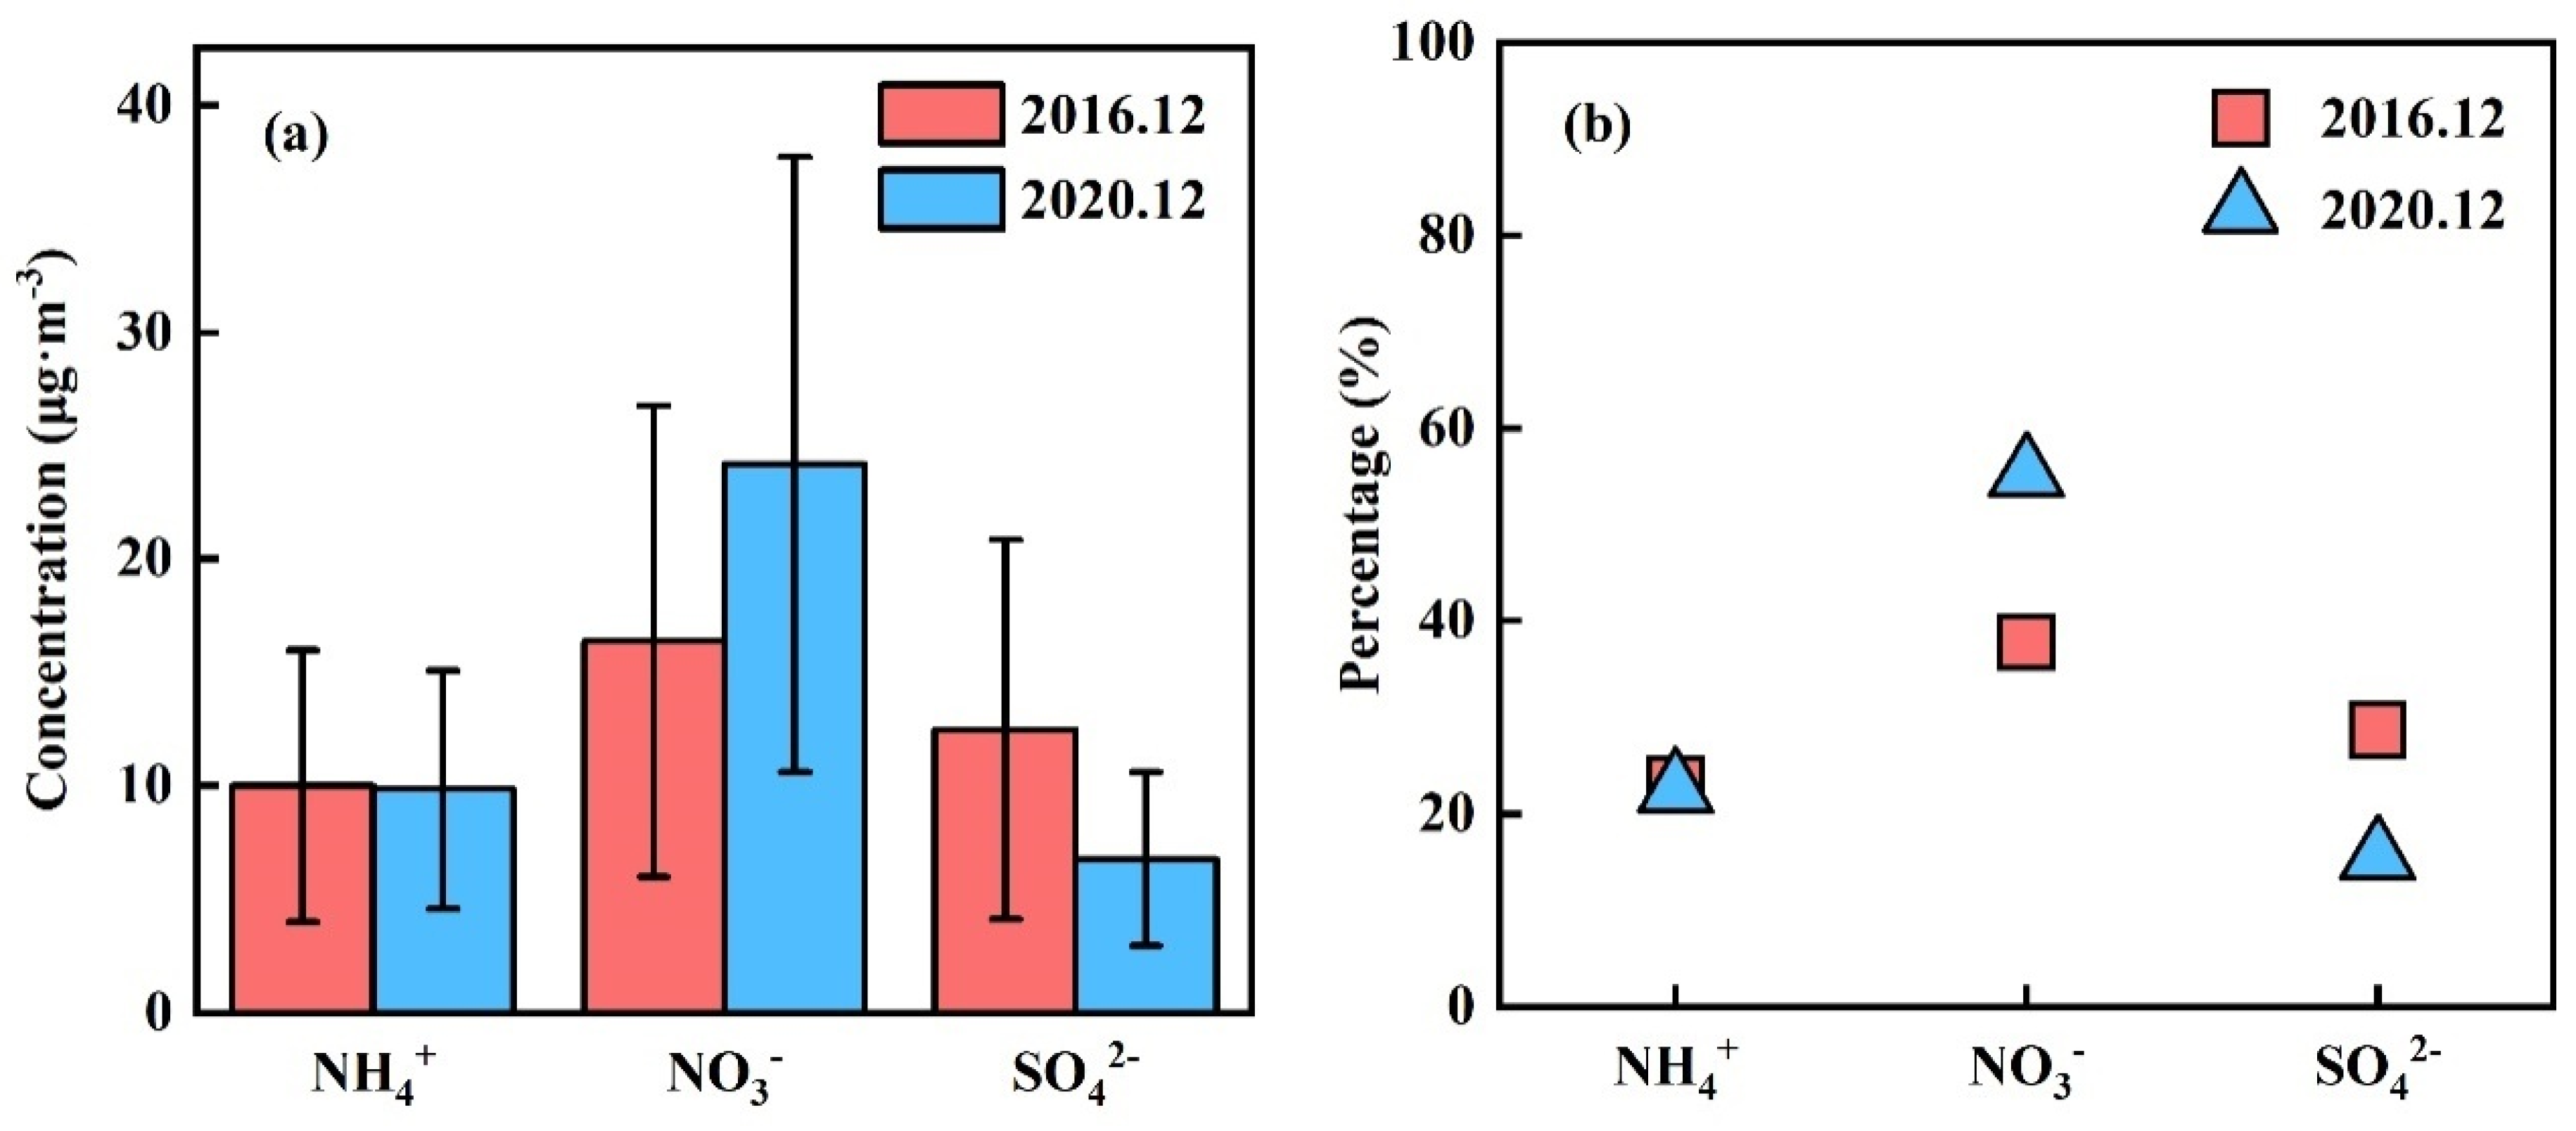
3.2. Variability of SNA

SNA were the dominant water-soluble ions in PM2.5 in Nanjing, accounting for more than 50%. of them Figure 4 demonstrates the average mass concentrations and percentages of SNA in December 2016 and 2020. Compared with sulfate and ammonium in 2016, the mean mass concentrations of SO42− (6.8 μg·m−3) greatly decreased and NH4+ (9.9 μg·m−3) slightly decreased in 2020. The decrease of SO42− and NH4+ proved to be the primary industrial emission reduction due to the emission reduction policy of the Chinese government [56]. Furthermore, the mean mass concentrations of NO3 (24.2 μg·m−3) in December 2020 was about 1.5 times higher than those in December 2016, which indicated the important contribution of nitrate ions emitted from mobile source gasoline-fueled vehicles.

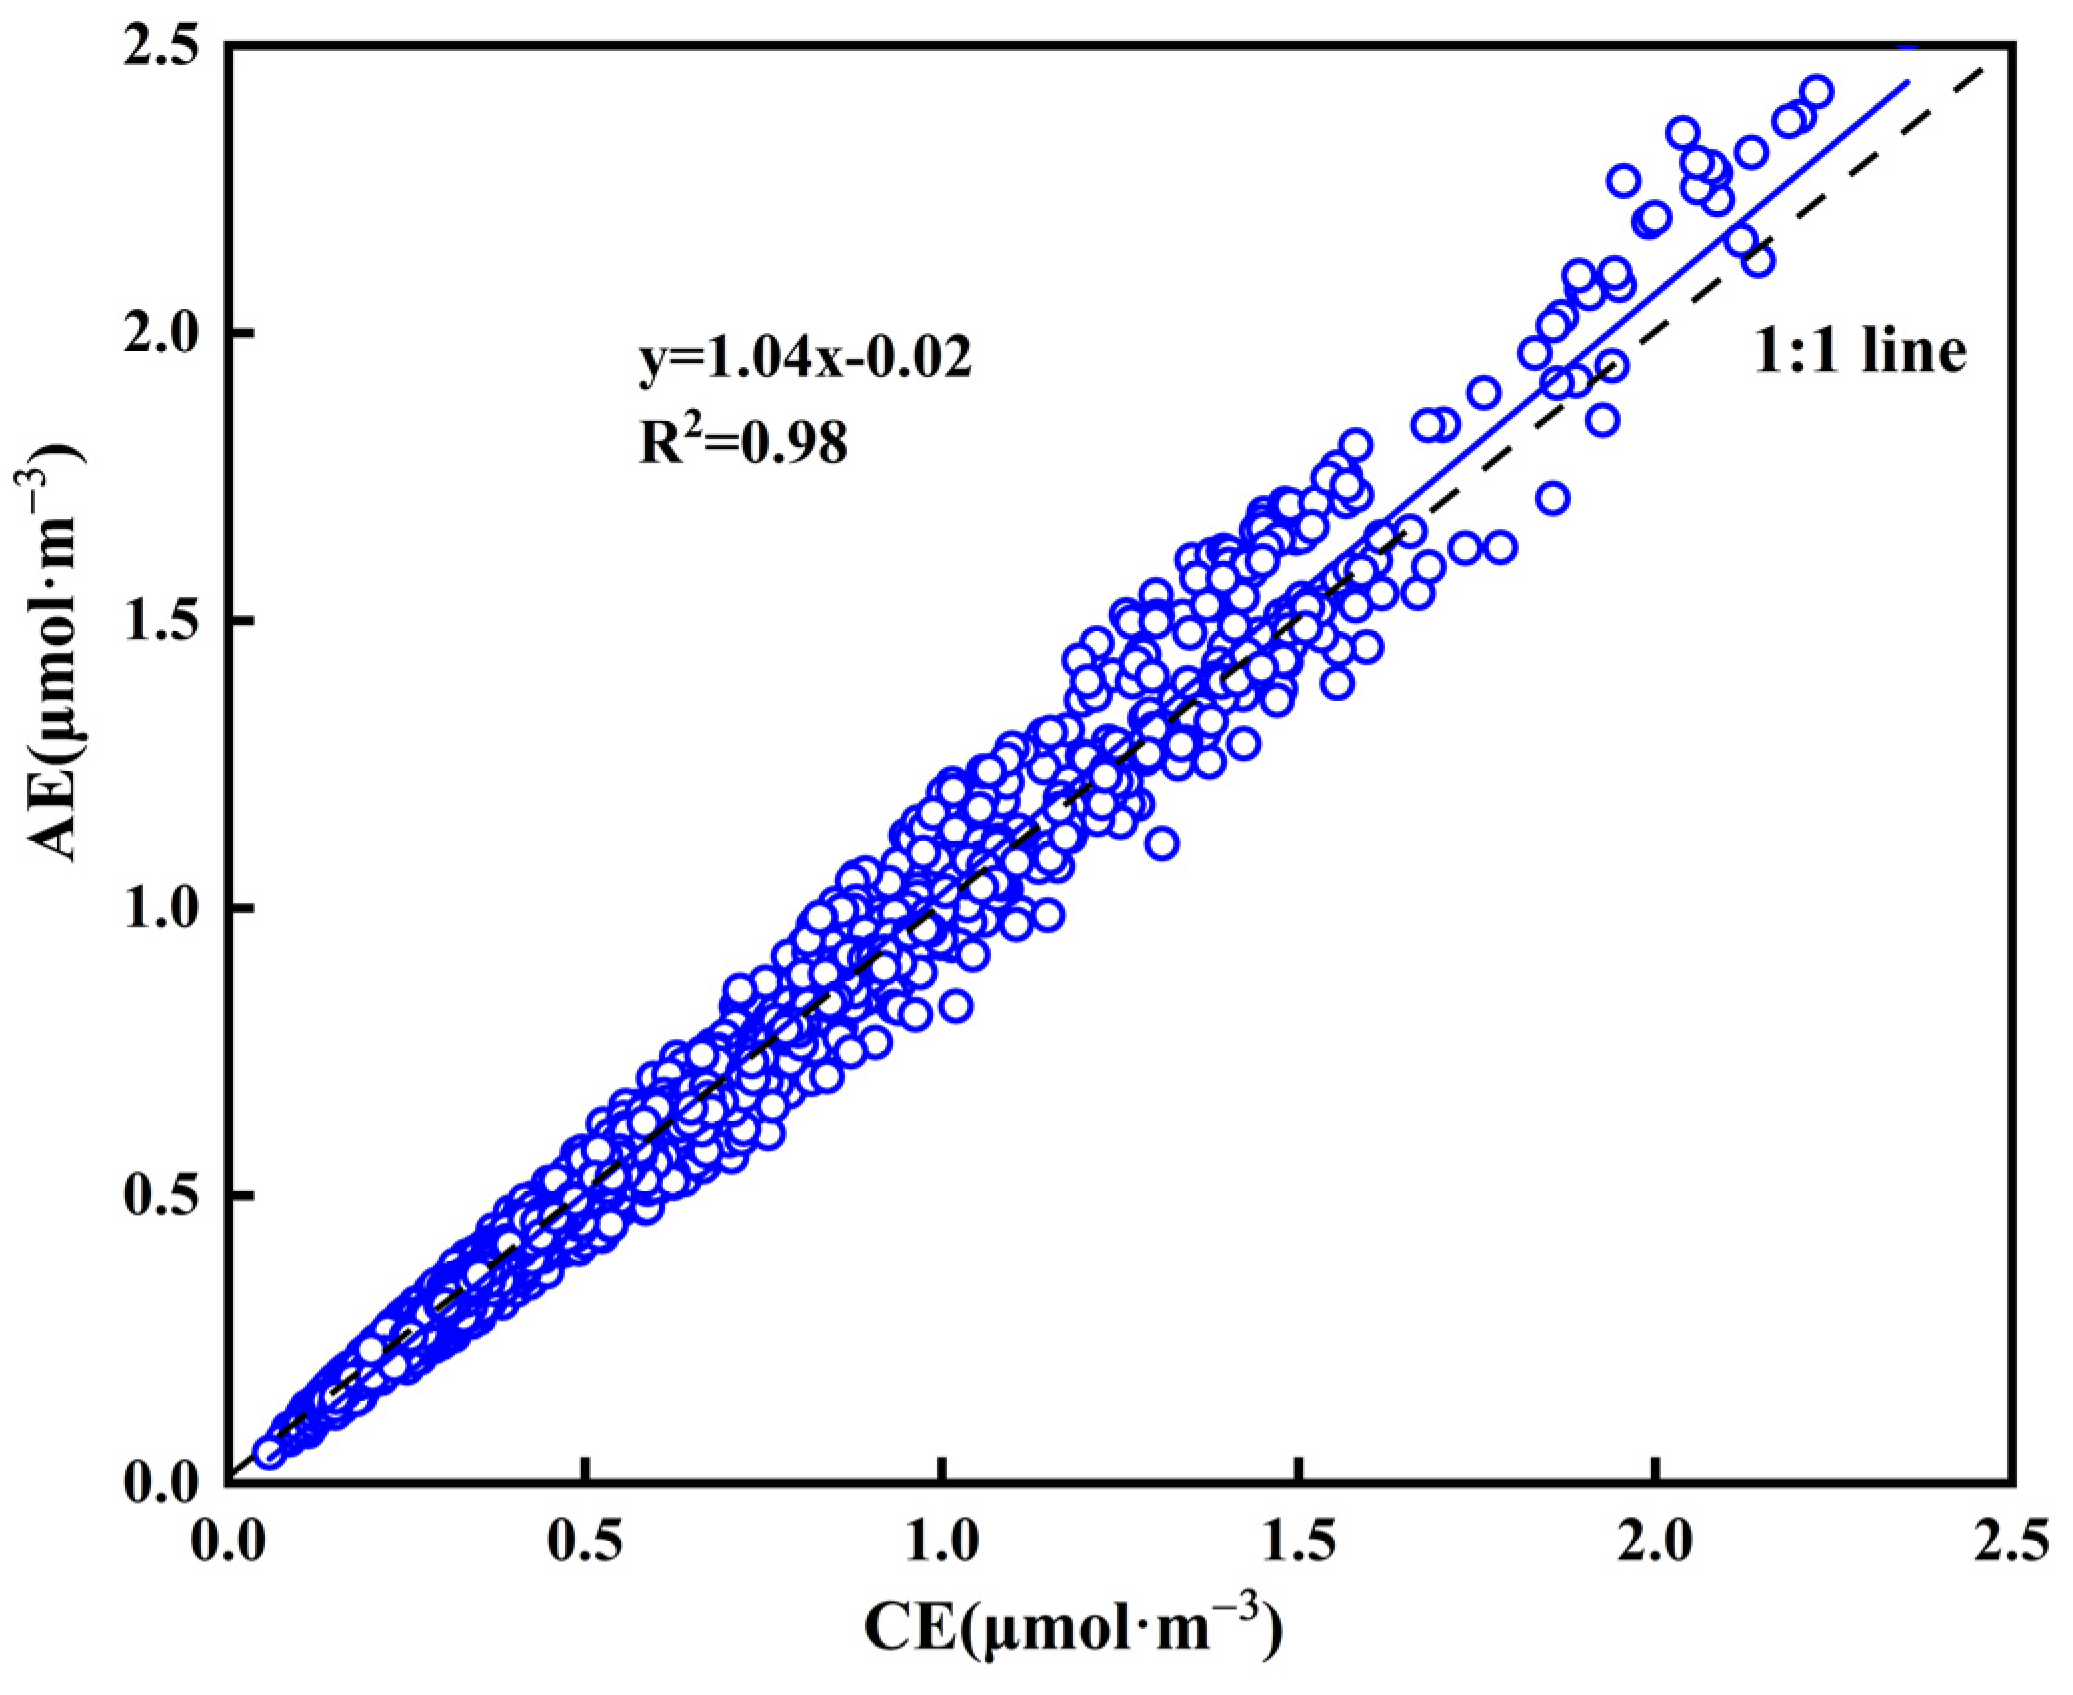
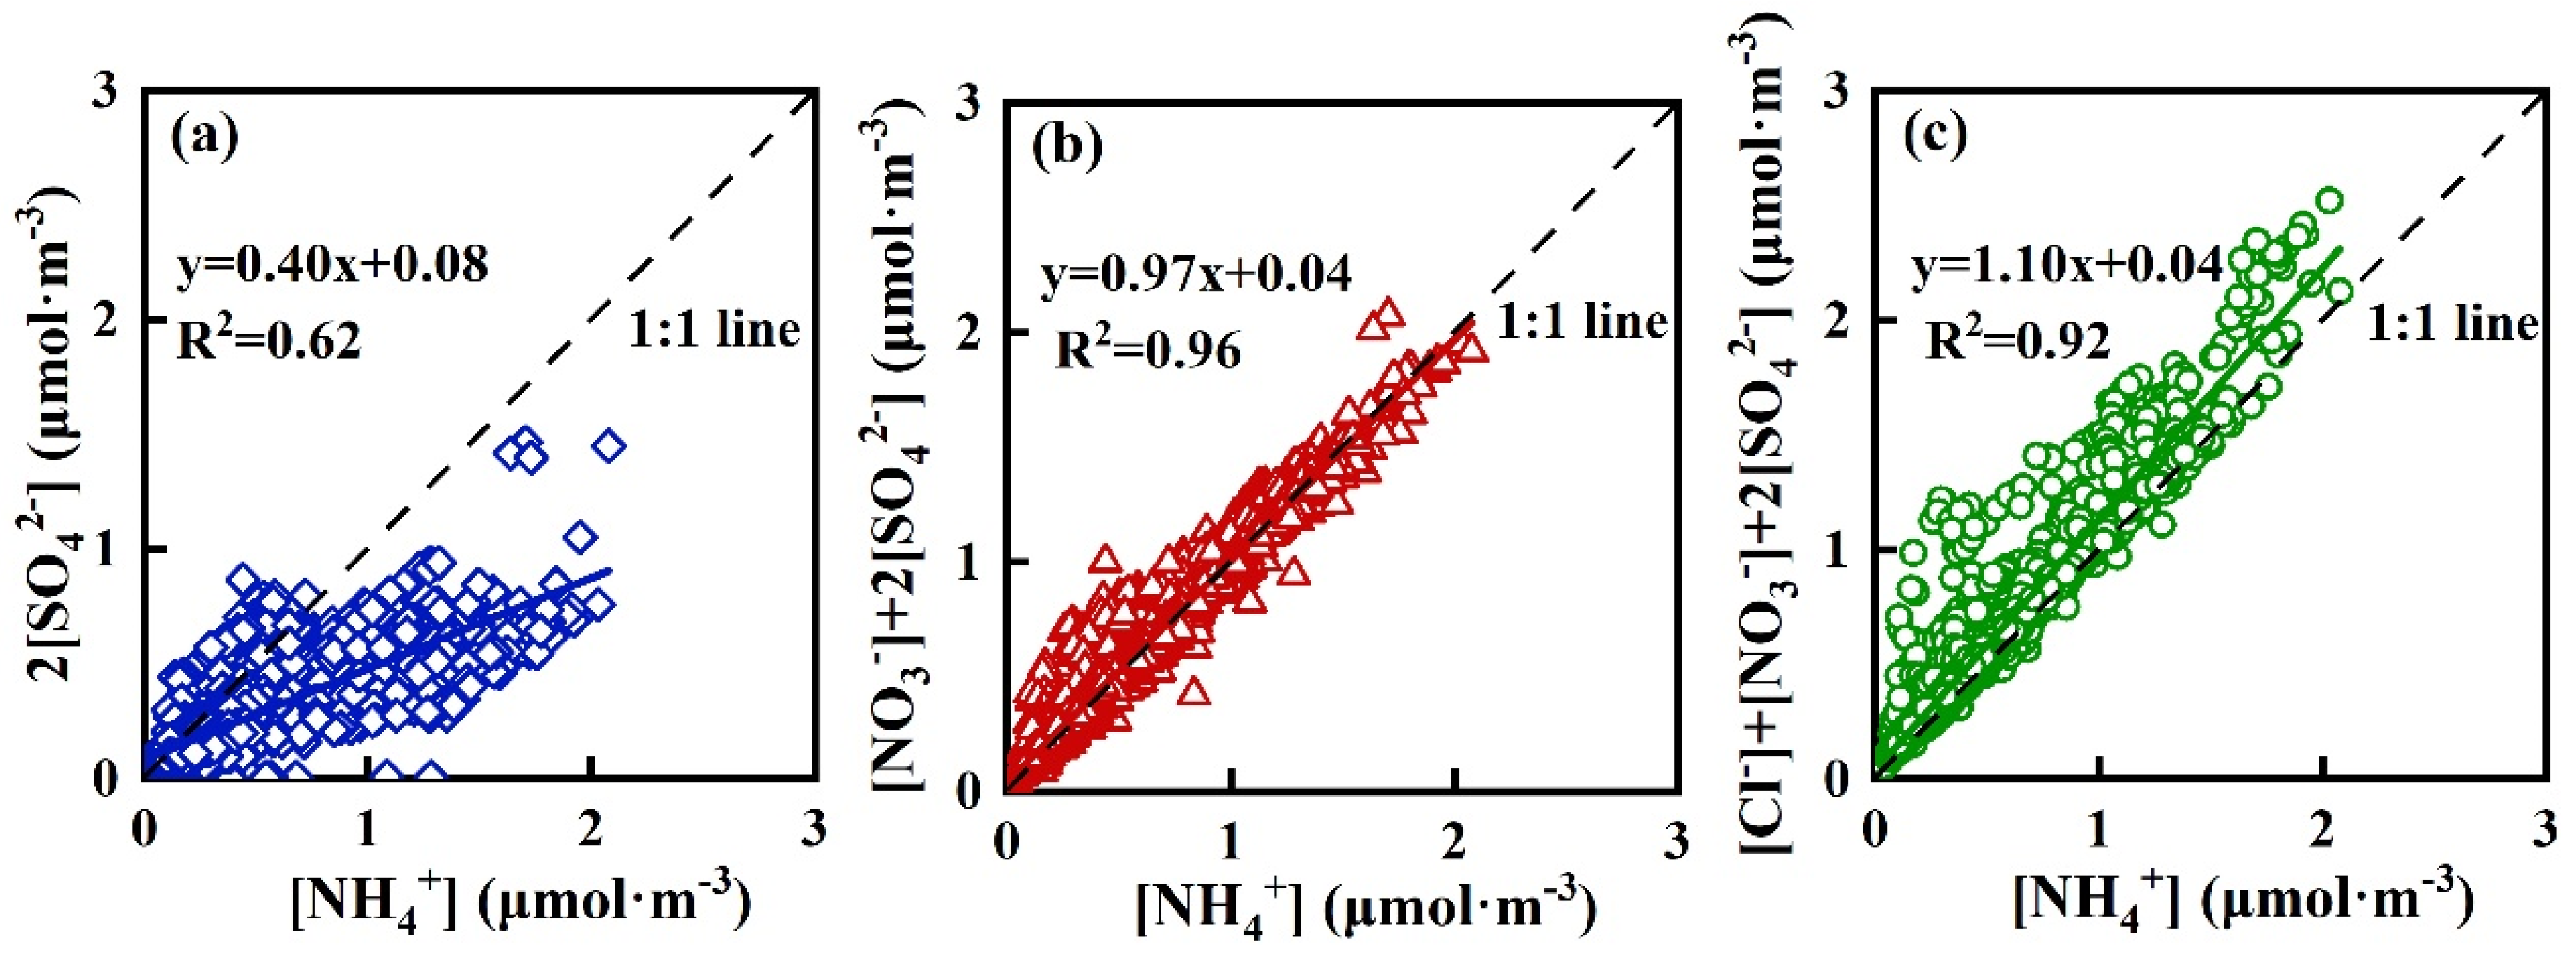
3.3. Aerosol Acidity and Chemical Forms of WSIIs

The ion balance equations were usually applied to comprehend the acid-base neutralization characteristics of PM2.5 [54]. The anion equivalent (AE) and cation equivalent (CE) were computed by converting the concentrations (μg·m−3) into micro equivalents (μmol·m−3) as follows:
AE = C l 35.5 + N O 3 62 + S O 4 2 48
CE = Na + 23 + N H 4 + 18 + K + 39 + M g + 12 + C a 2 + 20
Figure 5 reveals the scatter diagram of AE vs. CE during the observation periods. There was a strong correlation between AE and CE with correlation coefficient (R2 = 0.98). The slope of linear regression was slightly greater than 1, suggesting that Nanjing fine particles generally showed neutral or weak acidic characteristics. The average AE/CE value of 1.04 was similar to previous research results in Nanjing [20].
The neutralization factors (NF) are frequently used to assess the neutralization capacity of the particulate composition. The calculation of NF is based on the fact that SO42− and NO3 are considered as the dominant acidifying anions [57]. In this study, Na+/Cl equivalent ratios were estimated as 0.36, lower than that in seawater (1.1) [58], indicating that the contribution of Cl in neutralization could not be neglected because it could have other sources in addition to sea salt [59]. The NFs are calculated by the following equations [15]:
N F ( N H 4 + ) = [ N H 4 + ] 2 [ n s s S O 4 2 ] + [ N O 3 ] + [ C l ] [ N a + ] / 1.1
N F ( n s s K + ) = [ n s s K + ] 2 [ n s s S O 4 2 ] + [ N O 3 ] + [ C l ] [ N a + ] / 1.1
N F ( n s s M g 2 + ) = [ n s s M g 2 + ] [ n s s S O 4 2 ] + 2 [ N O 3 ] + 2 [ C l ] 2 [ N a + ] / 1.1
N F ( n s s C a 2 + ) = [ n s s C a 2 + ] [ n s s S O 4 2 ] + 2 [ N O 3 ] + 2 [ C l ] 2 [ N a + ] / 1.1  
Here, nssK+, nssMg2+, nssCa2+ and nssSO42− represent the non-sea salt (nss) fractions calculated using the equation as given by earlier studies [60].
n s s X = X i N a + i × ( X N a + ) s e a  
where, Xi and Na+i refers to the concentration of the ion and Na+ in aerosol samples and (X/Na+) sea is the seawater ratio of the respective ion and Na+. The (X/Na+) sea ratios for K+, Mg2+, Ca2+, and SO42− are 0.037, 0.120, 0.0385 and 0.2516, respectively [61,62].
Table 3 illustrates the NFs values estimated for four cations in PM2.5. The results revealed that the neutralization capacities of ions ranked as: NH4+ > nssK+ > nssCa2+ > nssMg2+. The ammonium was the dominant neutralizing cation with the maximum NF value (0.85), which was similar to the previous research results [57]. The NF values of nssK+, and nssMg2+ and nssCa2+ were all below 0.2, suggesting the relatively small influence of these ions on the neutralization. K+ was the second major contributor to neutralization of aerosol acidity, possibly due to the biomass burning activities [63]. The contribution of Ca2+ in neutralizing the aerosol acidity may be attributed to the effect of dust [57]. Mg2+ contributed the least to the neutralization of aerosol acidity.
Molar concentrations of NH4+ versus anions (SO42−, NO3 and Cl) are exhibited in Figure 6. The slope of linear regressions between 2 × [SO42−] and [NH4+] are lower than 1, which suggests that NH4+ was sufficient to neutralize SO42− to form (NH4)2SO4; this means that the chemical form of sulfate radical in this study was more ammonium sulfate than ammonium bisulfate. Figure 6b shows the stoichiometry between [NO3] + 2 × [SO42−] and [NH4+], and the slope of linear regressions was slightly less than 1. This result indicted that sufficient NH4+ could neutralize NO3 and SO42−, which suggests that NH4NO3 and (NH4)2SO4 may be dominant chemical forms of WSIIs in our research process. The scatter plots of [Cl] + [NO3] + 2[SO42−] and [NH4+] are illustrated in Figure 6c. The slope of linear regressions between [Cl] + [NO3] + 2[SO42−] and [NH4+] was higher than 1, which suggested that there were insufficient levels of NH4+ for Cl association to form NH4Cl. Previous researchers also found that NH4+ was not sufficient to completely neutralize Cl [13]. In addition to NH4Cl, excess Cl could combine with other cations such as K+.

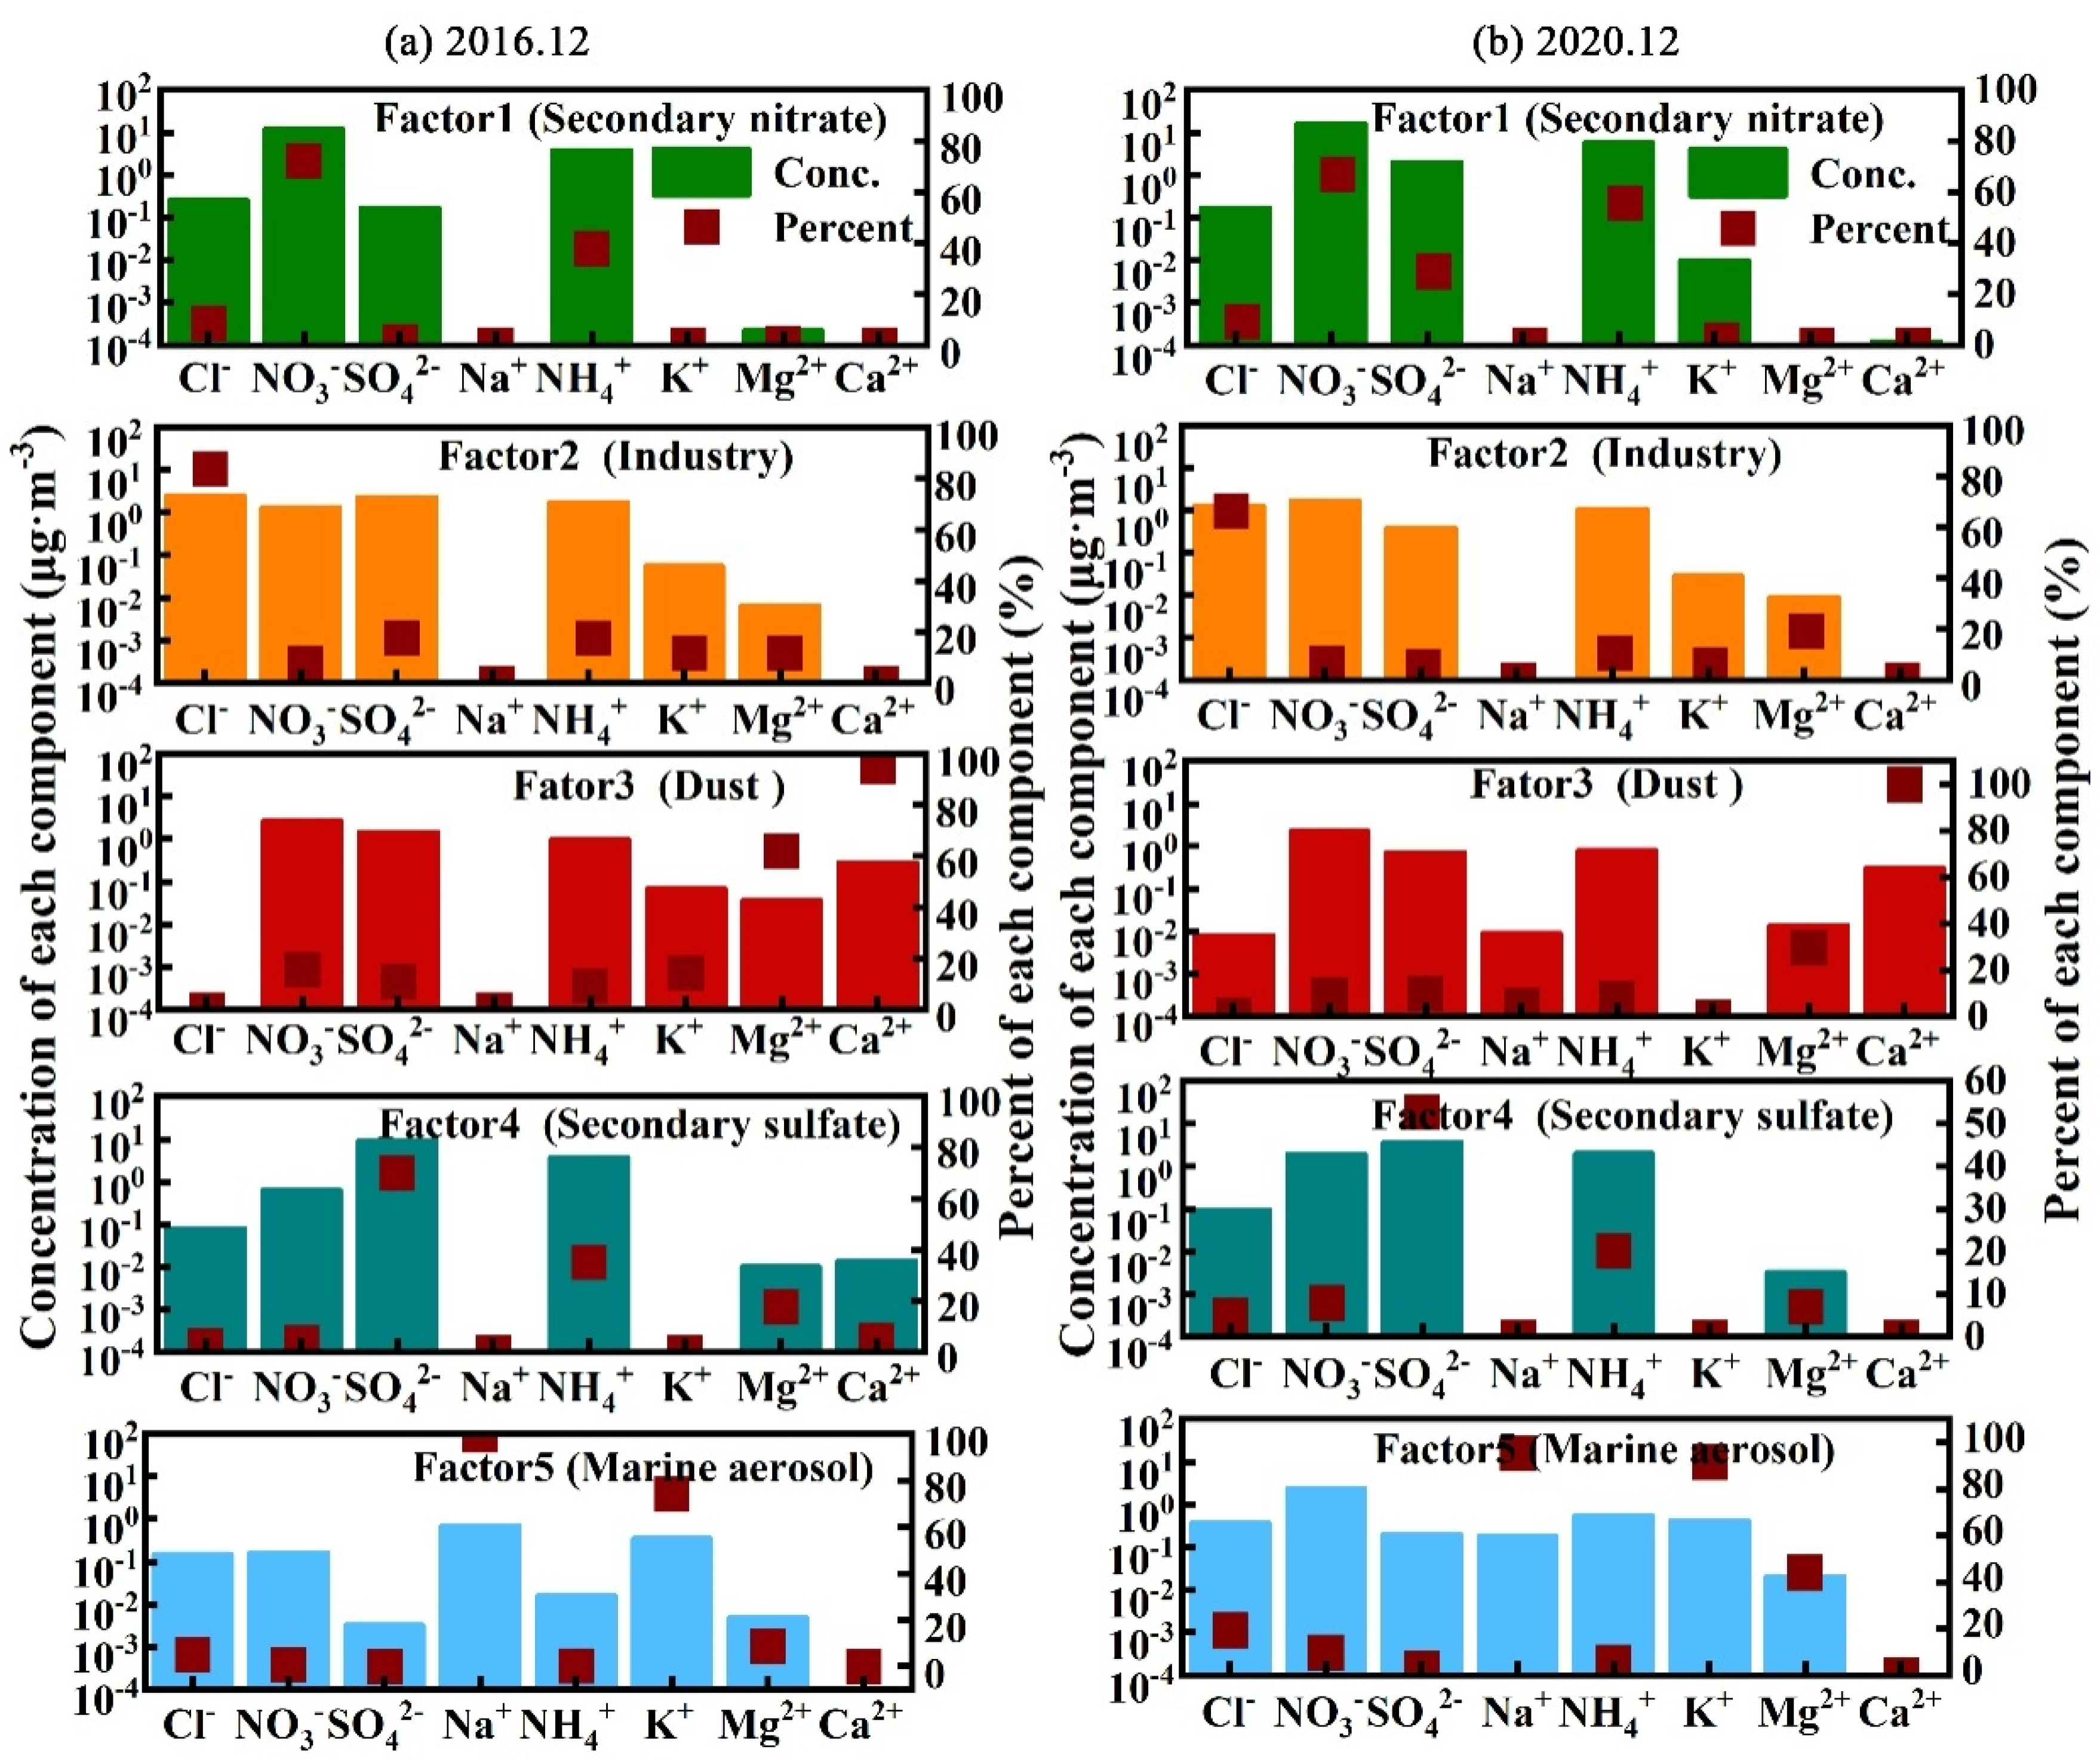
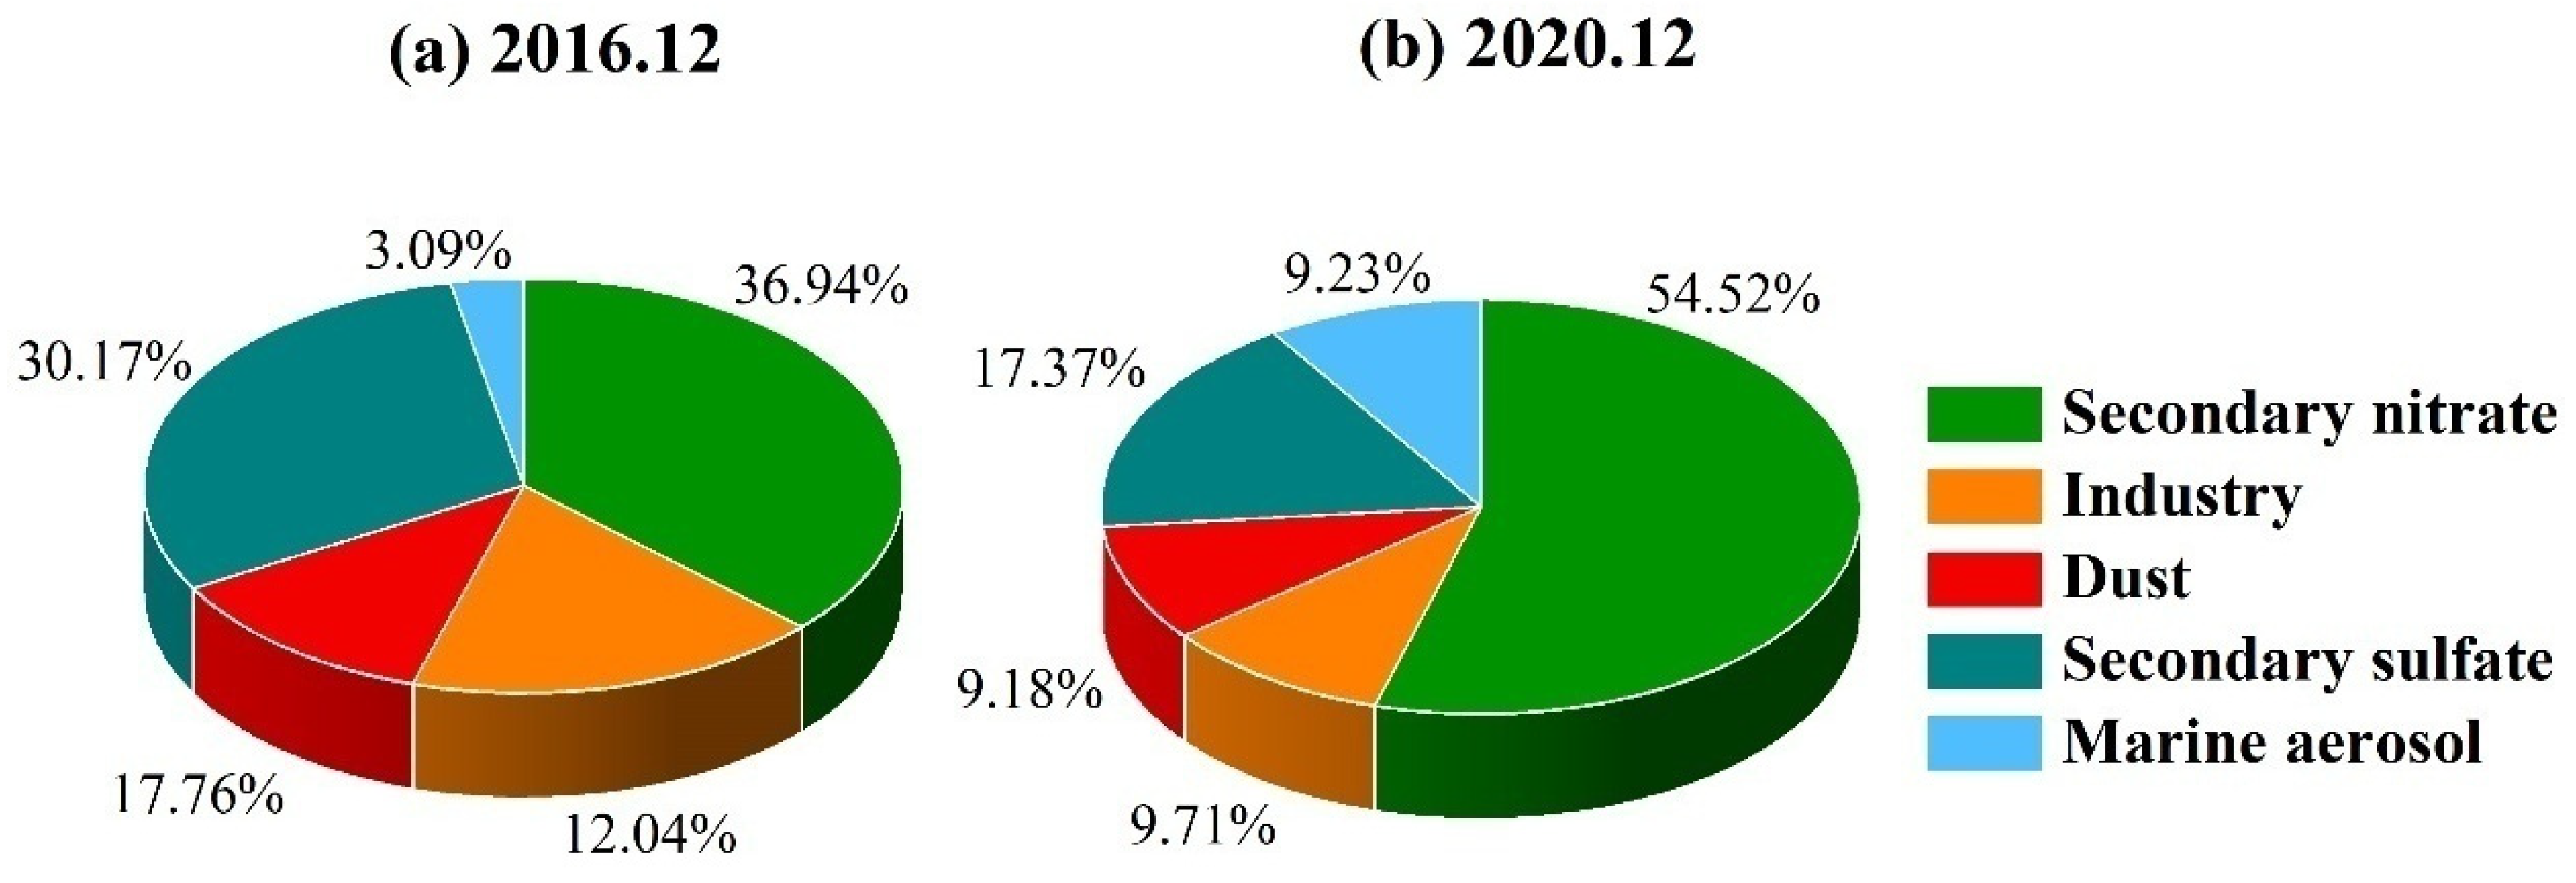
3.4. Source Identification

Figure 7 showed the source profiles derived from the PMF model between December 2016 and 2020. The first source (Factor 1) was characterized by the high loading of NO3 and NH4+, which could be identified as a secondary nitrate source. Particulate-related NO3 was formed primarily by the oxidation of nitrogen oxides derived from vehicle exhaust [64]. The second source (Factor 2) presented the industry based on the high contribution of Cl. Coal combustion is a typical industrial source which plays a key role in the formation of Cl [3]. The third source (Factor 3) was dust with typical crustal components (Mg2+ and Ca2+). Those ions were considered as makers of soil dust and desert dust, and thus this factor was identified as a dust source [65]. The fourth source (Factor 4) was weighted by SO42−, and could be interpreted as a secondary sulfate source. The major source of SO42− in the atmosphere was the oxidation of SO2, which came from industrial combustion [66,67]. The last source (Factor 5) could be treated as a marine aerosol. This factor was closely associated with the sea salt component (Na+).
The contributions of the above sources to PM2.5 are presented in Figure 8. In December 2016, the main pollution sources were secondary nitrate (36.94%), industry (12.04%), dust (17.76%), secondary sulfate (30.17%) and marine aerosol (3.09%). In December 2020, the contribution of secondary nitrate (54.52%) and marine aerosol (9.23%) increased. Its dense population and comparatively developed tertiary industry combined to make the air quality of Nanjing predominantly affected by traffic [47]. Therefore, the secondary nitrate accounted for the highest proportion and increased. The proportion of other sources decreased, which may be ascribed to the effectiveness of the APPCAP policy for reducing industrial emissions, particularly in removing sulfur from flue gas.
In order to determine the potential pollution source areas of secondary transformation sources in Nanjing, the PSCF analysis was used for the three main components of NH4+, NO3 and SO42− (Figure 9). In December 2016, the source contribution of the three ionic components were similar. High WPSCF values of NH4+ (Figure 9a), NO3 (Figure 9b) and SO42− (Figure 9c) were located to the South of Jiangsu, indicating that local emissions had an impact on the formation and maintenance of particle pollution. A small part was transported from North Anhui and South Shanxi, with WPSCF values above 0.6. In December 2020, the WPSCF values of NH4+ (Figure 9d), NO3 (Figure 9e) and SO42− (Figure 9f) increased the most for the air masses transported from the East of Henan, suggesting the influence of the regional transportation of secondary aerosols on air quality in Nanjing. The NH4+ in Nanjing mainly came from the agricultural activities in the developed agricultural provinces of Henan. For SO42−, the high WPSCF values were located in Henan. There is heating in this area, so increased coal burning for indoor heat could produce higher SO42− levels [68]. In addition, the increased WPSCF values in Henan were verified by recent studies indicating that the Fenwei Plain (FWP) suffered severe PM2.5 pollution with prominent spatial clustering characteristics due to the developed iron and steel industry in recent years [69,70]. For NO3, the potential pollution source areas of NO3 mainly concentrated in the north of Anhui and the northwest Jiangsu province. This indicated that the traffic and human activities in these areas had a certain impact on the pollution accumulation in Nanjing. NH4+ and SO42− had higher WPSCF peak values than NO3, and with wider potential areas. This indicated that higher emissions and the secondary formation of ammonia and sulphate through air mass transportation from these regions were the main potential source contributions.

4. Conclusions

In this study, the variations of water-soluble ions and sources of PM2.5 in Nanjing were investigated in detail. The major findings of the paper are as follows:
The average concentration of total WSIIs was 28.7 μg·m−3, dominated by NO3, and followed by SO42− and NH4+. The mean mass ratio of NO3/SO42− was 1.59, demonstrating that mobile emission was a dominant contributor to PM2.5. The total WSIIs showed the highest concentrations in winter (43.2 μg·m−3) and the lowest values in summer (21.7 μg·m−3) due to higher emission and unfavorable diffusion conditions in winter. High temperatures in the summer promoted the dissociation of NH4NO3 and consequently reduced NH4+ and NO3. An ion balance analysis showed that aerosol particles were neutral or slightly acidic (AE/CE: 1.04). Among all cations, NH4+ was the predominant neutralizing species, with highest NF value. (NH4)2SO4, NH4NO3 and NH4Cl were the dominant ion forms.
The comparison of concentrations, source contributions and potential source areas have been studied further between December 2016 and 2020. The NO3 concentration changes in December were the most significant, increasing from 16.4 μg·m−3 in December 2016 to 24.2 μg·m−3 in December2020, but SO42− and NH4+ concentrations decreased from 12.5, 10.0 μg·m−3 in December 2016 to 6.8, 9.9 in December 2020, respectively. Compared to the same period in 2016, the percentages of secondary nitrate increased 17.9% in December 2020 with the vehicle exhaust emission increases. The proportion of secondary sulfate, dust and industry decreased from 30.2%, 17.8%, and 12.0% to 17.4%, 9.2%, and 9.7%, respectively. Further studies should investigate the influencing factors and secondary aerosol formation processes.

Author Contributions

Conceptualization, methodology, funding acquisition, supervision, project administration, K.C.; data curation, software, G.X.; writing original draft preparation, Q.G. All authors have read and agreed to the published version of the manuscript.

Funding

This research was funded by the National Natural Science Foundation of China, grant numbers 42230604, 42075176 and 42006190.

Institutional Review Board Statement

Not applicable.

Informed Consent Statement

Not applicable.

Data Availability Statement

The datasets generated and analyzed during the current study are available from the corresponding author upon reasonable request.

Acknowledgments

The authors are grateful to the editors and anonymous reviewers for their insightful comments and helpful suggestions.

Conflicts of Interest

The authors declare that they have no conflicts of interest.

References

  1. Wright, L.P.; Zhang, L.; Cheng, I.; Aherne, J.; Wentworth, G.R. Impacts and effects indicators of atmospheric deposition of major pollutants to various ecosystems—A Review. Aerosol Air Qual. Res. 2018, 18, 1953–1992. [Google Scholar] [CrossRef] [Green Version]
  2. Zhang, X.; Zhang, K.; Lv, W.; Liu, B.; Aikawa, M.; Wang, J. Characteristics and risk assessments of heavy metals in fine and coarse particles in an industrial area of central China. Ecotox. Environ. Saf. 2019, 179, 1–8. [Google Scholar] [CrossRef] [PubMed]
  3. Liu, Z.; Xie, Y.; Hu, B.; Wen, T.; Xin, J.; Li, X.; Wang, Y. Size-resolved aerosol water-soluble ions during the summer and winter seasons in Beijing: Formation mechanisms of secondary inorganic aerosols. Chemosphere 2017, 183, 119–131. [Google Scholar] [CrossRef] [PubMed]
  4. Zhang, Q.; Quan, J.; Tie, X.; Li, X.; Liu, Q.; Gao, Y.; Zhao, D. Effects of meteorology and secondary particle formation on visibility during heavy haze events in Beijing, China. Sci. Total Environ. 2015, 502, 578–584. [Google Scholar] [CrossRef] [PubMed]
  5. Dai, W.; Gao, J.; Cao, G.; Ouyang, F. Chemical composition and source identification of PM2.5 in the suburb of Shenzhen, China. Atmos. Res. 2013, 122, 391–400. [Google Scholar] [CrossRef]
  6. He, Q.; Yan, Y.; Guo, L.; Zhang, Y.; Zhang, G.; Wang, X. Characterization and source analysis of water-soluble inorganic ionic species in PM2.5 in Taiyuan city, China. Atmos. Res. 2017, 184, 48–55. [Google Scholar] [CrossRef]
  7. Zhou, Y.; Wang, T.; Gao, X.; Xue, L.; Wang, X.; Wang, Z.; Gao, J.; Zhang, Q.; Wang, W. Continuous observations of water-soluble ions in PM2.5 at Mount Tai (1534 m a.s.l.) in central-eastern China. J. Atmos. Chem. 2010, 64, 107–127. [Google Scholar] [CrossRef]
  8. Ding, J.; Zhao, P.; Su, J.; Dong, Q.; Du, X.; Zhang, Y. Aerosol pH and its driving factors in Beijing. Atmos. Chem. Phys. 2019, 19, 7939–7954. [Google Scholar] [CrossRef] [Green Version]
  9. Su, J.; Zhao, P.; Ding, J.; Du, X.; Dou, Y. Insights into measurements of water-soluble ions in PM2.5 and their gaseous precursors in Beijing. J. Environ. Sci. 2021, 102, 123–137. [Google Scholar] [CrossRef]
  10. Yang, Y.; Zhou, R.; Yu, Y.; Yan, Y.; Liu, Y.; Di, Y.; Wu, D.; Zhang, W. Size-resolved aerosol water-soluble ions at a regional background station of Beijing, Tianjin, and Hebei, North China. J. Environ. Sci. 2017, 55, 146–156. [Google Scholar] [CrossRef]
  11. Meng, C.C.; Wang, L.T.; Zhang, F.F.; Wei, Z.; Ma, S.M.; Ma, X.; Yang, J. Characteristics of concentrations and water-soluble inorganic ions in PM2.5 in Handan City, Hebei province, China. Atmos. Res. 2016, 171, 133–146. [Google Scholar] [CrossRef]
  12. Zhang, J.; Tong, L.; Huang, Z.; Zhang, H.; He, M.; Dai, X.; Zheng, J.; Xiao, H. Seasonal variation and size distributions of water-soluble inorganic ions and carbonaceous aerosols at a coastal site in Ningbo, China. Sci. Total Environ. 2018, 639, 793–803. [Google Scholar] [CrossRef] [PubMed]
  13. Xu, J.S.; Xu, M.X.; Snape, C.; He, J.; Behera, S.N.; Xu, H.H.; Ji, D.S.; Wang, C.J.; Yu, H.; Xiao, H. Temporal and spatial variation in major ion chemistry and source identification of secondary inorganic aerosols in Northern Zhejiang Province, China. Chemosphere 2017, 179, 316–330. [Google Scholar] [CrossRef] [PubMed]
  14. Zhou, J.; Xing, Z.; Deng, J.; Du, K. Characterizing and sourcing ambient PM2.5 over key emission regions in China I: Water-soluble ions and carbonaceous fractions. Atmos. Environ. 2016, 135, 20–30. [Google Scholar] [CrossRef]
  15. Wang, Y.; Ying, Q.; Hu, J.; Zhang, H. Spatial and temporal variations of six criteria air pollutants in 31 provincial capital cities in China during 2013–2014. Environ. Int. 2014, 73, 413–422. [Google Scholar] [CrossRef]
  16. Yang, H.; Yu, J.Z.; Ho, S.S.H.; Xu, J.; Wu, W.-S.; Wan, C.H.; Wang, X.; Wang, X.; Wang, L. The chemical composition of inorganic and carbonaceous materials in PM2.5 in Nanjing, China. Atmos. Environ. 2005, 39, 3735–3749. [Google Scholar] [CrossRef] [Green Version]
  17. Wang, G.; Wang, H.; Yu, Y.; Gao, S.; Feng, J.; Gao, S.; Wang, L. Chemical characterization of water-soluble components of PM10 and PM2.5 atmospheric aerosols in five locations of Nanjing, China. Atmos. Environ. 2003, 37, 2893–2902. [Google Scholar] [CrossRef]
  18. Zhang, X.; Zhao, X.; Ji, G.; Ying, R.; Shan, Y.; Lin, Y. Seasonal variations and source apportionment of water-soluble inorganic ions in PM2.5 in Nanjing, a megacity in southeastern China. J. Atmos. Chem. 2019, 76, 73–88. [Google Scholar] [CrossRef]
  19. Wang, G.; Huang, L.; Gao, S.; Gao, S.; Wang, L. Characterization of water-soluble species of PM10 and PM2.5 aerosols in urban area in Nanjing, China. Atmos. Environ. 2002, 36, 1299–1307. [Google Scholar] [CrossRef]
  20. Wang, H.; Zhu, B.; Shen, L.; Xu, H.; An, J.; Xue, G.; Cao, J. Water-soluble ions in atmospheric aerosols measured in five sites in the Yangtze River Delta, China: Size-fractionated, seasonal variations and sources. Atmos. Environ. 2015, 123, 370–379. [Google Scholar] [CrossRef]
  21. Zhan, Y.; Xie, M.; Gao, D.; Wang, T.; Zhang, M.; An, F. Characterization and source analysis of water-soluble inorganic ionic species in PM2.5 during a wintertime particle pollution episode in Nanjing, China. Atmos. Res. 2021, 262, 105769. [Google Scholar] [CrossRef]
  22. Fu, Q.; Zhuang, G.; Wang, J.; Xu, C.; Huang, K.; Li, J.; Hou, B.; Lu, T.; Streets, D.G. Mechanism of formation of the heaviest pollution episode ever recorded in the Yangtze River Delta, China. Atmos. Environ. 2008, 42, 2023–2036. [Google Scholar] [CrossRef]
  23. Li, H.; Wang, Q.G.; Yang, M.; Li, F.; Wang, J.; Sun, Y.; Wang, C.; Wu, H.; Qian, X. Chemical characterization and source apportionment of PM2.5 aerosols in a megacity of Southeast China. Atmos. Res. 2016, 181, 288–299. [Google Scholar] [CrossRef]
  24. Liu, A.; Wang, H.; Cui, Y.; Shen, L.; Yin, Y.; Wu, Z.; Guo, S.; Shi, S.; Chen, K.; Zhu, B. Characteristics of Aerosol during a Severe Haze-Fog Episode in the Yangtze River Delta: Particle Size Distribution, Chemical Composition, and Optical Properties. Atmosphere 2020, 11, 56. [Google Scholar] [CrossRef] [Green Version]
  25. Wang, H.; Zhu, B.; Shen, L.; Kang, H. Size distributions of aerosol and water-soluble ions in Nanjing during a crop residual burning event. J. Environ. Sci. 2012, 24, 1457–1465. [Google Scholar] [CrossRef] [PubMed]
  26. Hu, R.; Wang, H.L.; Yin, Y.; Zhu, B.; Xia, L.; Zhang, Z.F.; Chen, K. Measurement of ambient aerosols by single particle mass spectrometry in the Yangtze River Delta, China: Seasonal variations, mixing state and meteorological effects. Atmos. Res. 2018, 213, 562–575. [Google Scholar] [CrossRef]
  27. Chen, X.; Walker, J.T.; Geron, C. Chromatography related performance of the Monitor for AeRosols and GAses in ambient air (MARGA): Laboratory and field-based evaluation. Atmos. Meas. Tech. 2017, 10, 3893–3908. [Google Scholar] [CrossRef] [Green Version]
  28. Wen, L.; Chen, J.; Yang, L.; Wang, X.; Caihong, X.; Sui, X.; Yao, L.; Zhu, Y.; Zhang, J.; Zhu, T. Enhanced formation of fine particulate nitrate at a rural site on the North China Plain in summer: The important roles of ammonia and ozone. Atmos. Environ. 2015, 101, 294–302. [Google Scholar] [CrossRef]
  29. Li, L.; Lai, W.; Pu, J.; Mo, H.; Dai, D.; Wu, G.; Deng, S. Polar organic tracers in PM2.5 aerosols from an inland background area in Southwest China: Correlations between secondary organic aerosol tracers and source apportionment. J. Environ. Sci. 2018, 69, 281–293. [Google Scholar] [CrossRef]
  30. Tao, J.; Zhang, L.; Cao, J.; Zhong, L.; Chen, D.; Yang, Y.; Chen, D.; Chen, L.; Zhang, Z.; Wu, Y. Source apportionment of PM2.5 at urban and suburban areas of the Pearl River Delta region, south China—With emphasis on ship emissions. Sci. Total Environ. 2017, 574, 1559–1570. [Google Scholar] [CrossRef]
  31. Xie, Y.; Lu, H.; Yi, A.; Zhang, Z.; Zheng, N.; Fang, X.; Xiao, H. Characterization and source analysis of water–soluble ions in PM2.5 at a background site in Central China. Atmos. Res. 2020, 239, 104881. [Google Scholar] [CrossRef]
  32. Liu, Q.; Liu, Y.; Zhao, Q.; Zhang, T.; Schauer, J.J. Increases in the formation of water soluble organic nitrogen during Asian dust storm episodes. Atmos. Res. 2021, 253, 105486. [Google Scholar]
  33. Zhang, Y.; Sheesley, R.J.; Schauer, J.J.; Lewandowski, M.; Jaoui, M.; Offenberg, J.H.; Kleindienst, T.E.; Edney, E.O. Source apportionment of primary and secondary organic aerosols using positive matrix factorization (PMF) of molecular markers. Atmos. Environ. 2009, 43, 5567–5574. [Google Scholar] [CrossRef]
  34. Zheng, H.; Kong, S.; Chen, N.; Yan, Y.; Liu, D.; Zhu, B.; Xu, K.; Cao, W.; Ding, Q.; Lan, B. Significant changes in the chemical compositions and sources of PM2.5 in Wuhan since the city lockdown as COVID-19. Sci. Total Environ. 2020, 739, 140000. [Google Scholar] [CrossRef] [PubMed]
  35. Feng, J.; Hu, J.; Xu, B.; Hu, X.; Sun, P.; Han, W.; Gu, Z.; Yu, X.; Wu, M. Characteristics and seasonal variation of organic matter in PM2.5 at a regional background site of the Yangtze River Delta region, China. Atmos. Environ. 2015, 123, 288–297. [Google Scholar] [CrossRef]
  36. Polissar, A.V.; Hopke, P.K.; Paatero, P.; Kaufmann, Y.J.; Hall, D.K.; Bodhaine, B.A.; Dutton, E.G.; Harris, J.M. The aerosol at Barrow, Alaska: Long-term trends and source locations. Atmos. Environ. 1999, 33, 2441–2458. [Google Scholar] [CrossRef]
  37. Cheng, C.; Shi, M.; Liu, W.; Mao, Y.; Hu, J.; Tian, Q.; Chen, Z.; Hu, T.; Xing, X.; Qi, S. Characteristics and source apportionment of water-soluble inorganic ions in PM2.5 during a wintertime haze event in Huanggang, central China. Atmos. Pollut. Res. 2021, 12, 111–123. [Google Scholar] [CrossRef]
  38. Wang, L.; Liu, Z.; Sun, Y.; Ji, D.; Wang, Y. Long-range transport and regional sources of PM2.5 in Beijing based on long-term observations from 2005 to 2010. Atmos. Res. 2015, 157, 37–48. [Google Scholar] [CrossRef]
  39. Huang, T.; Chen, J.; Zhao, W.; Cheng, J.; Cheng, S. Seasonal variations and correlation analysis of water-soluble inorganic ions in PM2.5 in Wuhan, 2013. Atmosphere 2016, 7, 49. [Google Scholar] [CrossRef] [Green Version]
  40. Lin, Y.C.; Li, Y.C.; Amesho, K.T.T.; Shangdiar, S.; Chou, F.C.; Cheng, P.C. Chemical characterization of PM2.5 emissions and atmospheric metallic element concentrations in PM2.5 emitted from mobile source gasoline-fueled vehicles. Sci. Total Environ. 2020, 739, 139942. [Google Scholar] [CrossRef]
  41. Tian, M.; Wang, H.; Chen, Y.; Zhang, L.; Shi, G.; Liu, Y.; Yu, J.; Zhai, C.; Wang, J.; Yang, F. Highly time-resolved characterization of water-soluble inorganic ions in PM2.5 in a humid and acidic mega city in Sichuan Basin, China. Sci. Total Environ. 2017, 580, 224–234. [Google Scholar] [CrossRef] [PubMed]
  42. Yu, Y.; Ding, F.; Mu, Y.; Xie, M.; Wang, Q.G. High time-resolved PM2.5 composition and sources at an urban site in Yangtze River Delta, China after the implementation of the APPCAP. Chemosphere 2020, 261, 127746. [Google Scholar] [CrossRef] [PubMed]
  43. Yin, Y.; Tong, Y.; Wei, Y.; Wang, T.; Li, J.; Yang, W.; Fan, S. The analysis of chemistry composition of fine-mode particles in Nanjing. Trans. Atmos. Sci. 2009, 32, 723–733. (In Chinese) [Google Scholar]
  44. Zhang, Y.; Ren, L.; Sun, J.; Zhu, Z.; Chen, Y. Features of water-soluble components pollution of atmospheric fine particles in Nanjing. Environ. Monitor. China 2013, 29, 25–27. (In Chinese) [Google Scholar] [CrossRef]
  45. Wang, L.; Ma, Y.; Zheng, J.; Wang, Z.; Zhou, Y. Characterization apportionment of carbonaceous aerosol and water-soluble ions in PM2.5 at suburban Nanjing. Sci. Tech. Eng. 2015, 15, 91–99. (In Chinese) [Google Scholar]
  46. Wang, H.; An, J.; Cheng, M.; Shen, L.; Zhu, B.; Li, Y.; Wang, Y.; Duan, Q.; Sullivan, A.; Xia, L. One year online measurements of water-soluble ions at the industrially polluted town of Nanjing, China: Sources, seasonal and diurnal variations. Chemosphere 2016, 148, 526–536. [Google Scholar] [CrossRef]
  47. Du, W.; Hong, Y.; Xiao, H.; Zhang, Y.; Chen, Y.; Xu, L.; Chen, J.; Deng, J. Chemical characterization and source apportionment of PM2.5 during spring and winter in the Yangtze River Delta, China. Aerosol Air Qual. Res. 2017, 17, 2165–2180. [Google Scholar] [CrossRef] [Green Version]
  48. Li, S.W.; Chang, M.H.; Li, H.M.; Cui, X.Y.; Ma, L.Q. Chemical compositions and source apportionment of PM2.5 during clear and hazy days: Seasonal changes and impacts of Youth Olympic Games. Chemosphere 2020, 256, 1127163. [Google Scholar] [CrossRef]
  49. Guo, Z.; Guo, Q.; Chen, S.; Zhu, B.; Zhang, Y.; Yu, J.; Guo, Z. Study on pollution behavior and sulfate formation during the typical haze event in Nanjing with water soluble inorganic ions and sulfur isotopes. Atmos. Res. 2019, 217, 198–207. [Google Scholar] [CrossRef]
  50. Lin, Y.C.; Zhang, Y.L.; Fan, M.Y.; Bao, M.Y. Heterogeneous formation of particulate nitrate under ammonium-rich regimes during the high-PM2.5 events in Nanjing, China. Atmos. Chem. Phys. 2020, 20, 3999–4011. [Google Scholar] [CrossRef] [Green Version]
  51. Sun, P.; Nie, W.; Wang, T.; Chi, X.; Huang, X.; Xu, Z.; Zhu, C.; Wang, L.; Qi, X.; Zhang, Q. Impact of air transport and secondary formation on haze pollution in the Yangtze River Delta: In situ online observations in Shanghai and Nanjing. Atmos. Environ. 2020, 225, 117350. [Google Scholar] [CrossRef]
  52. Yang, L.; Shang, Y.; Hannigan, M.P.; Zhu, R.; Wang, Q.G.; Qin, C.; Xie, M. Collocated speciation of PM2.5 using tandem quartz filters in northern nanjing, China: Sampling artifacts and measurement uncertainty. Atmos. Environ 2021, 246, 118066. [Google Scholar] [CrossRef]
  53. Qiu, C.; Gong, H.; Yu, X.; Ding, C.; Hou, S.; Zhang, R.; Hou, X. Seasonal characteristics and sources apportionment of water-soluble ions in PM2.5 of Nanjing Jiangbei New Area. Acta Sci. Circumstantiae 2021, 41, 1718–1726. (In Chinese) [Google Scholar] [CrossRef]
  54. Qiao, B.; Chen, Y.; Tian, M.; Wang, H.; Yang, F.; Shi, G.; Zhang, L.; Peng, C.; Luo, Q.; Ding, S. Characterization of water soluble inorganic ions and their evolution processes during PM2.5 pollution episodes in a small city in southwest China. Sci. Total Environ. 2019, 650, 2605–2613. [Google Scholar] [CrossRef] [PubMed]
  55. Li, L.; Yin, Y.; Kong, S.; Wen, B.; Chen, K.; Yuan, L.; Li, Q. Altitudinal effect to the size distribution of water soluble inorganic ions in PM at Huangshan, China. Atmos. Environ. 2014, 98, 242–252. [Google Scholar] [CrossRef]
  56. Agarwal, A.; Satsangi, A.; Lakhani, A.; Kumari, K.M. Seasonal and spatial variability of secondary inorganic aerosols in PM2.5 at Agra: Source apportionment through receptor models. Chemosphere 2020, 242, 125132. [Google Scholar] [CrossRef]
  57. Xu, J.; Wang, Z.; Yu, G.; Qin, X.; Ren, J.; Qin, D. Characteristics of water soluble ionic species in fine particles from a high altitude site on the northern boundary of Tibetan Plateau: Mixture of mineral dust and anthropogenic aerosol. Atmos. Res. 2014, 143, 43–56. [Google Scholar] [CrossRef]
  58. Xue, Y.; Zhou, Z.; Nie, T.; Wang, K.; Nie, L.; Pan, T.; Wu, X.; Tian, H.; Zhong, L.; Li, J. Trends of multiple air pollutants emissions from residential coal combustion in Beijing and its implication on improving air quality for control measures. Atmos. Environ. 2016, 142, 303–312. [Google Scholar] [CrossRef]
  59. Kong, S.; Wen, B.; Chen, K.; Yin, Y.; Li, L.; Li, Q.; Yuan, L.; Li, X.; Sun, X. Ion chemistry for atmospheric size-segregated aerosol and depositions at an offshore site of Yangtze River Delta region, China. Atmos. Res. 2014, 147–148, 205–226. [Google Scholar] [CrossRef]
  60. Balasubramanian, R.; Qian, W.B. Comprehensive characterization of PM2.5 aerosols in Singapore. J. Geophys. Res. 2003, 108, 4523. [Google Scholar] [CrossRef]
  61. Nair, P.R.; Parameswaran, K.; Abraham, A.; Jacob, S. Wind-dependence of sea-salt and non-sea-salt aerosols over the oceanic environment. J. Atmos. Sol. Terr. Phy. 2005, 67, 884–898. [Google Scholar] [CrossRef]
  62. Chen, J.; Li, C.; Ristovski, Z.; Milic, A.; Gu, Y.; Islam, M.S.; Wang, S.; Hao, J.; Zhang, H.; He, C. A review of biomass burning: Emissions and impacts on air quality, health and climate in China. Sci. Total Environ. 2017, 579, 1000–1034. [Google Scholar] [CrossRef] [Green Version]
  63. Xia, Y.; Zhao, Y.; Nielsen, C.P. Benefits of China’s efforts in gaseous pollutant control indicated by the bottom-up emissions and satellite observations 2000–2014. Atmos. Environ. 2016, 136, 43–53. [Google Scholar] [CrossRef]
  64. Zhao, J.; Zhang, F.; Xu, Y.; Chen, J. Characterization of water-soluble inorganic ions in size-segregated aerosols in coastal city, Xiamen. Atmos. Res. 2011, 99, 546–562. [Google Scholar] [CrossRef]
  65. Pant, P.; Harrison, R.M. Critical review of receptor modelling for particulate matter: A case study of India. Atmos. Environ. 2012, 49, 1–12. [Google Scholar] [CrossRef] [Green Version]
  66. Deng, X.L.; Shi, C.E.; Wu, B.W.; Yang, Y.J.; Jin, Q.; Wang, H.L.; Zhu, S.; Yu, C. Characteristics of the water-soluble components of aerosol particles in Hefei, China. J. Environ. Sci. 2016, 42, 32–40. [Google Scholar] [CrossRef]
  67. Wang, Y.; Zhuang, G.; Zhang, X.; Huang, K.; Xu, C.; Tang, A.; Chen, J.; An, Z. The ion chemistry, seasonal cycle, and sources of PM2.5 and TSP aerosol in Shanghai. Atmos. Environ. 2006, 40, 2935–2952. [Google Scholar] [CrossRef]
  68. Manktelow, P.T.; Carslaw, K.S.; Mann, G.W.; Spracklen, D.V. The impact of dust on sulfate aerosol, CN and CCN during an East Asian dust storm. Atmos. Chem. Phys. 2010, 10, 365–382. [Google Scholar] [CrossRef] [Green Version]
  69. Deng, C.; Tian, S.; Li, Z.; Li, K. Spatiotemporal characteristics of PM2.5 and ozone concentrations in Chinese urban clusters. Chemosphere 2022, 295, 133813. [Google Scholar] [CrossRef]
  70. Wang, S.; Liu, J.; Yi, H.; Tang, X.; Yu, Q.; Zhao, S.; Gao, F.; Zhou, Y.; Zhong, T.; Wang, Y. Trends in air pollutant emissions from the sintering process of the iron and steel industry in the Fenwei Plain and surrounding regions in China, 2014–2017. Chemosphere 2022, 291, 132917. [Google Scholar] [CrossRef]
Figure 1. The location of the sampling site.
Atmosphere 14 00135 g001
Figure 2. Time-series of daily water-soluble inorganic ions in PM2.5.
Atmosphere 14 00135 g002
Figure 3. Monthly average concentrations of WSIIs and their percentages.
Atmosphere 14 00135 g003
Figure 4. Comparison of water-soluble ions between December 2016 and 2020. (a) Comparison of SNA mass concentration in December 2016 and December 2020, (b) proportions of SNA in December of different years.
Atmosphere 14 00135 g004
Figure 5. Charge balance between total cation equivalents and anion equivalents in PM2.5.
Atmosphere 14 00135 g005
Figure 6. (ac) Scatter plots of ammonium and acidic ions for PM2.5.
Atmosphere 14 00135 g006
Figure 7. The five source profiles in December of different years: (a) December 2016; (b) December 2020.
Atmosphere 14 00135 g007
Figure 8. Contributions of sources of WSIIs in Nanjing in December of different years: (a) December 2016; (b) December 2020.
Atmosphere 14 00135 g008
Figure 9. Source areas for ammonium, nitrate and sulfate between December 2016 and 2020 in Nanjing. (a) ammonium, (b) nitrate, (c) sulfate in December 2016; (d) ammonium, (e) nitrate, (f) sulfate in December 2020.
Atmosphere 14 00135 g009
Table 1. Statistical summary of the daily average concentrations (μg·m−3) of WSIIs.
MaximumMinimumMedianMeanStandard Deviation
Na+26.40.050.180.752.21
NH4+38.00.105.016.264.85
K+19.70.090.280.501.09
Mg2+6.20.060.090.180.48
Ca2+3.60.090.250.340.29
Cl16.60.031.241.831.89
NO375.70.128.2610.99.59
SO42−44.30.067.308.725.94
total162.10.9923.328.720.5
Table 2. Concentrations of NO3 and SO42− and values of NO3 to SO42− in PM2.5 measured by different research at Nanjing (μg·m−3).
Study PeriodMethodNO3SO42−NO3/SO42−ReferencesLanguage
February 2001–December 2001Offline7.516.30.46[17]English
January 2007–October 2007Offline9.128.00.33[43]Chinese
January 2010–December 2010Offline2.816.30.17[44]Chinese
August 2012–June 2013Offline10.330.80.33[45]Chinese
October 2013–November 2014Online18.928.30.67[46]English
December 2014–November 2015Offline11.814.90.79[18]English
December 2014–April 2015Offline16.316.60.98[47]English
July 2014–May 2015Offline15.018.00.83[48]English
December 2015–January 2016Offline26.519.01.39[49]English
March 2016–August 2017Online16.714.91.12[50]English
January 2017–December 2017Online12.89.31.38[42]English
November 2017–June 2018Online14.29.11.56[51]English
September 2018–September 2019Offline12.59.11.37[52]English
May 2019–October 2019Offline17.311.01.57[53]Chinese
February 2015–May 2021Online 10.98.81.24This workEnglish
Table 3. The neutralization factors (NF) calculated for NH4+, nssK+, nssMg2+ and nssCa2+.
NFValue (μmol·m−3)
NH4+0.85
nssK+0.05
nssMg2+0.02
nssCa2+0.03
Disclaimer/Publisher’s Note: The statements, opinions and data contained in all publications are solely those of the individual author(s) and contributor(s) and not of MDPI and/or the editor(s). MDPI and/or the editor(s) disclaim responsibility for any injury to people or property resulting from any ideas, methods, instructions or products referred to in the content.

