
Assessment of FY-3D SST Data on Typhoon In-Fa Simulation


1
Key Laboratory of Meteorological Disaster of Ministry of Education (KLME)/Joint International Research Laboratory of Climate and Environment Change (ILCEC)/Collaborative Innovation Center on Forecast and Evaluation of Meteorological Disaster (CIC-FEMD), Nanjing University of Information Science & Technology, Nanjing 210044, China
2
Hebei Airlines Co., Ltd., Shijiazhuang 050800, China
*
Author to whom correspondence should be addressed.
Atmosphere 2023, 14(1), 101; https://doi.org/10.3390/atmos14010101
Submission received: 9 December 2022
/
Revised: 28 December 2022
/
Accepted: 30 December 2022
/
Published: 3 January 2023
(This article belongs to the Special Issue Data Assimilation for Predicting Hurricane, Typhoon and Storm)
Abstract
:Sea surface temperature (SST) plays an important role in the typhoon forecast. By comparison, satellite retrieval products can provide more accurate SST data than reanalysis data in typhoon simulations. However, the effect of SST data from Chinese Fengyun-3 (FY-3) satellites on typhoon simulation hasn’t been evaluated yet. In this paper, the impact of FY-3D SST retrieval data with ascending and descending orbits on the forecast of typhoon In-Fa, 2021, is investigated with the Weather Research Forecast (WRF) model. Compared to the control experiments with SST data from Global Data Assimilation System (GDAS) data, the replacement experiments with FY-3D SST data significantly improve the forecast of typhoon central sea level pressure, track, and precipitation. Especially, the SST from the descending orbit satellite data provides the optimal track and intensity forecast, which are verified against the best track data from the Japan Meteorological Agency.
1. Introduction
A typhoon is one of the typical catastrophic weather systems in China. Approximately 7 typhoons make landfall in China, while approximately 26 typhoons generate over the Northwest Pacific Ocean each year [1]. The landfall of a typhoon causes heavy rainfall, strong winds, and storm surges, which result in heavy casualties and property losses. The timely and accurate typhoon forecast is beneficial for public security and reducing losses. From the previous research, it is known that the atmospheric and marine elements, such as sea surface temperature, marine salinity, wind, water vapor, and large-scale environmental systems, all strongly influence the typhoon track and intensity forecast [2].
Sea surface temperature (SST), as an exogenous forcing, plays an important role in the formation and development of typhoons. The warmer the SST, the greater the effective heat in the upper ocean, and the more favorable the development and intensification of typhoons [3,4]. On the contrary, low SST tends to cause sudden weakening or extinction of typhoons [5,6]. In addition to the impact on intensity, the SST also modulates the typhoon tracks [7,8,9,10]. The number of typhoons landing in China also shows a significant correlation with the SST in the Pacific Ocean [11]. Therefore, the accuracy of the SST directly affects typhoon forecasts. However, only a few SST observations over the ocean could be obtained.
With the rapid development of remote sensing technology, satellite data has a wide application in weather forecasts. The microwave and infrared imagers on board different satellites can obtain global observations, which can be retrieved as SST, sea surface wind speed, soil temperature, and other atmospheric or marine variables [12,13,14,15,16]. More accurate SST products retrieved from satellite data could be used for typhoon forecasts. Some researchers replaced the model initial SST with the daily or weekly SST data from the microwave imager and microwave radiometer on board different satellites to discuss the impact of the SST on typhoon simulation. It was found that different products showed different SST distributions near the typhoon center, which caused the change in wind, latent heat flux, and typhoon precipitation. With the satellite SST data, an obvious improvement was obtained. Furthermore, satellite SST data with higher temporal resolution could further improve the accuracy of typhoon forecasts [17,18,19].
The Fengyun-3 (FY-3) series satellites are the Chinese second-generation polar-orbiting meteorological satellites, including FY-3C, FY-3D, and FY-3E. Several marine retrieval products from FY-3C/D have been released. Zhang et al. [20] examined the ascending and descending SST data products from the FY-3C MWRI (Micro-Wave Radiation Imager) under different wind speeds as well as solar radiation and found that the ascending data accuracy was better than the descending data. Different from the FY-3C, which is a morning sun-synchronous satellite, FY-3D is an afternoon satellite with an orbital altitude of 830 km [21]. Most previous studies evaluated different SST products from different satellites, such as the Tropical Rainfall Measuring Mission (TRMM) satellite, the Geostationary Operational Environmental Satellite (GOES), and the Meteorological Operational Satellite (Metop) [14,22,23]. The quality of SST products from FY-3D hasn’t been investigated yet. Especially, the impact of SST products from FY-3 series satellites on numerical weather prediction (NWP) of typhoons has not been estimated. Therefore, the current study is motivated to evaluate the effect of SST data retrieved from the FY-3D satellite on a typhoon In-Fa simulation with the weather research forecast (WRF) model to explore the applicability of the satellite SST products in numerical simulations.
This paper is organized as follows: Section 2 includes descriptions of the data sources and methodology. Section 3 documents the overview of the typhoon In-Fa and the configuration of the experiments. The results are presented in Section 4. Finally, the conclusion and discussion are presented in Section 5.
2. Data and Methods
In this study, the initial and boundary conditions of all simulation experiments are provided by the NCEP (National Centers for Environmental Prediction) FNL (Final) data from the Global Data Assimilation System (GDAS) (hereafter GDAS data) with a 6 h interval and 0.25° × 0.25° horizontal resolution. The hourly blending precipitation product from the Chinese automatic stations’ rainfall data and CMORPH precipitation products is used for precipitation observation with a horizontal resolution of 0.05° × 0.05°. The best-track data of the typhoon In-Fa used in this study is provided by the Tokyo Typhoon Center of the Japan Meteorological Agency (JMA).
In this study, the SST product retrieved from the microwave radiation imager (MWRI) on FY-3D was evaluated. The FY-3D is the second-generation polar-orbiting satellite of China. It carried 10 remote sensing instruments with high spectral resolution. There are different SST retrieval products inversed from MWRI radiance. Considering the data coverage, the ten-days-mean SST product was selected in this study, which has a horizontal resolution of 0.25° × 0.25°. The SST product is divided into ascending and descending orbital data, which will also be investigated in this study.
To further assess the experiments’ results, some diagnostic variables were calculated in this study. Potential vorticity (PV) is a physical variable that reflects the thermodynamic and dynamical properties of the atmosphere and is widely used in the analysis of typhoons. The formulation is as follows:
in which f is the geostrophic vorticity, ζ is the vertical relative vorticity, and the PV unit is PVU (1 PVU = 10−6·m2·K·s−1·kg−1).
To quantitatively describe the precipitation forecast from different experiments, the 24 h accumulative precipitation with different thresholds, such as 0.1 mm, 10 mm, 25 mm, 50 mm, and 100 mm, is evaluated with the threat score (TS) [24] defined as
where H represents the number of times both forecast, and the observations meet or exceed the threshold; F is the number of forecasts at observation points with precipitation equal to or exceeding a given threshold; O is the number of observations that meet or exceed the threshold. Thus, the TS indicates the accuracy of the precipitation prediction in the model forecasts. The larger the TS is, the more precise the forecast is.
3. Case Overview and Experimental Setup
3.1. Typhoon In-Fa Overview
Typhoon In-Fa is selected to evaluate the impact of the FY-3D SST data on typhoon simulation. As shown in Figure 1, In-Fa was defined as a tropical depression in the northwestern Pacific Ocean at 1800 UTC 15 July, then moved northward and northwestward. It was identified as a tropical storm at 1200 UTC 17 July. After the northwestward movement, the In-Fa strengthened to a severe tropical storm at 0000 UTC 19 July. Approximately 12 h later, it upgraded to a typhoon at 1200 UTC 20 July and had a southwestward turn. The In-Fa grew and intensified to its strongest strength, with a maximum surface wind speed of 85 knots and a minimum sea level pressure of 950 hPa and was maintained from 1800 UTC 21 July to 0900 UTC 22 July. At 0000 UTC 22 July, the In-Fa had a sudden turn from southwestward to northwestward and made its first landfall at Zhoushan, Zhejiang Province, at 0400 UTC 25 July. Finally, the In-Fa weakened to tropical storm status after the second landfall at Jiaxing at 0100 UCT 26 July. It is the first typhoon with two landfalls in Zhejiang Province. It stayed in Zhejiang and Jiangsu provinces for approximately 29 h and 37 h, respectively. Due to its strong intensity and long lifetime, the In-Fa broke many meteorological and hydrological records and resulted in approximately 33.5 billion losses along the coastline.
Moreover, except for Zhejiang and Jiangsu provinces, because of the boundary layer jet caused by the convergence of the southeast flow of the In-Fa and the east flow of the western Pacific subtropical high, more and more warm, wet air was transported to Henan province during 19 to 20 July. Finally, it produced continuous heavy rainfall at Zhengzhou city, which generated the historical hourly precipitation extremum for China with 201.9 mm. The rainstorm led to nearly 400 deaths, thousands of hectares of crop damage, and more than 80 billion in losses.
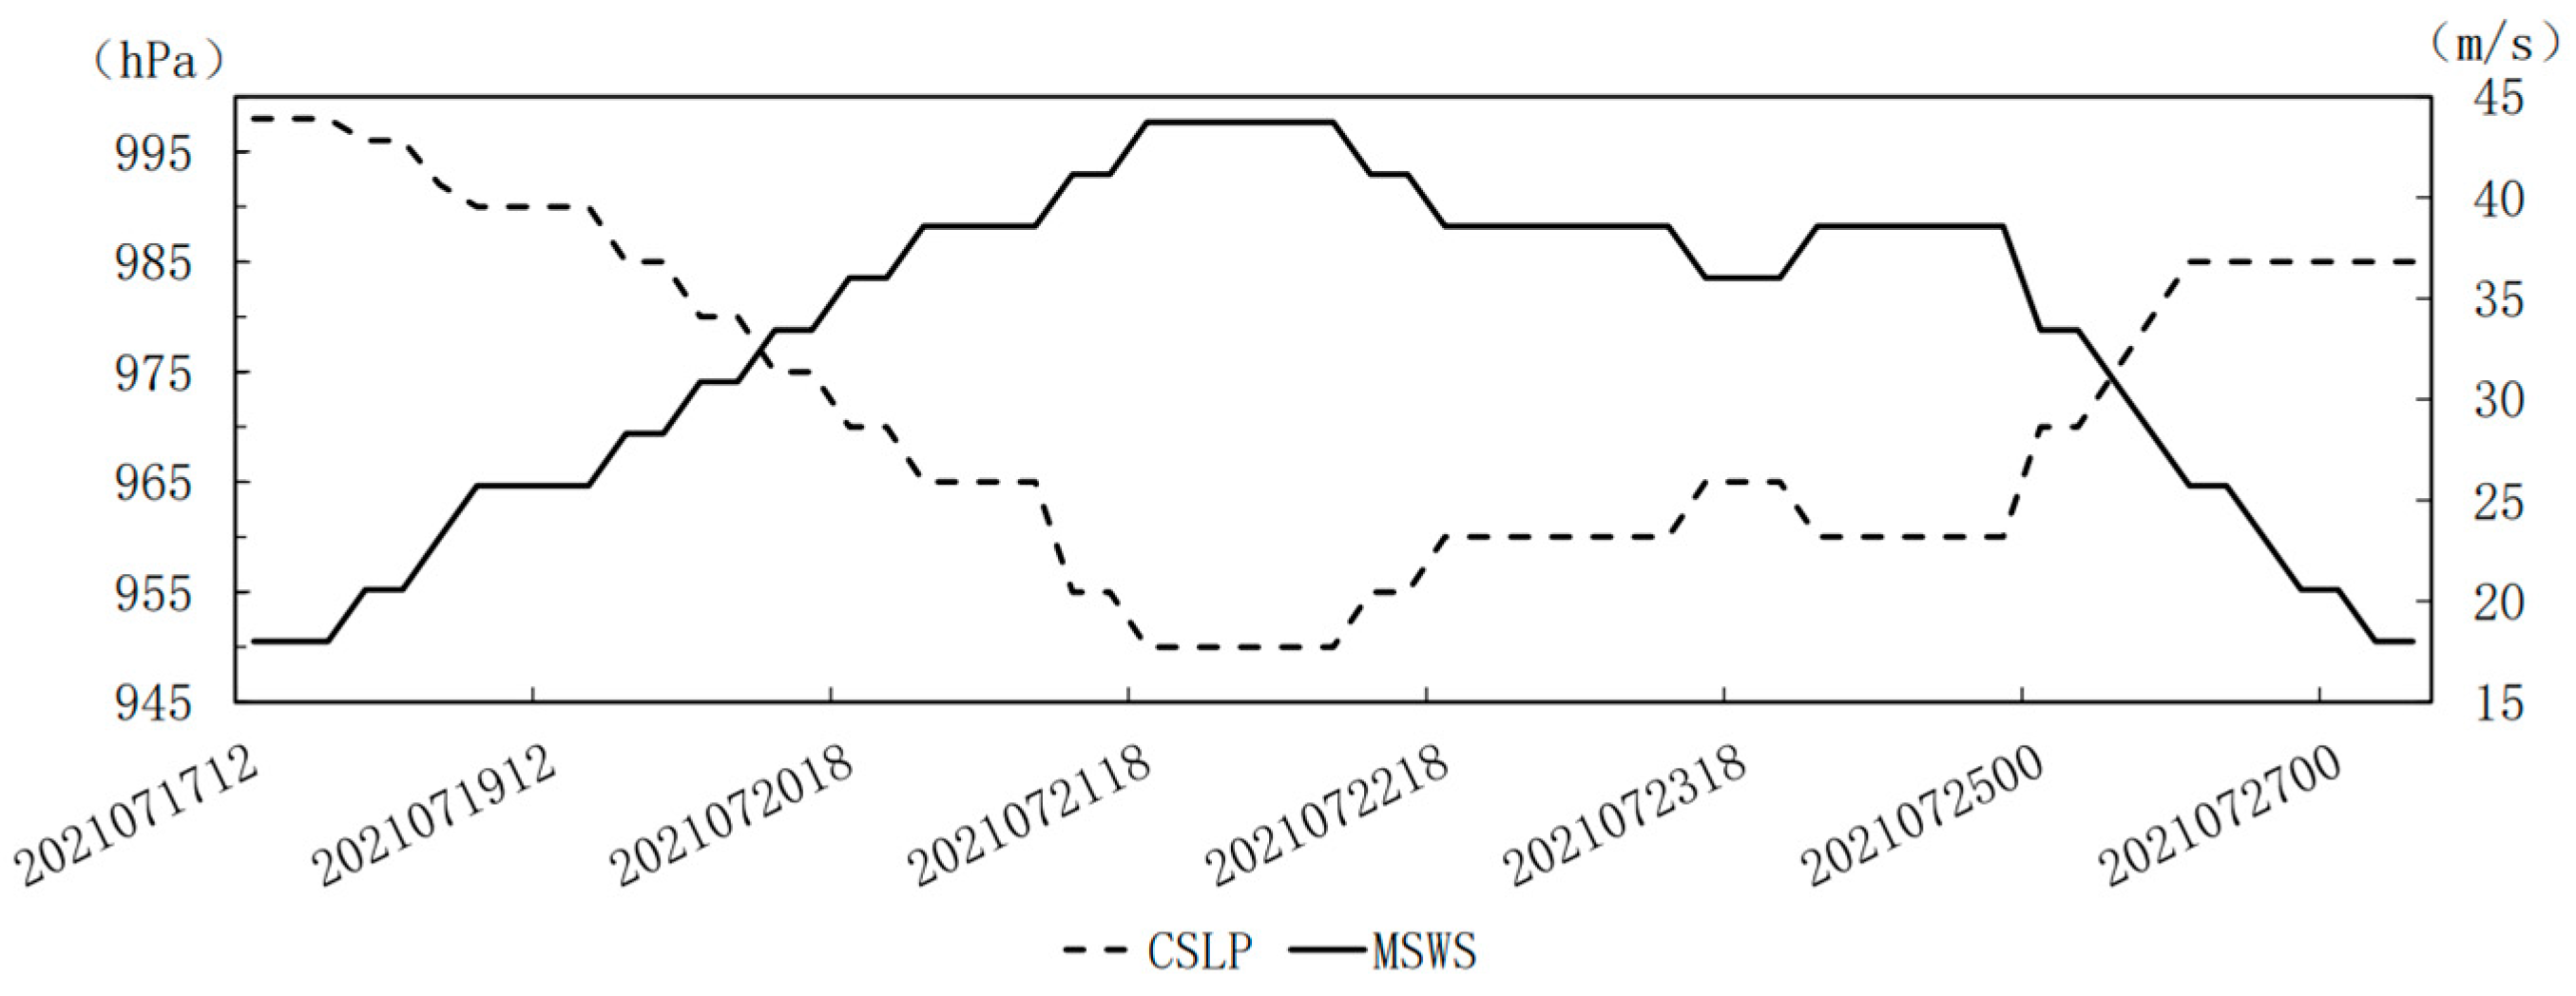
For the main life of the In-Fa, it is found that the variations of the central sea level pressure (CSLP) and maximum surface wind speed (MSWS) appear to be out of phase (Figure 2). After 17 July, the In-Fa gradually strengthened, with the MSWS increasing and the CSLP decreasing. Until 21 July, the In-Fa obtains the minimum CSLP of approximately 950 hPa and the MSWS of approximately 42.72 m·s−1. Subsequently, the In-Fa maintained the strength of a violent typhoon for 15 h. After the first landfall in Zhejiang Province at 0400 UTC 25, the In-Fa gradually weakened. The spiral rain band of the In-Fa brought heavy rainfall in the coastal areas of Zhejiang, with more than 100 mm of accumulated precipitation in 24 h.
3.2. Experimental Setup
In this study, we performed long-term forecast experiments for the period from 0000 UTC 23 July to 0600 UTC 25 July soon after the In-Fa’s first landfall. All experiments employ the Advanced Research WRF Model (WRF-ARW, hereafter WRF; Skamarock et al., 2008) version 4.1. The center of all the experiments is (124° E, 24° N). The horizontal resolution is 9 km with 169 × 169 grids. GDAS data is used to provide initial and boundary conditions for all forecast experiments. The following physics parameterization schemes are selected in this study: the Noah Land Surface scheme for land surface processes, the WSM6 for microphysical parameterization, the Tiedtke for cumulus parameterization, the RRTMG for short-wave radiation, the RRTMG for long-wave radiation, the Revised MM5 surface scheme for near-surface layers, and the YSU for the planetary boundary layer.
Four parallel experiments are configured to investigate the quality of the FY-3D retrieval SST product. The control experiment (abbreviated as CTRL) uses the original SST data from GDAS data. The second experiment (abbreviated as FY3_a) replaces the SST data with the ten-days-mean SST data with an ascending orbit from the FY-3D satellite, while the third experiment (referred to as FY3_d) modifies the initial SST data with the descending orbit ten-days-mean SST data. Additionally, the fourth experiment (referred to as FY3_m) changes the original SST with the average of the ascending and descending SST data. The other parameters of the experiment are the same as those of the control experiment. The differences in typhoon intensity, track, and precipitation with different SST conditions are compared and analyzed to explore the impact of sea surface temperature on typhoon development and the applicability of the satellite retrieval SST product in numerical simulation.
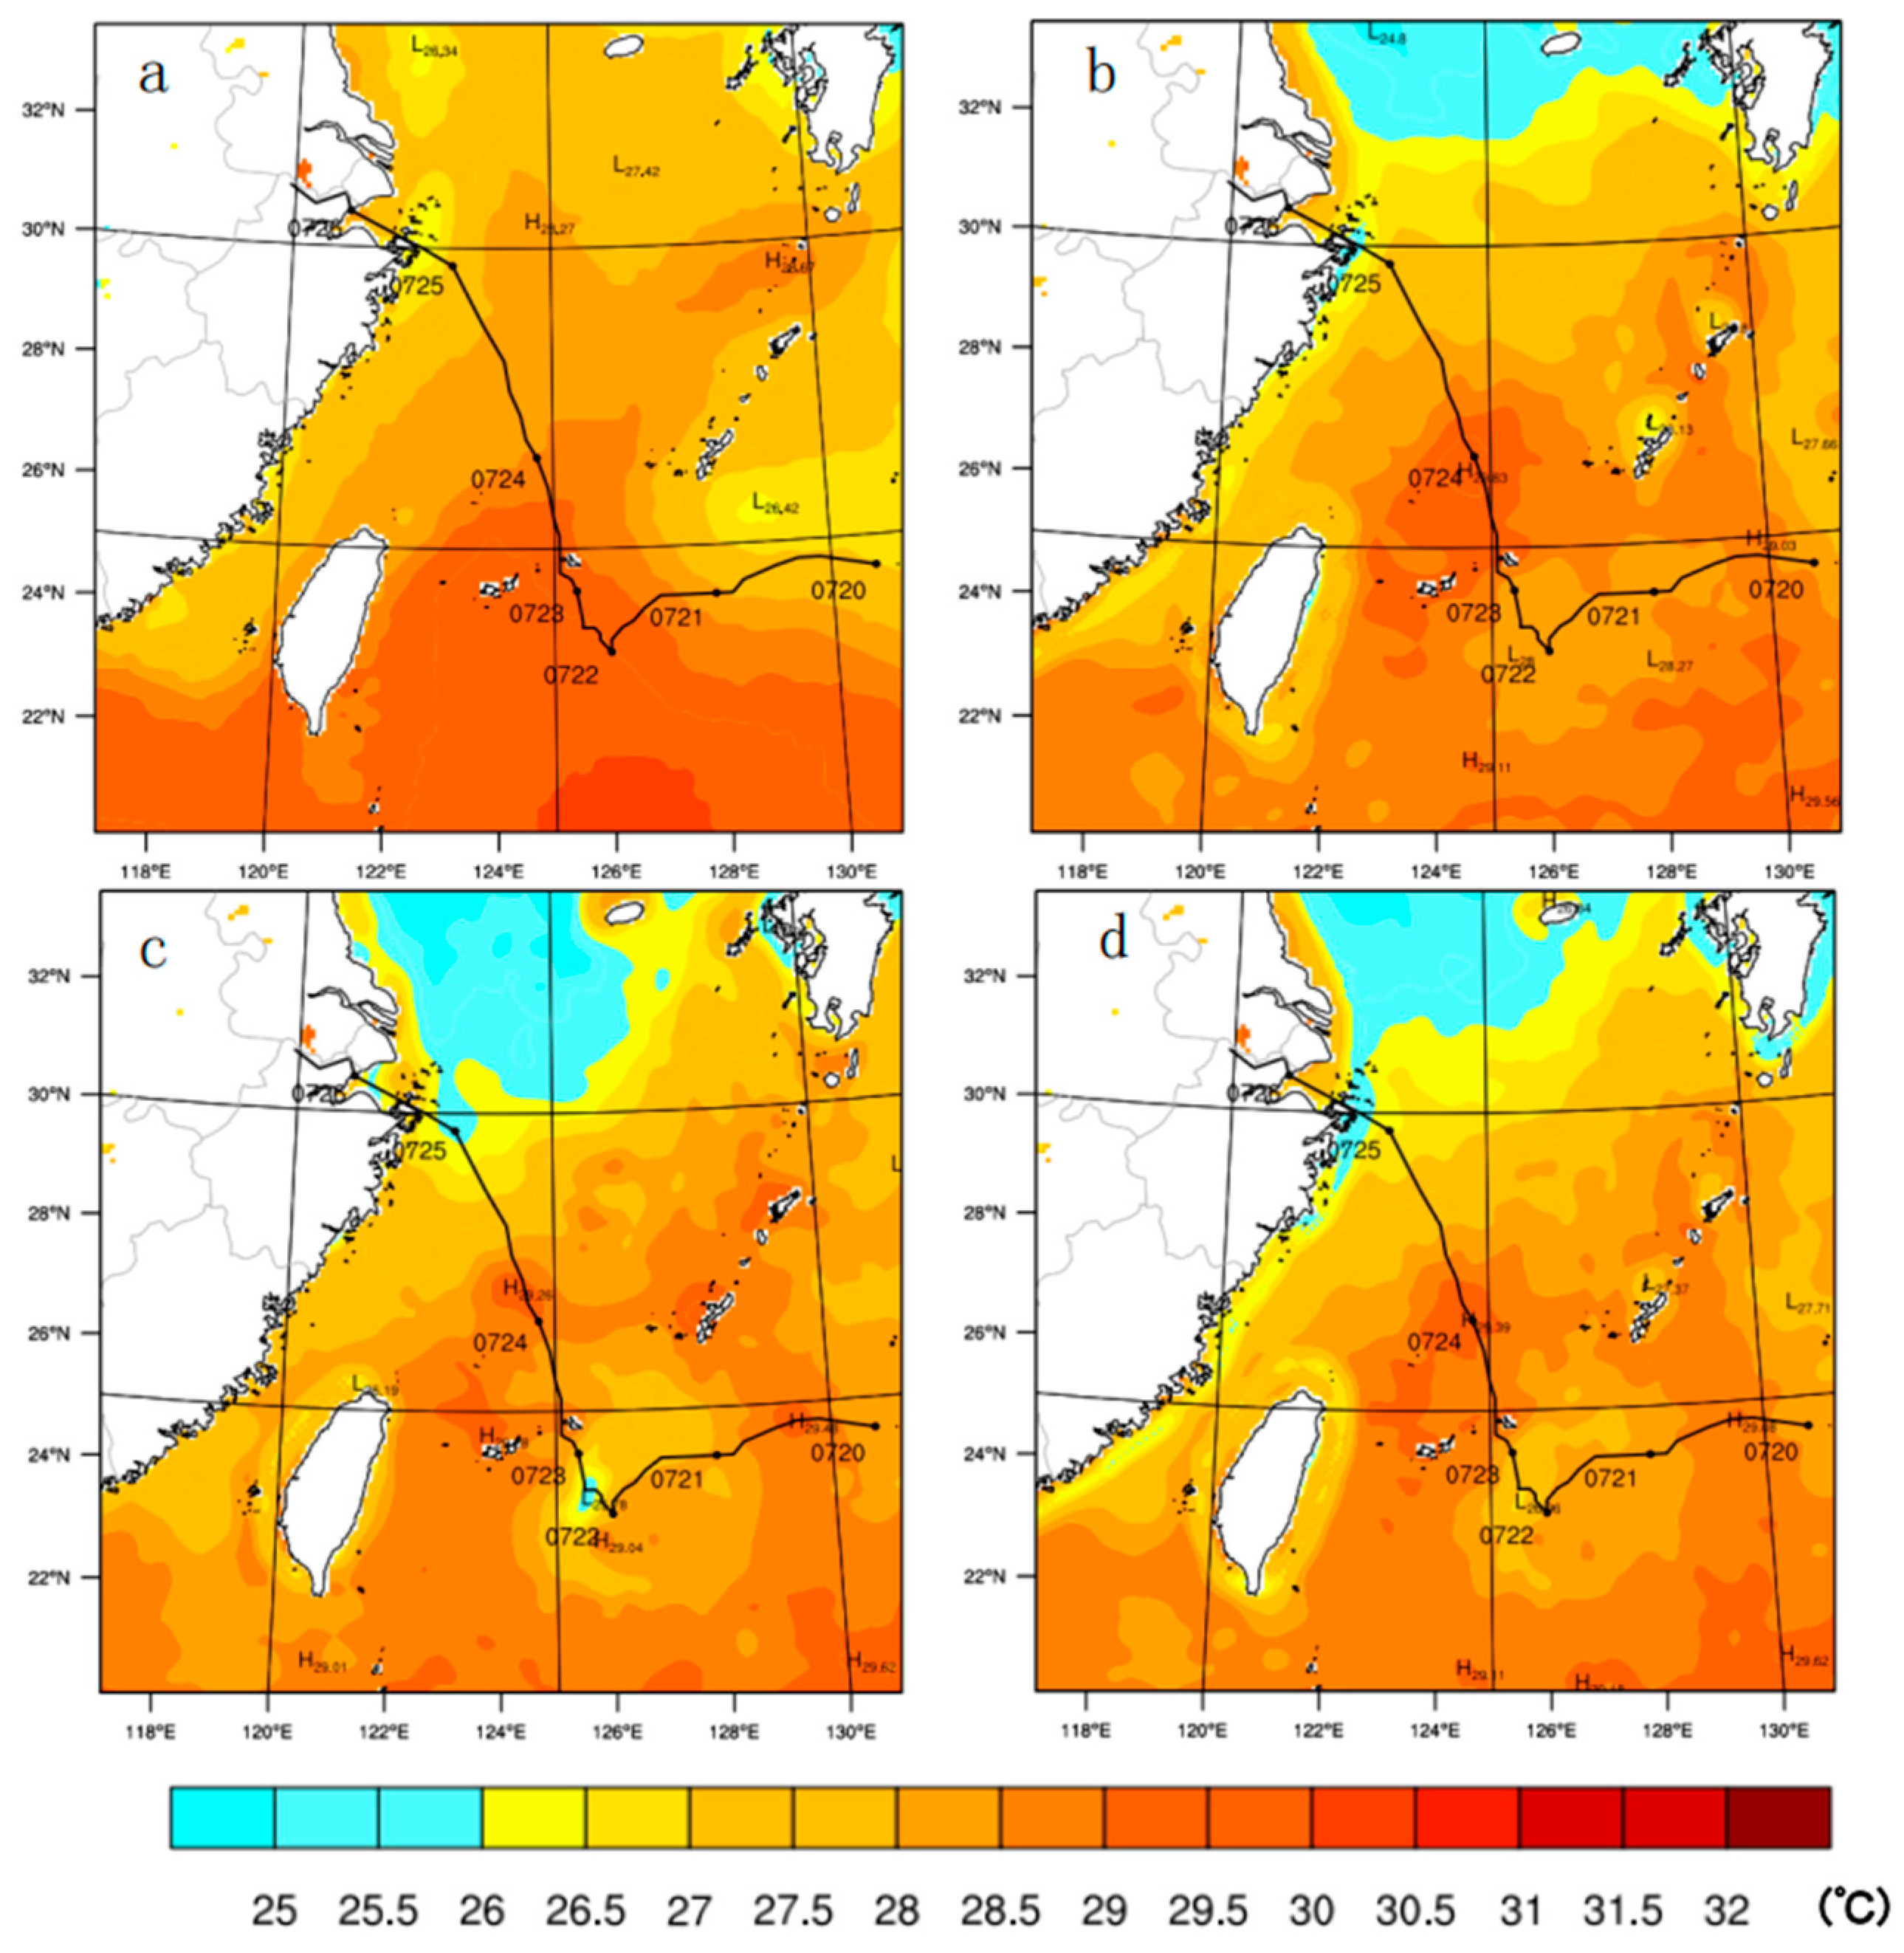
The initial sea surface temperature distributions of four experiments are given in Figure 3. From Figure 3a, it can be seen that the initial sea surface temperature of the GDAS data decreases from south to north with an average SST of 28.3 °C, which is favorable for typhoon development. In addition, it is much lower in the coastal area, with an average SST of 26 °C. Compared with GDAS data, the ascending orbit SST data (Figure 3b) is relatively lower, at 28.0 °C. It is slightly higher than the GDAS in the domain center, which is to the northeast of Taiwan, but lower to the east of Taiwan. Specially, the SST product shows a much lower area with approximately 25 °C to the north of 32° N. Figure 3c shows the descending orbit SST data with an average temperature of approximately 27.9 °C. It shows a similar pattern as Figure 3b but a larger low SST area in the north part of the domain and to the east of Taiwan. Figure 3d shows the average SST of the ascending and descending data, with an average temperature of about 27.9 °C. All satellite SST products present a low value in the north of the experimental domain and low-temperature area to the east of Taiwan. With the best track of the In-Fa, it is clear that the low SST area corresponds to the typhoon’s position around 22 July with the strongest intensity. It is the cool pool caused by the strong winds associated with typhoons and the upwelling of cold water [8,25]. It proves that the satellite SST data contains more detailed information of the In-Fa than the climatology’s original SST data.
4. Results
4.1. Impact on Typhoon Structure
At 0000 UCT on 25 July, the In-Fa moved to the coastal area of Zhejiang and would cause landfall at Zhoushan with typhoon strength. We chose this time as an example to evaluate the impact of FY-3D SST data on the In-Fa simulation.
Figure 4 illustrates the comparison of the CTRL forecast (Figure 4a), FY3_a (Figure 4b), FY3_d (Figure 4c), and FY3_m (Figure 4d) by the sea level pressure simulation. Four experiments’ forecasts show a similar pattern with a clear spiraling cloud band that stretches from Zhejiang to the east coast of Taiwan. The CTRL obtained the lowest sea level pressure in the four experiments with 949.1 hPa. With the replacement of the FY-3D SST product, the FY3_a, a modified initial SST with ascending orbit SST data, obtains the same strength as CTRL with 949.4 hPa, while the FY3_d, with descending orbit SST data, shows the greatest sea level pressure of 955.5 hPa and the FY3_m of 952.1 hPa. However, according to the best track from JMA, the mean sea level pressure of the In-Fa at 0000 UTC 25 July is 970 hPa, which is greater than all the experiments’ forecasts. Therefore, by contrast, the FY3_d gains the best forecast for sea level pressure.
The variation of SST also has a significant effect on the vertical structure of typhoons. The vertical cross-sections along the red line in Figure 4 from the near-surface layer to approximately a 9 km height are analyzed in Figure 5.
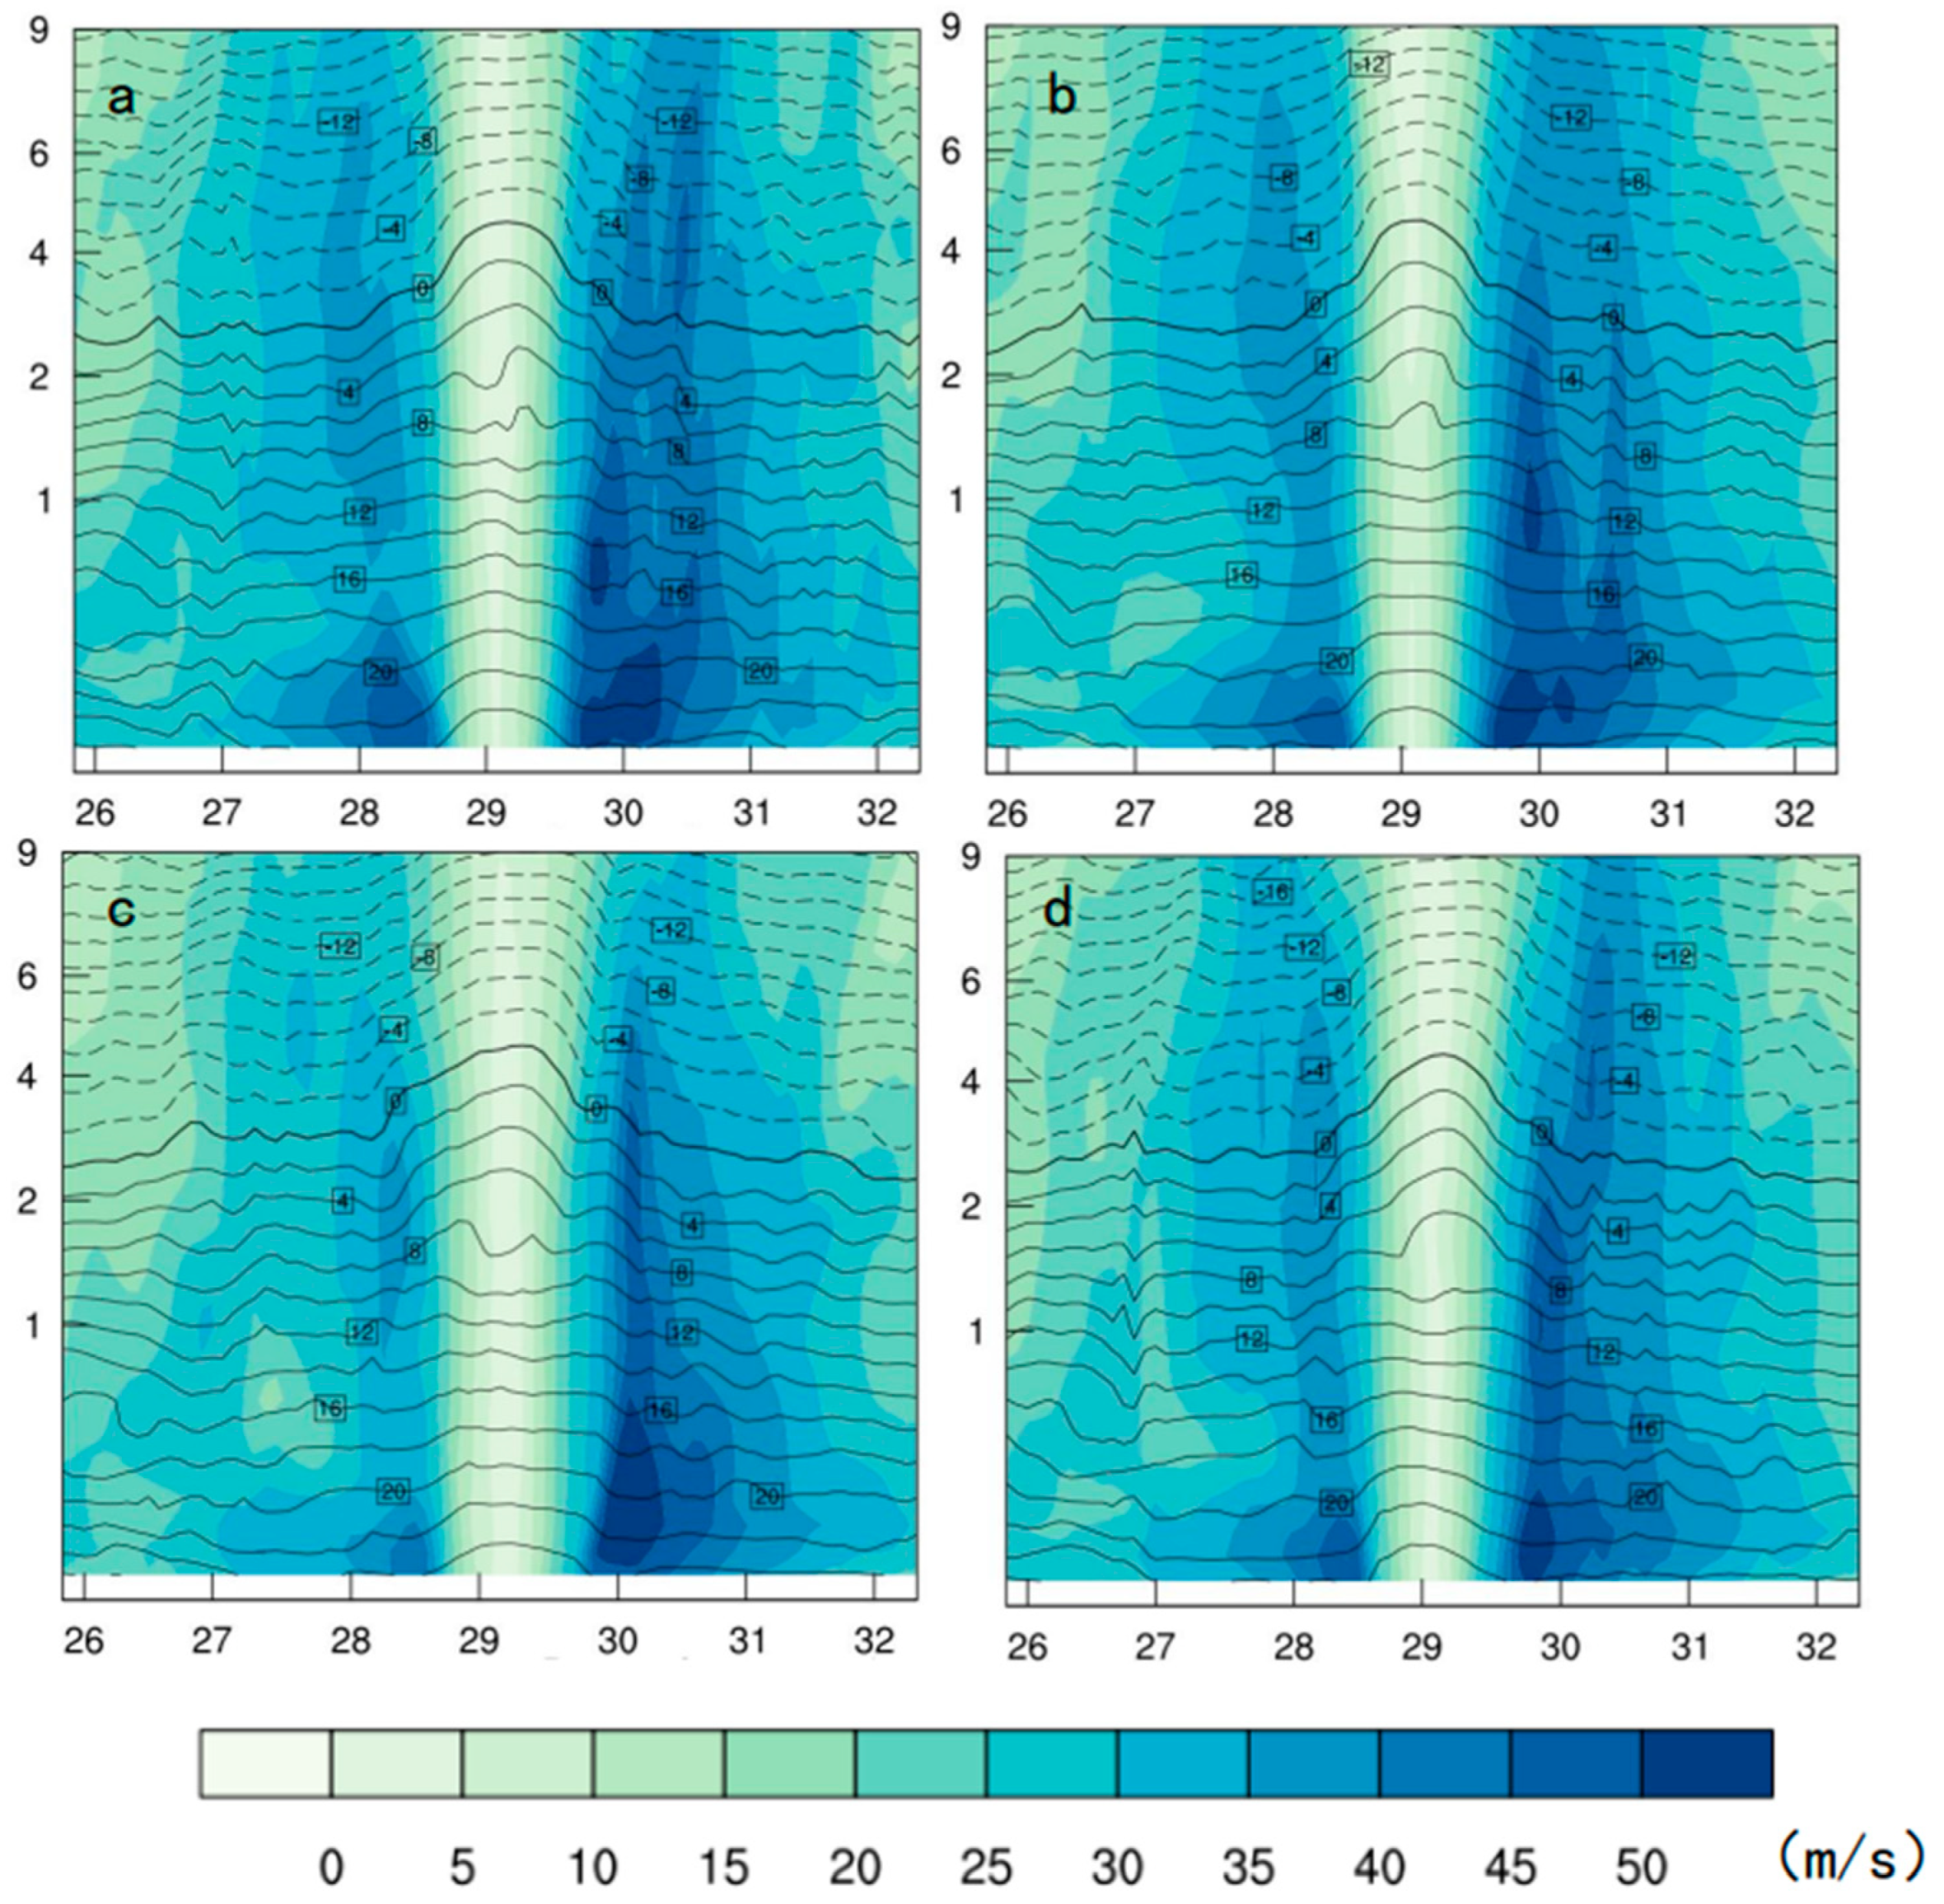
The fields of horizontal wind speed and temperature from four experiments at 0000 UTC 25 July are shown in Figure 5 in vertical cross-sections through the individual vortex centers. At this moment, the In-Fa has a maximum surface wind speed of 65 knots. From the horizontal wind speed in Figure 5, it can be seen that the central wind over the eye area of the In-Fa is weak, and the typhoon eye area gradually broadens from the surface to the upper levels. The vertical structure of the In-Fa is asymmetrical. The winds on the north side of all experiments are larger than those on the south side. The maximum horizontal wind speed of more than 50 m·s−1 is near the low-level vortex center in all cases. For the CTRL experiment (Figure 5a), the large wind speed area where the speed exceeds 50 m·s−1 is located below 1 km to the north of the typhoon center. By comparison, FY3_a (Figure 5b) shows slightly weaker wind on each side, and the area and height of wind speed with 50 m·s−1 are significantly smaller than those in the CTRL. Similarly, the larger horizontal wind area of FY3_m (Figure 5d) is also smaller than the CTRL. However, the height of the wind with 45 m·s−1 on the north side of FY3_d (Figure 5c) is higher than the CTRL. In general, the wind forecasts of different satellite SST products are weaker than the CTRL near the surface.
Over the typhoon eye area, all the experiments’ isotherms above 1.5 km are raised upward. It is due to the low pressure and downdraft in the center, which led to the warm core structure of the typhoon at approximately 4 km. In addition, because of the latent heat release caused by the humid air rising and condensation, the temperature in the spiral cloud band is also much higher. The CTRL (Figure 5a) establishes a strong, warm core structure of approximately 2 km to 6 km. The temperature distribution pattern of the typhoon center of FY3_a (Figure 5b) is similar to that of the CTRL experiment but has an obvious warmer center. Meanwhile, the warm structures of FY3_d (Figure 5c) and FY3_m (Figure 5d) are weaker than the CTRL and FY3_a, and the temperature on the south side of the typhoon eye in the FY3_d is higher than in the north.
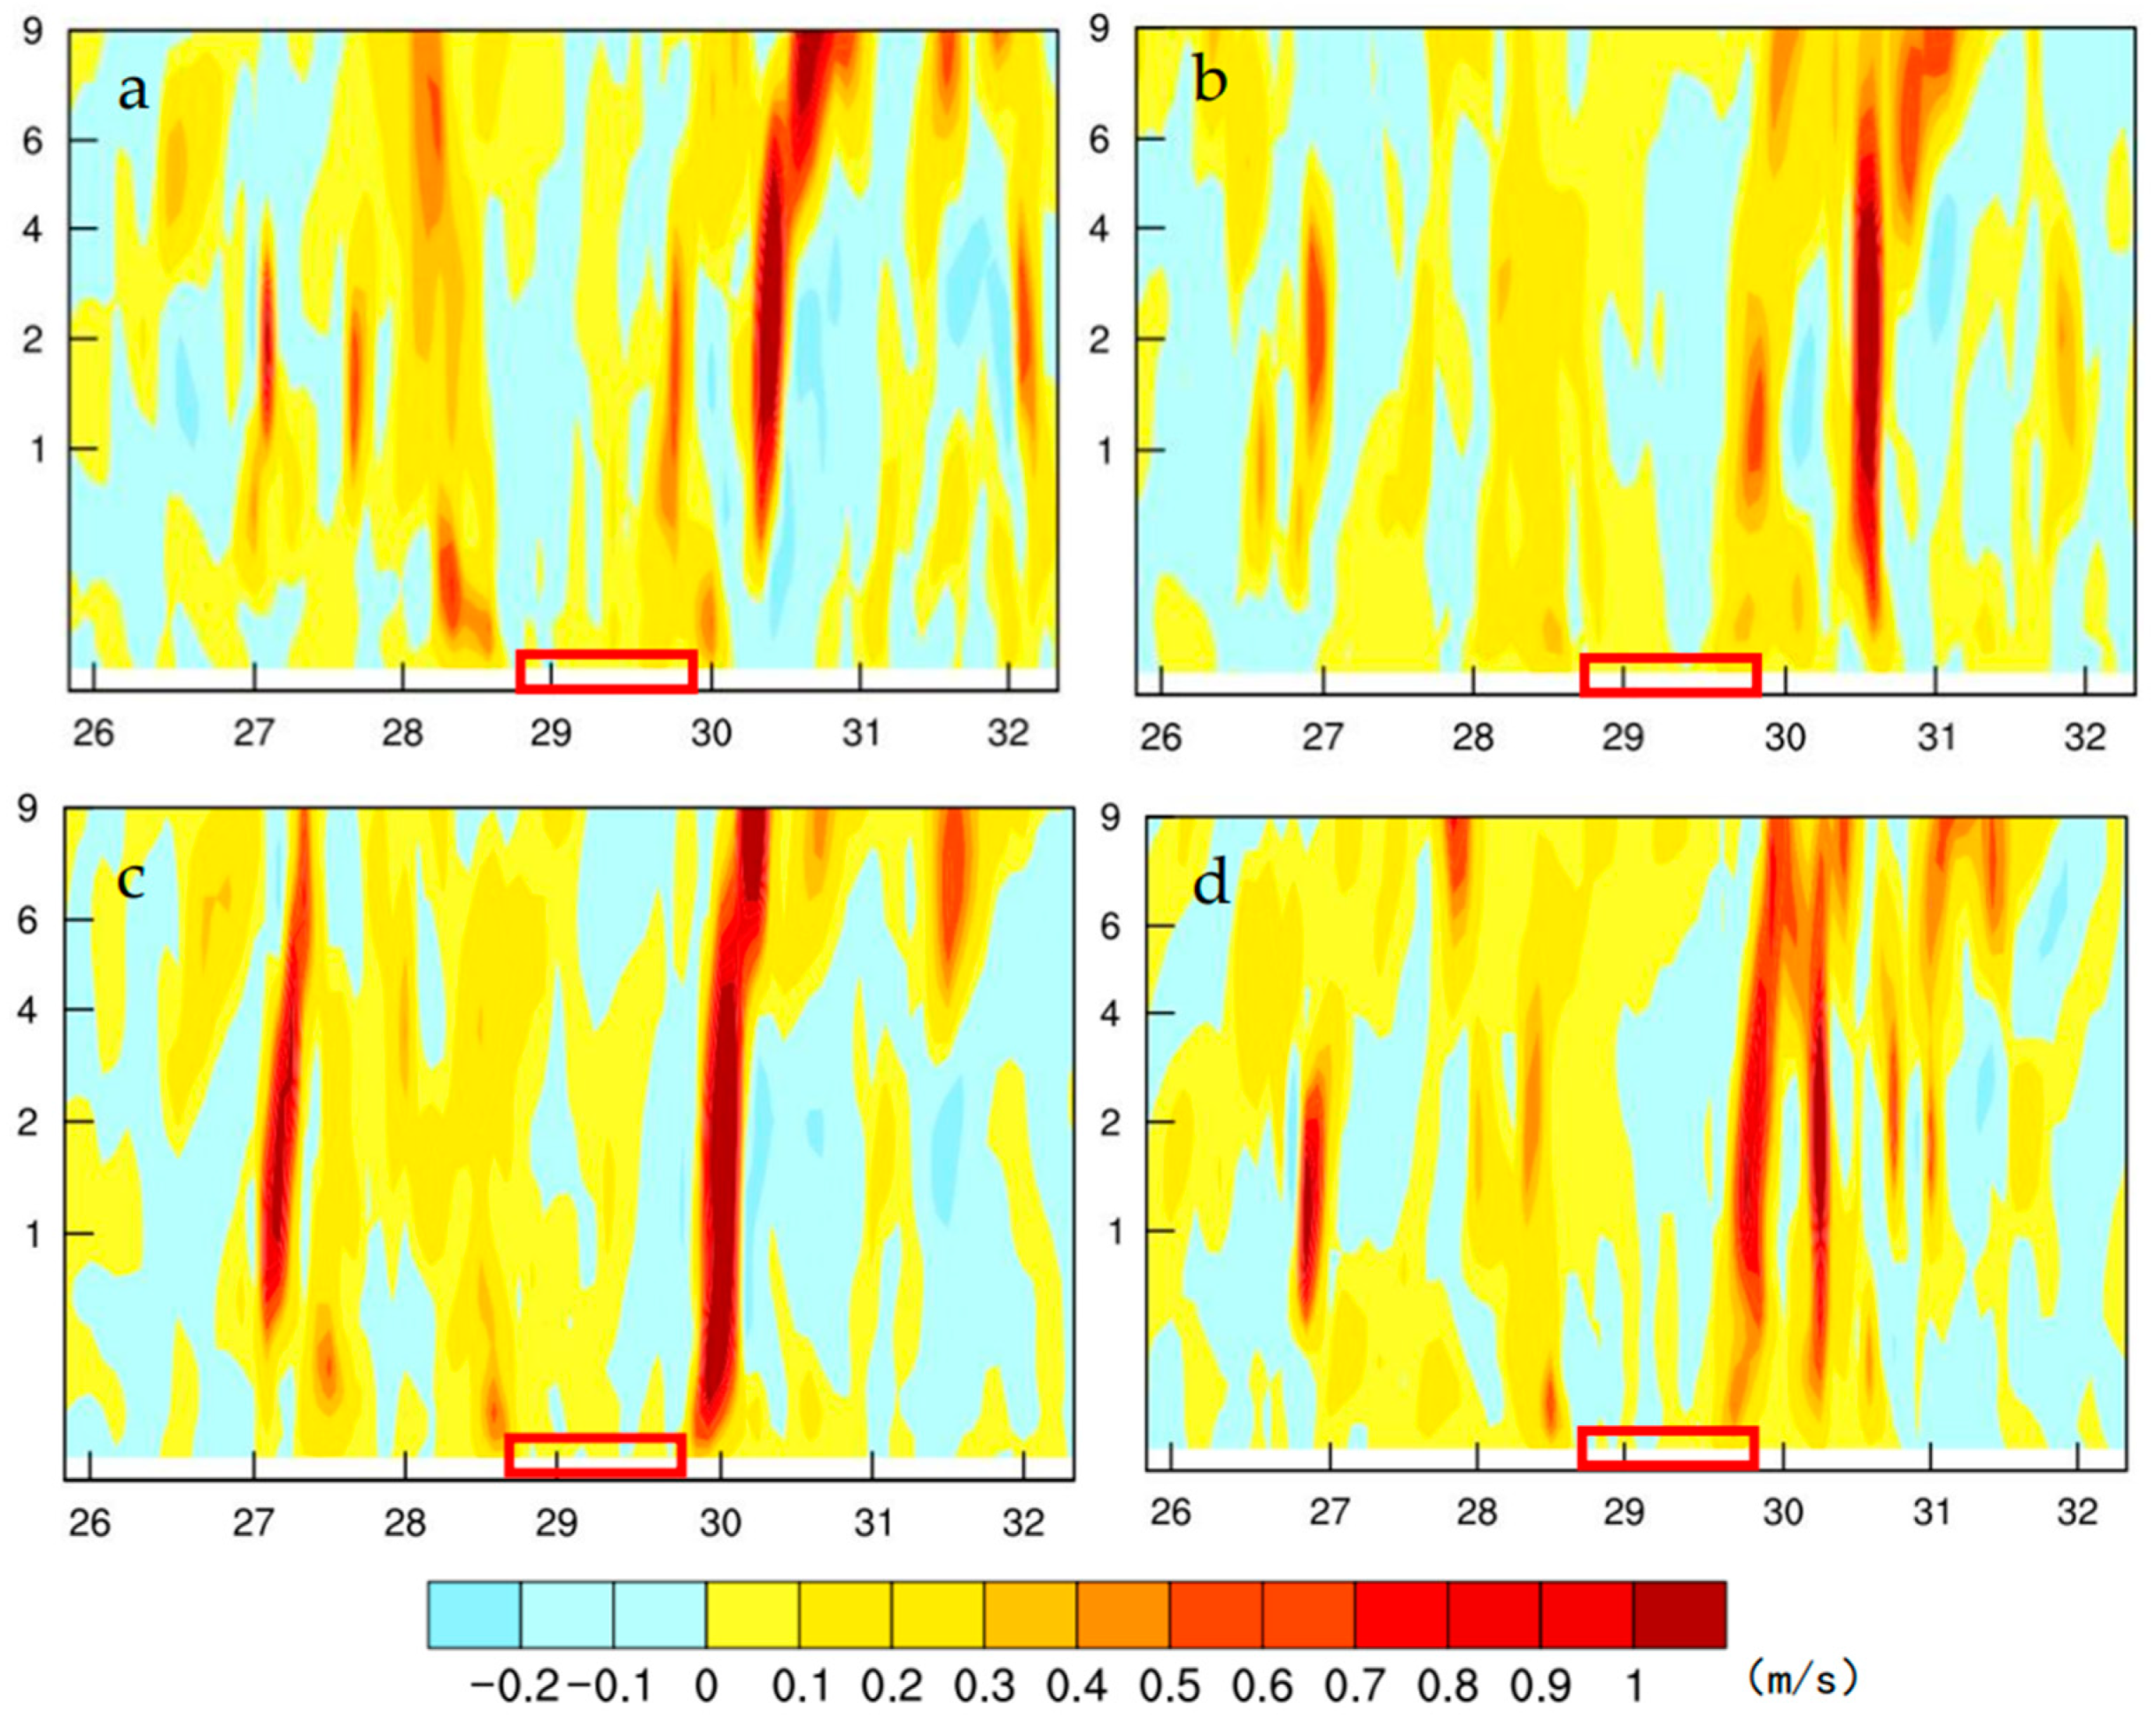
The cross-section of vertical velocity in Figure 6 shows that the typhoon eye area is dominated by the downdraft. However, there are obvious updrafts at the eyewall of typhoon In-Fa, which are stronger on the north side than the south side. The updrafts are slightly titled to the typhoon periphery from the lower level to the upper levels. The vertical velocity in FY3_a (Figure 6b) is weaker than that of CTRL (Figure 6a). Especially, the updrafts on the south side of the eyewall in FY3_a are smaller by 0.2 m·s−1 than CTRL experiment. The downdrafts of the typhoon eye of FY3_a locates more northward than CTRL. The FY3_d (Figure 6c) obtains the strongest updrafts of more than 1 m·s−1 on both sides around the typhoon eye from the surface to the top, while downdraft in the center titles northward with the height. With the mean satellite SST data, the FY3_m (Figure 6d) shows a significant, large vertical velocity area on the north side of the typhoon eye. The satellite SST product brings a northward movement of typhoon eye simulation, which is much closer to the observation.
The higher the potential vortex is, which is greater than 6 PVU, the more conducive it is to the development and intensification of typhoons. As shown in Figure 7, the regions greater than 6 PVU of all experiments are up to 9 km throughout the troposphere, which is conducive to enhancing the thermal and dynamic conditions of In-Fa. The larger potential vortex is found near the eyewall but is weaker the in center. With the satellite ascending SST data, FY3_a (Figure 7b) shows a quasi-symmetric structure of potential vortex that looks similar to butterfly wings, and the maximum potential vortex with more than 14 PUV from 1.5 km to 6 km, which is stronger than CTRL (Figure 7a). Nevertheless, with descending SST data, the FY3_d (Figure 7c) shows a significantly weaker potential vortex around the typhoon center from the surface to the upper level, which is consistent with the sea level pressure simulation. As the average of the ascending and descending SST data, FY3_m (Figure 7d) gains a similar potential vortex structure as FY3_d, which is weaker than the CTRL and FY3_a but has a larger potential vortex under 2 km as FY3_a.
4.2. Impact on Track and Intensity Forecast
Besides the single forecast analysis, the impact of satellite retrieval SST data is evaluated by examining the whole 54-h forecast. As shown in Figure 8, all experiments predict the northwest movement from 0000 UTC 23 July to 0600 UTC 25 July. However, all track simulations of the In-Fa from four experiments show obvious southward position biases against the best track data from JMA. The initial position of the In-Fa for simulation experiments is in the southeast of the best track data because of the GDAS data bias. After a 12-h forecast, the FY3_d is much closer to the best track than other experiments and obtains the closest landfall approximately 0600 UTC 25 July. The FY3_m has a similar pattern as the FY3_a, while the CTRL shows the worst track at the beginning and end of the forecast.
The steering flow also plays an important role in typhoon movement. Figure 9 shows the steering flow calculated by 700 hPa to 200 hPa environmental wind around the typhoon center from four experiments at 00 UTC 25 July. It is shown that the steering flows are southeasterly winds from 700 hPa to 350 hPa for all experiments, which corresponds to the northwestern simulation track. Nevertheless, in the upper troposphere, the steering flow direction is changed. Compared with CTRL, three SST modification experiments create more southwesterly steering flows, especially FY3_d. Therefore, after this moment, FY3_d obtains a more northerly track than the other experiments.
The mean error of track, central sea level pressure, and maximum surface wind speed of a 54 h forecast from the four simulation experiments are shown in Figure 10, as verified against JMA’s best track data. From Figure 10a, it can be seen that after a 6 h spin-up time, all track error increases from 8 km to almost 100 km with forecast time. The SST replacement with a satellite retrieval product has less effect on the first 12 h forecast. By contrast, CTRL’s track error increases rapider than SST replacing experiments with the largest track error of 100 km. FY3_d with descending SST data creates the lowest track error, except for the 30th forecast at 0006 UTC 24 July. The mean track error of CTRL is 49.2 km, while it is 47.3 km for FY3_a, 45.2 km for FY3_d, and 49.1 km for FY3_m. It is provided that FY-3D SST data benefit from improving the typhoon track forecast. Moreover, compared with CTRL, the largest improvement of the track is at the 54th forecast, with a 50% reduction of FY3_d.
As shown in Figure 10b, all CSLP errors of the four experiments are negative, which means the intensity of all simulation experiments is stronger than observations. In the first 18 h forecast, all the experiments’ error grows fast, especially CTRL, with the largest error of 20 hPa. Likewise, after an 18 h forecast, FY3_a’s CSLP error is similar to CTRL, approximately 20 hPa. Different from FY3_a, 25% error reduction in FY3_m and 40% improvement in FY3_d are maintained almost from 1800 UTC 23 to 0600 UTC 25 July. It is remarkable that FY3_d substantially outperforms other experiments, due to the descending SST data.
From the maximum wind speed error in Figure 10c, it can be seen that CTRL and FY3_a totally have positive errors with the largest error of 8 m·s−1 at approximately the 24 h to 30 h forecast. Significantly, the two experiments bring stronger surface winds than the best track. Whereas the MSWS errors of FY3_d and FY3_m converge at approximately 0, from −4 m·s−1 to 4 m·s−1, which is smaller than the CTRL and FY3_a. By comparison, the FY3_d with descending SST data obtains a lower error, with an average error of 1.9 m·s−1, while it is 2.10 m·s−1 for FY3_m, 3.30 m·s−1 for CTRL, and 3.27 m·s−1 for FY3_a. It is demonstrated again that the FY-3D descending SST data has a positive impact on typhoon simulation.
4.3. Impact on Precipitation Forecast
Typhoon In-Fa made its first landfall in Zhoushan, Zhejiang Province at 0400 UTC 25 July, and produced torrential rains. Figure 11 presents the 24 h accumulative precipitation between 0600 UTC 24 July and 0600 UTC 25 July from the blending product data used as precipitation observation, and the forecasts from CTRL, FY3_a, FY3_d, and FY3_m. Due to the limitation of the data, Figure 11a only presents the precipitation observation over land. It is shown that, around the first landfall, In-Fa generates heavy rain (>50 mm) in the northeast of Zhejiang Province and Shanghai. The heaviest precipitation is around Shaoxing and Ningbo, at more than 150 mm. All the simulation experiments’ forecasts show a similar rainfall pattern to the observation, but the precipitation is weaker in Shaoxing and Shanghai and heavier in Hangzhou Bay. Especially, the maximum rainfall locations are slightly shifted eastward, and the maximum rainfall area is extended in the south direction, which results from the southward landfall in four simulation experiments. The CTRL (Figure 11b) shows the largest torrential rain area the over land in the east of Zhejiang and southeast of Jiangsu Province. Likewise, FY3_m (Figure 11e) gets heavier rainfall in the south of Jiangsu and similar heavier downpour coverage (>150 mm) as FY3_a (Figure 11c). Among all the experiments, the heavy rainfall coverage in FY3_d (Figure 11d) is smaller than that in the other three experiments and more consistent with the observation. Due to the bias of the landfall forecast, all the experiments ignore the maximum rainfall in Shaoxing.
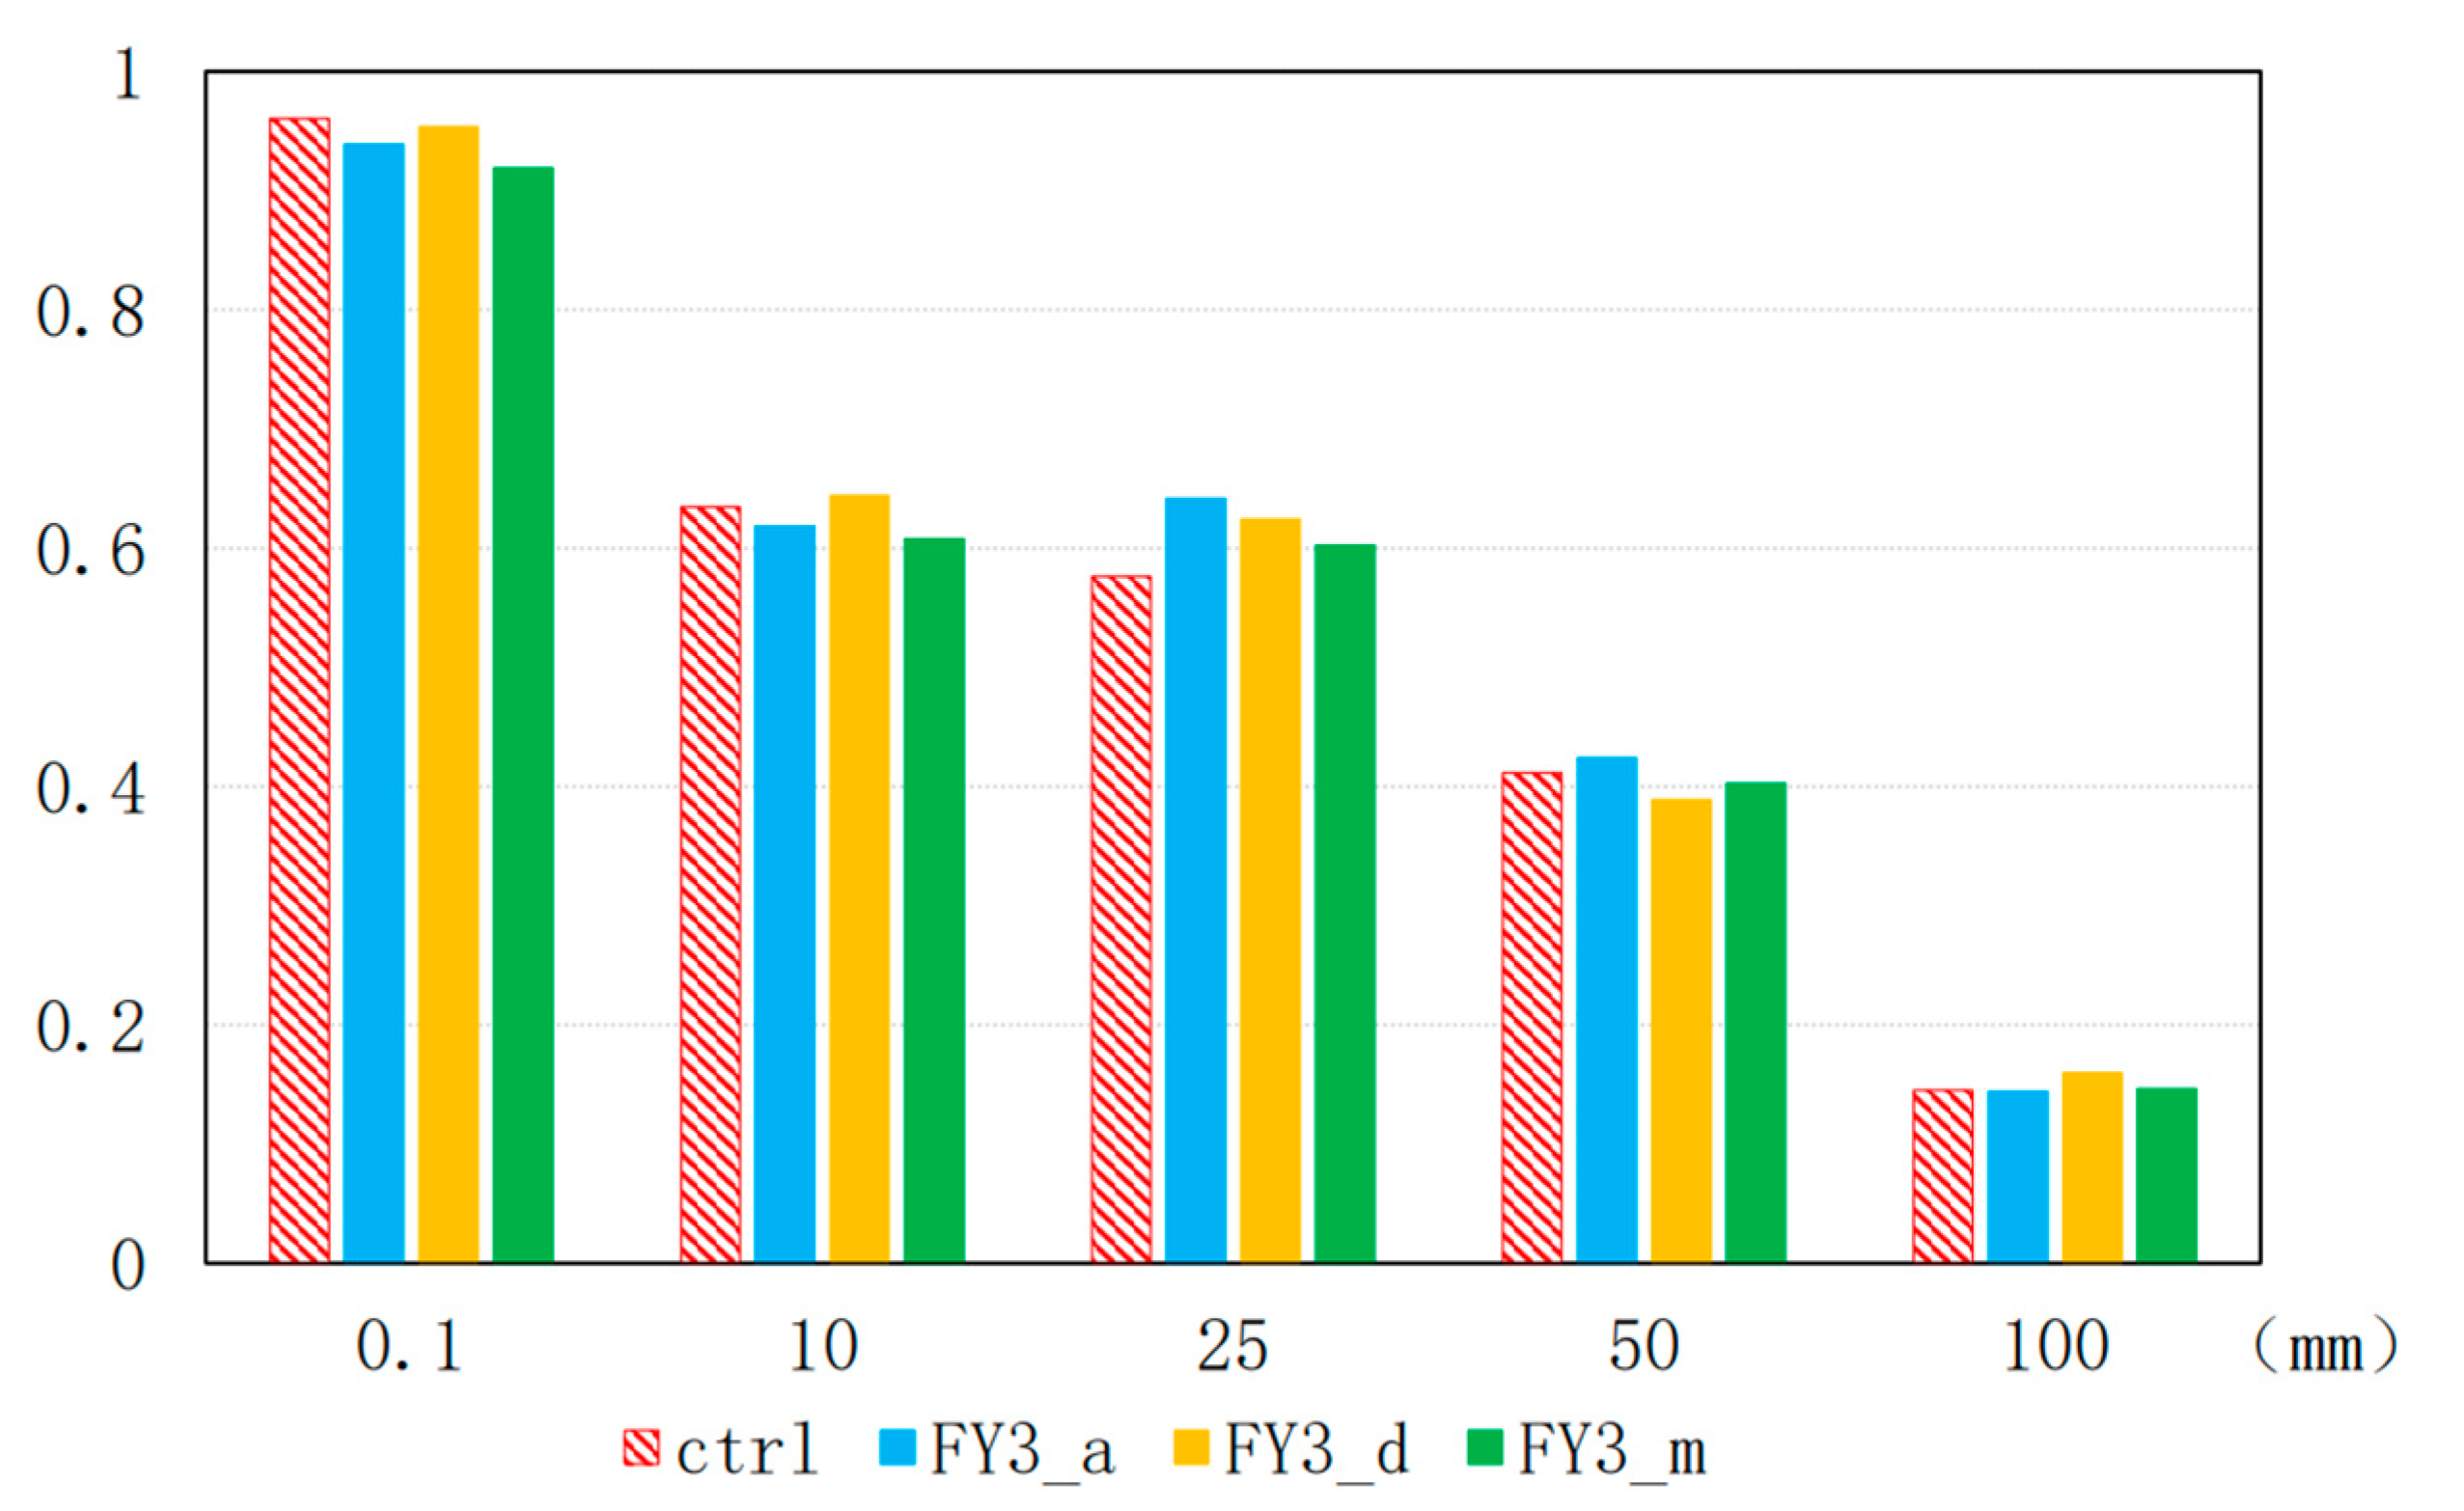
The impact of satellite SST data on precipitation forecasts is quantitatively assessed with the threat score (TS). Overall (Figure 12), the TSs of four experiments are decreasing with precipitation thresholds. All experiments gain a high score of approximately 0.95 at the 0.1 mm threshold, which means the simulation experiments accurately predict whether it will rain. Except for 0.1 mm, CTRL creates a lower TS than SST replacement experiments. It indicates that the satellite SST is good for improving the long-term forecast. Mostly, FY3_m has a low TS for five thresholds, while FY3_a has a significant improvement at 25 mm and 50 mm. Relative to FY3_a, FY3_d produces more skillful forecasts at most accumulation thresholds, except for 50 mm. Especially for extreme event prediction over 100 mm, FY3_d has a TS score of 0.18, which is higher than the other three experiments, likely due to the closest landfall forecast.
5. Discussion and Conclusions
In this study, we evaluate the impact of the FY-3D SST data on typhoon In-Fa simulation with the WRF V4.1. The control experiment with the original SST from the GDAS data is used as a benchmark. Three sensitivity simulation experiments are conducted by replacing the original SST with the ascending orbit, descending orbit, and the average satellite SST retrieval data.
As the initial conditions of the different simulation experiments, the satellite retrieval SST products present much more detailed information and show lower temperatures around the In-Fa track than the original SST data, which comes from climatological data. In general, the CTRL presents a much stronger typhoon than the observed one. Compared with the CTRL, by modifying the initial SST with satellite retrieval data, three sensitivity simulation experiments’ forecast show higher central sea level pressure at 0000 UTC 25 July, which is closer to the observation. Additionally, the three SST sensitivity experiments create a weaker vertical structure of horizontal wind than the CTRL near the surface. As a result, the significant and consistent error reductions of the central sea level pressure and maximum sea surface wind from the whole 54-h forecast are produced and verified with the JMA’s best track data. It means that the typhoon intensity forecast strongly responds to the initial SST data, and the satellite SST retrieval data is more accurate than the original data. Furthermore, verifying against the precipitation observation, an obvious positive forecast impact from the satellite SST data replacement experiments is achieved.
By comparison, the forecast using the SST data retrieved from the FY-3D descending orbit satellite data significantly outperforms other sensitivity forecasts. It gains the best track forecast, which is closest to the observation, while other forecasts predict the southward landfall. Meanwhile, it shows the lowest intensity forecast error and the highest TS, especially for the rainfall threshold of 100 mm. Contrary to the FY-3C satellite (Zhang et al., 2021, 20), based on the above conclusions, it indicates that the descending SST data from FY-3D is more precise than the ascending data.
Overall, SST retrieval data from the FY-3D with high quality is beneficial to typhoon forecast. Whereas, much further improvements can be made in the future. For example, there is a large vortex position bias in the initial condition, which can be improved with higher-quality background data and vortex relocation technology. In addition, because of the retrieval algorithm’s limitation, satellite SST retrieval data still has obvious deviations around the coastline. More advanced methods can be explored to upgrade the quality of SST products.
Author Contributions
C.Y.: Conceptualization, methodology, model and data analyses, writing and review, editing, and visualization. J.L.: Conceptualization, methodology, and editing. All authors have read and agreed to the published version of the manuscript.
Funding
This research was funded by the National Natural Science Foundation of China (Grant No. 42192553, 41805071) and by the Startup Foundation for Introducing Talent of Nanjing University of Information Science and Technology (Grant No. 2017r058).
Institutional Review Board Statement
Not applicable.
Informed Consent Statement
Not applicable.
Data Availability Statement
Publicly available datasets were analyzed in this study. The data used in this study were listed as follows: GDAS final (https://rda.ucar.edu/datasets/ds083.3/index.html#sfol-wl-/data/ds083.3?g=202107, accessed on 23–25 July 2021); FY-3D 10-day-mean SST product (https://satellite.nsmc.org.cn/portalsite/Data/DataView.aspx, accessed on 21 July 2021); 1951–2022 (ALL) best track data form JMA (https://www.jma.go.jp/jma/jma-eng/jma-center/rsmc-hp-pub-eg/besttrack.html, accessed on 8 December 2022).
Acknowledgments
We acknowledge the High Performance Computing Center of Nanjing University of Information Science & Technology for their support of this work.
Conflicts of Interest
The authors declare no conflict of interest. The funders had no role in the design of the study; in the collection, analyses, or interpretation of data; in the writing of the manuscript; or in the decision to publish the results.
References
- Meng, Z.; Zhang, F.; Luo, D.; Tan, Z.; Fang, J.; Sun, J.; Shen, X.; Zhang, Y.; Wang, S.; Han, W.; et al. Review of Chinese atmospheric science research over the past 70 years: Synoptic meteorology. Sci. China Earth Sci. 2019, 62, 1946–1991. (In Chinese) [Google Scholar] [CrossRef]
- Xu, H. Study on Air-Sea Interaction and Rapid Intensification in Typhoon Process; National University of Defense Technology: Changsha, China, 2019. (In Chinese) [Google Scholar]
- Cione, J.J.; Uhlhorn, E.W. Sea Surface Temperature Variability in Hurricanes: Implications with Respect to Intensity Change. Mon. Weather Rev. 2003, 131, 1783–1796. [Google Scholar] [CrossRef] [Green Version]
- Zhang, Z.; Zhang, W.; Zhao, W.; Zhao, C. Radial Distributions of Sea Surface Temperature and Their Impacts on the Rapid Intensification of Typhoon Hato (2017). Atmosphere 2020, 11, 128. [Google Scholar] [CrossRef] [Green Version]
- Zheng, F. A Study of Rapid Intensification and Dissipation of Typhoons over Coastal Water of China; Chinese Academy of Meteorological Sciences: Beijing, China, 2005. (In Chinese) [Google Scholar]
- Ren, X.; Perrie, W. Air-sea Interaction of Typhoon Sinlaku (2002) Simulated by the Canadian MC2 Model. Adv. Atmos. Sci. 2006, 23, 521–530. [Google Scholar] [CrossRef]
- Jiang, J. A Study of SST Effect on Typhon Motion. J. Trop. Meteorol. 1996, 3, 55–60. (In Chinese) [Google Scholar]
- Fisher, E.L. Hurricane and sea-surface temperature field. J. Meteorol. 1958, 15, 328–333. [Google Scholar] [CrossRef]
- Rai, D.; Pattnaik, S.; Rajesh, P.V.; Hazra, V. Impact of high resolution sea surface temperature on tropical cyclone characteristics over the Bay of Bengal using model simulations. Meteorol. Appl. 2018, 26, 130–139. [Google Scholar] [CrossRef] [Green Version]
- Vishwakarma, V.; Pattnaik, S.; Chakraborty, T.; Joseph, S.; Mitra, A.K. Impacts of sea-surface temperatures on rapid intensification and mature phases of super cyclone Amphan (2020). J. Earth Syst. Sci. 2022, 131, 60. [Google Scholar] [CrossRef]
- Ziwang, D.; Qipu, T.; Junru, F.; Fang, X. The Relation Between Frequency of Landing Typhoon and the Pacific SST Field. Q. J. Appl. Meteorol. 1999, 10, 54–60. (In Chinese) [Google Scholar]
- Tong, K.; Su, F.; Yang, D.; Hao, Z. Evaluation of satellite precipitation retrievals and their potential utilities in hydrologic modeling over the Tibetan Plateau. J. Hydrol. 2014, 519, 423–437. [Google Scholar] [CrossRef]
- Zhang, L.; Meng, Q.; Yao, S.; Wang, Q.; Zeng, J.; Zhao, S.; Ma, J. Soil Moisture Retrieval from the Chinese GF-3 Satellite and Optical Data over Agricultural Fields. Sensors 2018, 18, 2675. [Google Scholar] [CrossRef] [PubMed] [Green Version]
- Merchant, C.J.; Embury, O.; Bulgin, C.E.; Block, T.; Corlett, G.K.; Fiedler, E.; Good, S.A.; Mittaz, J.; Rayner, N.A.; Berry, D.; et al. Satellite-based time-series of sea-surface temperature since 1981 for climate applications. Sci. Data 2019, 6, 223. [Google Scholar] [CrossRef] [PubMed]
- Qin, T.; Jia, T.; Feng, Q.; Li, X. Sea surface wind speed retrieval from Sentinel-1 HH polarization data using conventional and neural network methods. Acta Oceanol. Sin. 2021, 40, 13–21. [Google Scholar] [CrossRef]
- Wang, Y.; Liu, H.; Wu, G. Satellite retrieval of oceanic particulate organic nitrogen concentration. Front. Mar. Sci. 2022, 9, 943867. [Google Scholar] [CrossRef]
- Chen, Y.J.; Xie, Q.; Meng, W. An Experiment Study on the Influence of Different sea Surface Temperature on Typhoon Dujuan over the South China Sea. J. Trop. Meteorol. 2009, 25, 401–406. (In Chinese) [Google Scholar]
- Han, S.; Hu, Y.; Xu, C. Numerical Experiment for the Impact of SST to Typhoon “Meihua”. Period. Ocean. Univ. China 2014, 44, 8–15. (In Chinese) [Google Scholar]
- Hu, Y.; Zhao, B.; Zhao, J. Sensitive study on the effect of SST on typhoon process: The case of typhoon “Jelawat”. Mar. Forecast. 2019, 36, 76–85. (In Chinese) [Google Scholar]
- Zhang, C.; Li, S.; Liu, H.; Li, B.; Song, J. Inspection of FY-3 MWRI Sea Surface Temperature Products. Equip. Environ. Eng. 2021, 18, 115–123. (In Chinese) [Google Scholar]
- Wang, Y.; Fu, L.; Jiang, F.; Hu, X.; Liu, C.; Zhang, X.; Li, J.; Ren, Z.; He, F.; Sun, L.; et al. Far-ultraviolet airglow remote sensing measurements on Feng Yun 3-D meteorological satellite. Atmos. Meas. Tech. 2022, 15, 1577–1586. [Google Scholar] [CrossRef]
- Reynolds, R.W.; Gentemann, C.L.; Corlett, G.K. Evaluation of AATSR and TMI Satellite SST Data. J. Clim. 2010, 23, 152–165. [Google Scholar] [CrossRef] [Green Version]
- Li, Z.; Liu, M.; Wang, S.; Qu, L.; Guan, L. Sea Surface Skin Temperature Retrieval from FY-3C/VIRR. Remote Sens. 2022, 14, 1451. [Google Scholar] [CrossRef]
- Junker, N.W.; Hoke, J.E.; Sullivan, B.E.; Brill, K.F.; Hughes, F.J. Seasonal and geographic variations in quantitative precipitation prediction by NMC’s nested-grid model and medium-range forecast model. Weather Forecast. 1992, 7, 410–429. [Google Scholar] [CrossRef]
- Dare, R.A.; Mcbride, J.L. Sea surface temperature response to tropical cyclones. Mon. Weather Rev. 2011, 139, 3798–3808. [Google Scholar] [CrossRef]
Figure 1.
The best track of the In-Fa from JMA.

Figure 2.
Central sea level pressure (CSLP, unit: hPa) and maximum surface wind speed (MSWS, unit: m·s−1) of In-Fa.
Figure 2.
Central sea level pressure (CSLP, unit: hPa) and maximum surface wind speed (MSWS, unit: m·s−1) of In-Fa.

Figure 3.
Initial sea surface temperature (unit: °C) from CTRL (a), fy3_a (b), fy3_d (c), fy3_m (d).
Figure 3.
Initial sea surface temperature (unit: °C) from CTRL (a), fy3_a (b), fy3_d (c), fy3_m (d).

Figure 4.
The sea level pressure from CTRL (a), FY3_a (b), FY3_d (c) and FY3_m (d) (unit: hPa, the red line is the cross line of Figure 5).
Figure 4.
The sea level pressure from CTRL (a), FY3_a (b), FY3_d (c) and FY3_m (d) (unit: hPa, the red line is the cross line of Figure 5).

Figure 5.
The north-south cross-sections of the horizontal wind speed and temperature through the vortex center at 0000 UTC 25 July 2021 (a) CTRL, (b) fy3_a, (c) fy3_d, and (d) fy3_m (the shaded is the horizontal wind speed, unit: m·s−1; the black solid line is the temperature, unit: °C).
Figure 5.
The north-south cross-sections of the horizontal wind speed and temperature through the vortex center at 0000 UTC 25 July 2021 (a) CTRL, (b) fy3_a, (c) fy3_d, and (d) fy3_m (the shaded is the horizontal wind speed, unit: m·s−1; the black solid line is the temperature, unit: °C).

Figure 6.
The same as Figure 5, but for vertical velocity (unit: m·s−1; the red box is the center of the typhoon).
Figure 6.
The same as Figure 5, but for vertical velocity (unit: m·s−1; the red box is the center of the typhoon).

Figure 7.
The same as Figure 5, but for potential vorticity (unit: PVU; vertical axis is height in km).
Figure 7.
The same as Figure 5, but for potential vorticity (unit: PVU; vertical axis is height in km).

Figure 8.
The best track (black) and 54 h forecast from CTRL (red), FY3_a (blue), FY3_d (yellow) and FY3_m (green) from 0000 UTC 23 July.
Figure 8.
The best track (black) and 54 h forecast from CTRL (red), FY3_a (blue), FY3_d (yellow) and FY3_m (green) from 0000 UTC 23 July.

Figure 9.
The steering flow from 700 hPa to 200 hPa for four experiments at 0000 UTC 25 July.

Figure 10.
Mean track errors ((a), unit: km), mean central sea level pressure errors ((b), unit: hPa) and mean maximum surface wind speed errors ((c), unit: m·s−1) as a function of forecast range from four experiments.
Figure 10.
Mean track errors ((a), unit: km), mean central sea level pressure errors ((b), unit: hPa) and mean maximum surface wind speed errors ((c), unit: m·s−1) as a function of forecast range from four experiments.

Figure 11.
Accumulated precipitation from 0600 UTC 24 July to 0600 UTC 25 July 2021 (a) observations, (b) CTRL, (c) fy3_a, (d) FY3_d, (e) FY3_m (unit: mm).
Figure 11.
Accumulated precipitation from 0600 UTC 24 July to 0600 UTC 25 July 2021 (a) observations, (b) CTRL, (c) fy3_a, (d) FY3_d, (e) FY3_m (unit: mm).

Figure 12.
The threat scores of 24 h accumulated rainfall from 0600 UTC 24 to 0600 UTC 25 July for the four experiments at 0.1, 10, 25, 50 and 100 mm precipitation thresholds.
Figure 12.
The threat scores of 24 h accumulated rainfall from 0600 UTC 24 to 0600 UTC 25 July for the four experiments at 0.1, 10, 25, 50 and 100 mm precipitation thresholds.

Disclaimer/Publisher’s Note: The statements, opinions and data contained in all publications are solely those of the individual author(s) and contributor(s) and not of MDPI and/or the editor(s). MDPI and/or the editor(s) disclaim responsibility for any injury to people or property resulting from any ideas, methods, instructions or products referred to in the content. |
© 2023 by the authors. Licensee MDPI, Basel, Switzerland. This article is an open access article distributed under the terms and conditions of the Creative Commons Attribution (CC BY) license (https://creativecommons.org/licenses/by/4.0/).
Share and Cite
MDPI and ACS Style
Yang, C.; Li, J. Assessment of FY-3D SST Data on Typhoon In-Fa Simulation. Atmosphere 2023, 14, 101. https://doi.org/10.3390/atmos14010101
AMA Style
Yang C, Li J. Assessment of FY-3D SST Data on Typhoon In-Fa Simulation. Atmosphere. 2023; 14(1):101. https://doi.org/10.3390/atmos14010101
Chicago/Turabian StyleYang, Chun, and Jingyu Li. 2023. "Assessment of FY-3D SST Data on Typhoon In-Fa Simulation" Atmosphere 14, no. 1: 101. https://doi.org/10.3390/atmos14010101
Note that from the first issue of 2016, this journal uses article numbers instead of page numbers. See further details here.