1. Introduction
The residential sector accounts for more than 25% of the total energy consumption in Europe [
1]. In the last ten years, the renovation rate in this sector has increased, but the achievement of the required standards for the built environment imposed by European regulations to advance towards climate neutrality in 2050 is still far to reach. Indeed, the annual rate of deep renovations of the existing building stock in the EU is around 0.2% and the vast majority of these renovations are implemented as individual or step-by-step measures [
2]. In particular, one of the most crucial challenges in building renovation is the choice of the optimal combination of passive strategies to apply to the envelope of the building [
3], as dispersions through the external envelope account for 50% of the energy demand [
4]. Moreover, HVAC systems have a shorter life compared to the architectural and structural parts of a building and are easier to substitute; thus, the choices made for the envelope are those with longer-term effects. More interesting data are that 22.3% of the European building stock was built before 1946 and around 44% between 1946 and 1980 [
5]. Thus, the majority of the existing building stock is obsolete from an energy performance point of view, as they are older than the first regulations on building energy performance [
6].
Nowadays, the European Green Deal and other incentive-based programs in Europe encourage long-term strategies aimed toward a more sustainable building stock, starting with the renovation of public buildings [
7]. In greater detail, social housing, representing more than 27 million dwellings and about 7% of the total housing stock in EU countries [
6], is fundamental to stimulating economic recovery and social welfare policy and to supporting environmental sustainability objectives [
8]. Indeed, retrofit improvements of social housing buildings respond to the need to mitigate fuel poverty, especially among the most vulnerable population [
9]. Fuel poverty is a growing social problem and amplifies health inequalities [
10], whereby households are unable to meet their energy needs due to low incomes, high energy prices, and poor building performances [
11]. Most often, fuel poverty is considered synonymous with energy poverty, but, as they are actually two distinct issues, we will refer to fuel poverty in this article, while energy poverty instead means the lack of access to modern energy services, such as electricity and clean cooking energy, that is mainly diffuse in Africa, India, and other developing countries in Asia [
12]. The indicators of fuel poverty are the inability to keep homes adequately warm, arrears on utility bills, and leak/damp/rot in the dwelling [
13]. Meanwhile, an indicator of energy poverty is a lack of availability of energy services. Both fuel poverty and energy poverty, however, share some similarities, in that they are common to all climate areas, especially relevant in the residential sector among low-income households, and they further aggravate poverty, inequality, health issues, and social development [
11]. In social housing buildings, usually passive strategies for the envelope are preferred more than modifying the energy systems or installing renewable energy equipment, which leads to overlooking the multidimensionality of the issue of fuel and energy poverty, as it ignores the restrictions they impose on cooking, lighting, and domestic hot water [
14]. Therefore, the sole implementation of passive strategies is not sufficient to solve fuel and energy poverty in social housing. Aggravating the current scenario, recently, the cost of energy underwent tremendous growth, making the transition to renewable sources and energy efficiency strategies for our buildings increasingly urgent [
15]. The energy inflation rate is higher than 25%, especially with respect to gas, which is commonly used for heating in the residential sector [
15]. This can bring about an increase in domestic thermal discomfort and, as a consequence, economic implications on public healthcare [
16].
Therefore, the energy retrofitting of the existing stock, and especially of the social housing stock, are even more important to face the upcoming challenges related to energy price increases, which further aggravate fuel poverty. Indeed, energy retrofitting can reduce the energy bills for households and improve their comfort, health, and quality of life, and at the same time, reduce the environmental impact of the building stock. For all these reasons, the energy retrofitting of the social housing building stock is an urgent task. Retrofit strategies should greatly reduce both energy consumption and CO
2 emissions, but, at the same time, they should be cost-effective; thus, focusing on technical, financial, and social added values simultaneously is necessary [
17]. Therefore, a highly complex problem is outlined, considering multiple objectives and multiple variables—where each can have a wide range of possible values [
5].
Such a complexity has been commonly considered with traditional scenario-by-scenario analyses for finding the most convenient solutions. Rosso et al. [
6] considered the energy performance improvement of a social housing case study in Rome, Italy, by means of a scenario-by-scenario consideration of different sustainable, bio-based thermal insulation panels and glazing passive strategies, and with the best scenario they assessed a reduction in yearly energy consumption by up to 36%. Barbosa and colleagues [
18] considered increasing insulation as a solution to reduce vulnerability in the case of 1960s’ Southern Europe housing, focusing on decreasing discomfort hours, and were able to assess a 48% decrease. With respect to Southern Europe, Ozarisoy and Altan [
19] considered the performance of shading devices for reducing overheating in social housing case studies and suggest a retrofit design policy that considers passive cooling design strategies. The urge to act on the social housing building stock is evidenced by Escandòn and colleagues [
20], which assessed that 38% of postwar social housing buildings are at risk of overheating at present, and 100% of them will be in 2050 if they remain in the current conditions, posing a serious threat to the vulnerable population living there. Finally, Santangelo and colleagues [
21] verified that 20% of the European population cannot adequately heat their houses due to fuel poverty and that retrofitting this stock would mitigate this issue. All of these studies, while focusing on the social housing building stock in Southern Europe, which is a relevant case study due to the quantity of such buildings [
22], apply a scenario-by-scenario approach. In order to surpass the limitations produced by scenario-by-scenario approaches, e.g., the reduced number of solutions that can be considered and the computational time that is devoted to such approaches, we propose a methodology that allows a rapid and broader consideration of solutions to the complex challenge of evaluating the most suitable solution for retrofitting the social housing building stock.
Indeed, optimization algorithms can be used, coupled with energy simulation software [
23], to deal with such a complex problem and to explore this wide space of solutions. These advanced digital tools can support the designer during the decision-making phase and can address the design problem to advance toward more sustainable and comfortable solutions. Indeed, the space of solutions of the possible passive strategies to implement in building retrofits would be too wide to manually explore with a scenario-by-scenario approach, and “intelligent” algorithms can be used to automatically converge towards optimal solutions. In the scientific literature, the most common optimization algorithm used in building design optimization problems is the genetic algorithm [
24].
Multi-objective optimization in building design is an active research field [
25]. Dealing with conflicting objectives, the optimization process does not provide only one solution—the absolute optimum—but a set of optimal solutions called Pareto solutions. This allows the designer to choose one of the selected solutions based on his preferences and requests. Moreover, it can be useful to explore different combinations and to allow for architectural variability. Building energy optimization for existing buildings is a topic of increasing interest and different methods were employed in the scientific literature with respect to the theoretical framework, objective functions, genes, and software [
26,
27]. Research is still needed to find an approach that can be shared worldwide and used for different design problems. With this work, we contribute to the advancing research in this developing field by applying the multi-objective optimization of building performance to the context of building energy retrofitting, in the relevant case study of social housing. While the application is for a specific case, even if relevant and significant, the proposed methodology is of general value and can be applied to other contexts. In the next section, the aim and contribution of the work will be discussed in detail.
Section 3 deals with the method of the present work, while the results and discussion are illustrated in
Section 4, and
Section 5 deals with the conclusions.
2. Aim and Contribution of the Work
Based on the above-discussed context, this work aims to expand the discussion on the multi-objective optimization of retrofit actions aiming towards more sustainable and comfortable buildings, with a specific focus on the social housing context, which is particularly in need of such an action. Indeed, the paper proposes a multi-objective approach for the energy renovation of the social housing building stock and fuel poverty mitigation. This kind of approach aims to consider, simultaneously, the architectural, energy, and economic aspects of the design to address more efficient and cost-effective passive strategies. Moreover, the output of the optimization of the building envelope is used to also consider a renovation of the energy system, i.e., active strategies. Advanced tools are used for conducting dynamic energy simulations of the building (EnergyPlus) and the system (EnergyPLAN). The workflow is set to be applied to different design problems. Indeed, each building would require a specific and tailored optimization to better address a deep and effective energy renovation. Therefore, even if applied here to a specific relevant and significant case study, that of the social housing in Rome, the proposed workflow can be applied to other contexts.
The objectives of such a multi-objective optimization are the reduction in investment costs and the reduction in the energy demand with respect to the reference building (the case study as it is), by means of the applications of combinations of passive strategies, i.e., integrated design solutions [
3]. The result is a set of optimized solutions, among which the optimal solution is the one that minimizes to the maximum extent all of the objectives at the same time. After optimizing the passive strategies, active strategies are also considered in the workflow to further tackle fuel poverty with respect to electricity and natural gas consumption, taking into consideration the recent increase in energy prices due to geopolitical instabilities [
28]. The two-step workflow allows us to disentangle the role of passive strategies and active strategies in mitigating fuel poverty, considering that, as demonstrated in the literature [
14], neither passive strategies nor active strategies alone are sufficient for advancing towards this aim.
3. Method
In order to find suitable retrofit strategies that are tailored for each specific building, the proposed workflow is built on a significant and relevant case study.
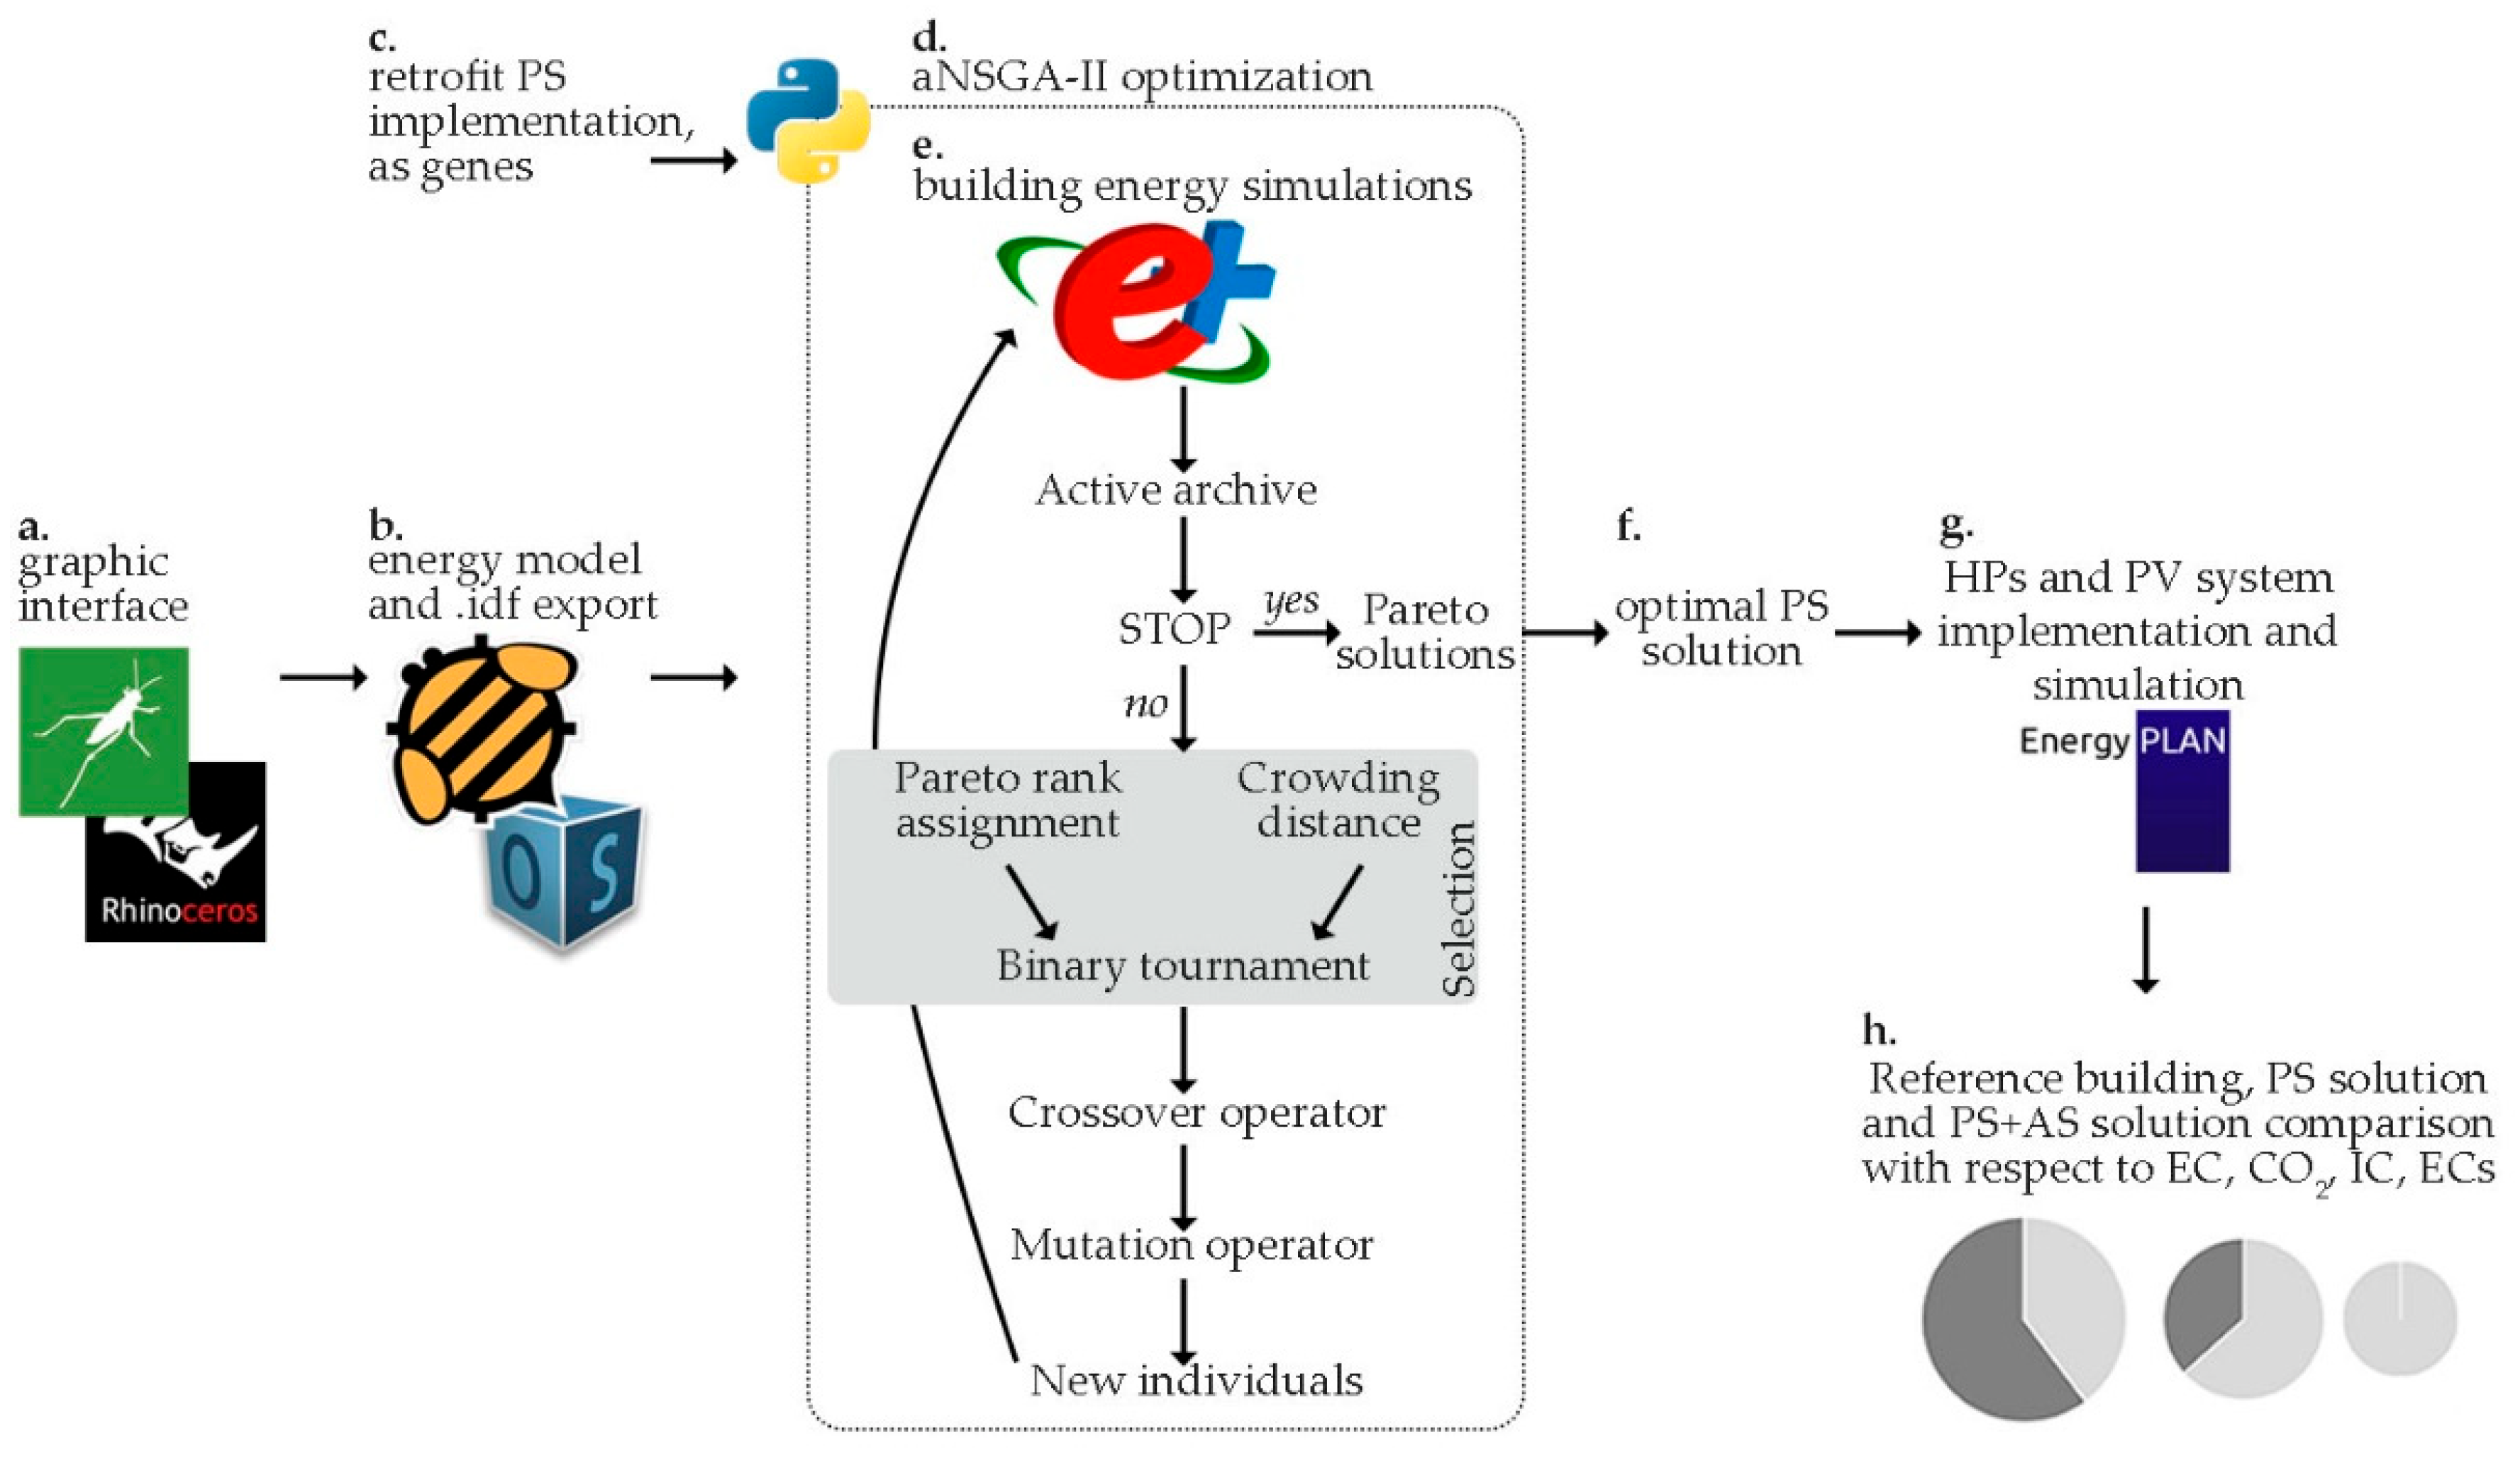
Figure 1 summarizes the methodological workflow of this research, which is briefly outlined here but described in more detail in the following subsections. The digital model of the case study is first prepared with Rhinoceros 3D and Grasshopper as a graphic interface (
Figure 1a), then, the energy model is created by means of a Grasshopper plug-in, i.e., Honeybee, and the .idf file is exported with the OpenStudio features included in Honeybee (
Figure 1b). Then, architecturally compatible retrofit strategies are taken into account. With these base considerations, the optimization problem is outlined considering energy demand and investment costs as objective functions and genes (i.e., passive retrofit strategies), and constraints are set (
Figure 1c). An active archive Non-Dominated Sorting Genetic Algorithm (aNSGA-II) written in Python is used for the optimization (
Figure 1d), coupled with the building energy simulation software, i.e., EnergyPlus (
Figure 1e). After running the simulations, the optimal combination of strategies for the retrofit intervention is chosen from the Pareto curve of optimal solutions (
Figure 1f). Then, for the optimal solution, the energy system renovation with heat pumps and photovoltaic panels is simulated with EnergyPLAN and analyzed (
Figure 1g). Evaluations of the influence of passive and active strategies on energy, emissions, and cost savings are drawn, also considering the recent rise of energy costs (
Figure 1h).
3.1. The Case Study Building
The energy retrofit optimization is applied and verified on a significant and relevant case study, pertaining to the social housing building stock of Rome, Italy. The case study building is significant because it is representative of 1960s–1970s social housing complexes, common in many Italian and European outskirts, which were built with innovative prefabricated methods but were lacking in energy efficiency and thermal performance, further degrading overtime. This is even more severe considering that the buildings pertain to social housing and, thus, to a vulnerable part of the population. In addition, to aggravate this aspect, fuel poverty in Italy is slightly increasing. According to the latest data made available by the ENEA for the annual report of the Italian Observatory on Energy Poverty (OIPE), between 2016 and 2018 the phenomenon affected approximately 40 thousand more families, equivalent to 8.8% at the national level [
29].
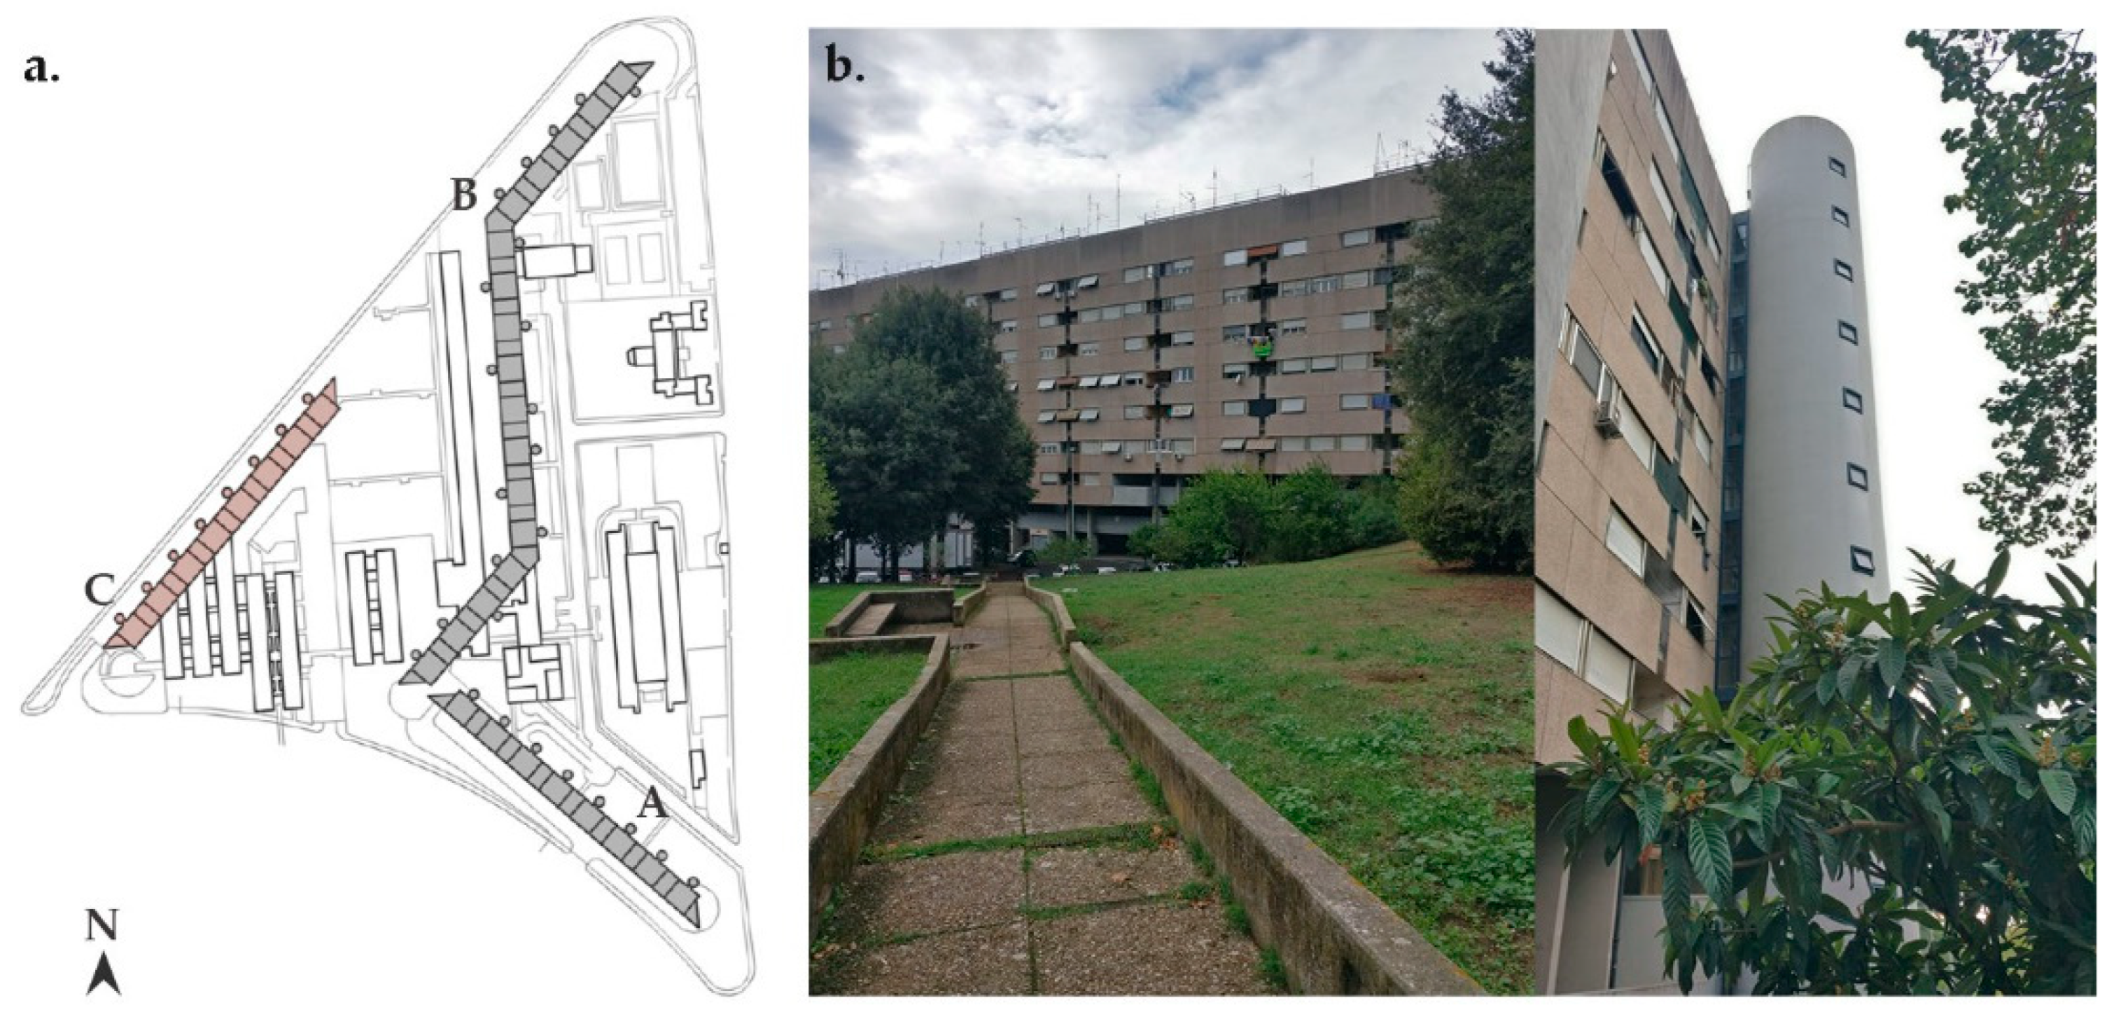
The selected case study is a building designed by Lucio Passarelli in the late 1970s in the northeast area of the city for the social housing complex “Vigne Nuove” [
30]. In particular, the selected building is building C, chosen among the three residential buildings in that area, as shown in
Figure 2a. It is a linear block building with the distinctive characteristic of external cylindrical staircase volumes (
Figure 2b).
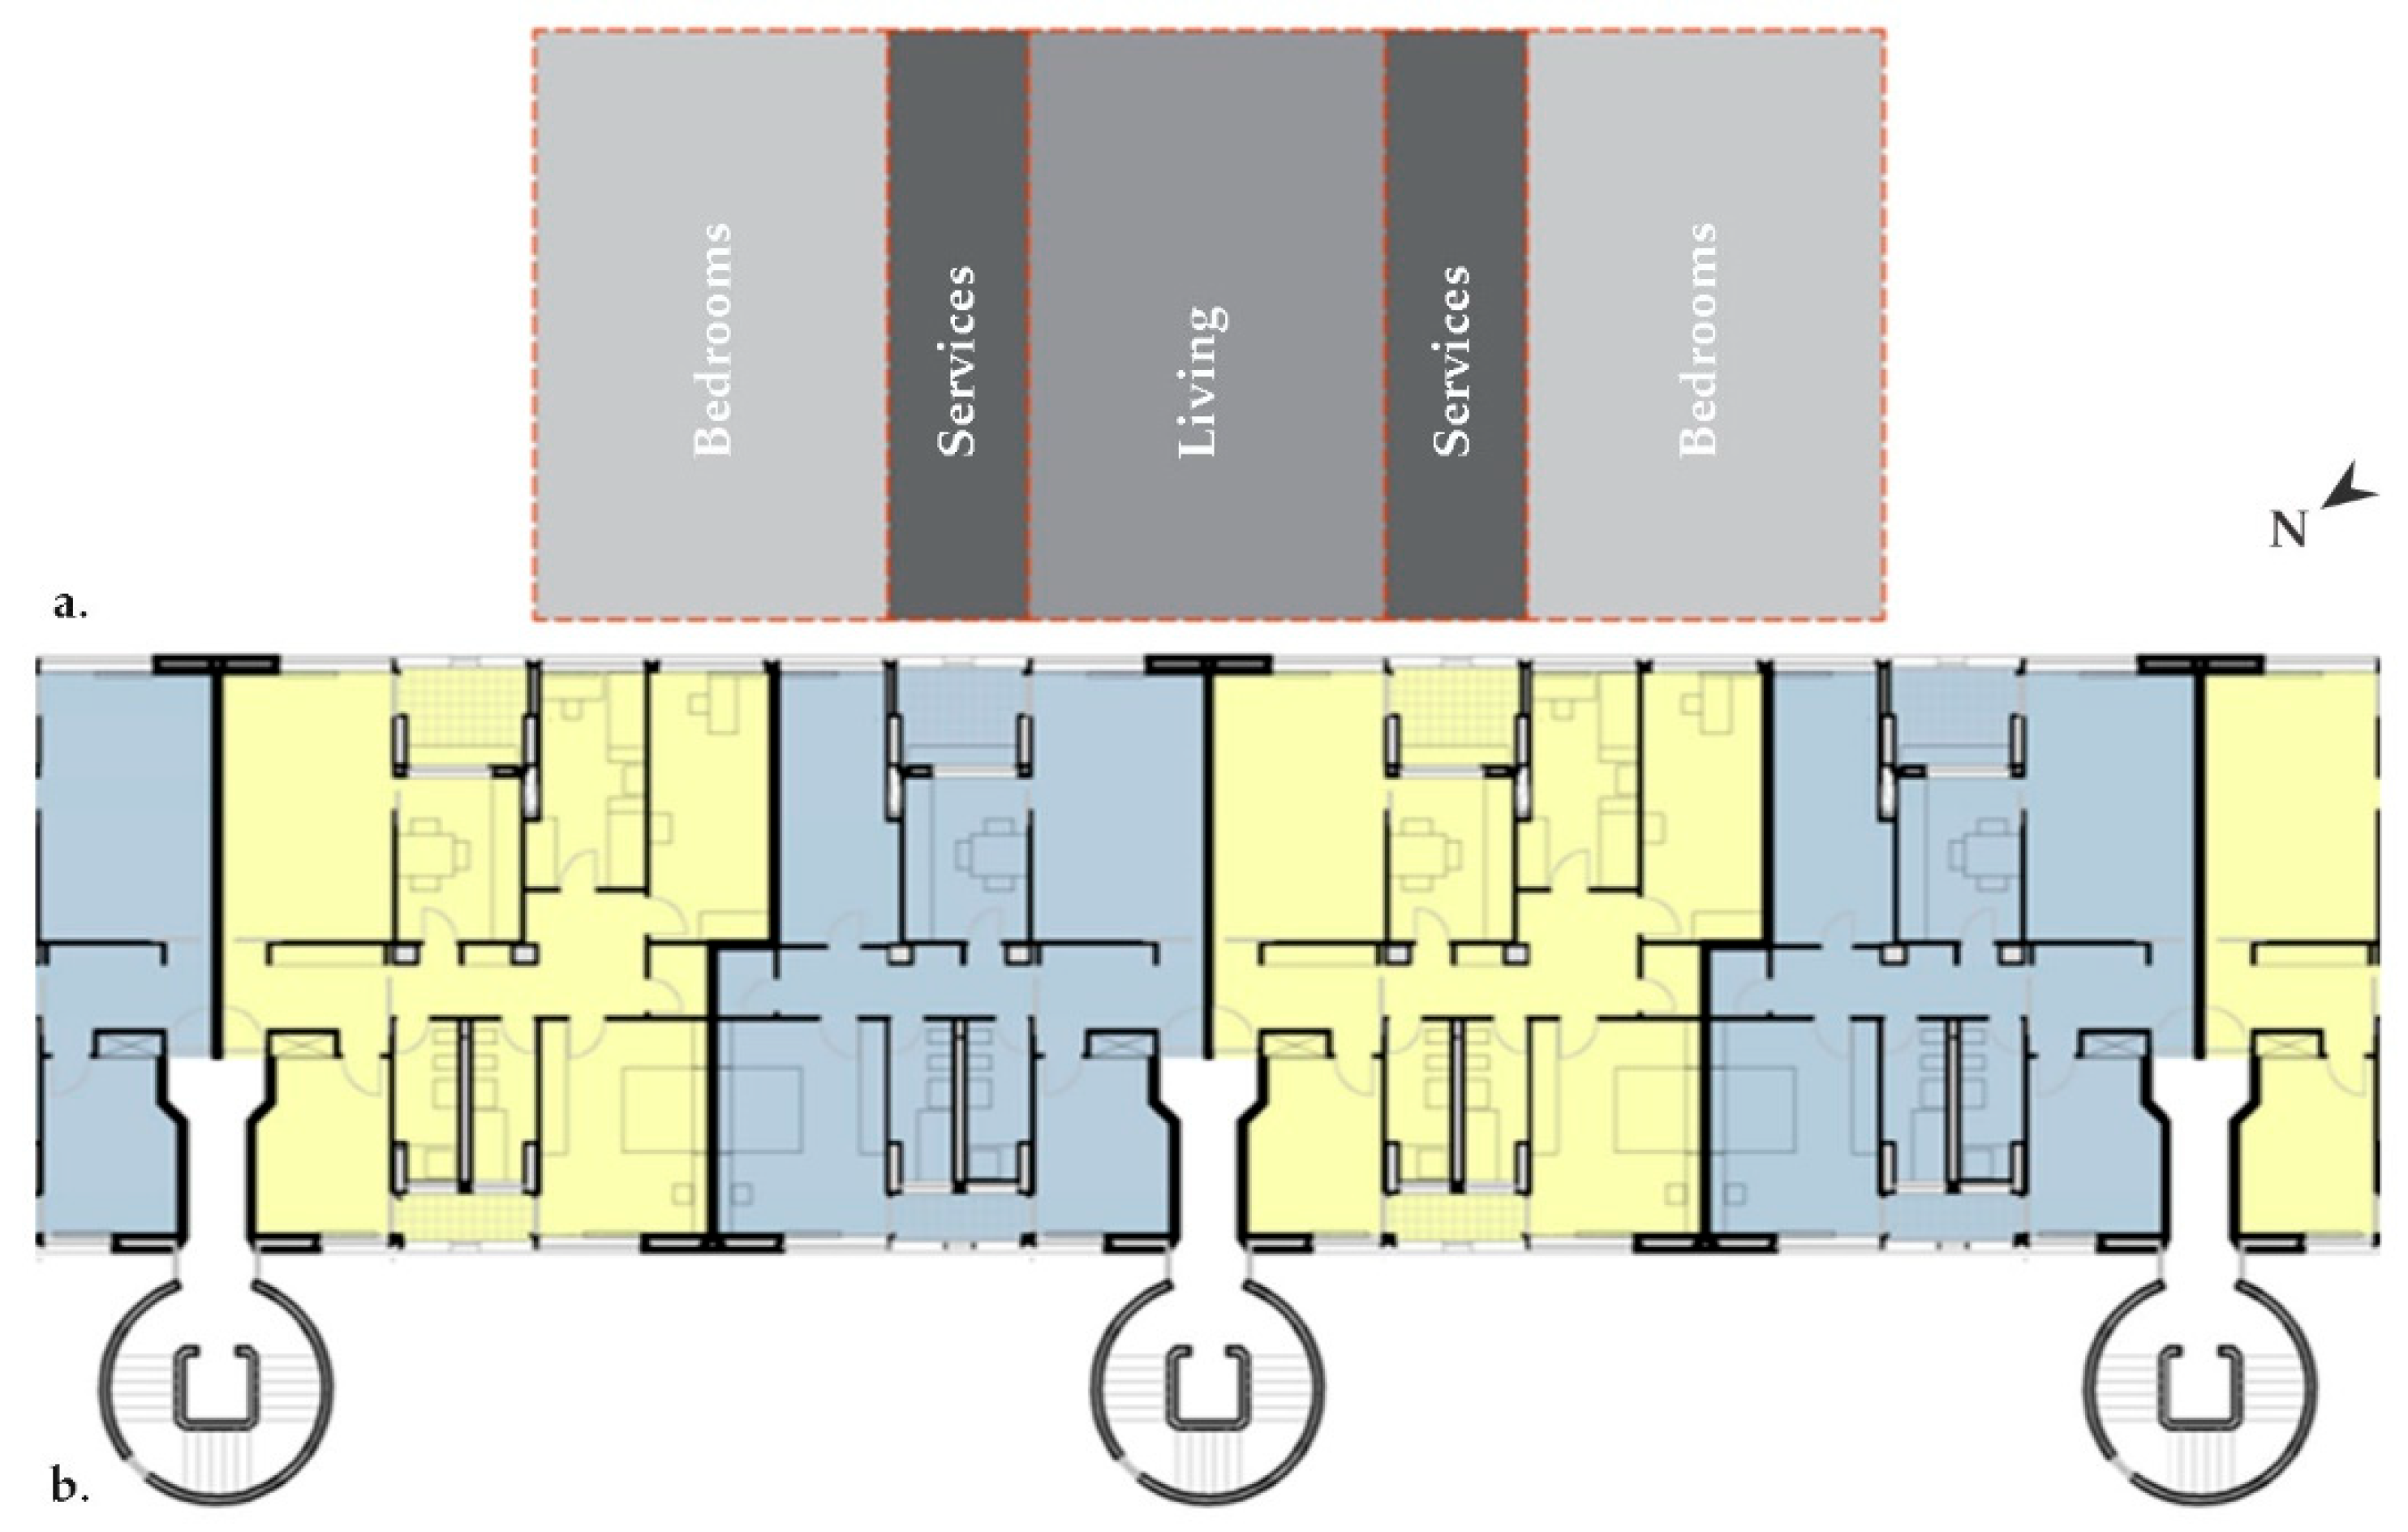
The case study consists of seven floors of apartments; the ground floor is open and the roof consists of common spaces employed as terraces and small closed volumes for private storage. Each floor has two typologies of apartments, both of which have double exposure. Moreover, the functional distribution of each floor is always defined by the sequence of living areas, service blocks (kitchens, bathrooms, and loggias), and bedrooms (as illustrated in
Figure 3). The building consists of 108 apartments and the total area of the conditioned zone is 13,000 m
2.
With respect to the geographical area and climate where the case study building is located, Rome, Italy is in a Csa climate according to the Koppen–Geiger classification [
31]. It is considered to be a temperate climate characterized by hot, dry summers and wet winters. As for the Italian climate classification, the building is located in zone D [
32].
3.2. The Building Energy Model
The building 3D model is created by means of Rhinoceros and Grasshopper. Then, the energy characteristics of the building are implemented by Honeybee, a Grasshopper plug-in that connects Rhino geometry and Grasshopper functionality to a selection of advanced energy modeling and simulation programs.
Table 1 describes the envelope elements of the building with a description of the layers and their thermo-physical features, based on [
33] an in situ survey by the authors. Since no direct measurements have been conducted, the thermo-physical features of the materials are defined by the authors’ experience and the technical specifications of the commercial products. The .idf file is then exported to be used in the optimization process, conducted by means of an in-house implemented genetic algorithm written in Python and connected to EnergyPlus [
34] with the Eppy library [
35]. For the energy system renovation phase, the outputs of EnergyPlus are used as inputs for EnergyPLAN [
36].
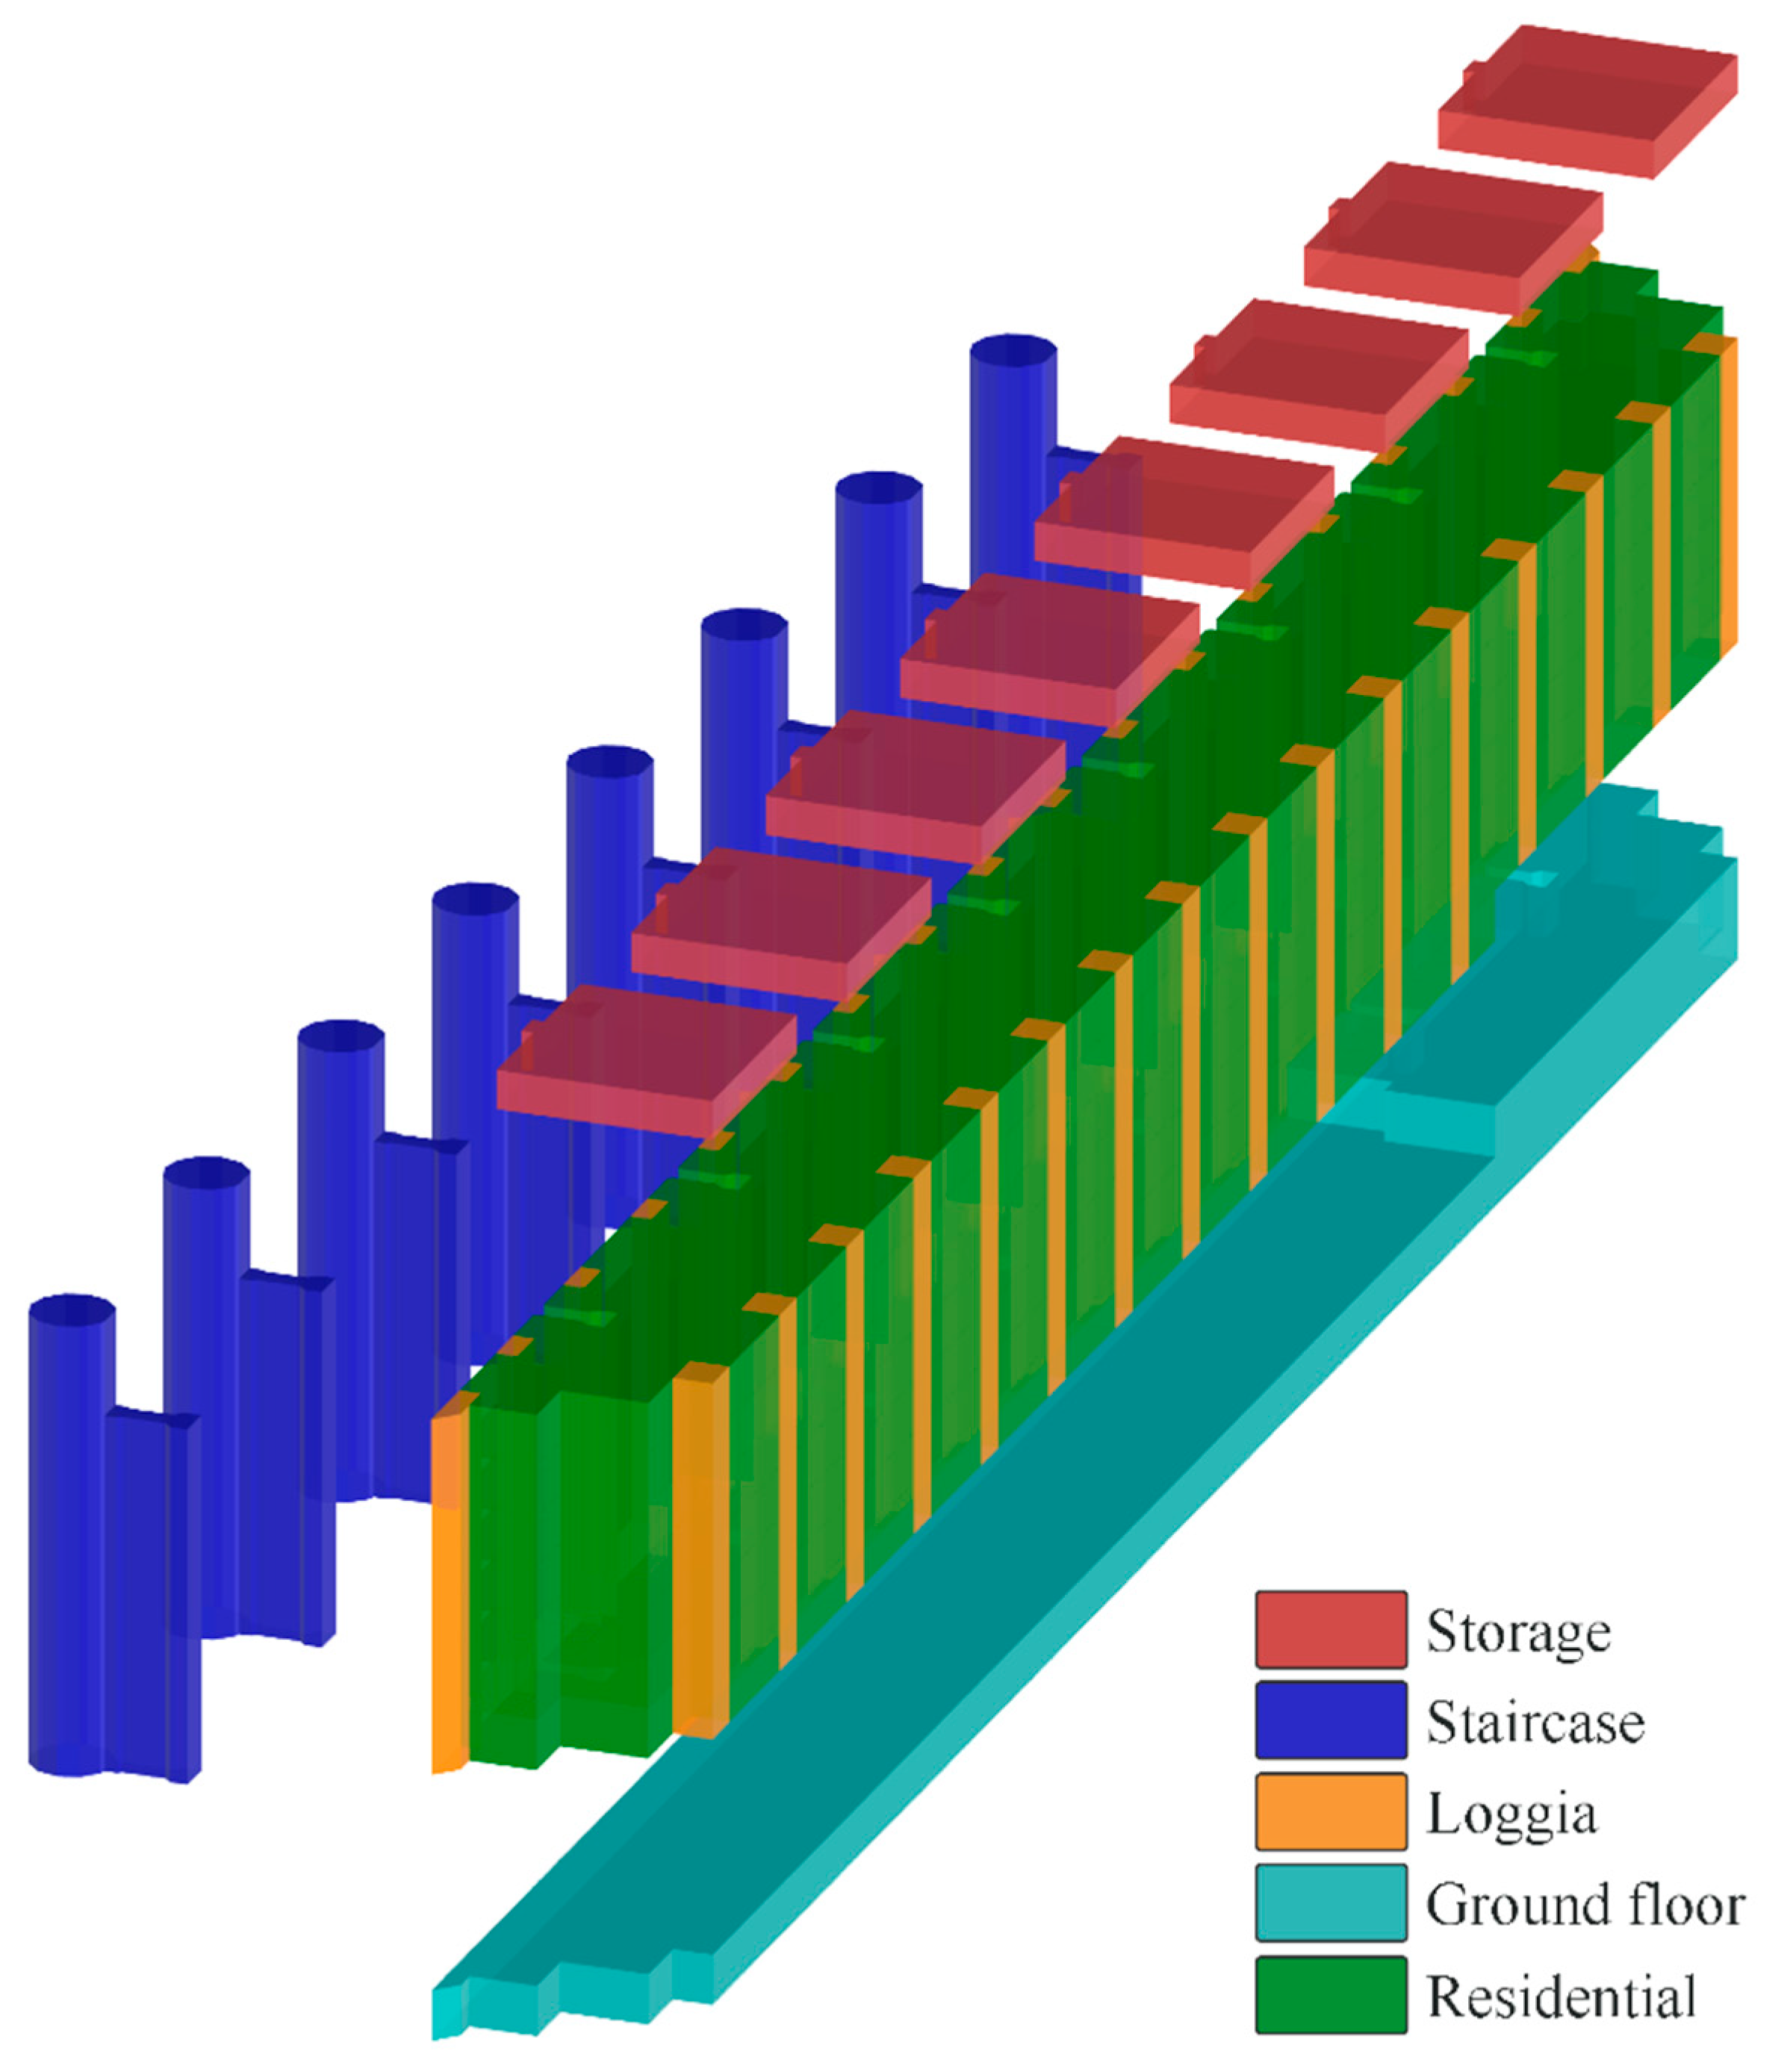
With respect to the thermal zones, the residential floors are modeled as one thermal zone, based on the consideration of the homogeneous functional distribution of all the floors and the double exposure of all the apartments. The simulation parameters are set in accordance with Italian technical codes [
37]. The residential thermal zone is a conditioned area, with an occupancy schedule from the late afternoon until the early morning (recalling a typical working day). On the contrary, during the weekends, the occupants are considered at home until late morning. The number of occupants is evaluated based on the apartments’ size, and all apartments are considered occupied. In order to define the thermal loads, an Ideal Load Air System is considered, and the thermostat is set at 20 °C during the heating season and 26 °C during the cooling season. The natural ventilation is set to 0.5 vol/h [
37]. In addition, there are non-conditioned zones for the staircases, the storage volumes on the roof, the loggias, and the open ground floor. The staircases and ground floor are employed in the late afternoon (when occupants come back from work) and early morning (when occupants go to work). The climate file related to Roma Fiumicino was selected from the EnergyPlus weather data repository, available online [
38], to be employed for the hourly time-steps simulations carried on for the whole year. The same thermal zones and simulation parameters are considered during the energy simulation of the building with the implementation of the retrofit strategies described in the next subsection.
Figure 4 shows the energy model with its thermal zones.
3.3. Retrofit Strategies
Based on the analysis of the current status of the building, different architecturally compatible strategies are considered for the energy renovation of the building. These retrofit strategies—which constitute the “genes” of the building for the genetic optimization—are the following: (i) adding mid and internal thermal insulation to the external cavity walls, (ii) adding internal thermal insulation to the loggia walls, (iii) adding external thermal insulation to the roof, (iv) changing the solar reflectance of the finishing layer of the roof, (v) changing the windows, (vi) closing the loggias with operable glazing, (vii) adding solar shading in the loggias, and (viii) closing the open ground floor with operable glazing. For each gene, a range of possible solutions are considered, and the costs are evaluated based on the regional price list for Lazio [
39] where the case study is located.
Table 2 shows the list of the investigated genes, the range of variability, and the related costs. The lower value of the range of variability of the considered genes is defined in accordance with the minimum transmittance requirements of current Italian regulations for climate zone D, where the building is located [
40]. Only the thermal insulation in the cavity of the outdoor wall is set at a constant of 20 cm, as it is the thickness of the cavity. For this reason, the material of the thermal insulation is considered as a gene and not the thickness of this layer.
3.4. Optimization of the Passive Strategies by Means of Genetic Algorithm
The formulation of the optimization problem is based on the need to simultaneously consider the energy and economic aspects of the retrofit interventions in order to find an energy- and cost-efficient solution. Therefore, a multi-objective optimization is conducted, dealing with the minimization of the energy demand (ED) and investment costs (IC). The problem can be summarized by the following equation:
The ED is the annual energy demand for space conditioning, including space heating and cooling, determined by the sum of EnergyPlus hourly outputs. The IC is the sum of each retrofit action cost implemented on the building based on the regional price list [
39]. Therefore, the space of solutions is a two-dimensional space with 82,944 possible alternatives, considering all the genes (the retrofit passive strategies described in the previous subsection) and their range of variability.
A genetic algorithm is used to explore the space of solutions in a faster and more efficient way. Indeed, the algorithm is set to automatically converge towards optimal solutions with respect to the considered objective functions. From the 82,944 possible solutions, only 2000 are simulated, allowing a significant reduction in the computational time.
The optimization algorithm used is an in-house developed active archive Non-Dominated Sorting Genetic Algorithm (aNSGA-II) [
41]. This algorithm is still not widely employed in the literature, but its high efficiency is demonstrated in different works [
42,
43,
44]. The genetic algorithm is implemented by using Python and coupled to EnergyPlus with the Eppy library [
35]. In this way, Python can automatically launch EnergyPlus simulations, manipulate EnergyPlus input files (.idf), and read and post-process EnergyPlus output files (.csv).
The outputs of the optimization are a set of optimal solutions along the Pareto curve, among which the designer can choose the fittest one depending on the needs of the different stakeholders. In this case, as the building is public, we hypothesize that the best solution for all the stakeholders is the solution that simultaneously minimizes the two objectives.
3.5. Implementation of Active Strategies and Renewable Energies
Once the best combination of passive strategies is found by means of the multi-objective optimization and the cooling and heating needs of the building have been greatly reduced, we consider the renovation of the heating and cooling system, taking into account the best practices for active strategies in buildings in the Mediterranean area. Indeed, the installation of reversible heat pumps for heating and cooling, coupled with photovoltaic panels, is considered in the scientific literature to be the most useful system renovation for the decarbonization of the residential sector [
45]. At the same time, the high performance of heat pumps allows a reduction in primary energy consumption compared to gas-fueled technologies. Moreover, the recent high increase in fossil fuel prices necessitates an urgent transition to electricity and renewable energy sources, as well as the mitigation of fuel poverty in social housing buildings.
The outputs of the EnergyPlus simulations are used as inputs for the original and the renovated energy system simulations by means of EnergyPLAN [
36], a software developed by Aalborg University, Denmark and already widely used in the scientific literature [
46,
47]. It is an input/output computer tool that works with hourly steps over a whole year. EnergyPLAN has been mainly applied at a regional and national scale [
48]; nevertheless, several works have used the software to model and design distributed energy systems [
49].
The heating system of the reference building is a traditional natural gas boiler (efficiency 92%). Air-to-air heat pumps, characterized by a COP of 2.7, are applied to supply the cooling demand in the reference scenario. The electricity demand has been modeled according to [
50], which provides average electricity consumption values for dwellings in Italy. Reversible air-to-water heat pumps have been considered to supply the heating and cooling demand in the renovated scenario.
Table 3 shows the technical specification of the new energy system considered [
51].
A photovoltaic system, characterized by a peak power of 130.6 kW
p, was implemented. Such a system was modeled in order to be placed on the roof of the storage volumes, thus keeping the common terraces available for the inhabitants of the building. The producibility of the photovoltaic system is 1439 kWh/kW/year [
52]. Assumptions on capital expenditure, operation and maintenance costs, and the lifetimes of the investigated new technologies are reported in
Table 4, as well as the related references.
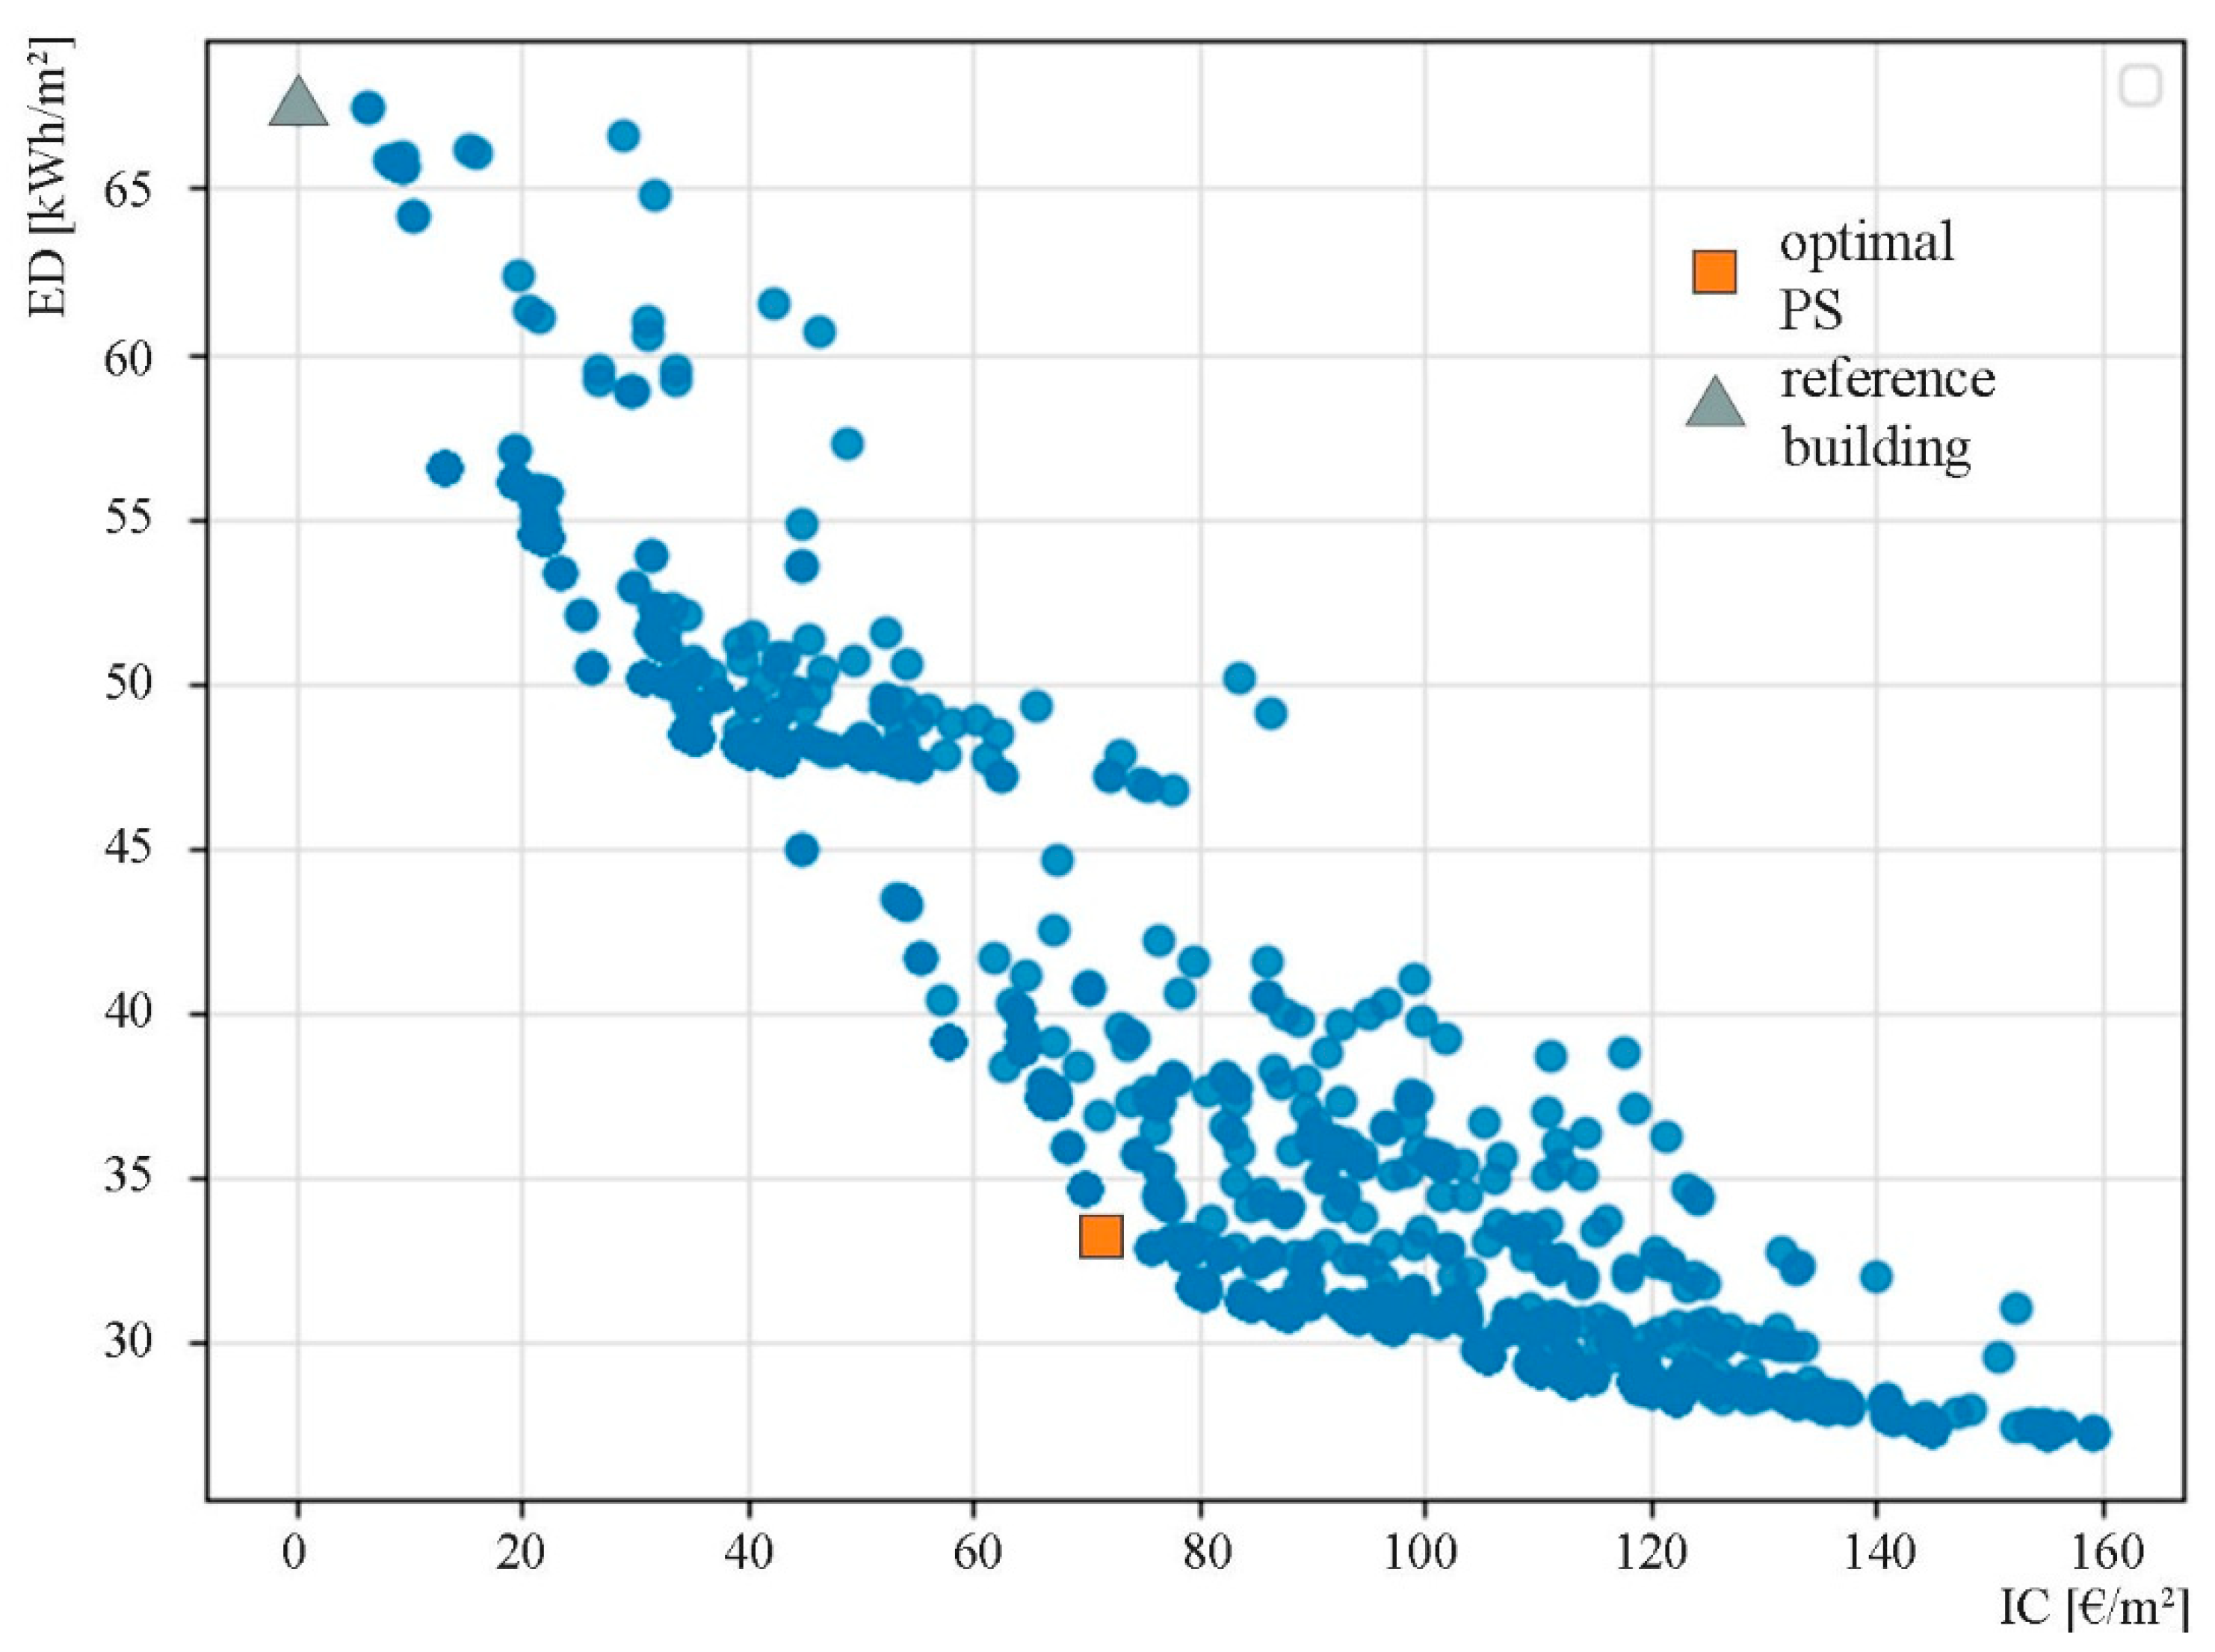
4. Results and Discussion
The results of the multi-objective optimization are shown in
Figure 5, where the two-dimensional space is illustrated, and the dots represent the simulated buildings.
Compared to the reference building, the optimal solution of passive strategies optimization (optimal PS) adds vertical insulation in the cavity of the external wall with expanded clay, replaces the windows with W0 windows, and closes the loggias with operable glazing. In such a way, all the vertical surfaces—which are the main external surfaces of the building, considering its high and thin linear shape—are implemented and the transmittance of these elements is greatly reduced.
Table 5 compares the transmittance of the implemented genes with the original one of the envelope of the reference building.
With these genes implemented, the optimal PS solution allows a reduction in the ED by 51%. In greater detail, the reduction of the ED for heating is 63% and for cooling, 14%. The IC is equal to 911.4 k€, of which 64% corresponds to the new window implementation, 18% to the thermal insulation with expanded clay in the external cavity walls, and 18% to the closing of the loggias with operable glazing.
Once the optimal combination of the passive strategies is found by the optimization process, we consider the active strategies, simulating the original and renovated heating and cooling systems by means of EnergyPLAN.
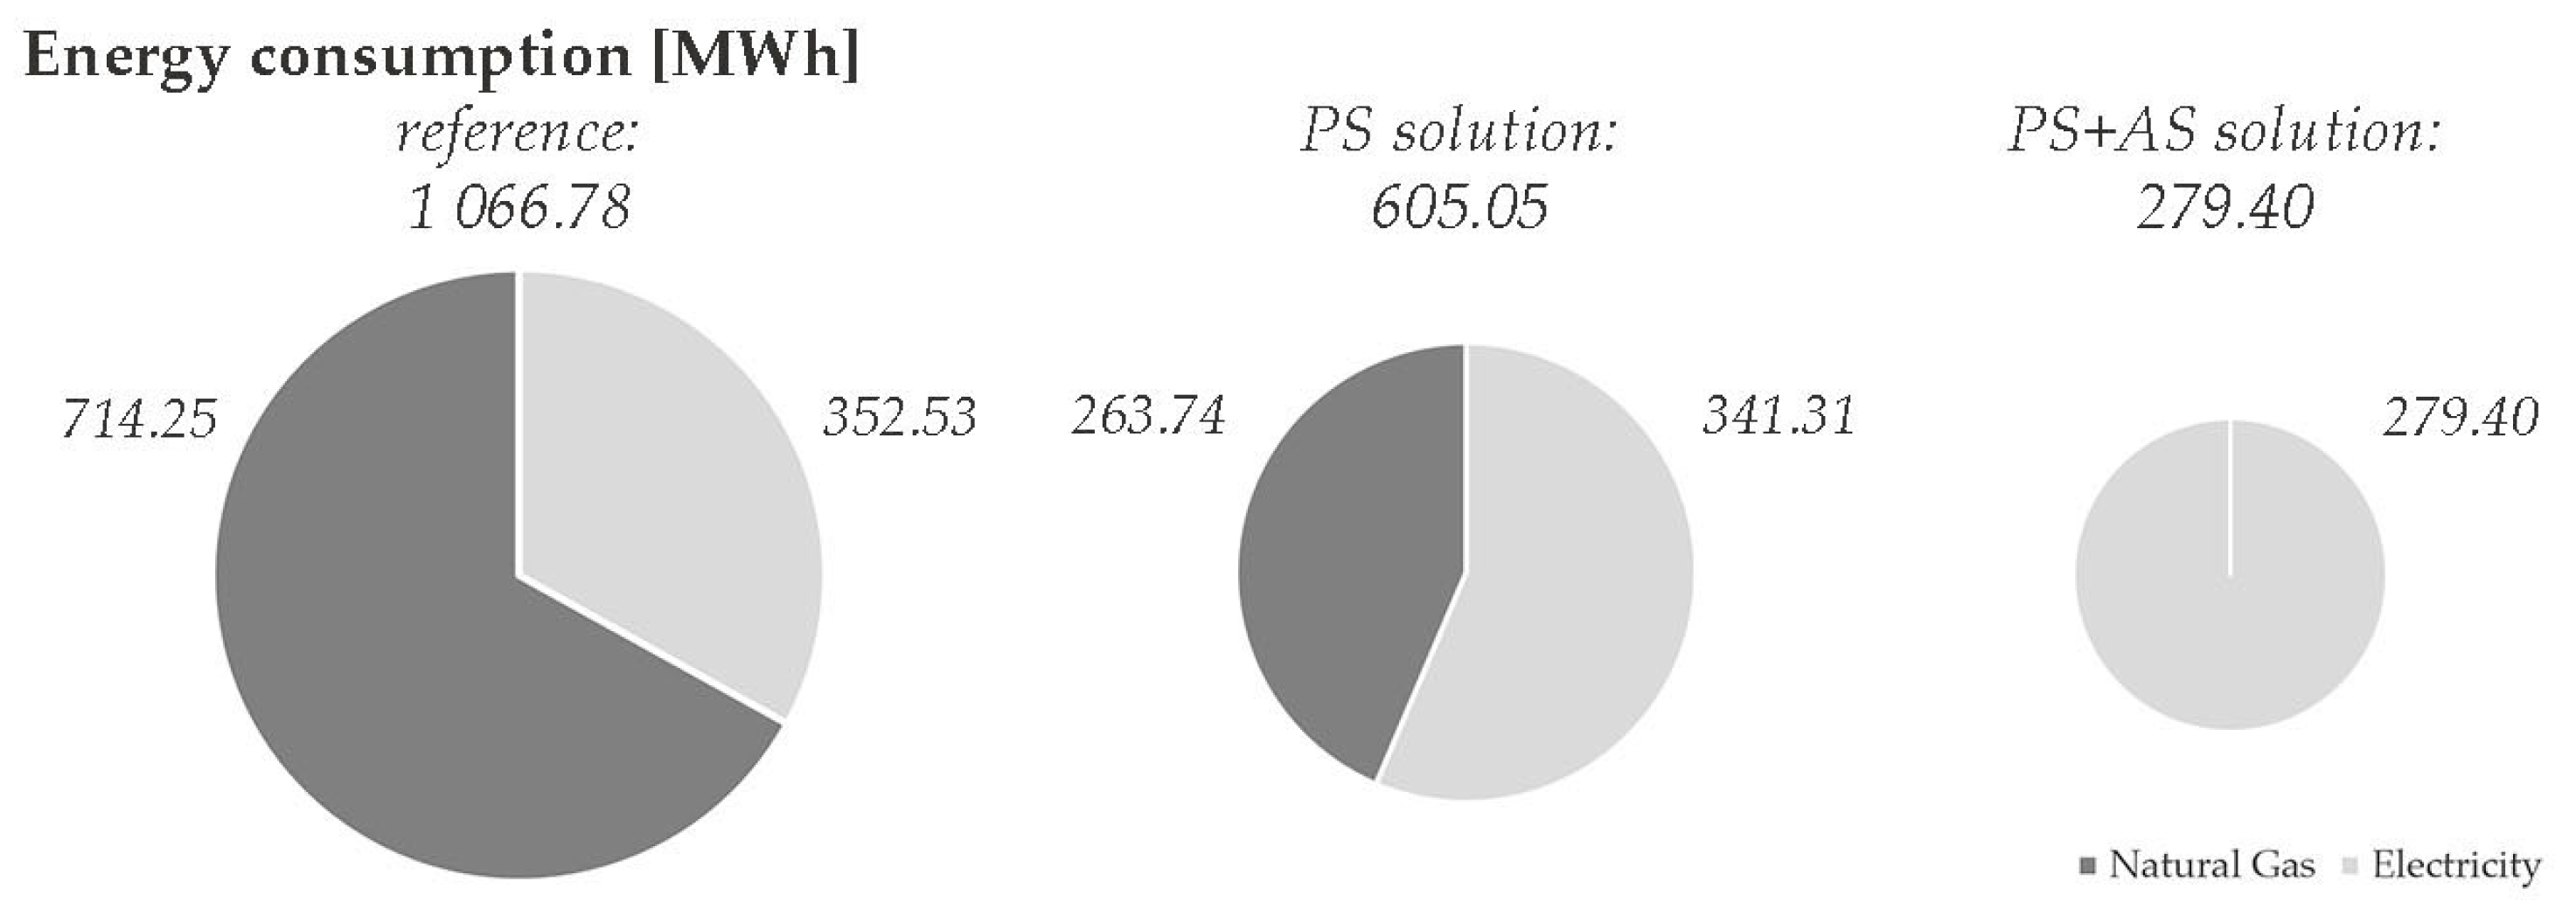
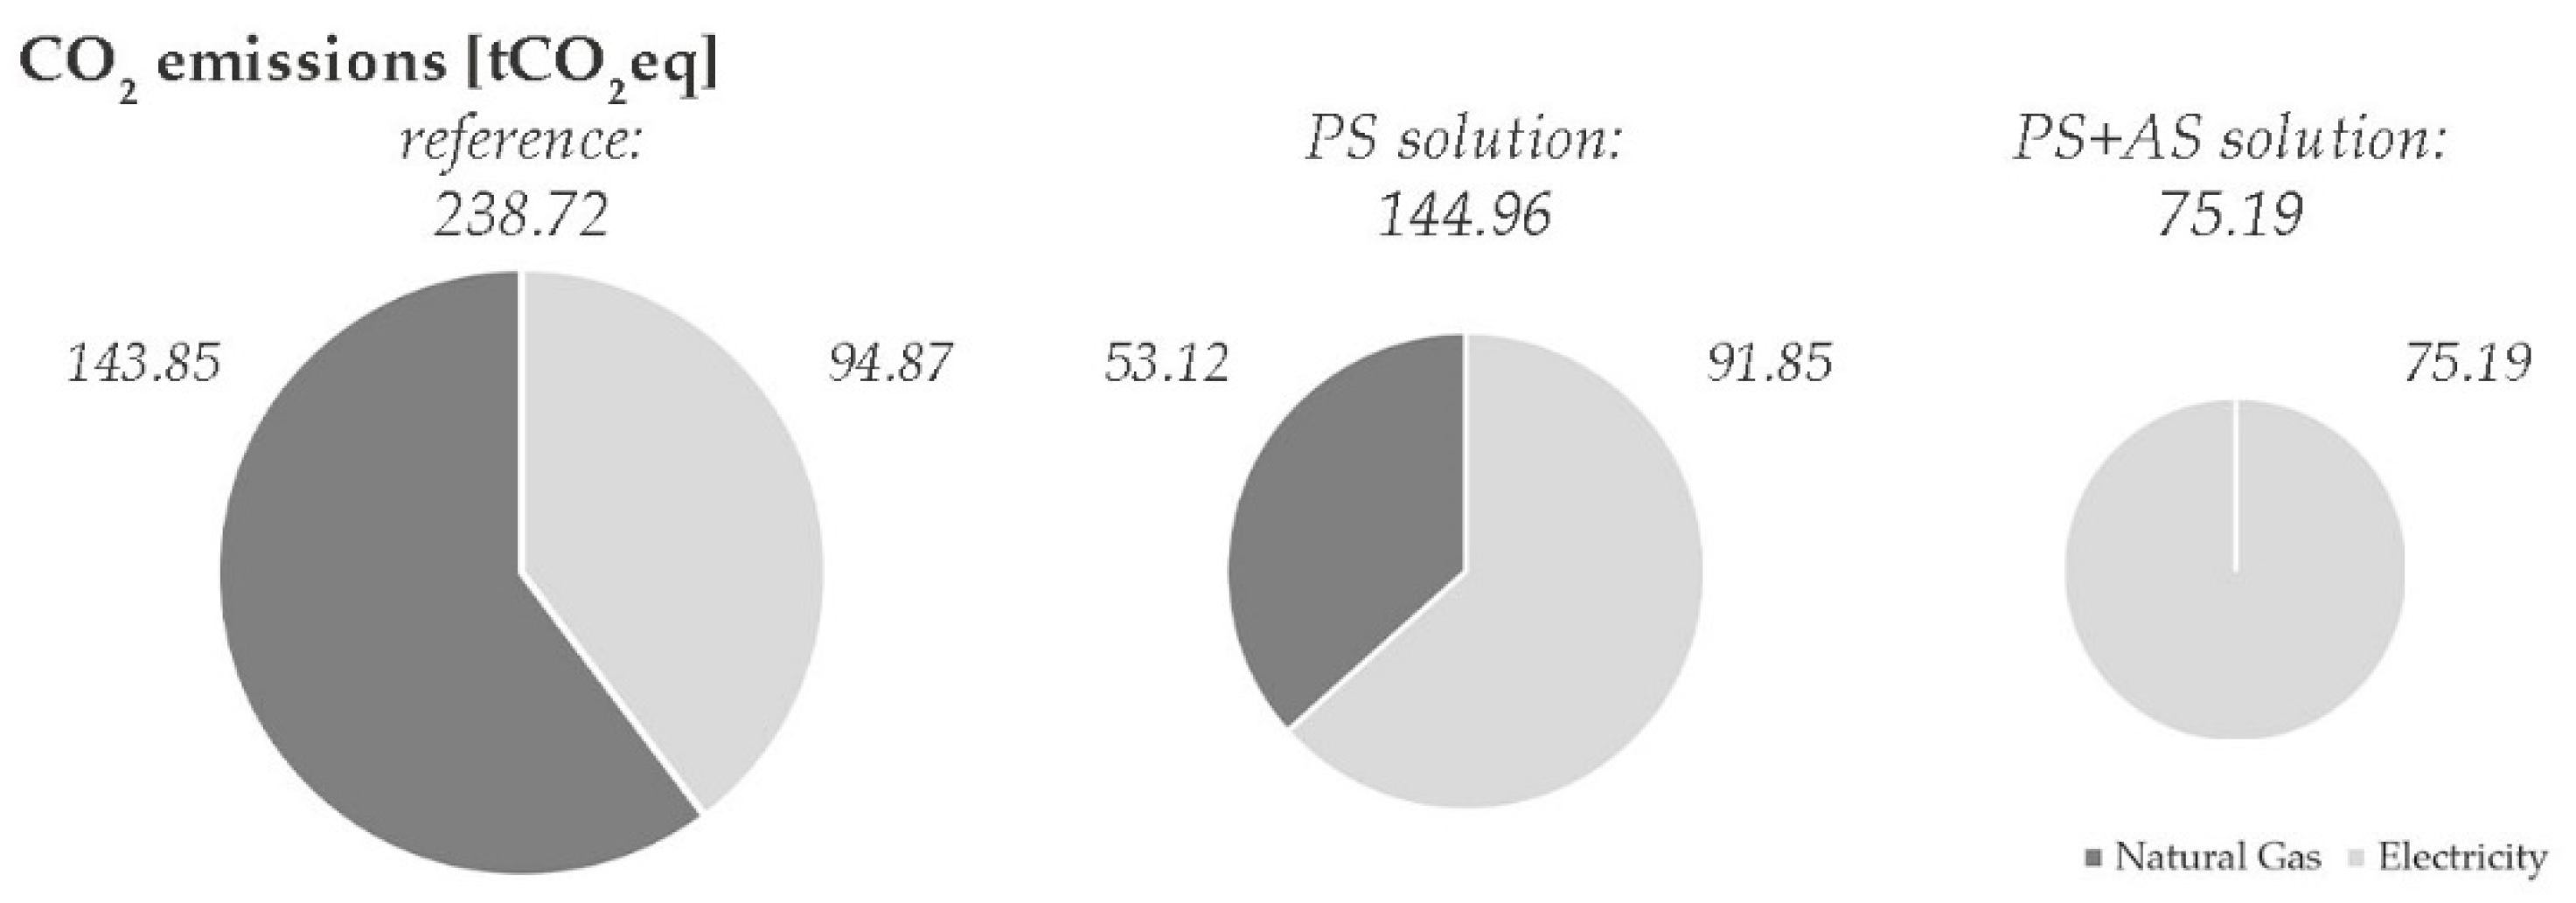
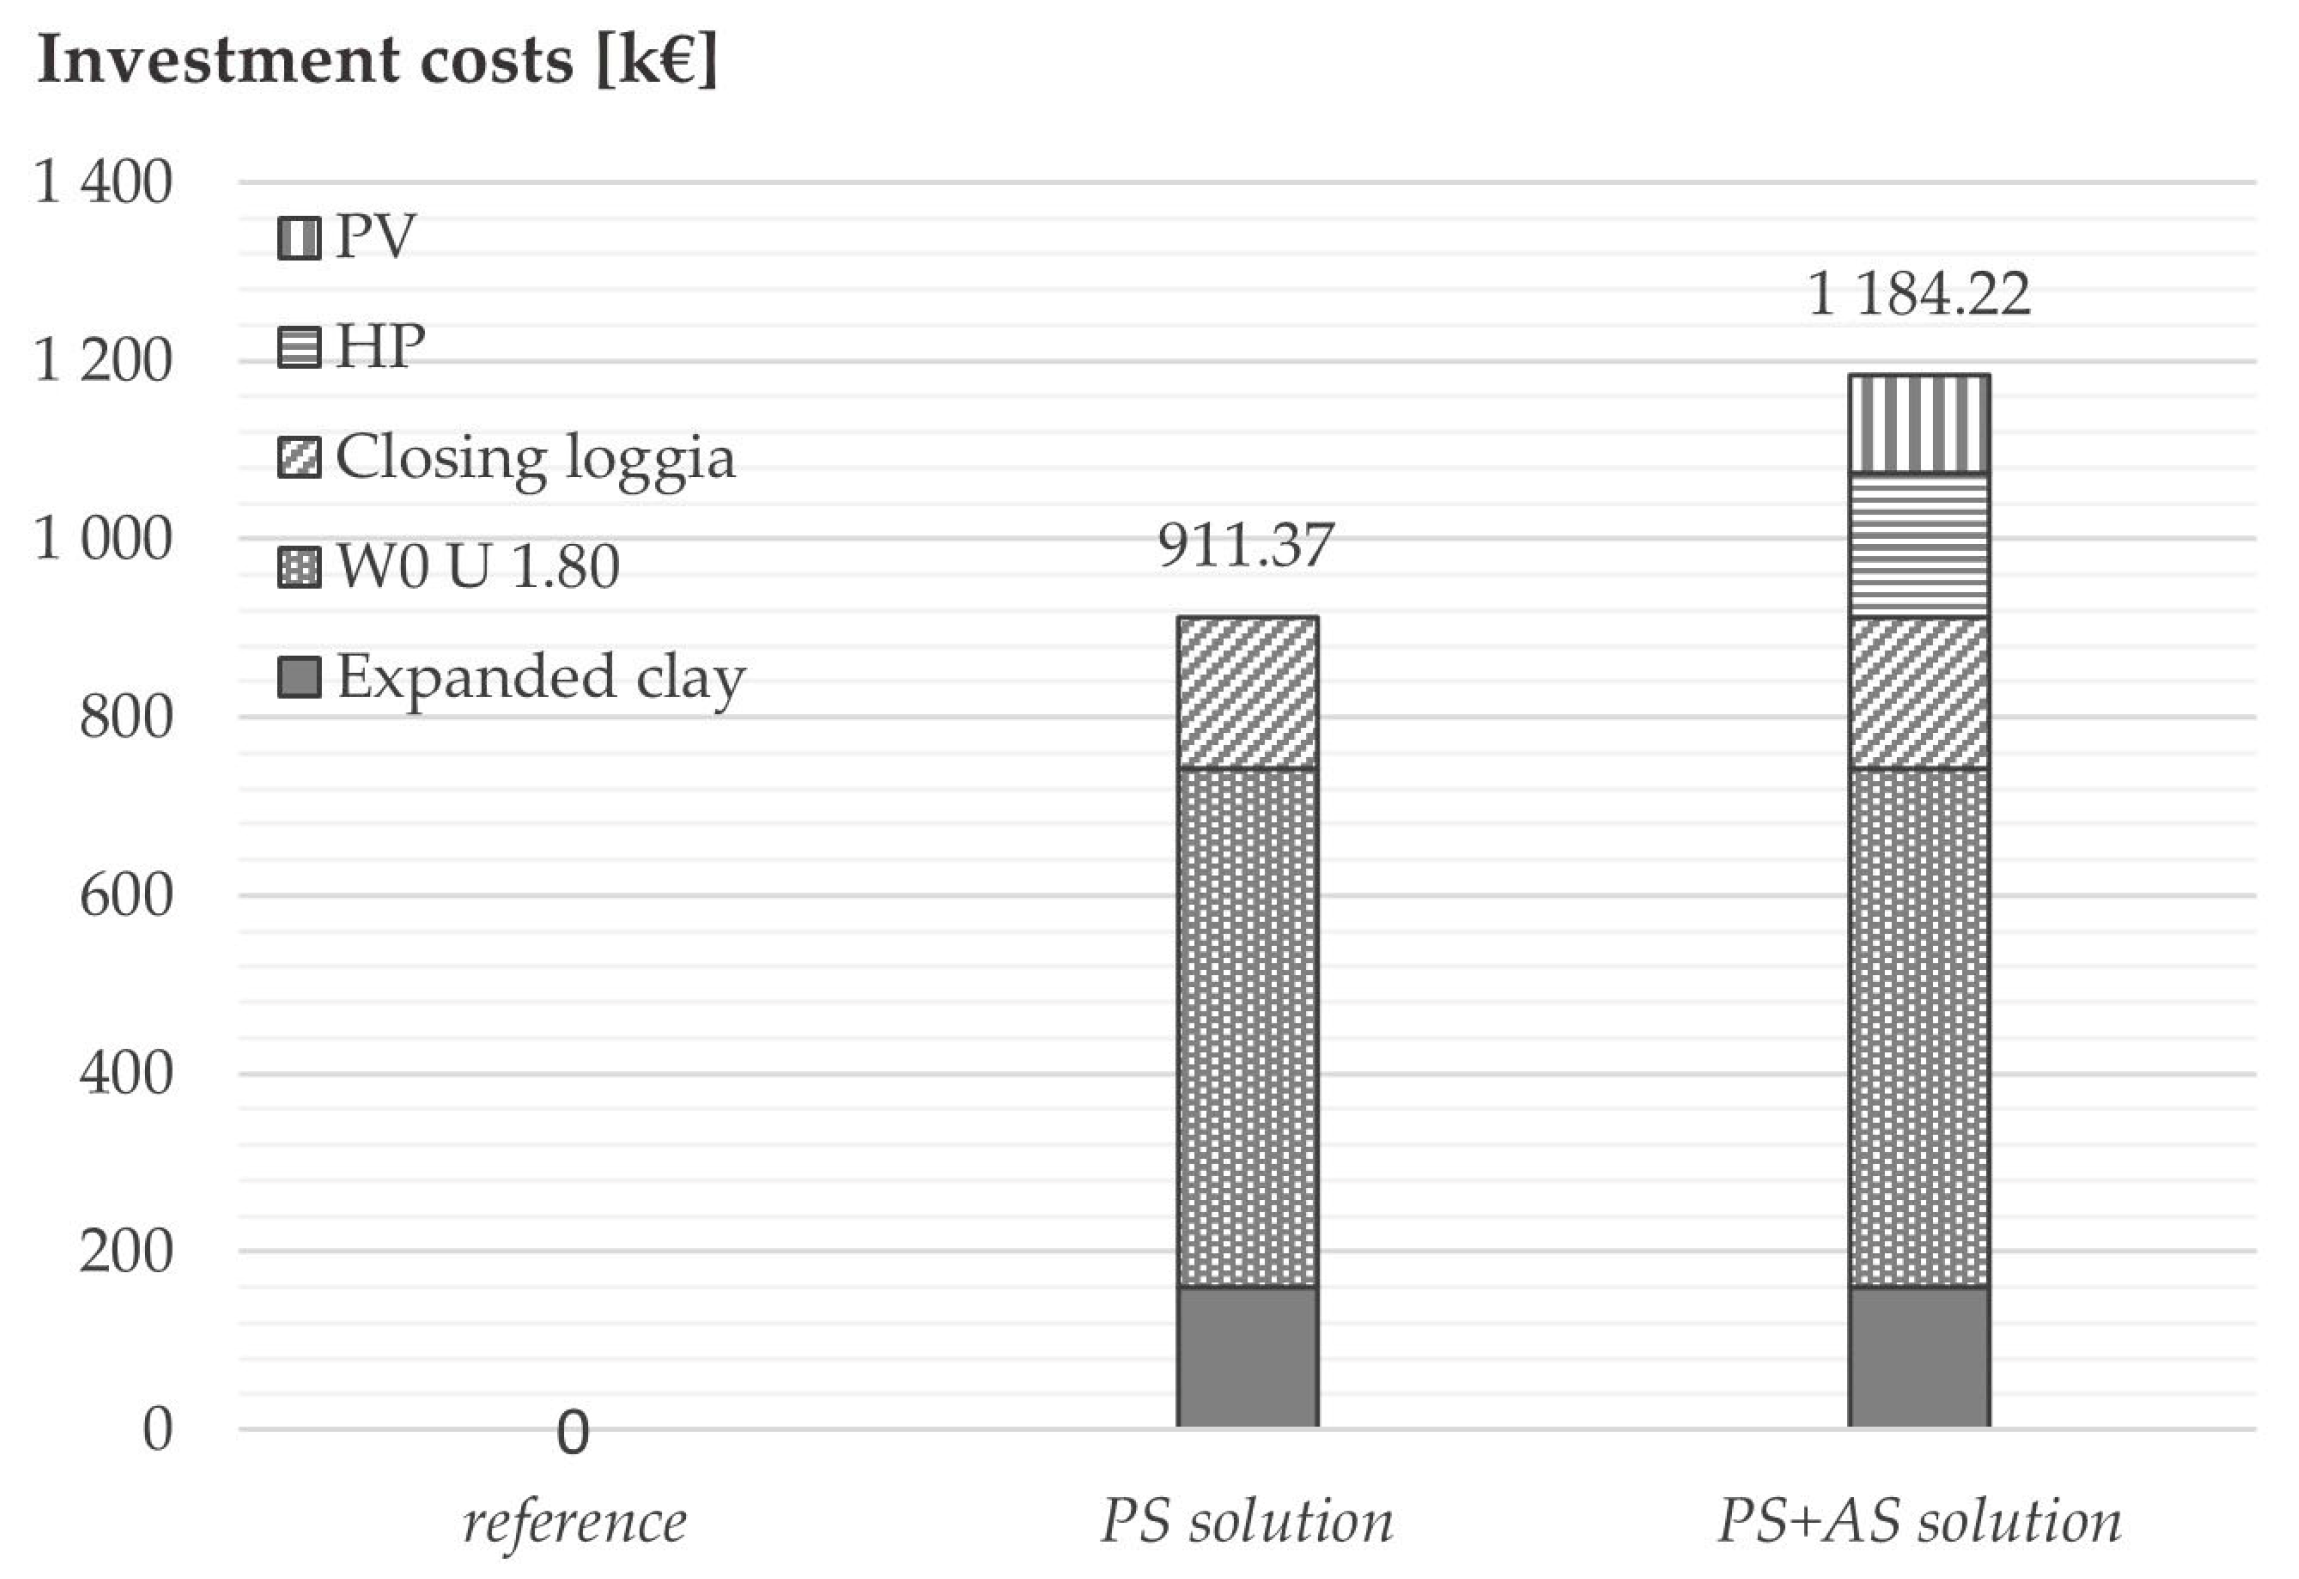
Figure 6,
Figure 7,
Figure 8 and
Figure 9 show the comparison between the reference building, the optimal PS solution, and the solution with the implementation of active strategies (PS+AS solution) with respect to the final energy consumption (
Figure 6), CO
2 emissions (
Figure 7), investment costs (
Figure 8), and energy costs (
Figure 9). In each figure, the reference building pie chart—the first on the left—is always considered as the reference for scaling the other pie charts of the PS solution and PS+AS solution, based on the percentage reduction for each objective. The energy consumption is determined by the sum of EnergyPlus and EnergyPLAN hourly outputs; the CO
2 emissions are the emissions caused by the building energy consumption during a year, and they are evaluated based on emission factors in the Italian energy and power sector [
55]; the investment costs are the costs of materials and their application for each retrofit strategy implemented on the building, and they are evaluated based on a regional price list [
39]; the energy costs are the costs of the energy consumed by the building during a year, and they are evaluated in accordance with national energy price statistics available for 2019 and 2022 [
56].
As we can see from
Figure 6, the optimal PS solution allows a 43% reduction in the total energy consumption and, in particular, a 63% reduction of natural gas for heating. However, with a further investment cost of 273,000 €, the PS+AS solution can bring to the total electrification a further 18% reduction in the electricity need compared to the optimal PS solution, corresponding to a reduction in the total energy consumption of 73% with respect to the reference scenario.
Moreover, the total CO
2 emissions are reduced by 39% with the PS solution and 69% with the PS+AS solution compared to the reference building (
Figure 7). Therefore, the PS+AS solution is on the path to furthering decarbonization, and towards the goal of an all-electric building powered by solar or other zero-carbon and renewable sources.
With respect to the investment costs in the PS+AS solution, almost half of the costs are related to the new windows implementation (49%), and the thermal insulation, the loggia’s glazing closing system, and the heat pumps each represent 14% of the total investment, and the photovoltaic panels 9% (
Figure 8).
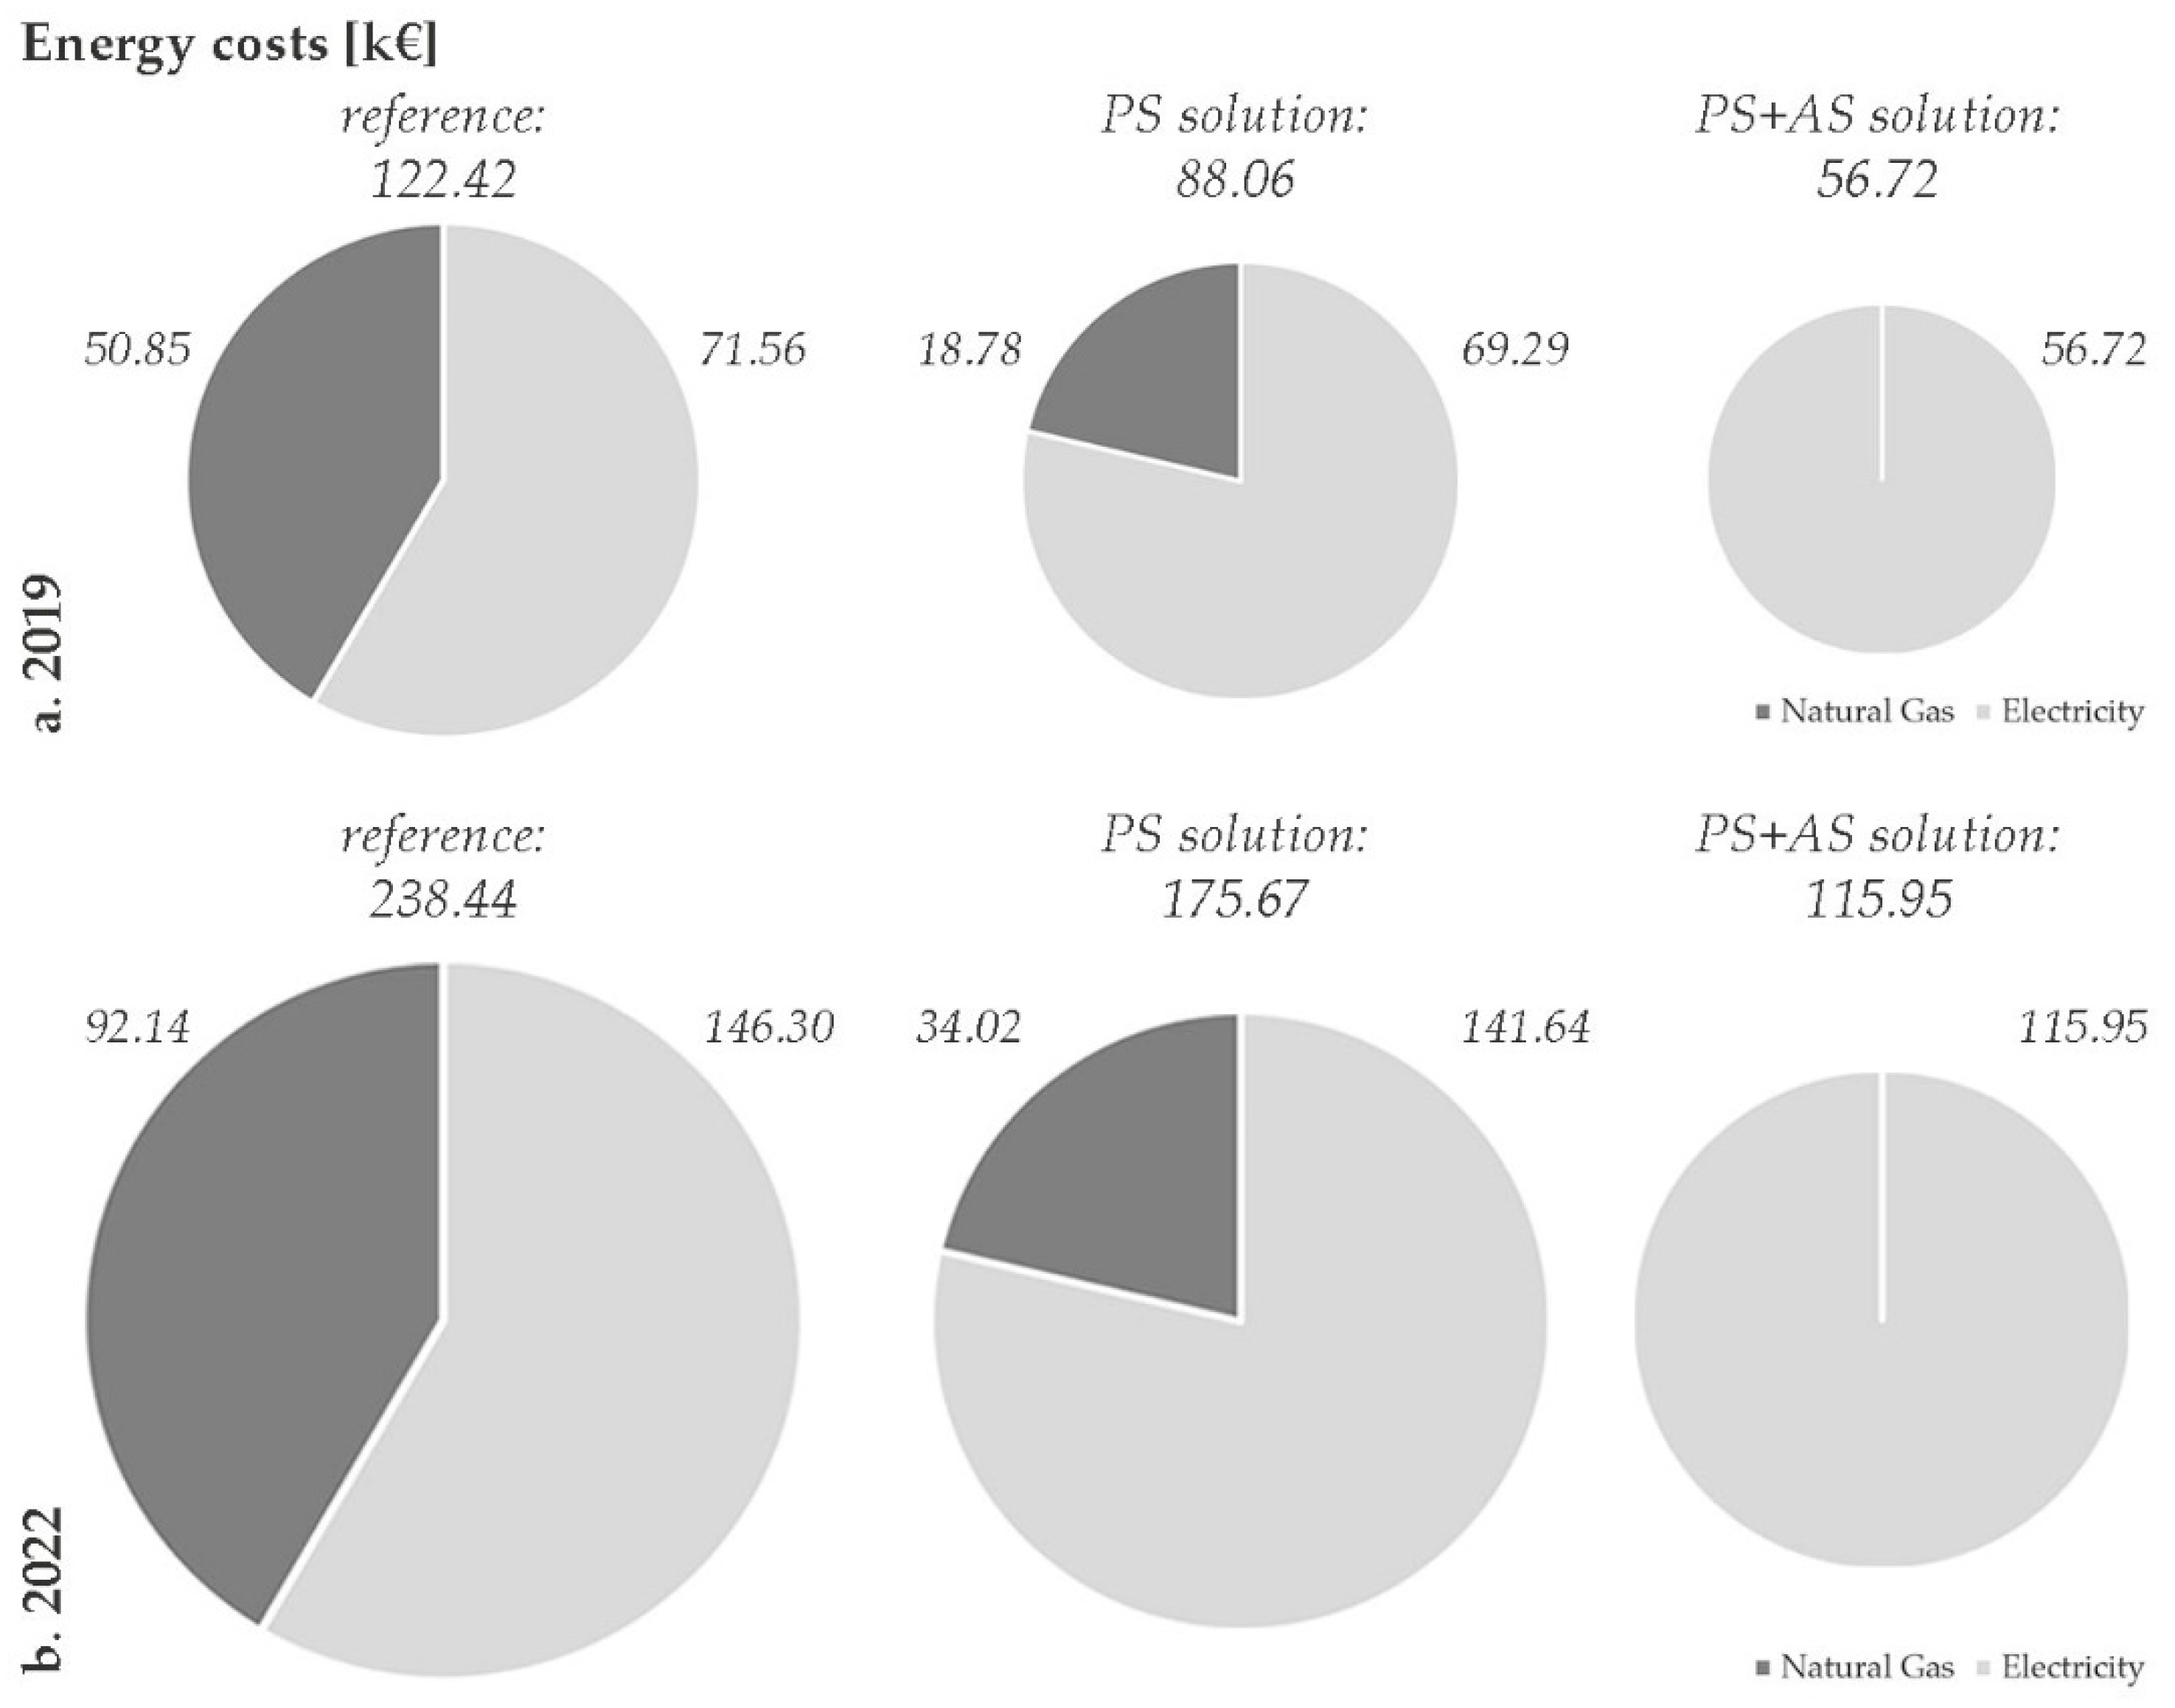
As shown in
Figure 9, the total energy costs (electricity and natural gas costs) are reduced by 26% with the optimal PS solution and by 51% with the PS+AS solution compared to the reference building energy costs. Moreover, we considered the increase in energy prices from 2019 (when the study was conducted) (
Figure 9a) to the most recent prices available for 2022 (
Figure 9b). Indeed, over the past year, geopolitical instabilities have caused the price of gas in Europe to rise sharply. As a consequence, final prices for residential users increased, representing a significant weight in household expenditure. This can exacerbate the existing fuel poverty conditions that can be found when analyzing social housing buildings and further increase the number of families affected by this phenomenon. For these reasons, the analysis of energy expenditure for heating and cooling needs was also carried out by imposing the recent energy carrier prices for end users. According to [
56], the cost of energy and transport charges in Italy increased to 405 €/MWh and 97 €/MWh for electricity and gas, respectively. In
Figure 9, the economic analysis is carried out for the two different energy price scenarios, considering the pie chart area of the reference solution for 2019 energy prices as the reference for scaling the other pie charts.
Rising prices strongly affect the energy expenditure of all building configurations. Nevertheless, the renovated building after the proposed interventions allows a significant reduction in annual energy costs. In such a way, building renovations represent a means of mitigating the effects of rising energy carrier prices. Indeed, the PS+AS solution brings a 51% energy costs reduction, thus mitigating the consequences of fuel poverty conditions. Moreover, the implementation of renewable energy sources allows the community to not be affected by price increases. Thus, the goal is to further reduce fossil fuel consumption and increase the share of energy generation by renewable sources, linked to passive strategies implementation on building envelopes.
5. Conclusions
In recent years, thanks to an intensive awareness-raising process, civil society has understood the importance of decreasing the global impact of anthropogenic actions on the exploitation of energy resources from fossil fuels. The main reason is not due to the fear of their excessive depletion over time, which would limit their stocks in the future, but to implement more environmentally conscious behavior, which is necessary to mitigate ongoing climate change. In fact, it is unlikely that, although noble, care for environmental protection is the sole motivation to push for the renovation of the building stock of our cities to decrease energy consumption. Indeed, for achieving overall sustainability, environmental, social, and also economic aspects should be taken into consideration. It is necessary to ensure that the most economically vulnerable parts of the population receive enough attention regarding their energy needs. Indeed, modern society has needs that go beyond the need for food and water. For low-income families, it is necessary to equate the right to access renewable energy sources (in any case, with the aim of guaranteeing adequate standards of indoor conditions and, therefore, the health of the inhabitants) with the right to access primary and inalienable resources such as water and food. Thus, social housing should be considered among the first public buildings to be afforded the possibility of reducing their energy consumption and the ability to use mainly free energy sources such as solar energy for environmental, social, and economic sustainability. Moreover, in order to consider a building renovation that presents realistic outcomes, due to the economic aspect, there is a need to minimize energy demand and, at the same time, the costs of the installation of retrofit strategies.
For all these reasons, this research conducted a multi-objective energy retrofit optimization taking into consideration energy and economic aspects simultaneously for the optimization of building retrofit strategies. The workflow is applied and verified on an existing social housing located in Rome, which constitutes a relevant case study, but the method is applicable to different contexts and generalizable. Based on the analysis of the current status of the case study building, architecturally compatible strategies are taken into account as genes of the optimization process. The results of this multi-objective optimization are a set of optimal solutions, among which the designer can choose the fittest one for the specific design problem. Therefore, the proposed approach can greatly support the decision-making process of retrofit design by exploring and simulating a wide space of solutions. This is possible by means of the genetic algorithm that reduced the energy simulations required from 82,944 to 2000 total simulations.
In this work, the optimal combination of passive strategies solutions is chosen among the Pareto frontier as the solution that simultaneously minimizes all the objective functions, i.e., energy demand and investment costs. The results demonstrate that high energy demand reductions (around 50%) can be achieved using this approach. The output of the optimization is then used as an input for the simulation of the heating and cooling system renovation by means of reversible heat pumps combined with photovoltaic panels, which is instead related to active strategies. The implementation of this scenario can greatly reduce CO2 emissions (−69%) and energy costs (−51%). The passive and active strategies solution can be an answer to increasing fuel poverty and to the urgent need for the decarbonization of our building stock.
However, it should be noted that recent research studies have shown that the energy consumption of a building, especially a social housing building, is significantly related to the occupancy profiles and the presence of several unoccupied apartments. Therefore, future research should address occupancy uncertainty as well.
The proposed method is set to be applied to different design problems and could support the activities of professionals and policymakers regarding retrofit actions to be undertaken on social housing to address the energy efficiencies of buildings, to improve the comfort and health of vulnerable people, and to mitigate fuel poverty conditions of low-income families.


 ,
, 


