3.1. Analysis of the Weather Types and Their Effects on City Thermal Behaviour
Table 3 shows the number of CWTs per year during the 2002–2015 period.
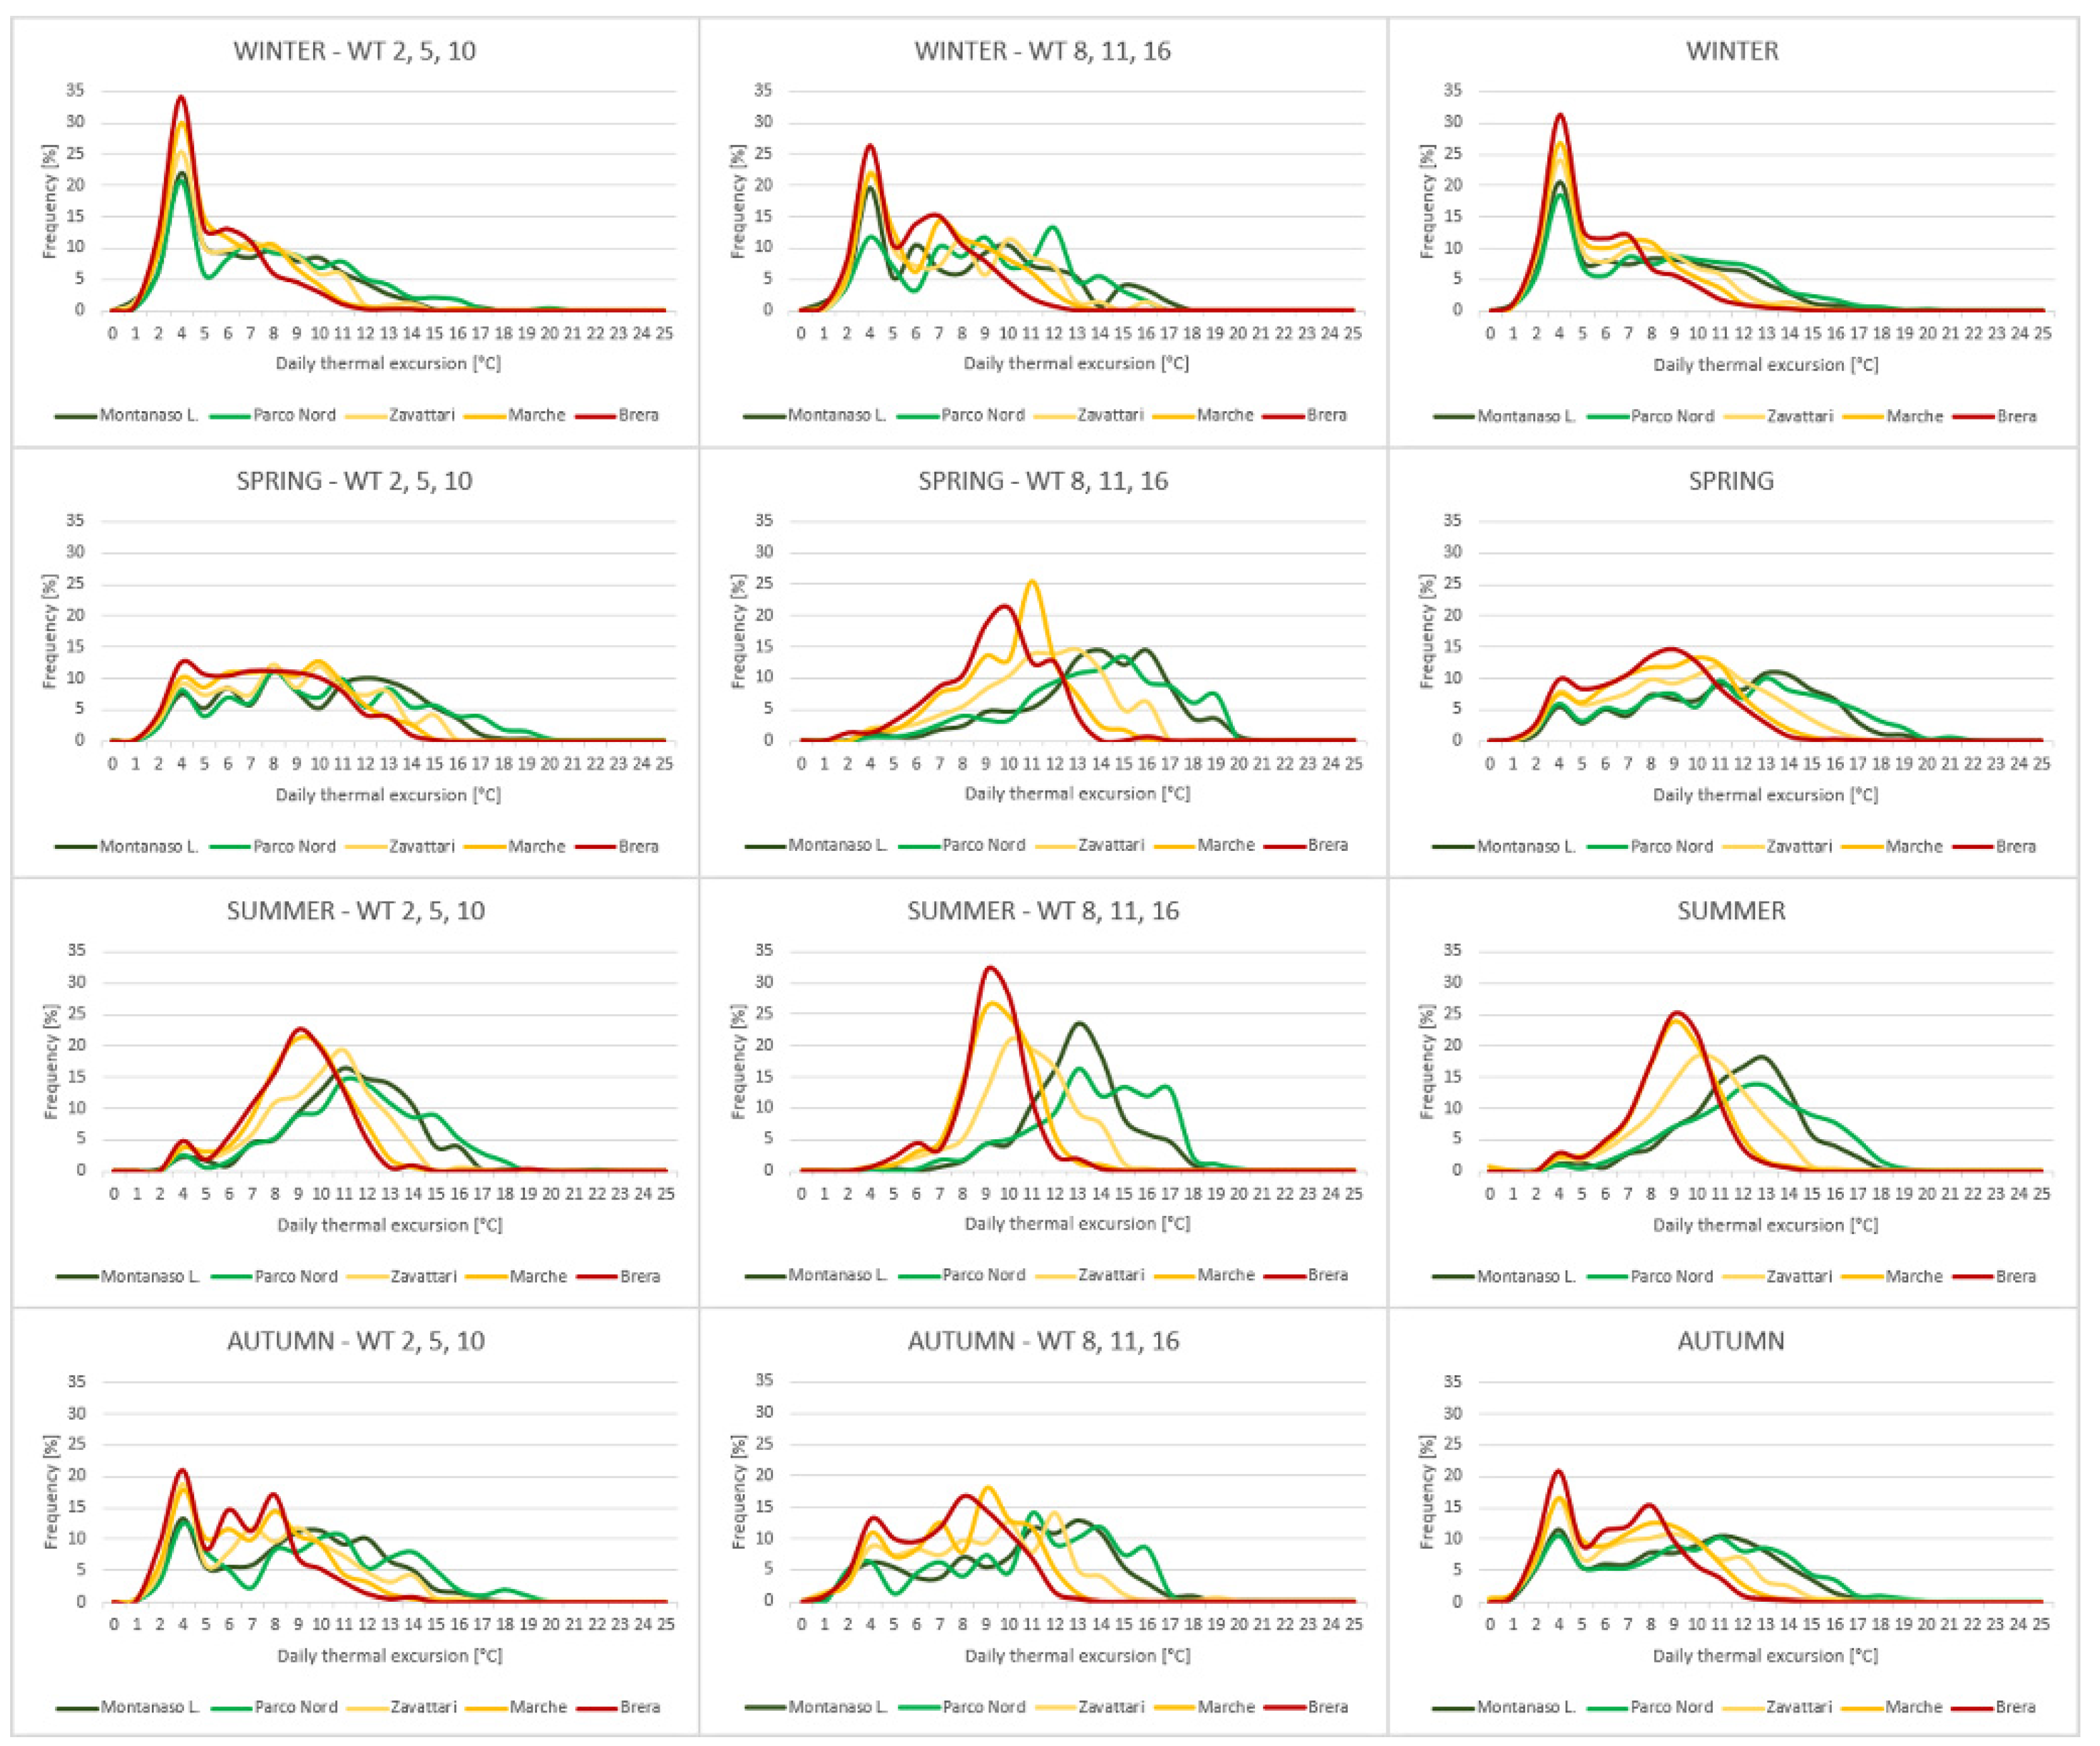
Figure 3 shows the distribution of the seasonal daily thermal range (DTR) for the five weather stations. Figures on the left there are the distributions related to cyclonic CWTs 2, 5 and 10, whereas those on the right are the distributions related to anticyclonic CWTs 8, 11 and 16.
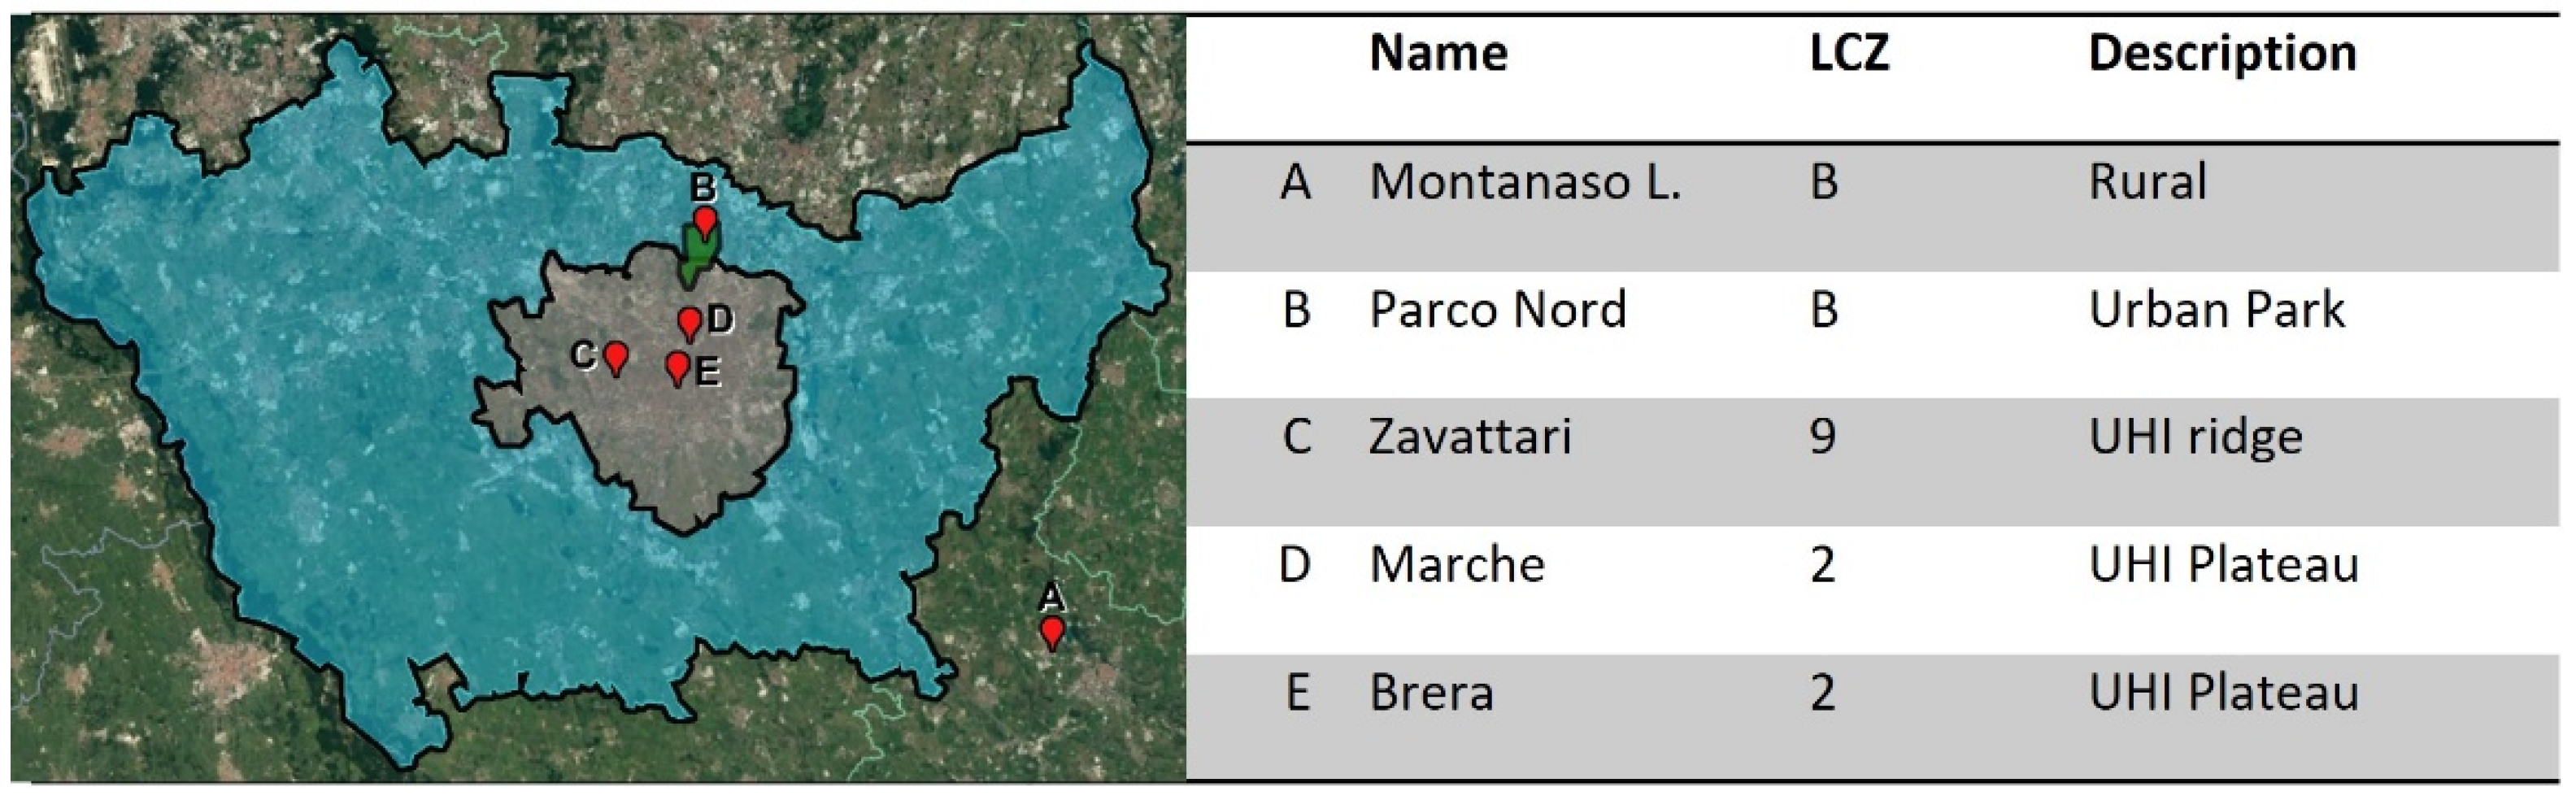
Table 3 shows the number of samples used (2002–2015). Based on visual analysis, in all four seasons, it is possible to clearly distinguish the behaviour of the two LCZ2 stations (Milan Brera and Milan Marche) compared to the LCZB stations (Parco Nord Milano and Montanaso Lombardo), whereas the LCZ9 station (Milan Zavattari) exhibits intermediate behaviour. The Parco Nord Milano station exhibits behaviour very similar to that of the rural station in Montanaso Lombardo; the differences between these two stations can be attributed to the exchange of air in the Parco Nord Milano area with the surrounding urban areas (breeze effects).
Anticyclonic CWTs show the effects of different LCZs more clearly than those of cyclonic CWTs, with noise resulting from the following factors:
Enhanced cloud coverage for cyclonic CWTs with damping of the long-wave emission and diurnal radiative force;
Anticyclonic days are affected by breezes, whereas during cyclonic CWTs, breezes are substituted by synoptic circulation.
The summer season shows the most relevant difference between the LCZs in terms of DTR behaviour, which can be accounted for by the increased solar radiative force enhancing all the terms of the surface energy balance.
Figure 3 highlights the peculiarities of the urban environment compared to the rural environment in terms of the frequencies of the various DTR values. In particular, whereas the rural area has higher DTR frequency peaks in the case of anticyclonic types 8, 11 and 16 with respect to the city, the weather types do not affect the peak, which is located at 9–10 °C for the summer and at 4 °C for the winter. This shows an overall stabilizing effect of the city, giving rise to an “urban signature” peculiar to specific cities linked to the shape of the urban LCZs and deriving cooling by radiation, as well as by mechanical and thermal mixing.
In terms of weather types, among a total number 12,190 DTR measurements from the five weather stations, 4460 measurements fell under cyclonic conditions and 7730 under anticyclonic conditions. In terms of LCZs, the series accounted for 4876 measurements for LCZB (Parco Nord and Montanaso L.), 2348 for LCZ9 (Zavattari) and 4876 for LCZ2 (Marche and Brera). In terms of seasons, the measurements were divided as follows: 2660 in winter, 2810 in spring, 3435 in summer and 3825 in autumn.
For statistical analysis, data were gathered considering:
LCZ (2, 9 or B);
Season (winter, spring, summer or autumn); and
CWT group (cyclonic or anticyclonic)
Statistical analysis of all the measurements by means of a mixed-model ANOVA showed a significant triple interaction among seasons, LCZs and CWT regimes. The results of the Sidak post hoc test for mean comparison are shown in
Table 4,
Table 5 and
Table 6.
DTR values significantly differ from season to season (
Table 4), independent of LCZ type during anticyclonic types. A similar behaviour is observed during cyclonic types, with the exception of spring and summer, which do not show significant differences.
Considering the CWT groups (
Table 4), significant differences are shown in autumn by LCZ 9 and B; in spring by LCZ 2, 9 and B; in summer by LCZ B; and in winter by LCZ 9. Finally, focusing on LCZs, during anticyclonic CWTs, in spring and summer, a transition occurs from LCZ B to 9 to 2.
Under cyclonic CWTs, for all the LCZs, the DTR significantly differs across the four seasons. During the summer, cyclonic CWTs are associated with convective cloudiness, which develops in the presence of higher DTRs than those that occur in spring and autumn, when cloudiness is more often of a stratified type and, resulting in lower DTRs. The poor winter radiative force accounts for the lower DTR compared to the other seasons.
Under anticyclonic CWTs, spring and summer are homogeneous with each other in terms of DTR but differ significantly compared to autumn and winter. We do not have an explanation for this phenomenon that is observed in the data.
Table 5 shows that in the LCZB environments, the cyclonic CWTs fully perform their action on the surface energy balance in all seasons, giving rise to significant differences in DTRs compared to anticyclonic CWTs. On the contrary, the zone with the highest UHI (LCZ2) shows a non-significant difference in terms of DTR between cyclonic and anticyclonic types in winter, summer and autumn, which is observed for LCZ9 for the summer only. These phenomena can be attributed to the stabilizing effect induced by the UHI with respect to the perturbations of the surface energy balance determined by cyclonic CWTs.
A comparison among LCZs (
Table 6) shows that the only seasons in which LCZs significantly affect the DTR are spring and summer under anticyclonic conditions, when the high solar force during the day is counterbalanced by night-time cooling and enhanced by the increased sky view factor in LCZB.
The influence of CVTs on ground weather conditions in urban areas highlighted in this work was also observed by Guo et al. [
27], who analysed the modulation of DTR by various synoptic weather patterns in the Yangtze River Delta region (YRDUA) in eastern China, showing the effects on subareas within the studied region.
The effect of CVT on UHI is obviously modulated by the peculiarities of the climate of the studied area, in terms of types of weather, latitude (radiative forcing) and distribution of cloud cover and rain (linked to the types of weather). From this point of view, it is fundamental to remember the peculiar characteristics of the Po Valley area located downstream of the Alpine chain, with an average height of 3000 m a.s.l. This makes the boundary layer particularly stable during anticyclonic phases, allowing, for example, the accumulation of large amounts of moisture in the air mass, which are conducive to triggering summer thunderstorms.
3.2. Transects
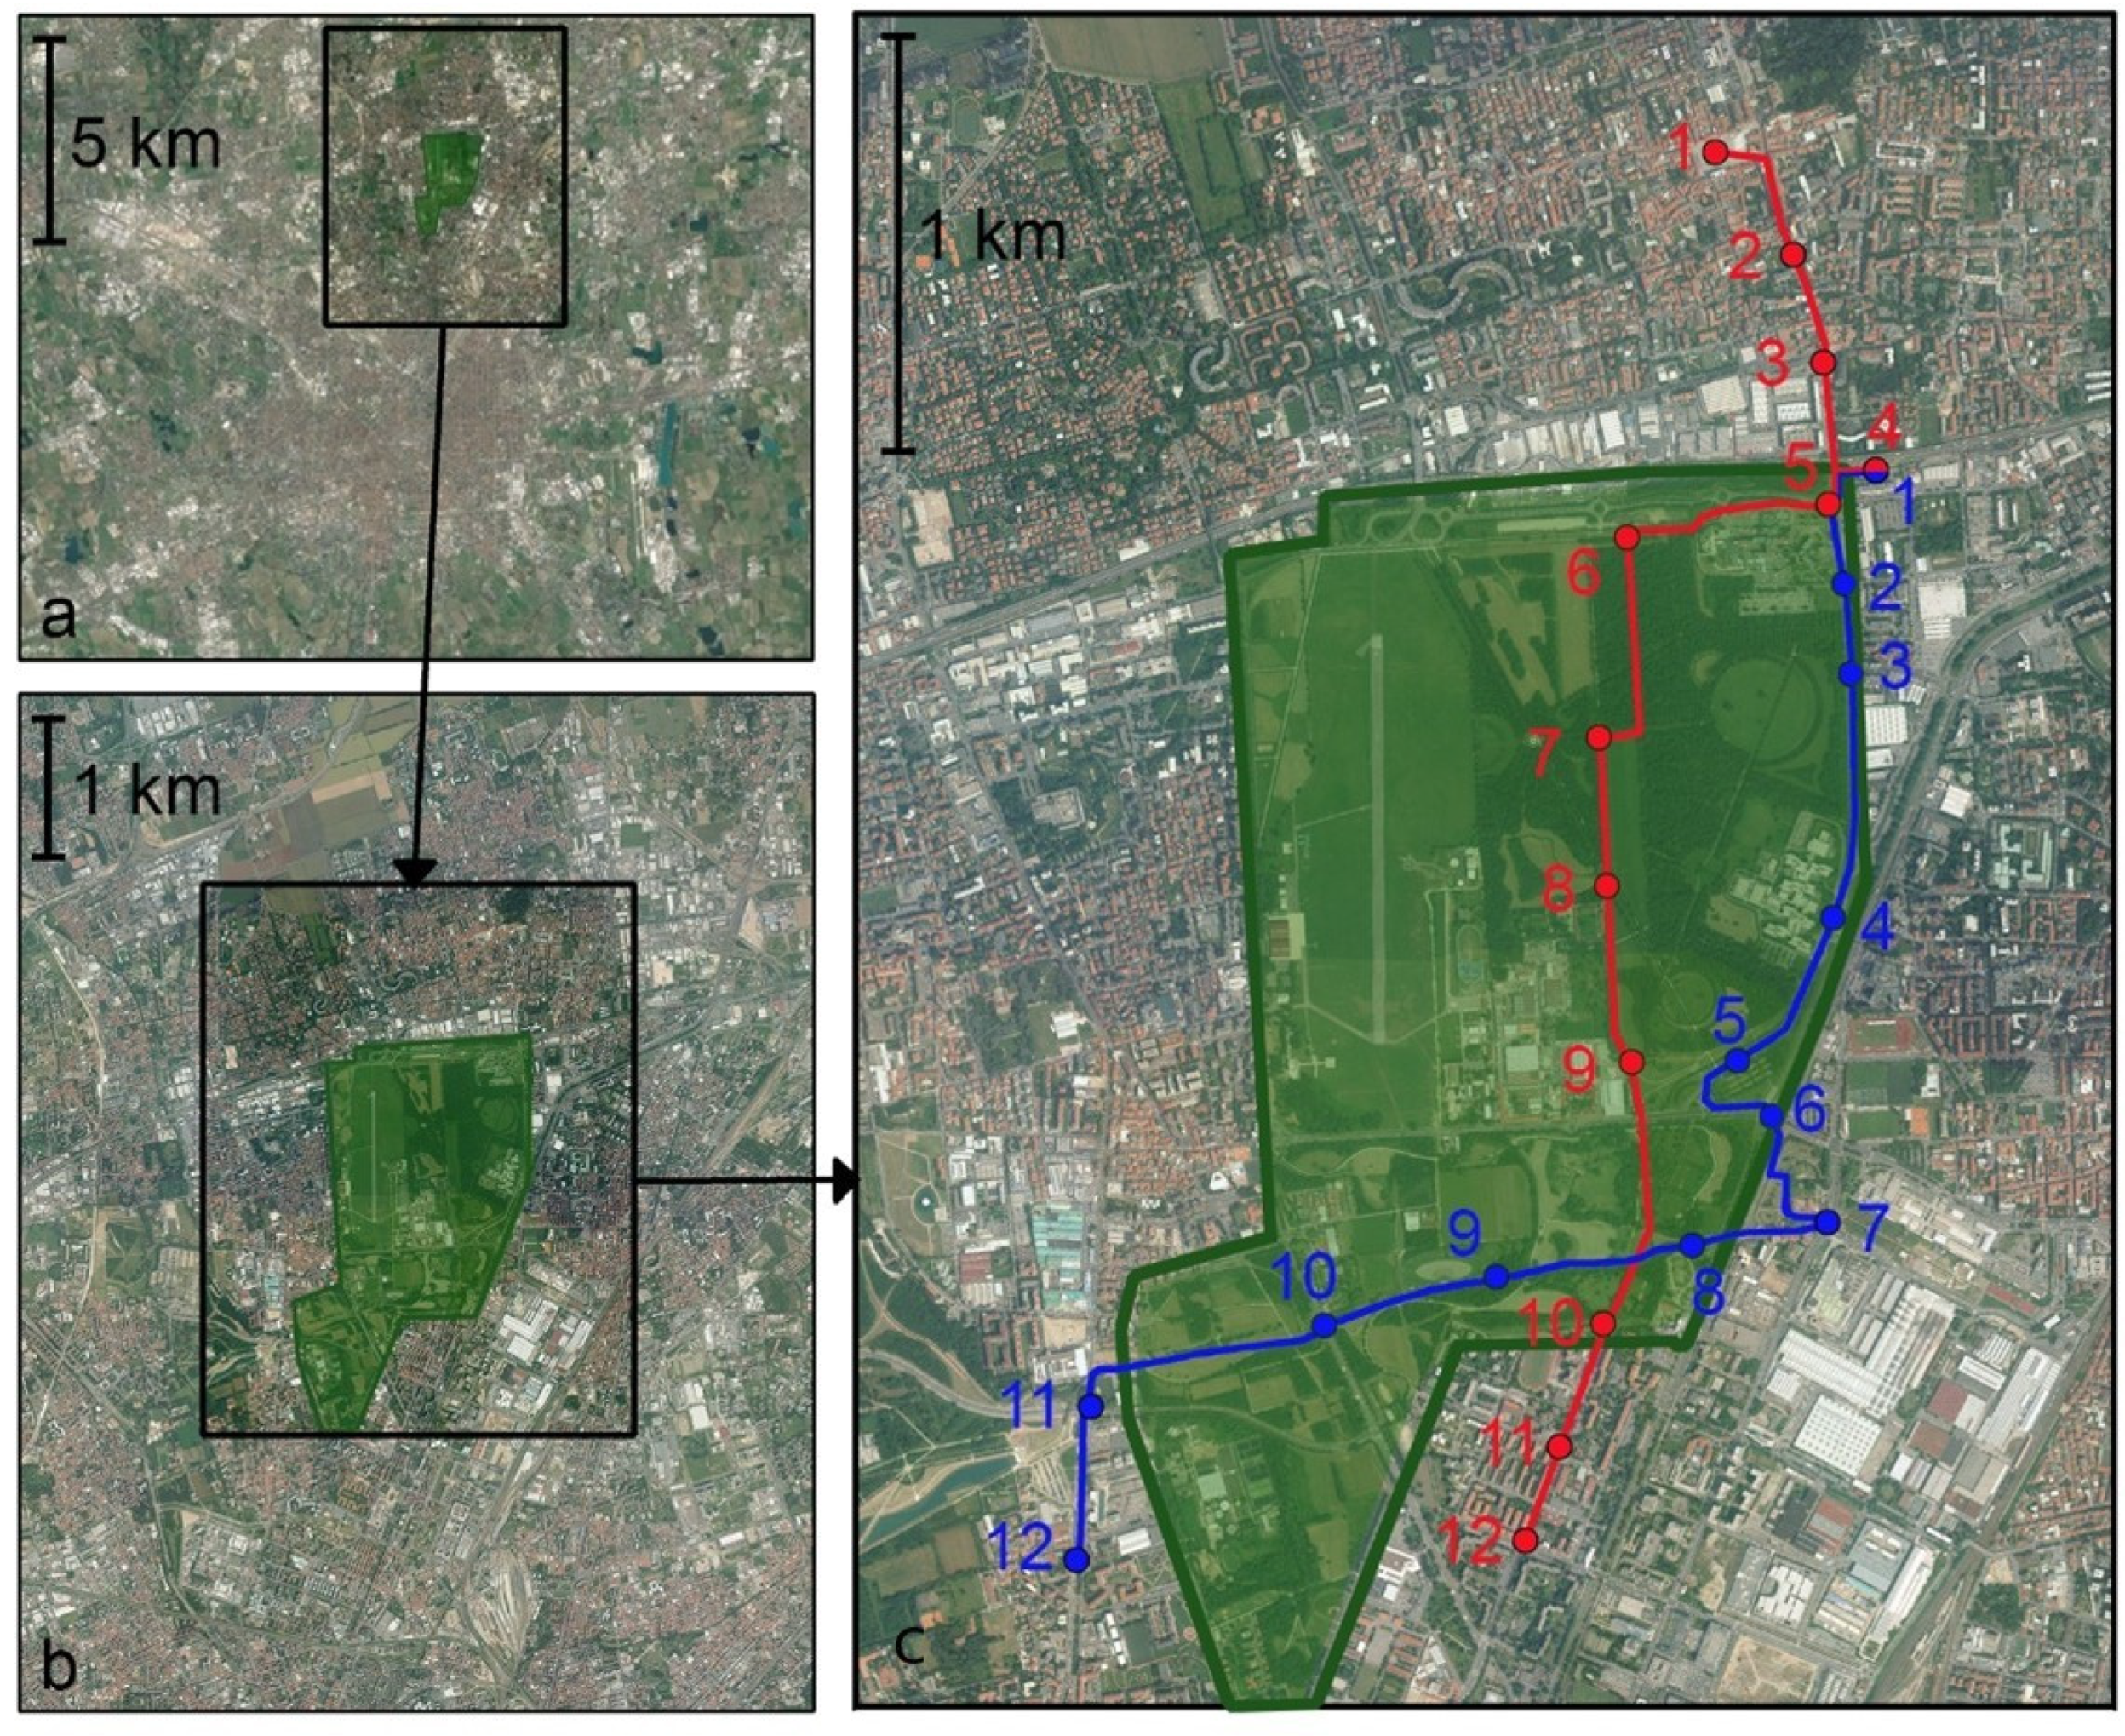
Figure 4 and
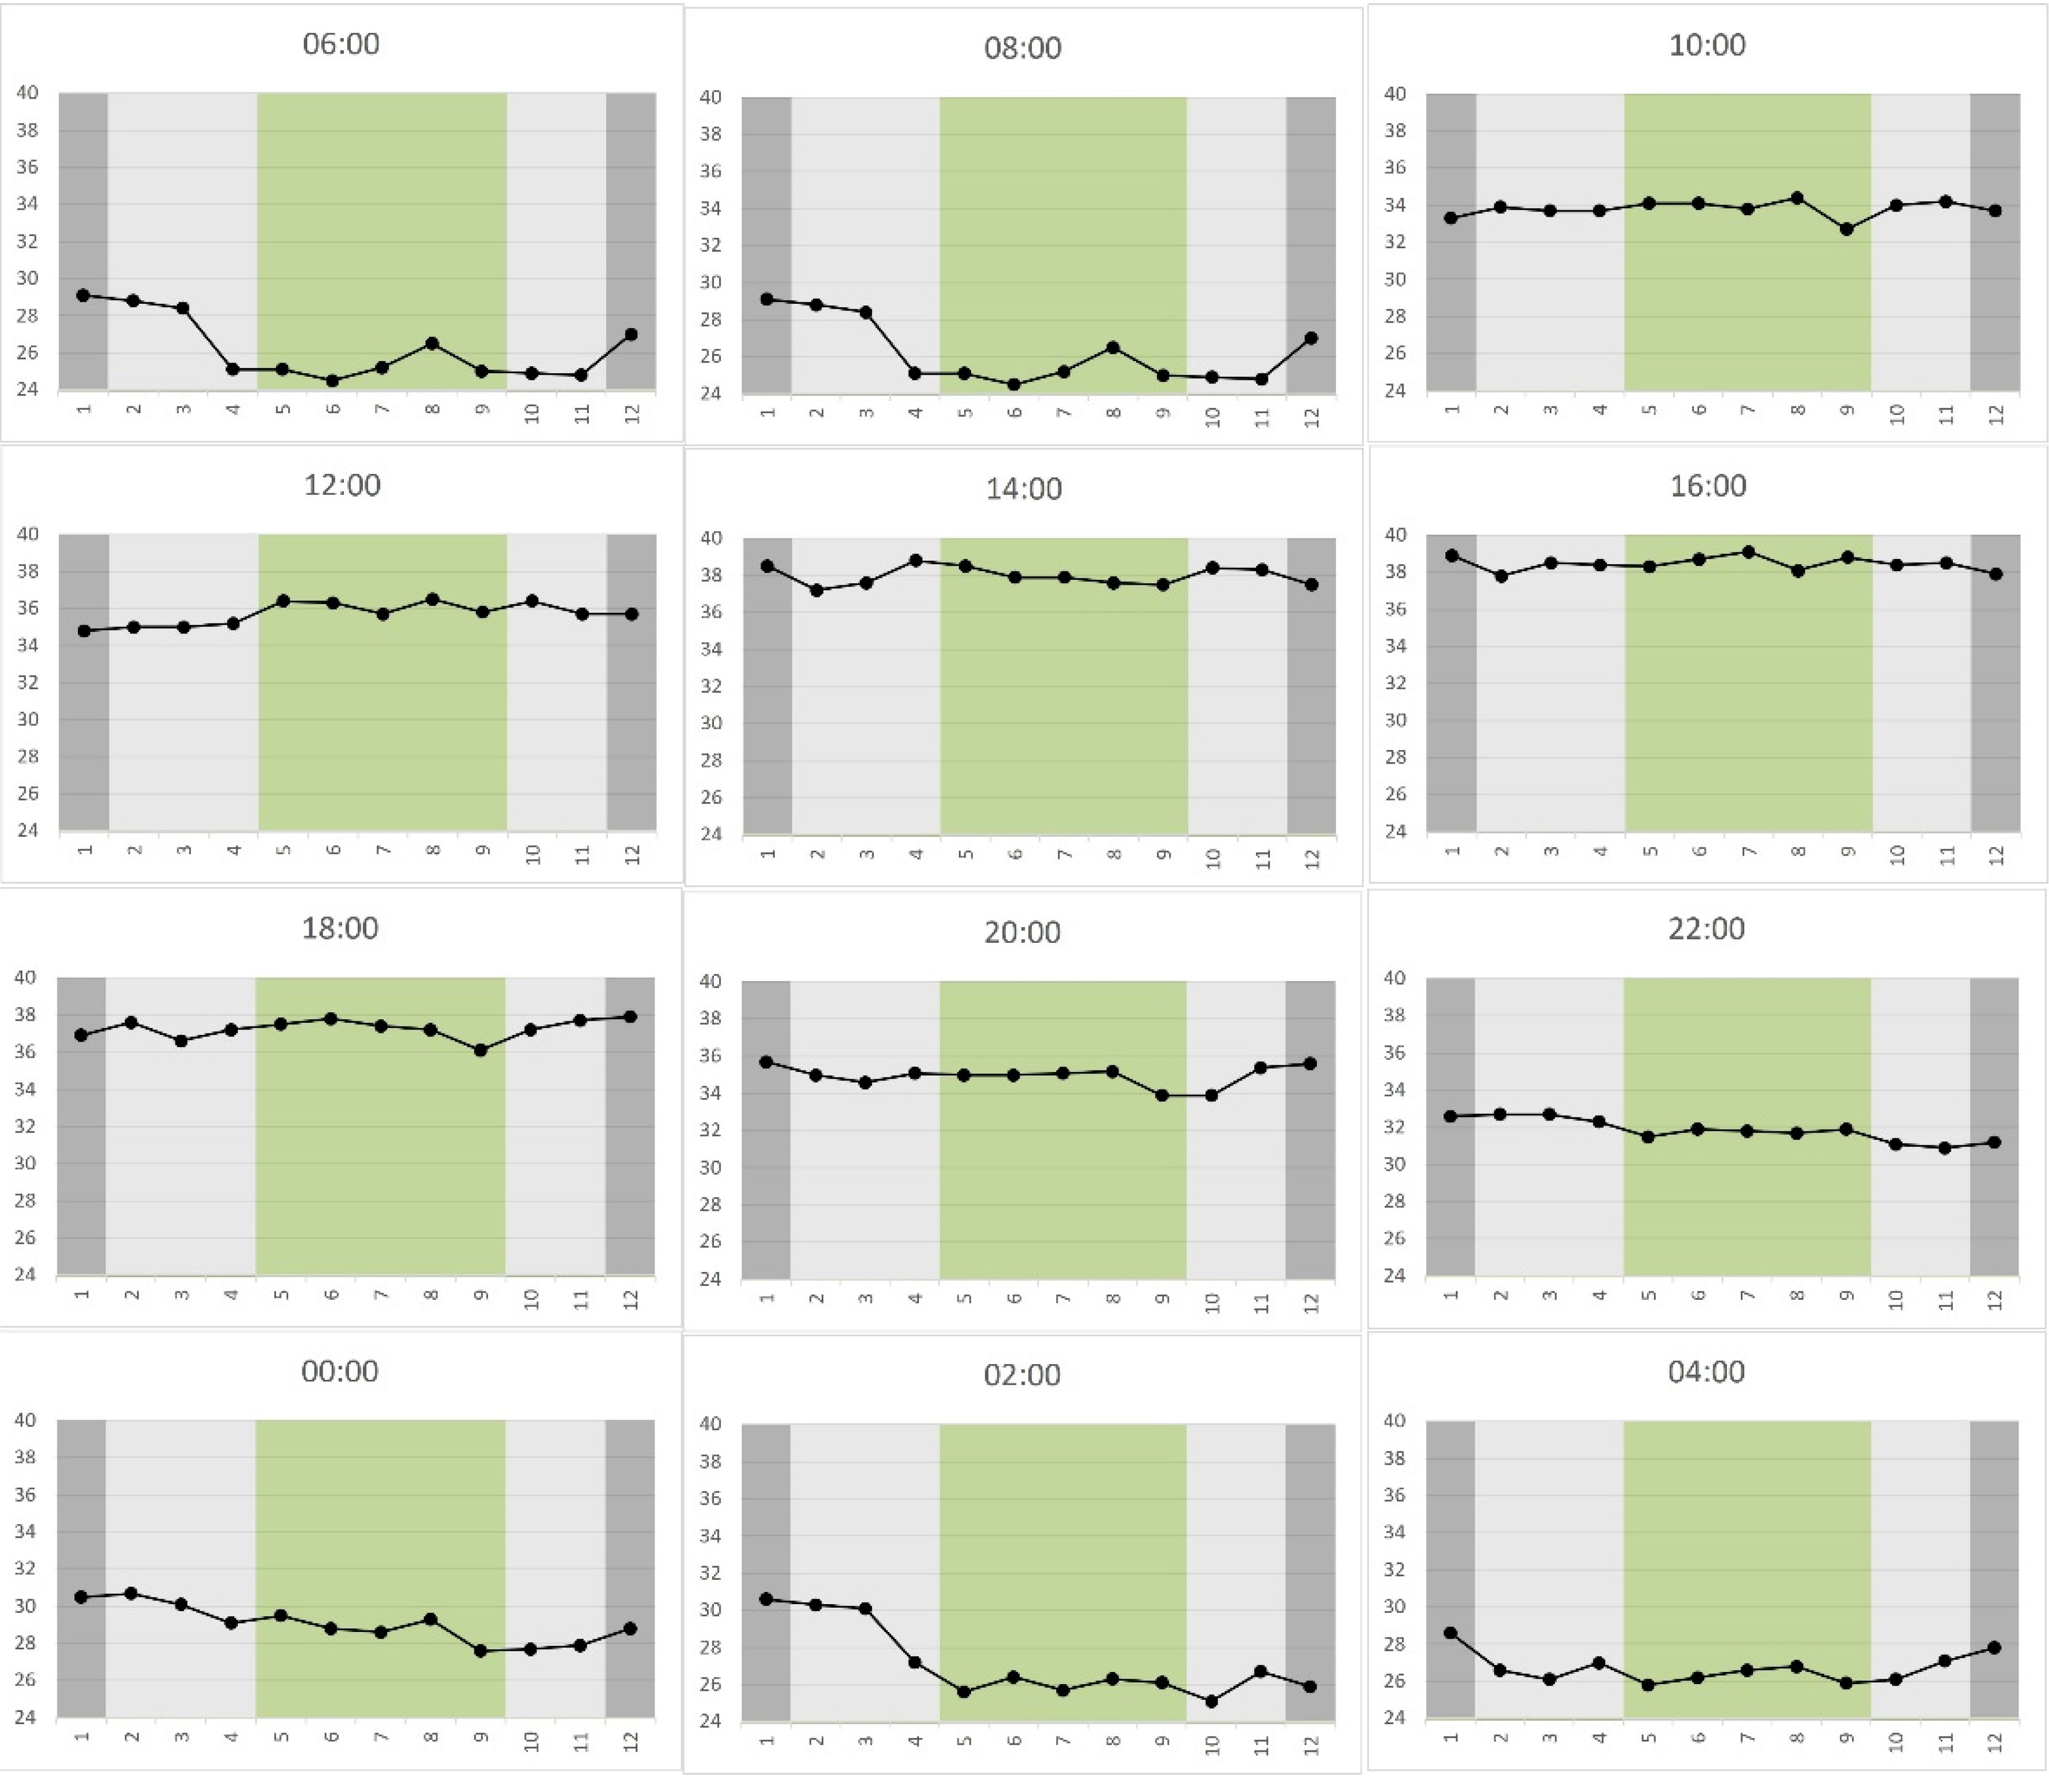
Figure 5 show the air temperatures monitored along transects 1 and 2. The green colour represents the areas inside the park (LCZ B), whereas the city points (LCZ9 and LCZ2) are represented by dark and light grey, respectively. The thermal difference between the various LCZs reaches its maximum during night conditions (hh 6 p.m., 12 a.m., 2 a.m. and 4 a.m.). On the contrary, the daytime vertical mixing driven by solar radiation (hh 10 a.m., 12 p.m., 4 p.m. and 6 p.m.) determines a homogenization of different LCZs, which extends to the evening and the first night (20, 22).
Statistical analysis of all the measurements of the transect by means of a mixed-model ANOVA showed a significant interaction between hour and LCZs. The results of the Sidak post hoc test for mean comparison are shown in
Table 7.
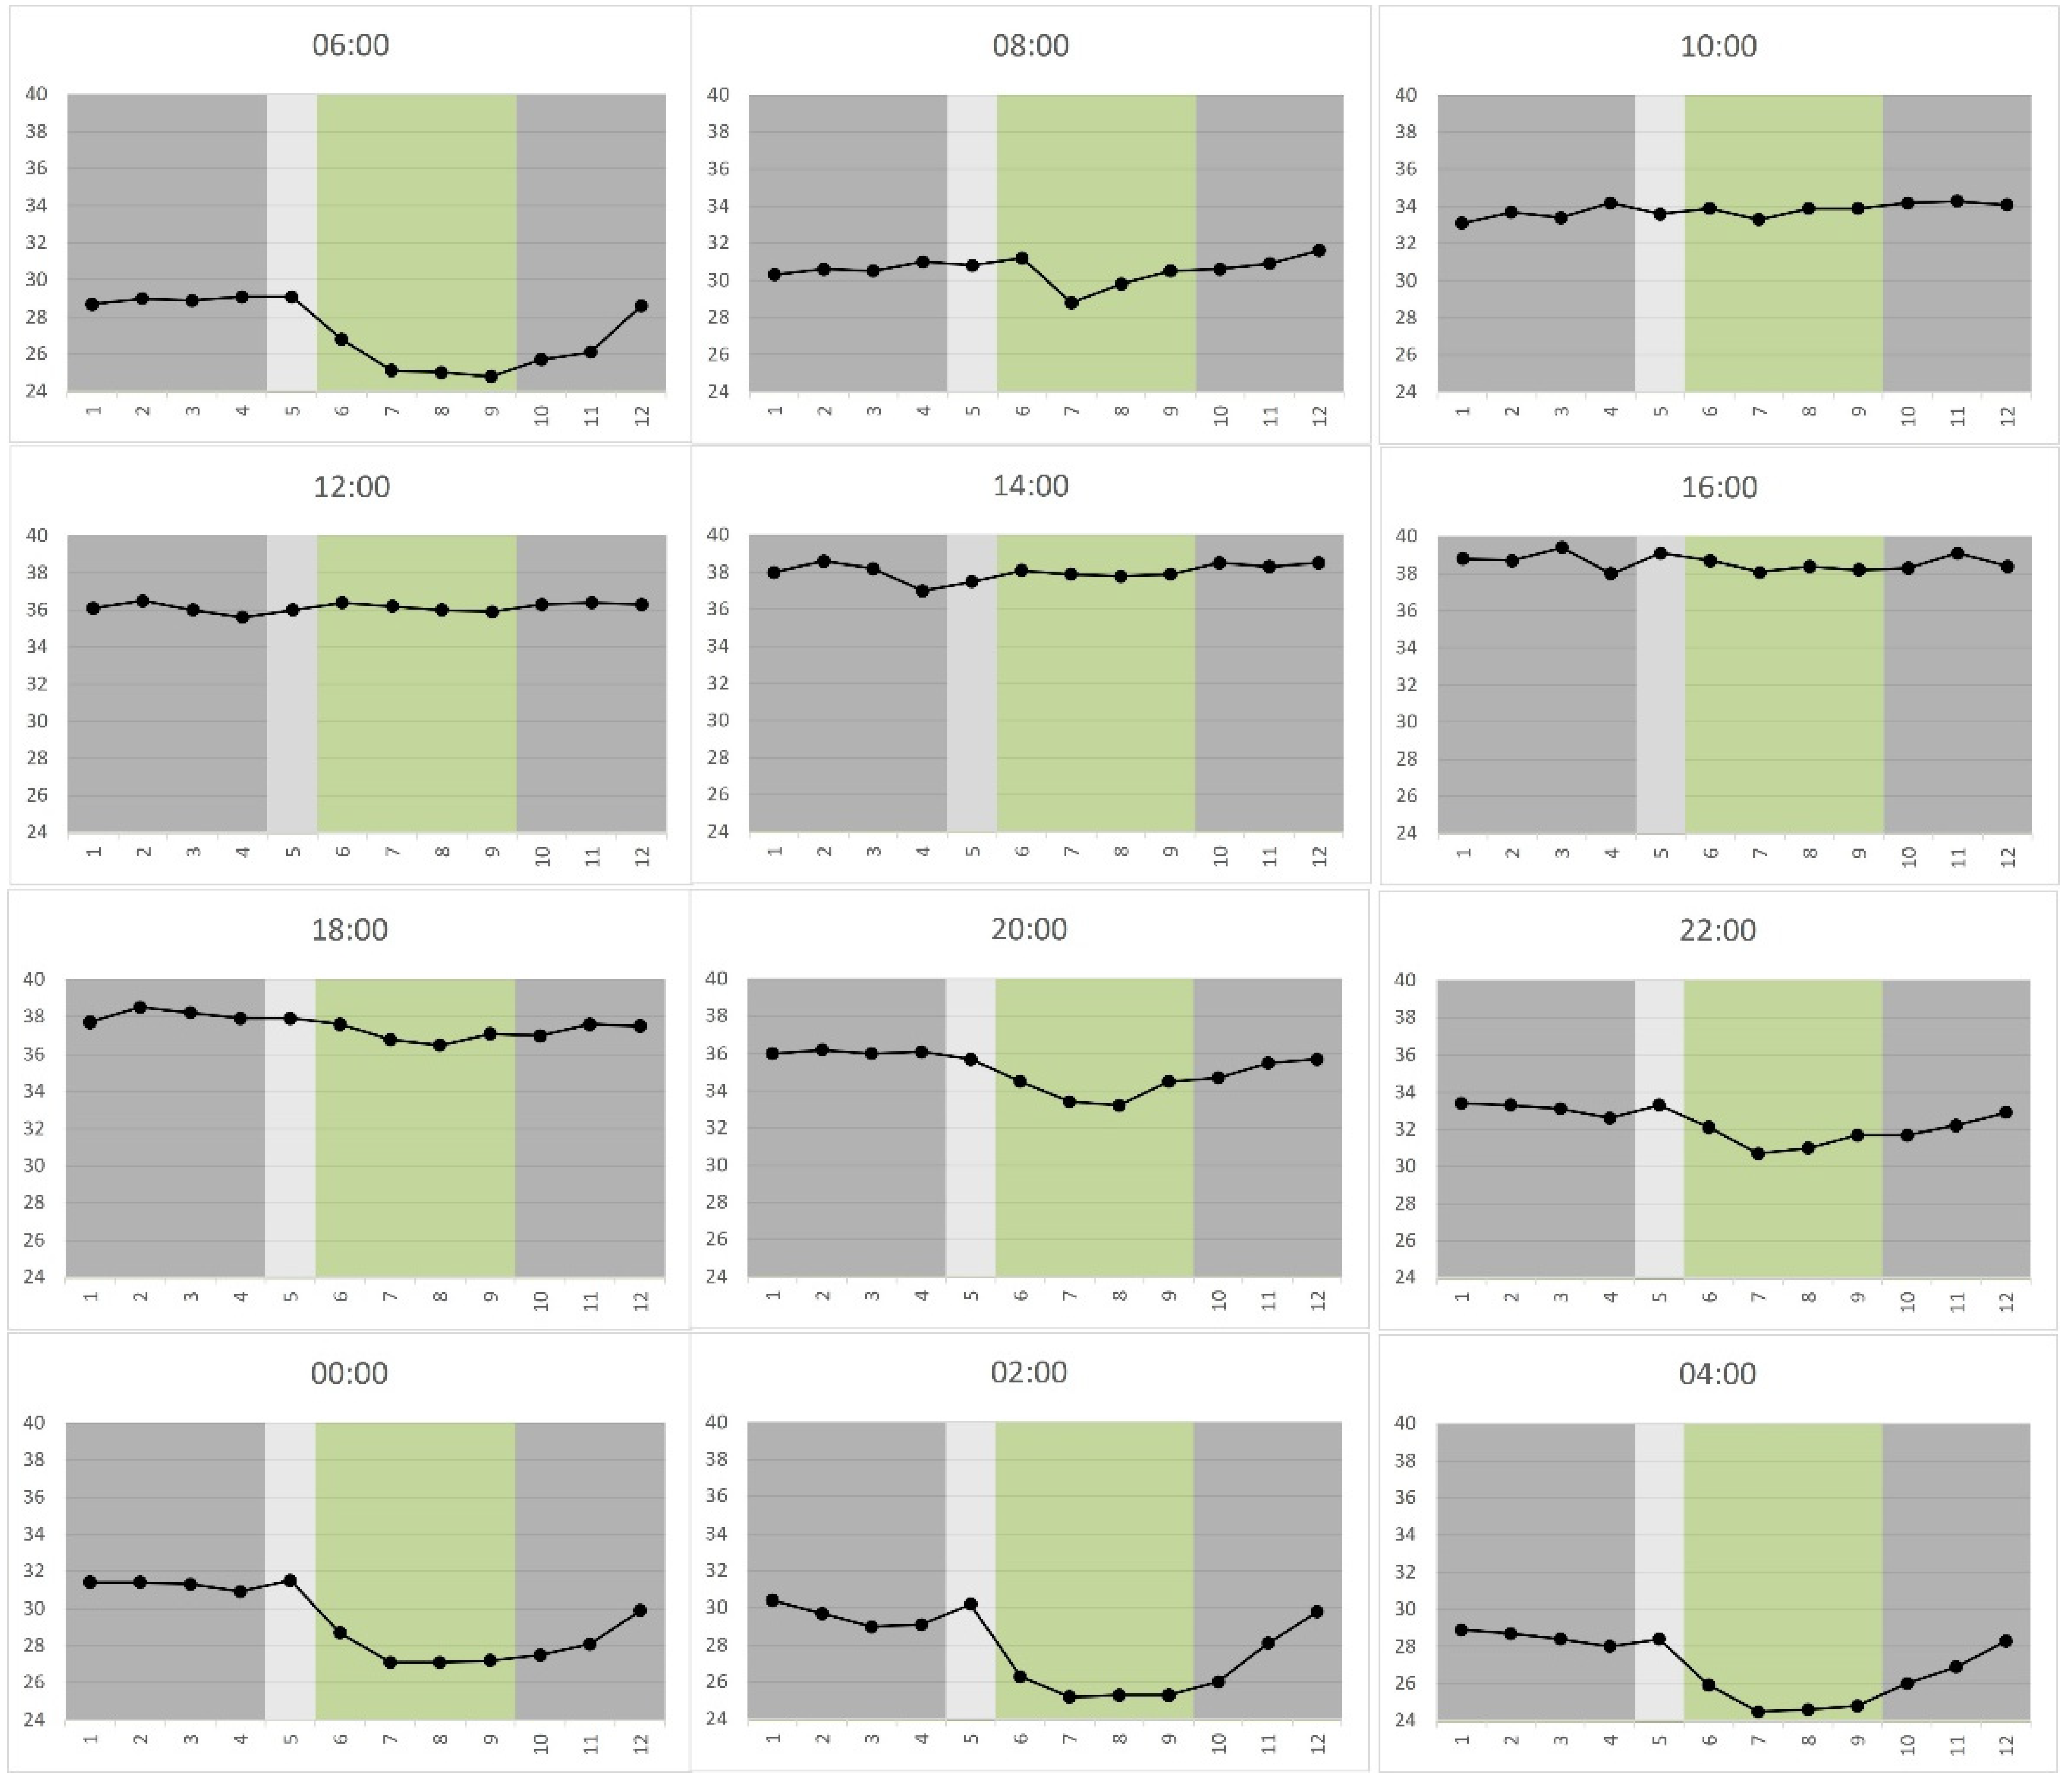
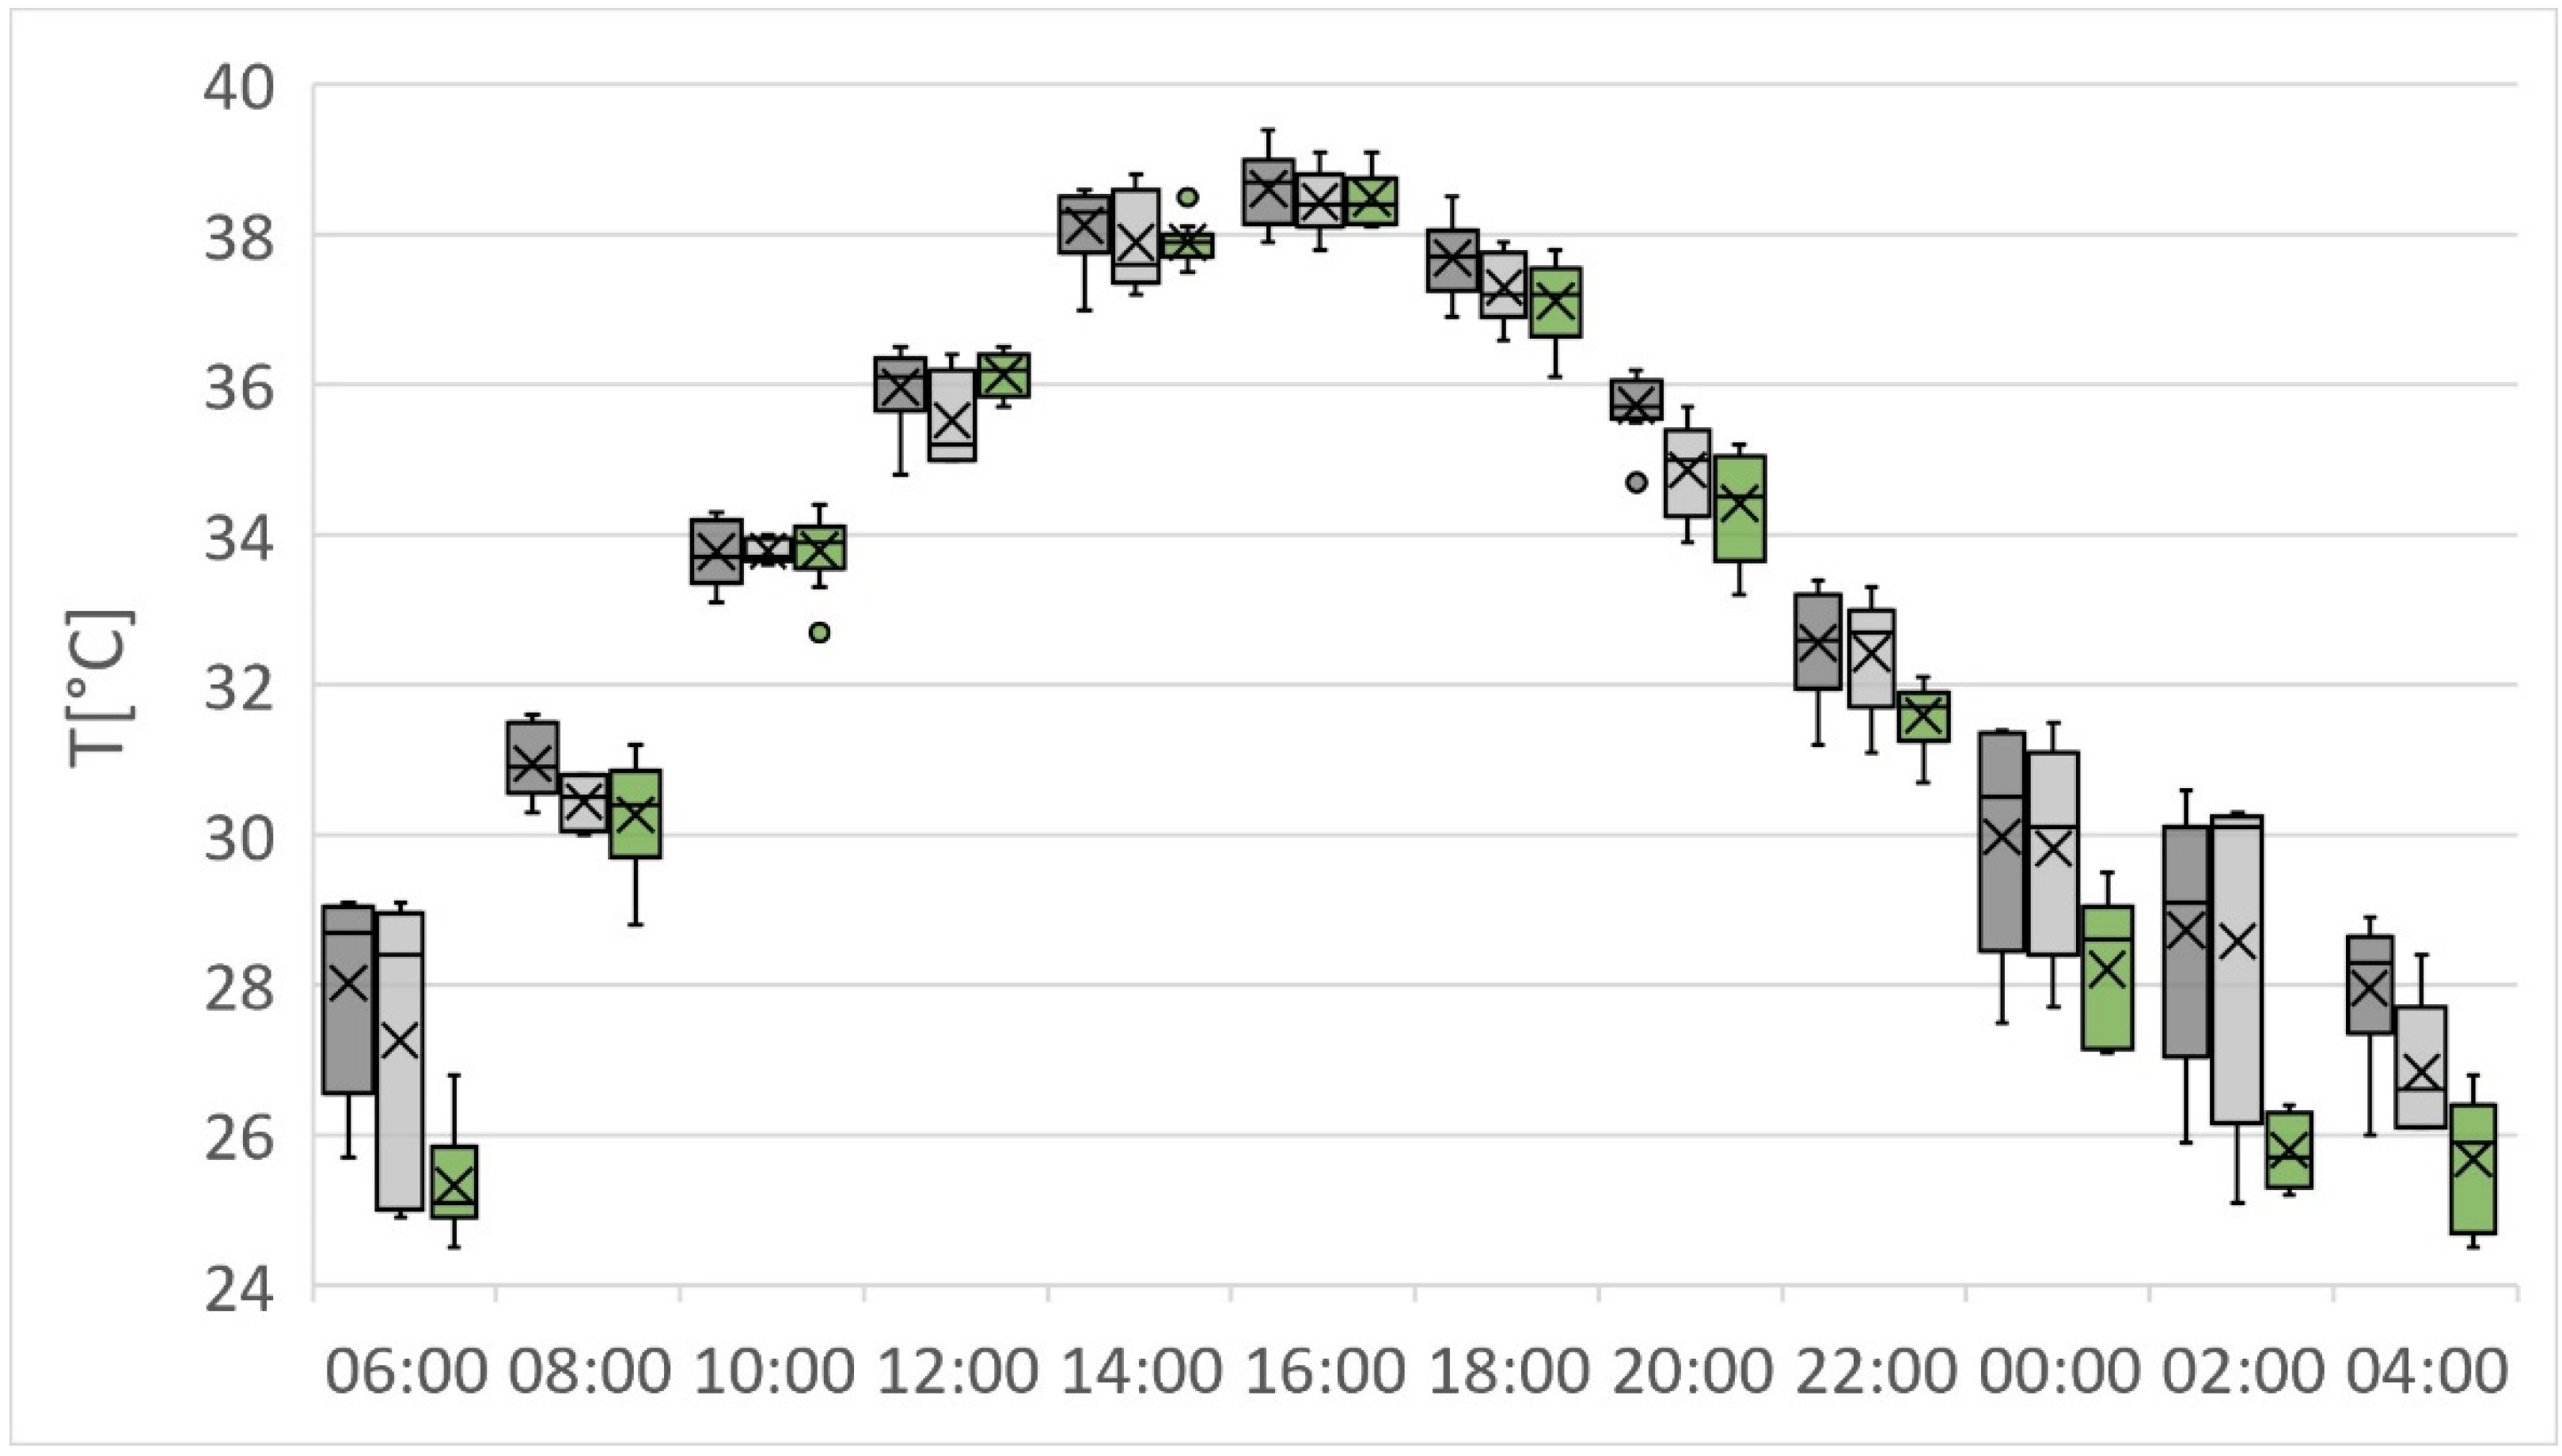
Figure 6 shows the statistics of all the temperature samplings gathered in the same LCZ for each hour. Statistical analysis (
Table 7) confirmed the significance of the difference between LCZB and LCZ2 during the night hours.
However, positive effects of the park should not be exclusively sought in the analysis of the thermal regime, as shown by these results, as other factors act in determining their effectiveness in terms of mitigation of urban effects. Among these, breeze circuits of green areas (which are not limited by the barriers constituted by buildings) and shading effects caused by treetops and structures play important roles [
37].
The city has a strong impact on the trend of the DTR, with a lower sensitivity to the types of weather than rural environments.
Analysis of the data in
Table 7 shows that during the day (from 8 a.m. to 8 p.m.) LCZ2, LCZ9 and LCZB exhibit homogeneous thermal behaviour due to the sensitive vertical mixing of the air mass, which is induced by intense sunshine and that minimizes differences in the temperature of the air above non-homogeneous surfaces [
38]. On the contrary, in the evening and at night, the UHI effect quickly takes hold, resulting in reduced cooling in LCZ2 and LCZ9, which therefore present with a significant difference in behaviour compared to LCZB. This effect is a consequence of the fact that in the urban environment, the loss of radiation toward space is slowed by the reduced sky vision factor. Furthermore, the absence of significant differences between LCZB, LCZ2 and LCZ9 at 10 pm could have a circulatory origin (breezes).
Despite its limitation (only one day was considered), the case study of the transect helped us to clarify the role of the city in the occurrence of anticyclonic days, which are associated with summer heatwaves with peculiar conditions (high solar radiation, clear sky, vertical compression heating effects and very weak or calm wind). Our results highlight that during this specific CWT, the park effectively mitigates the UHI but that this effect only takes place within the park itself and vanishes completely within a short distance beyond the boundary of the park itself.
This evaluation is preliminary and refers to a specific CWT. A more exhaustive evaluation should be carried out with reference to a much larger number of cases, which is possible, for example, with the use of remote sensing [
39].

 ,
, 


