Article

Evaluation of ECMWF Lightning Flash Forecast over Indian Subcontinent during MAM 2020

by
Rituparna Sarkar
1,2,
Parthasarathi Mukhopadhyay
1,*,
Peter Bechtold
3,
Philippe Lopez
3,
Sunil D. Pawar
1 and
Kaustav Chakravarty
1
1
Indian Institute of Tropical Meteorology, Ministry of Earth Sciences, Pune 411008, India
2
Department of Atmospheric and Space Sciences, Savitribai Phule Pune University, Pune 411007, India
3
European Centre for Medium-Range Weather Forecasts, Reading RG2 9AX, UK
*
Author to whom correspondence should be addressed.
Atmosphere 2022, 13(9), 1520; https://doi.org/10.3390/atmos13091520
Submission received: 1 August 2022 / Revised: 28 August 2022 / Accepted: 1 September 2022 / Published: 17 September 2022
(This article belongs to the Special Issue Precipitation and Convection: From Observation to Simulation)

Abstract

:
During the pre-monsoon season (March–April–May), the eastern and northeastern parts of India, Himalayan foothills, and southern parts of India experience extensive lightning activity. Mean moisture, surface and upper-level winds, the sheared atmosphere in the lower level, and high positive values of vertically integrated moisture flux convergence (VIMFC) create favorable conditions for deep convective systems to occur, generating lightning. From mid-2018, the European Centre for Medium-Range Weather Forecasts (ECMWF) Integrated Forecasting System (IFS) operationally introduced lightning flash density on a global scale. This study evaluates the ECMWF lightning forecasts over India during the pre-monsoon season of 2020 using the Indian Institute of Tropical Meteorology (IITM) Lightning Location Network (LLN) observation data. Qualitative and quantitative analysis of the ECMWF lightning forecast has shown that the lightning forecast with a 72-h lead time can capture the spatial and temporal variation of lightning with a 90% skill score.

1. Introduction

Cumulonimbus clouds with vigorous updrafts and downdrafts form thunderstorms. Severe thunderstorms consist of multiple convective cells at different stages, and the storm itself has a longer lifetime than individual cells [1,2,3,4]. As the convective clouds grow larger, different microphysical processes inside the cloud trigger the formation of charged hydrometeors. Negatively charged hydrometeors accumulate in the lower region of the cloud and positively charged particles in the upper levels, leading to the formation of an electric dipole structure. When the charge difference between the two poles of the dipole becomes high enough, lightning occurs through electric discharge [5,6,7].
Despite uncertainties in the data, the present global estimation of lightning-related fatalities is about 4000 to 5000 per year [8], with developing countries from tropical and sub-tropical nations being the most affected. Being part of the tropics, the Indian subcontinent experience a high number of lightning-related death, with the highest deaths recorded throughout March, April, and May—with an average of 103 deaths per year in Nepal [9], an average of 18 deaths per year in Shri Lanka [10], and in Bangladesh an average of 286 deaths per year [11]. In India, lightning has caused more fatalities than any other natural calamity from 2004 to 2013, according to a report by National Crime Records Bureau (NCRB), with 38.6% of deaths caused by lightning alone [12,13]. A recent study [14] has shown that mortality due to lightning alone has increased by 52.8% in the last 20 years.
In addition to its destructive impacts, lightning is a source of NOx in the atmosphere influencing ozone productivity and oxidization [15]. Lightning strikes are the dominant cause of forest fires and a significant contributor to biomass-burning aerosols [16]. As lightning is responsive to temperature on many time scales, one study [15] has predicted more lightning in a warmer world based on a general circulation model with enhanced CO2. Many studies [16,17,18,19] have called for enhancements in clustered positive ground flash activity in the presence of elevated equivalent potential temperature. Nevertheless, the use of lightning as an indicator of long-term climate issues has also been questioned due to the diminishing effects of lightning–temperature sensitivity on a longer time scale [20].
The Indian subcontinent experiences severe thunderstorm events and lightning during the pre-monsoon months of March–April–May (MAM) [21,22,23,24,25]. There are five distinctly identifiable thunderstorm-prone regions—Northeast India (NEI), Southern Peninsula (SP), Central India (CI), East Coast of India (ECI), and Northwest India (NWI) [26]. Each thunderstorm-prone region is defined based on its trigger mechanism, lightning structure, microphysical, and dynamical properties [2,26,27,28,29,30,31,32].
The India Meteorological Department (IMD), Indian Institute of Tropical Meteorology (IITM), and the National Centre for Medium-Range Weather Forecasting (NCMRWF), under the initiative of the Ministry of Earth Sciences (MoES), have developed a thunderstorm prediction system that can deliver a nowcast up to 3 h ahead for 800 stations, a regional model forecast with a 24-h lead time and thunderstorm-specific products 48 h in advance from high-resolution (12.5 km) global model. These products use combinations of high-resolution satellite data, IITM lightning sensors, RADAR observations, high-resolution mesoscale models, and outputs from the Global Forecast System (GFS, at 12.5 km spatial resolution). All these efforts have significantly improved accuracy for nowcasting and short-range forecasting [33]. To address the disaster management aspect of lightning, the Lightning Resilient India Campaign was launched in 2019 to reduce lightning deaths by 80% by 2022. The campaign was formed jointly by Climate Resilient Observing Systems Promotion Council (CROPC), in collaboration with IMD, the Indian Meteorological Society (IMS), World Vision India, and the Red Cross. Within the first two years, casualties associated with lightning have been reduced by 60% [34].
In June 2018, the European Centre for Medium-Range Weather Forecasts (ECMWF) started to predict lightning flash density operationally in their Integrated Forecasting System (IFS) [35]. The lightning flash density [36] is calculated using convective outputs from the convective mass–flux scheme [37] of IFS. Verification of the ECMWF lightning forecasts over Europe has shown that the ensemble lightning forecasts have useful skill with a lead time of at least 3 days, while the deterministic forecast is in good agreement with the observations for 6 h temporally and 50 km spatially [35].
Here, using observations from the IITM Lightning Location Network (LLN), operational over more than 80 locations across India, we evaluate the ECMWF lightning forecast with a lead time of 3 days over India and analyze the quality of the ECMWF lightning forecasts with a longer lead time during the pre-monsoon months of March–April–May. Section 2 of this paper details the data and methodology used in this study. Section 3 includes results and discussion, followed by a summary in Section 4.

2. Data and Methodology

2.1. ECMWF IFS Lightning Forecast Data

ECMWF implemented lightning parameterization in IFS and started operational lightning forecasts in June 2018 [35]. The parameterization calculates the total of cloud-to-ground (CG) and Intra-Cloud (IC) lightning as a function of convective hydrometeor amounts, convective available potential energy (CAPE), and convective cloud base height diagnosed by the convection scheme of ECMWF [36]. The total lightning flash density is given by
f T = α Q R CAPE min ( z base ,   1.8 ) 2 ,
where α is a tunable coefficient, currently set to 37.5, to match the annual global mean flash rate obtained from Lightning Imaging Sensor (LIS)/Optical Transient Detector (OTD) gridded climatology [38]. The variable z base is the convective cloud base height.
The mixed-phase region of a convective cloud consists of graupel and super-cooled water and is typically found between 0 °C and −25 °C isotherm. These microphysical processes, such as collision, and sublimation, lead to the charge separation of cloud particles [39,40,41,42]. The region between the 0 °C and −25 °C isotherm is assumed to correspond to the charge separation region [36] (Figure 1, p. 3058). In Equation (1), Q R provides a proxy for the charging rate generated by the collisions between different hydrometeors within the charge separation region:
Q R = z 0 z 25 q graup ( q cond + q snow ) ρ ¯ d z ,
where q graup and q snow denote the amount of graupel, and snow, respectively, while q cond is the cloud condensate amount within the convective updraft region. ρ ¯ is the ambient air density at altitude z .   z 25 represents the altitude of −25 °C isotherm and z 0 is the altitude of 0 °C isotherm.
This parameterization provides both instantaneous and time-averaged total lightning flash densities and was made operational from the IFS model cycle 45r1 for both the highest resolution “HRES” configuration and the 51-member ensemble system “ENS”. The horizontal resolution was 9 km for HRES and 18 km for ENS, with 137 vertical levels.
For our analysis, we considered pre-monsoon months March, April, and May (MAM) 2020 total (CG and IC) hourly lightning flash density (km−2 day−1) from daily ECMWF IFS HRES runs up to the 72 h range. In this paper, IFS Day 1 lead time refers to the first 24 h forecast, Day 2 lead time refers to the forecast from 25 h to 48 h, Day 3 from 49 h to 72 h.

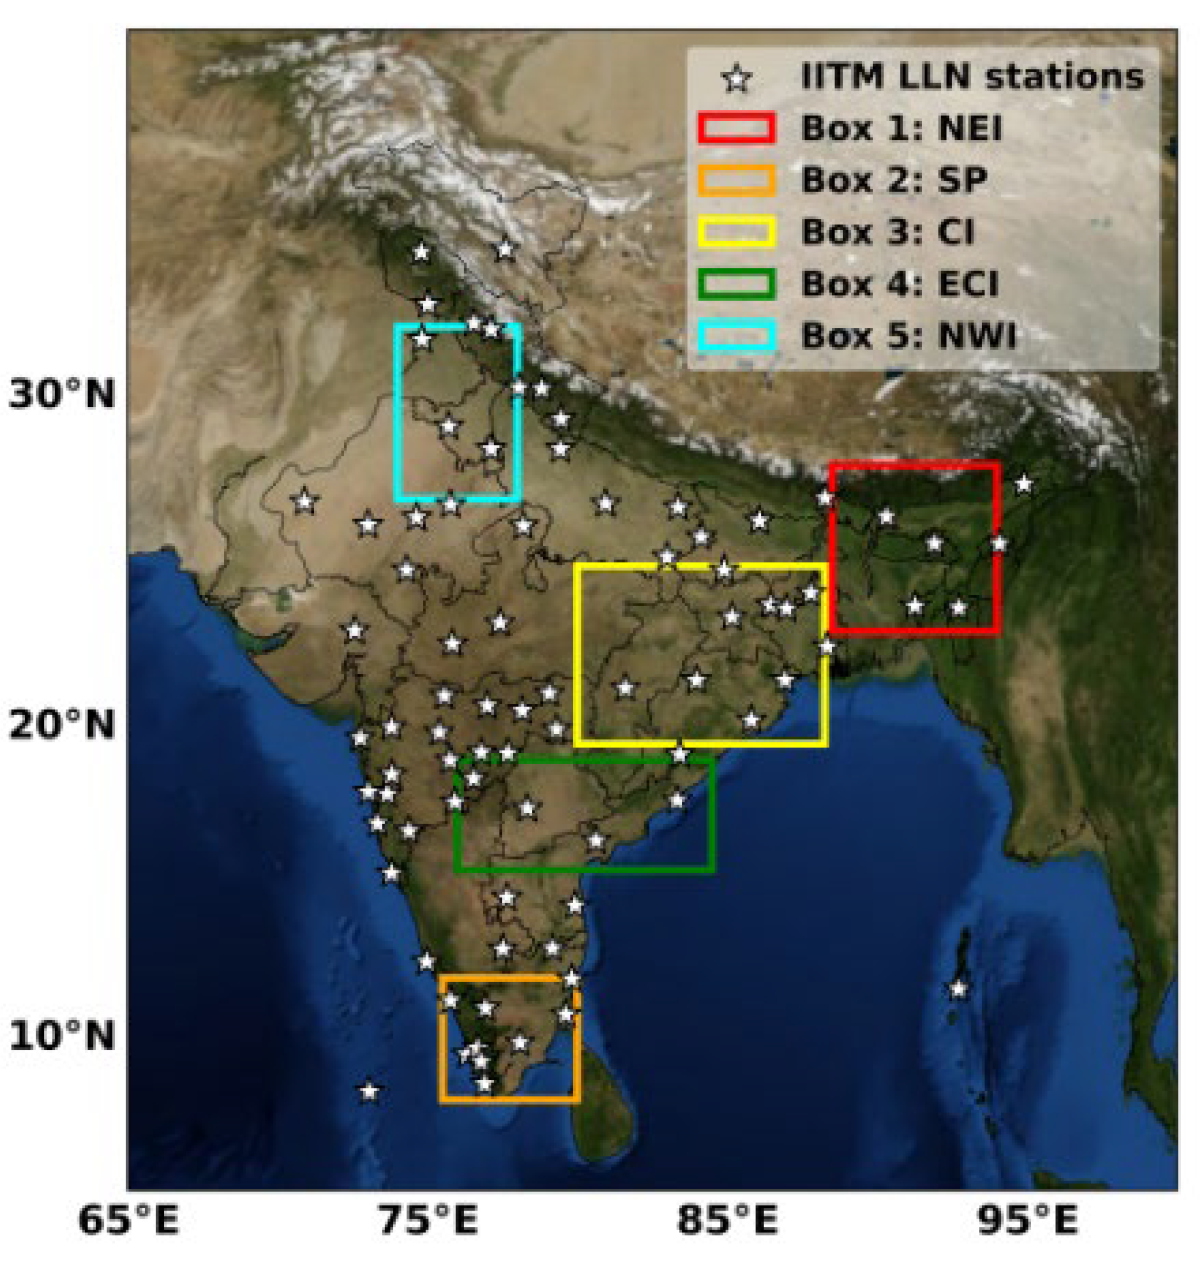
2.2. Lightning Location Network

IITM LLN currently consists of 82 lightning-detecting sensors. Each sensor can detect the arrival time of the radio waves (up to 100 MHz) generated by lightning at nanoseconds accuracy from as far as 1000 km away (Figure 1). CG and IC lightning strikes can be detected with 90% and 50% detection efficiency, respectively [43,44,45,46].
Figure 1. The locations of Indian Institute of Tropical Meteorology (IITM) Lightning Location Network (LLN) stations (marked by white stars). Overlaid colored boxes are 5 thunderstorm-prone regions (as defined by [26]).
Atmosphere 13 01520 g001
An algorithm has been built mainly for this study to calculate the total lightning flash density that occurred in the last hour (in flash km−2 h−1) on a 0.1° × 0.1° grid for MAM 2020.

2.3. Other Datasets

In addition to IFS lightning forecasts and LLN observation data, we have also used the LIS/OTD Gridded Climatology data set, which consists of the gridded climatology of total lightning flash rates measured by the spaceborne Optical Transient Detector (OTD) and Lightning Imaging Sensor (LIS) from 1995 to 2015 with a horizontal resolution of 0.5° × 0.5° [38]. To analyze the large-scale conditions during the pre-monsoon season in India, we used the fifth-generation ECMWF reanalysis (ERA5) hourly data at a resolution of 0.25° × 0.25° [47].

3. Results and Discussion

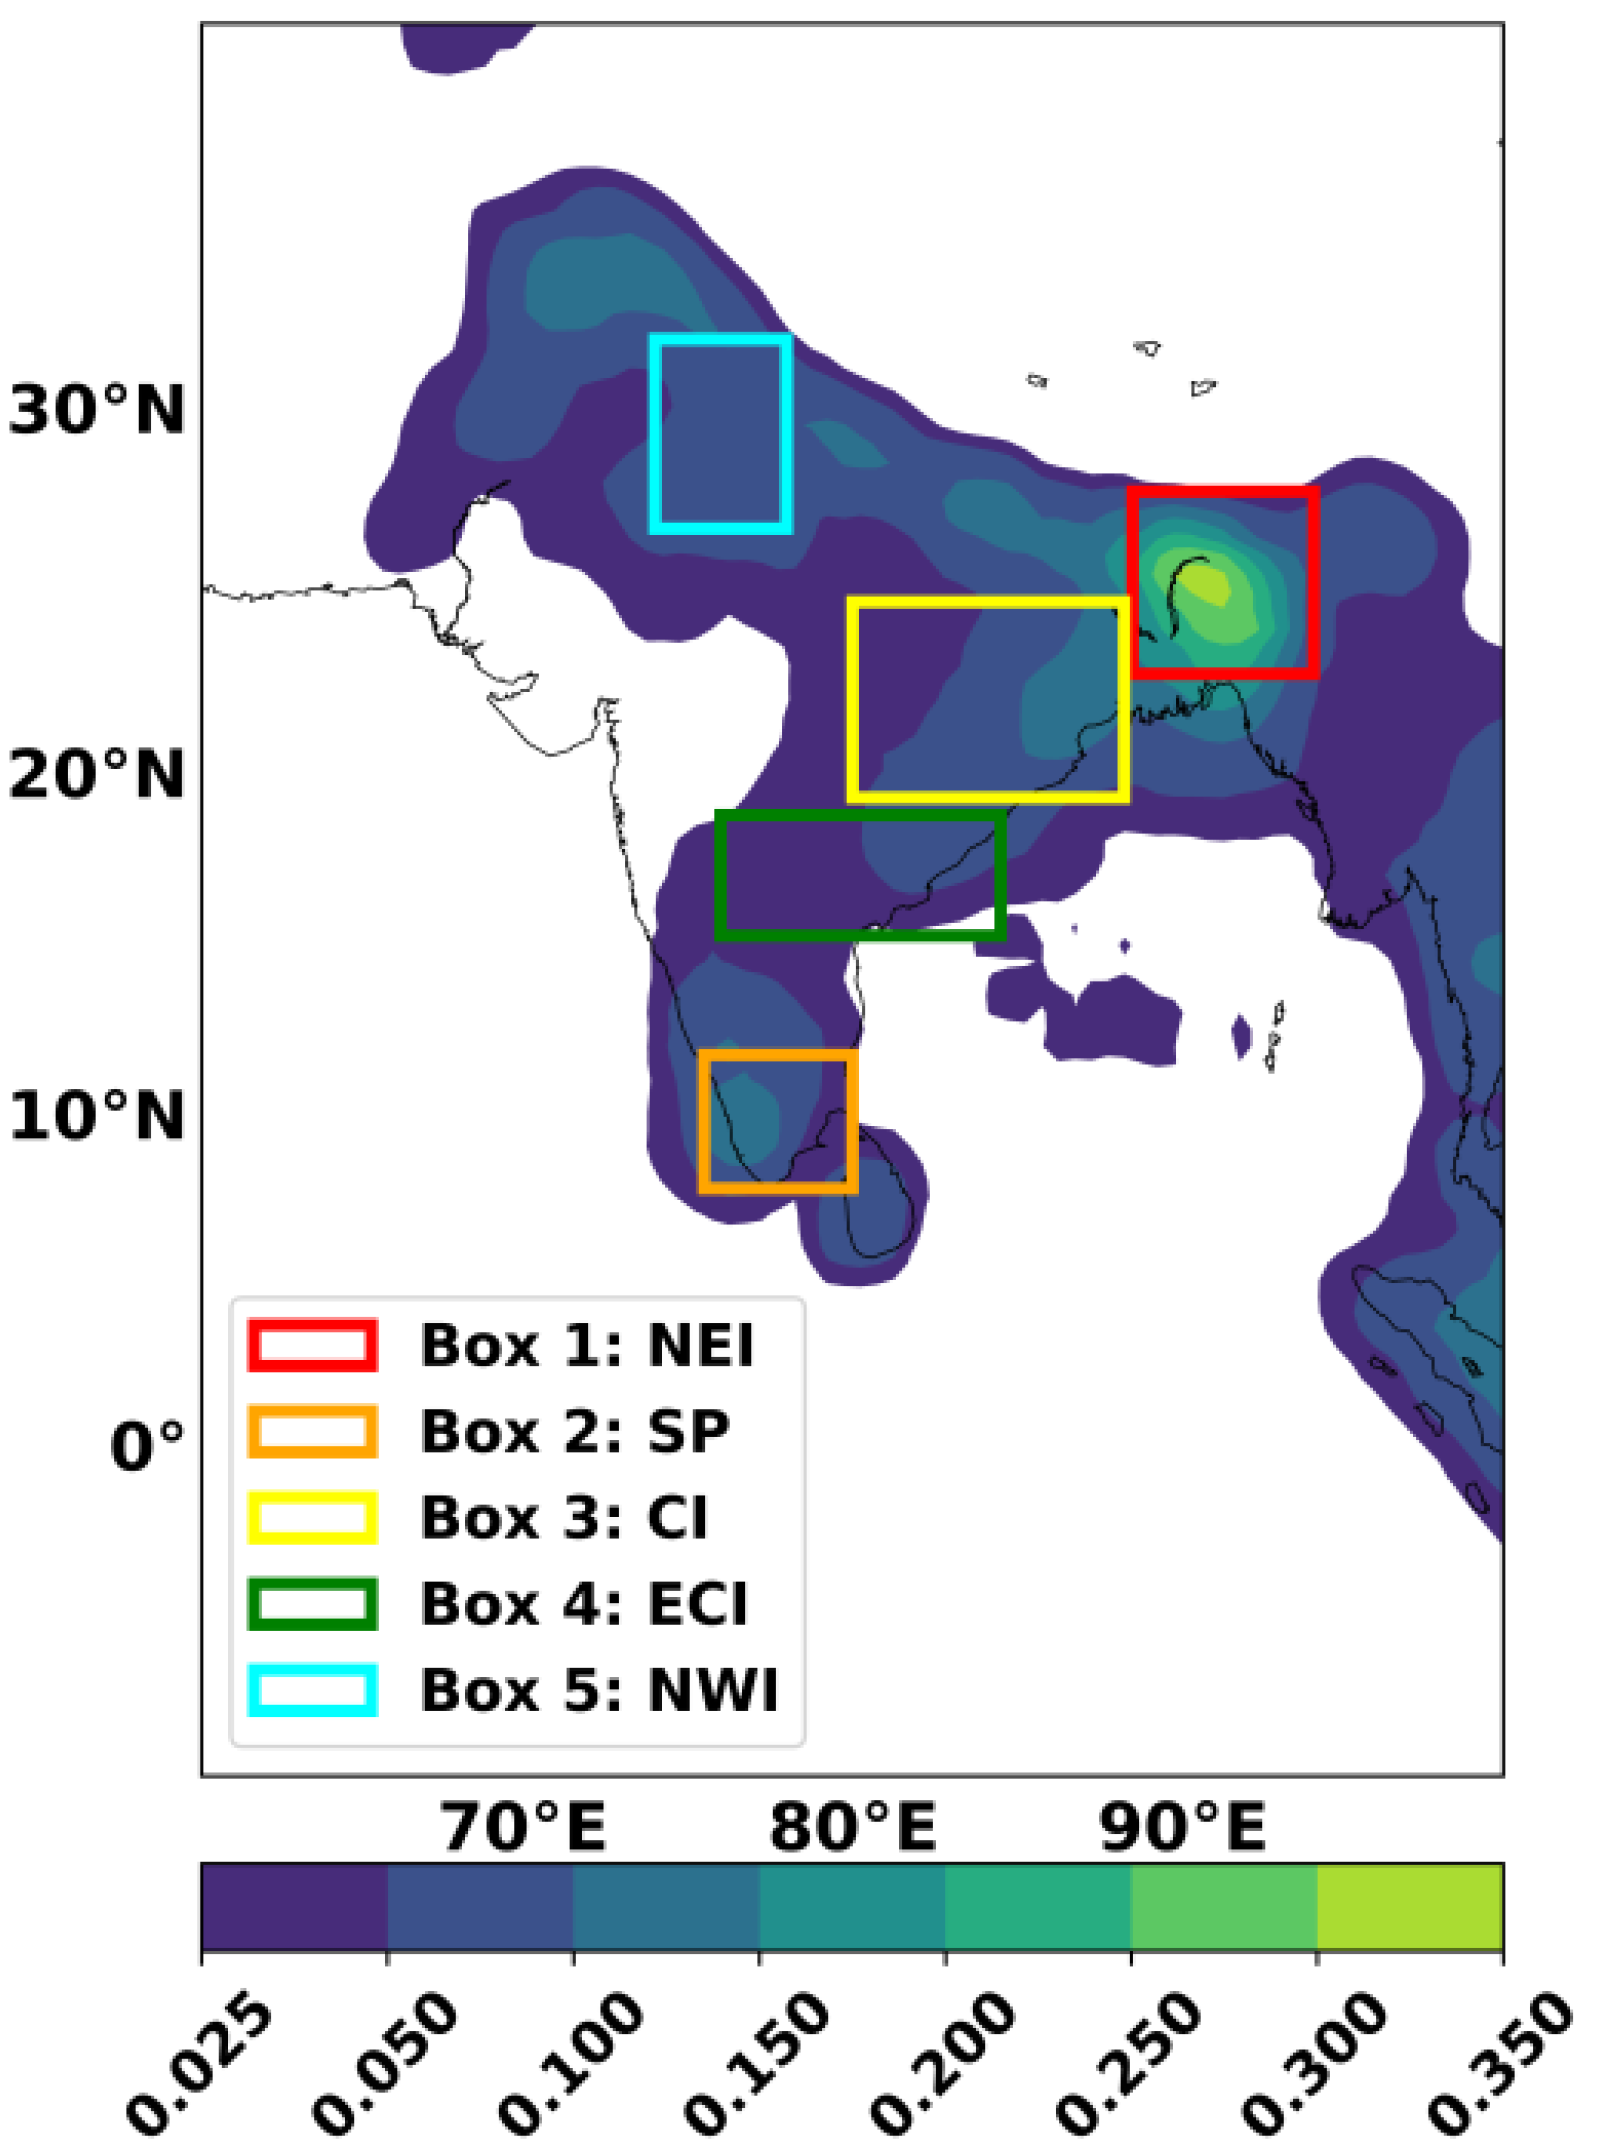
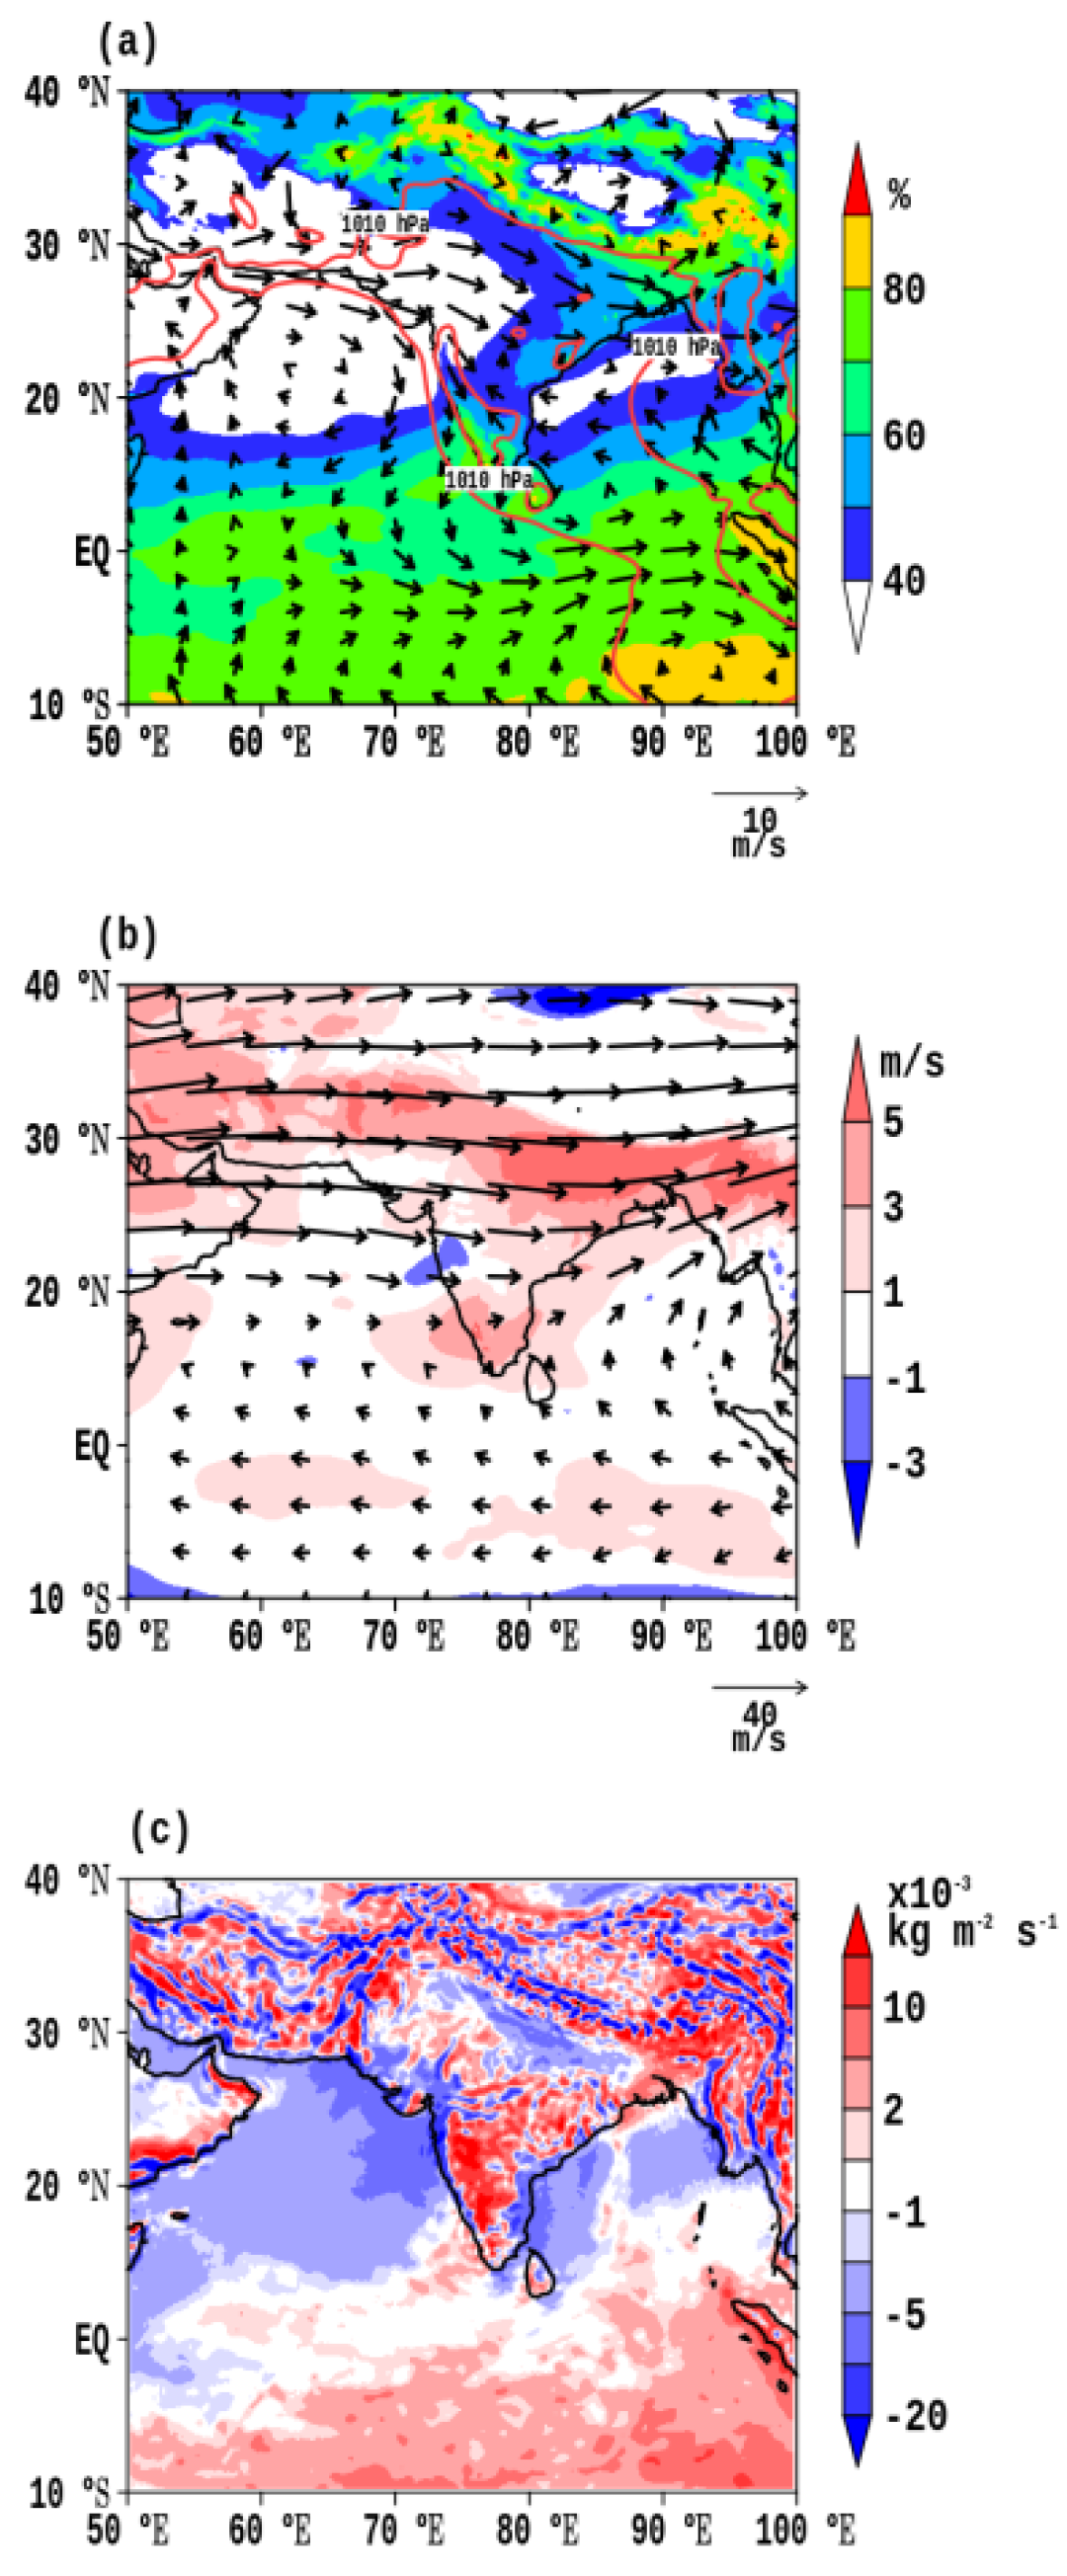
3.1. Mean Lightning Climatology and Large-Scale Condition during MAM 2020

The MAM season lies between the winter and summer monsoon seasons and is classified as the ‘Hot weather period’ by the IMD [48]. The subcontinent experiences intense convective events during this period, resulting in high lightning activity. The LIS/OTD lightning climatology for MAM (Figure 2) shows the Himalayan foothills, eastern, northeastern, and southern parts of India experiencing an extended amount of lightning. Western India has a very low lightning occurrence during this season. The five thunderstorm-prone regions [26] reasonably overlap with the intense lightning regions, as shown in Figure 2.
Investigation of the meteorological surface and dynamical features during MAM 2020 (Figure 3) shows the regions with a mean relative humidity above 50% coincide with Figure 2. The 850 hPa wind shows westerlies to northwesterlies in the northern part of India, while a clear line of wind discontinuity can be seen across the southern peninsula in a north–south direction (Figure 3a). At the 200 hPa level, the mean wind is predominantly westerly (Figure 3b). The vertical wind shear between 850 hPa and 700 hPa is positive over thunderstorm-prone regions (Figure 3b). Large-scale lifting in the lower troposphere helps sustain convective activity and therefore favors thunderstorm intensification. Vertically integrated moisture flux convergence (VIMFC) has been used as a thunderstorm predictor [49]. As displayed in Figure 3c, the significant positive values of VIMFC indicate a thunderstorm-supporting environment over eastern, northeastern, and southern India and along the Himalayan foothills.

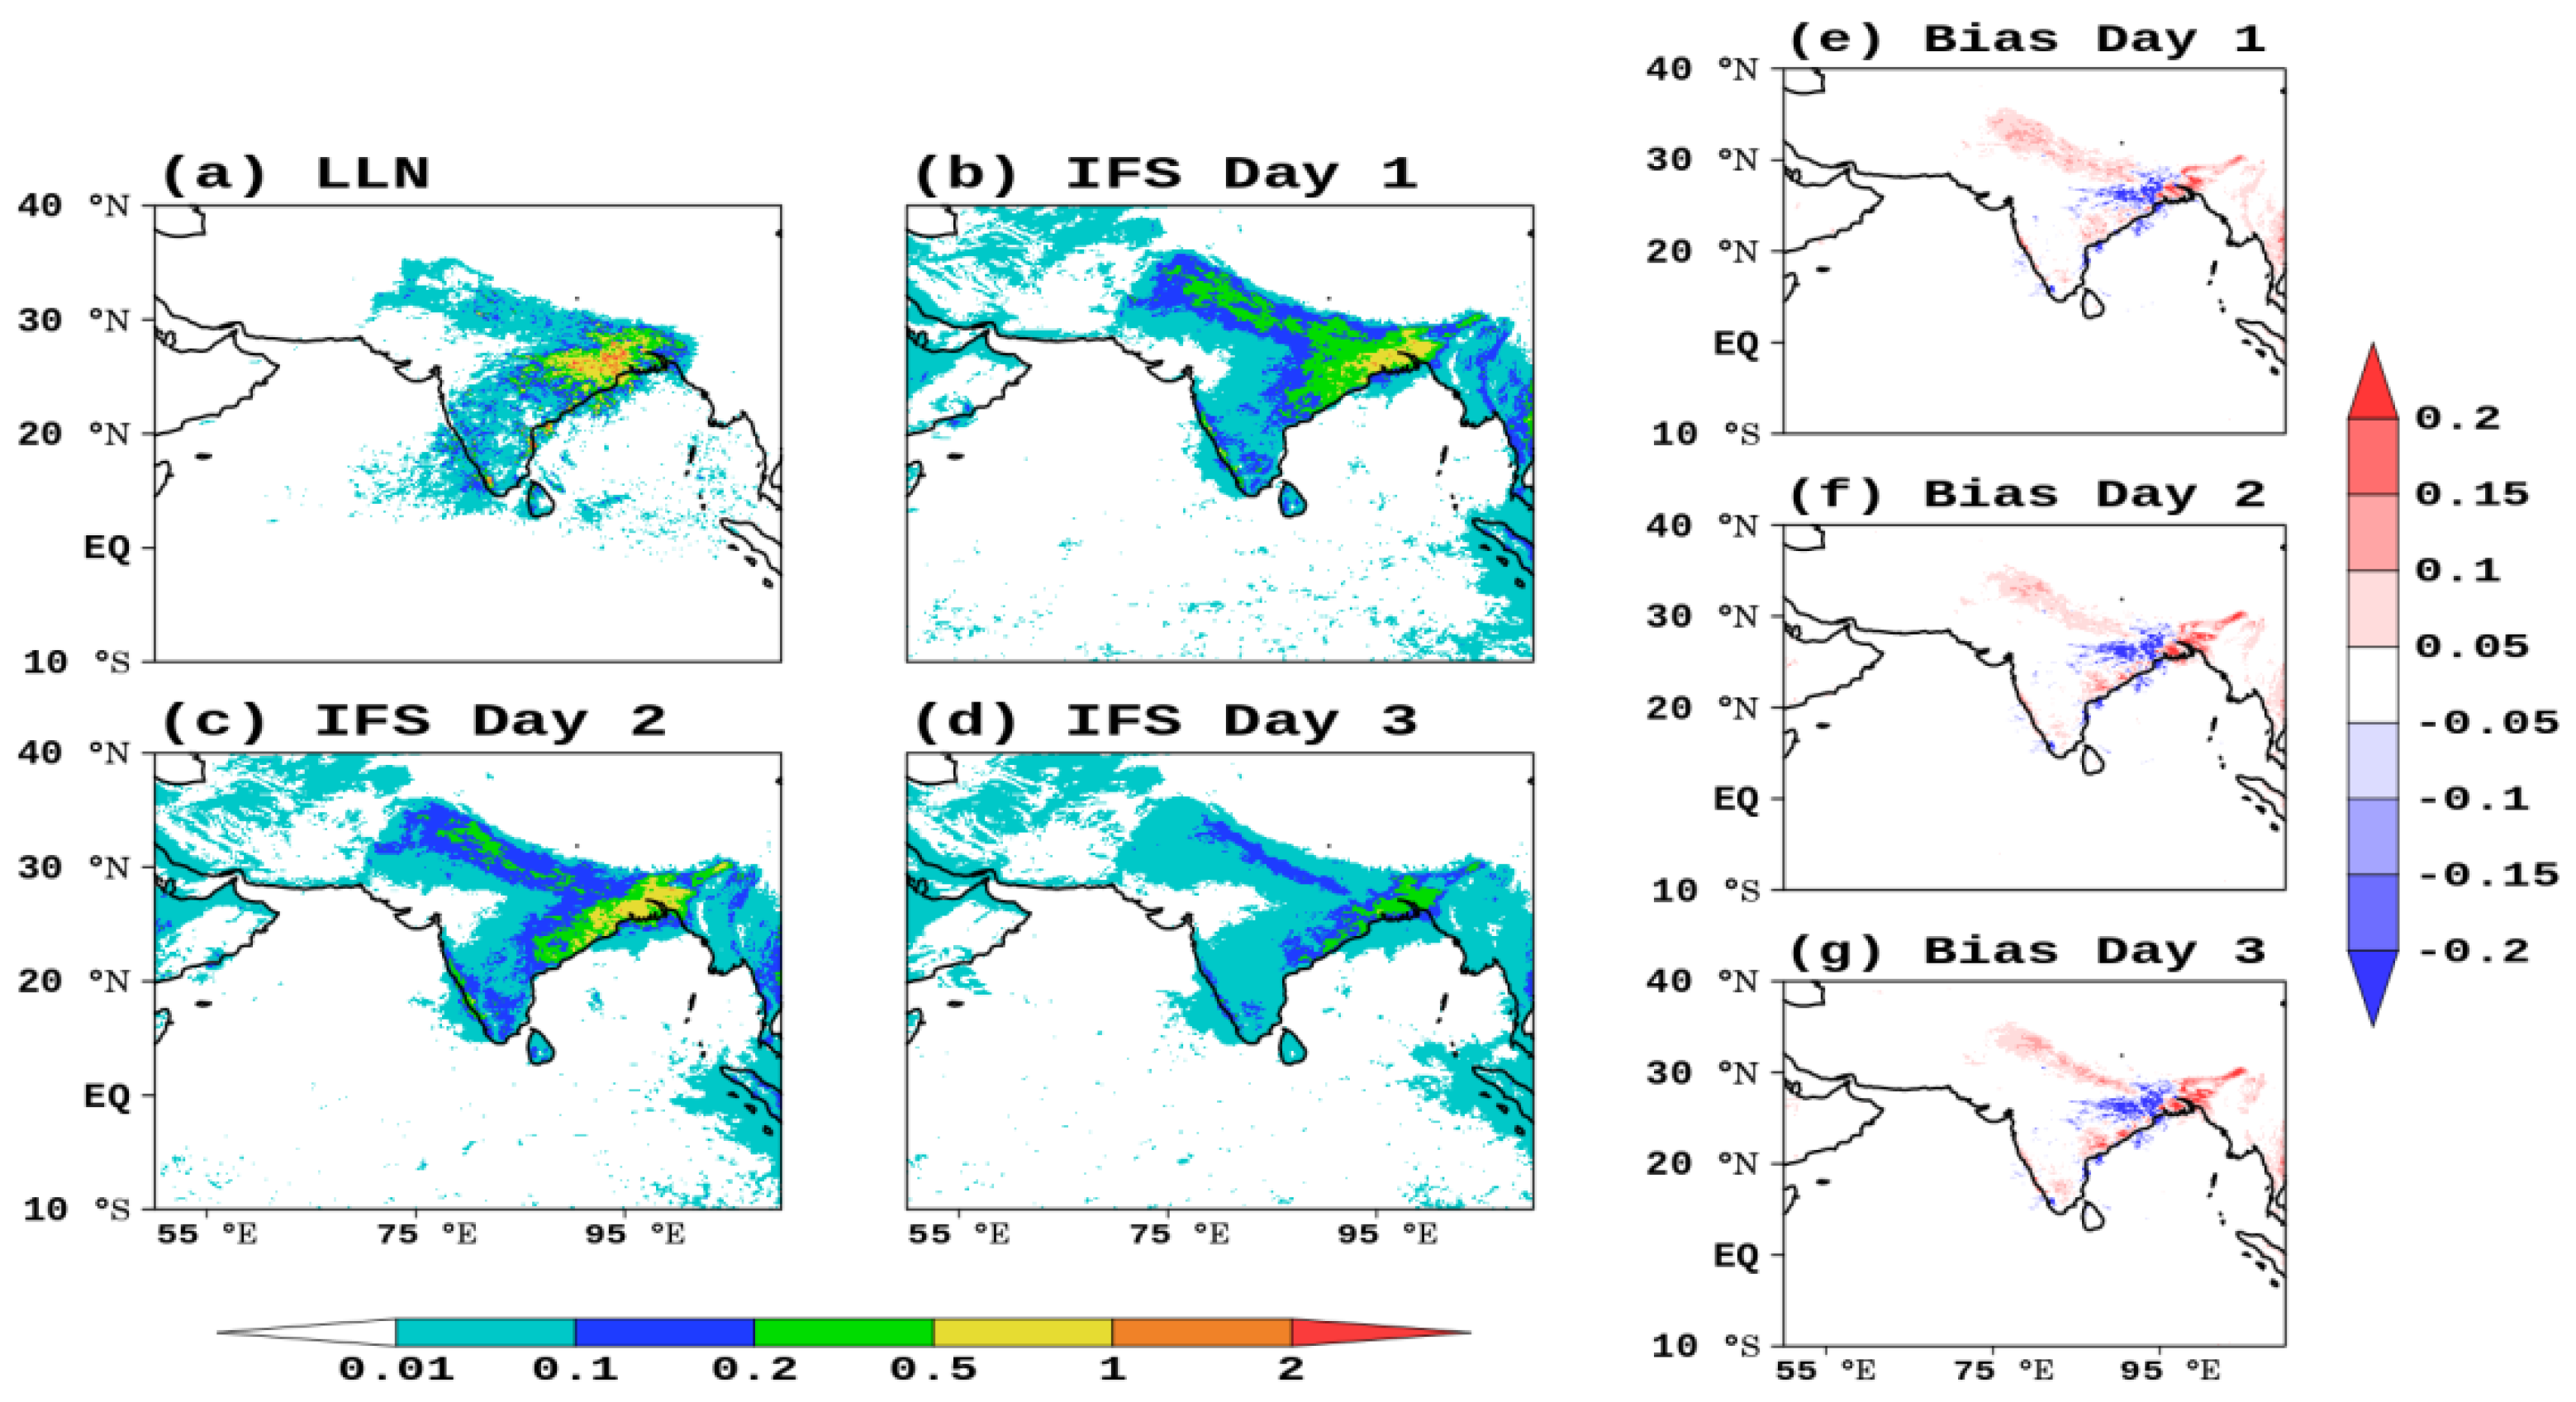
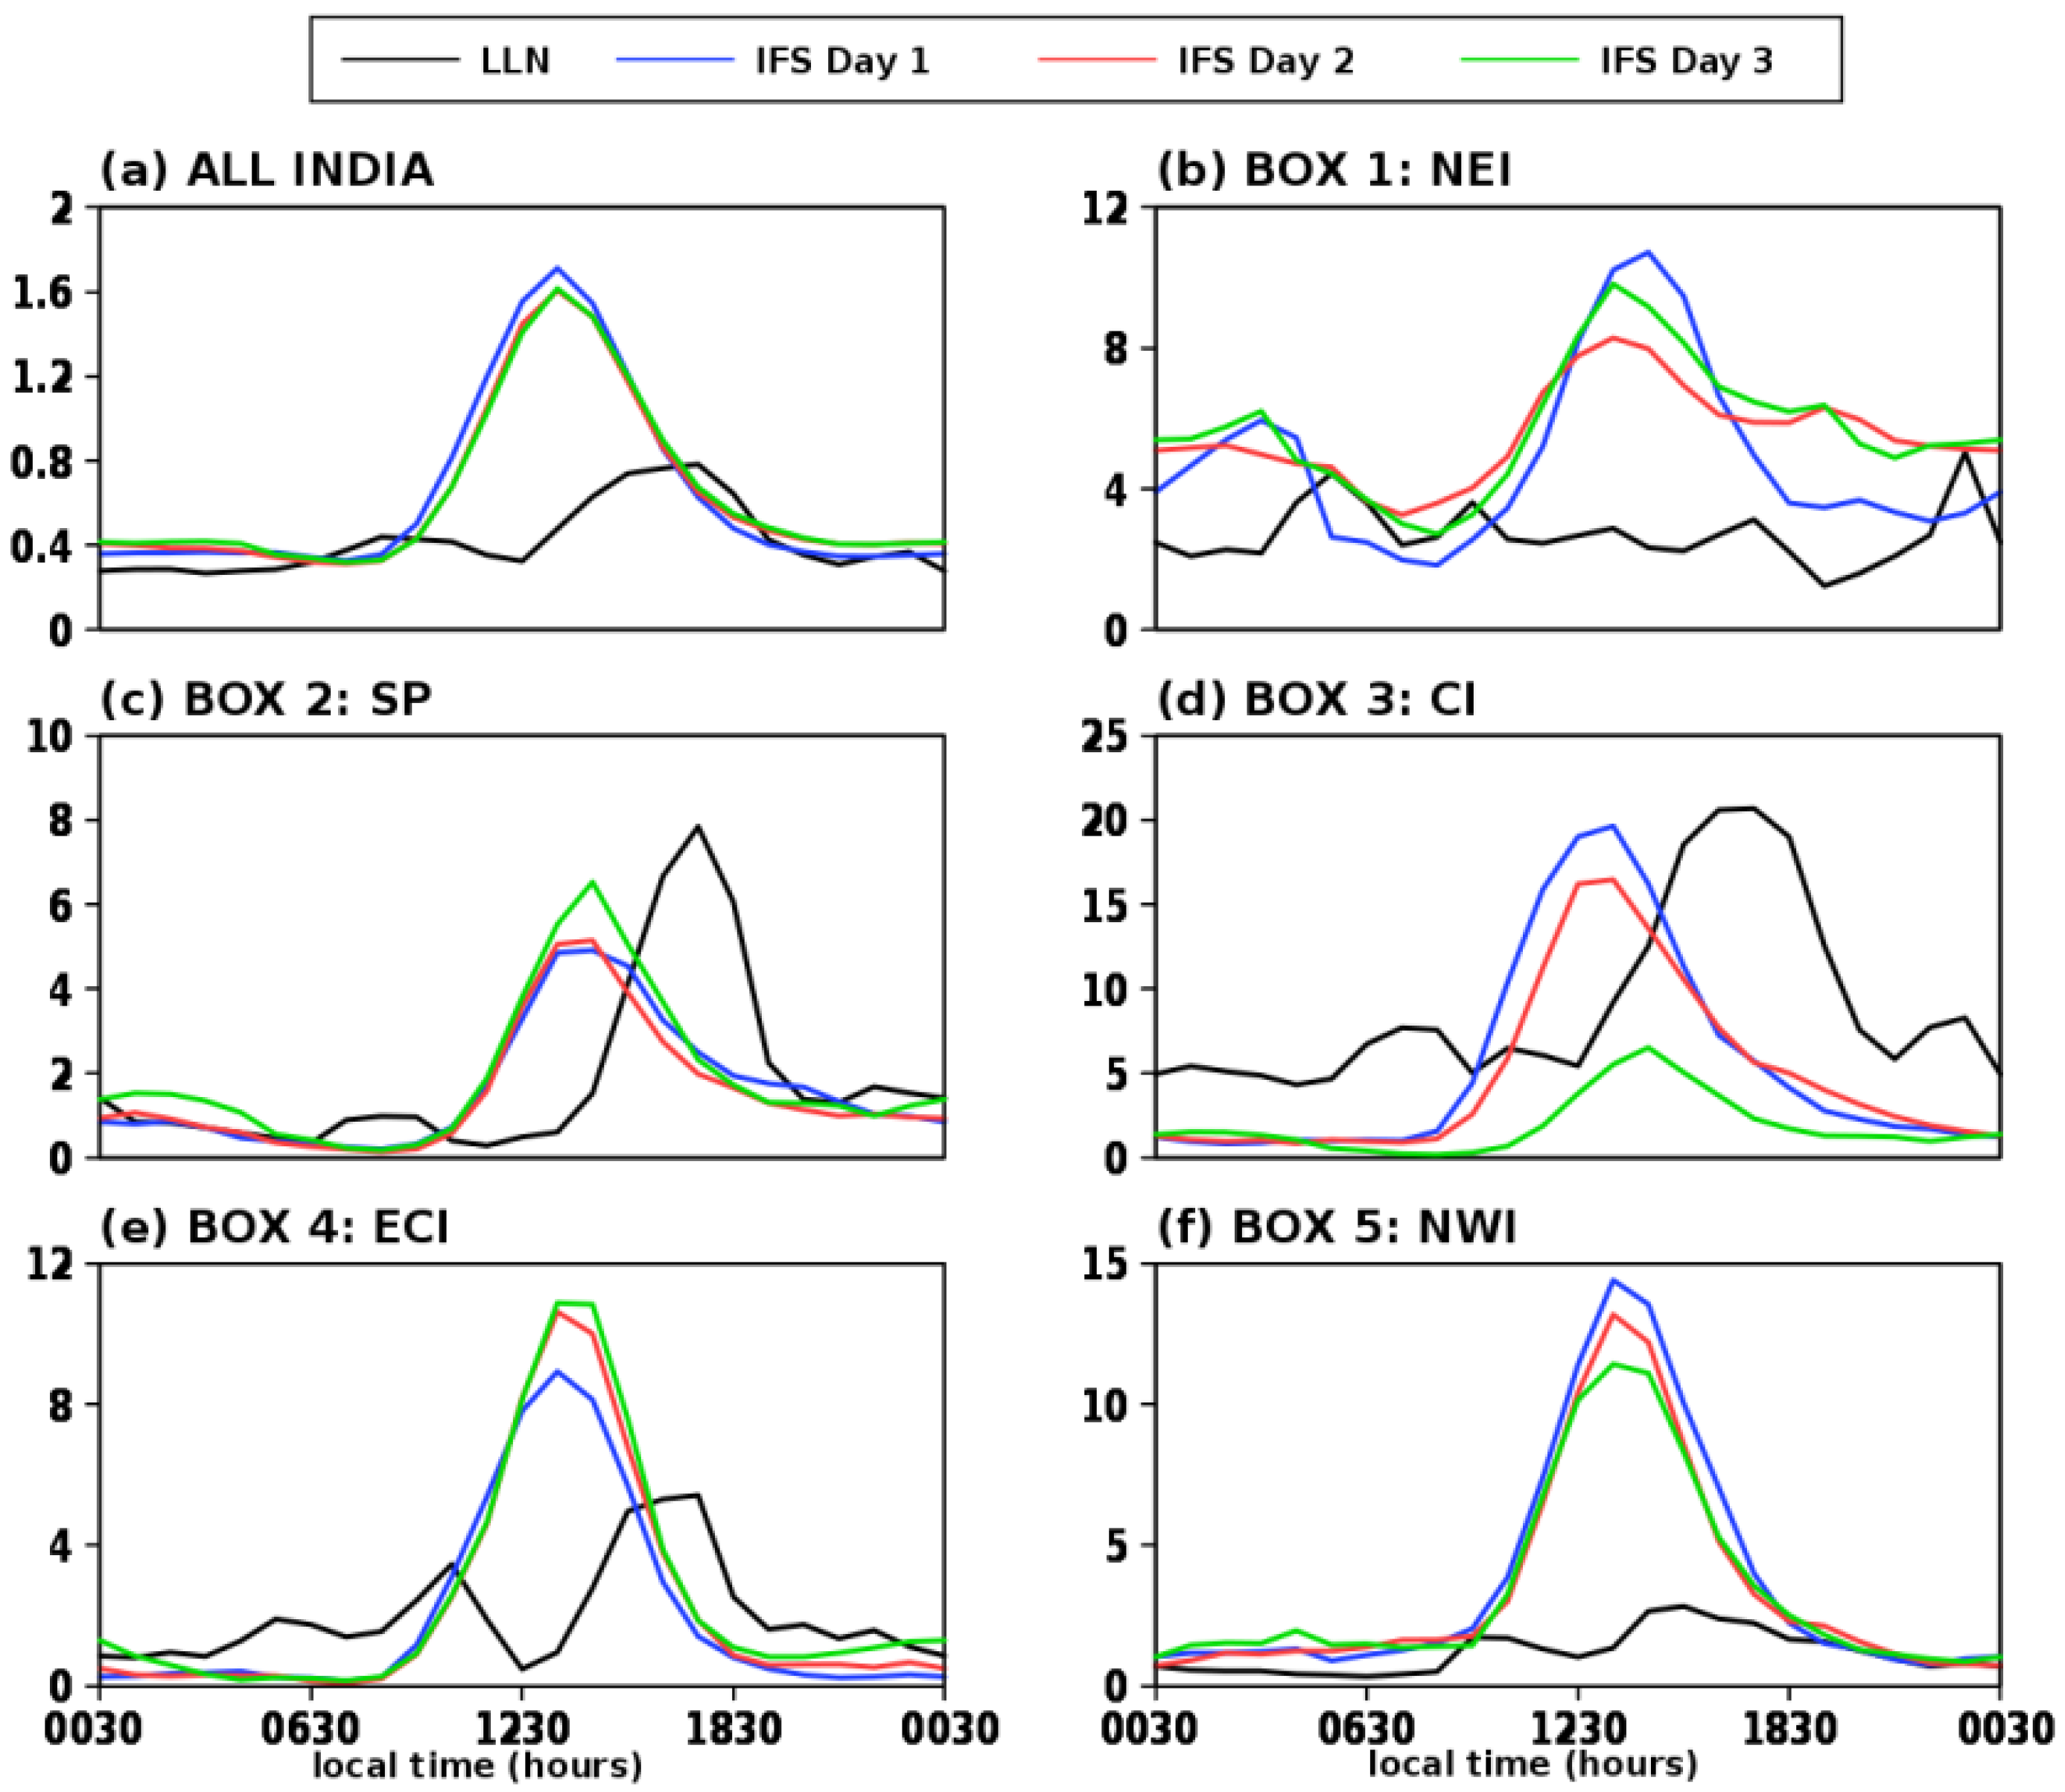
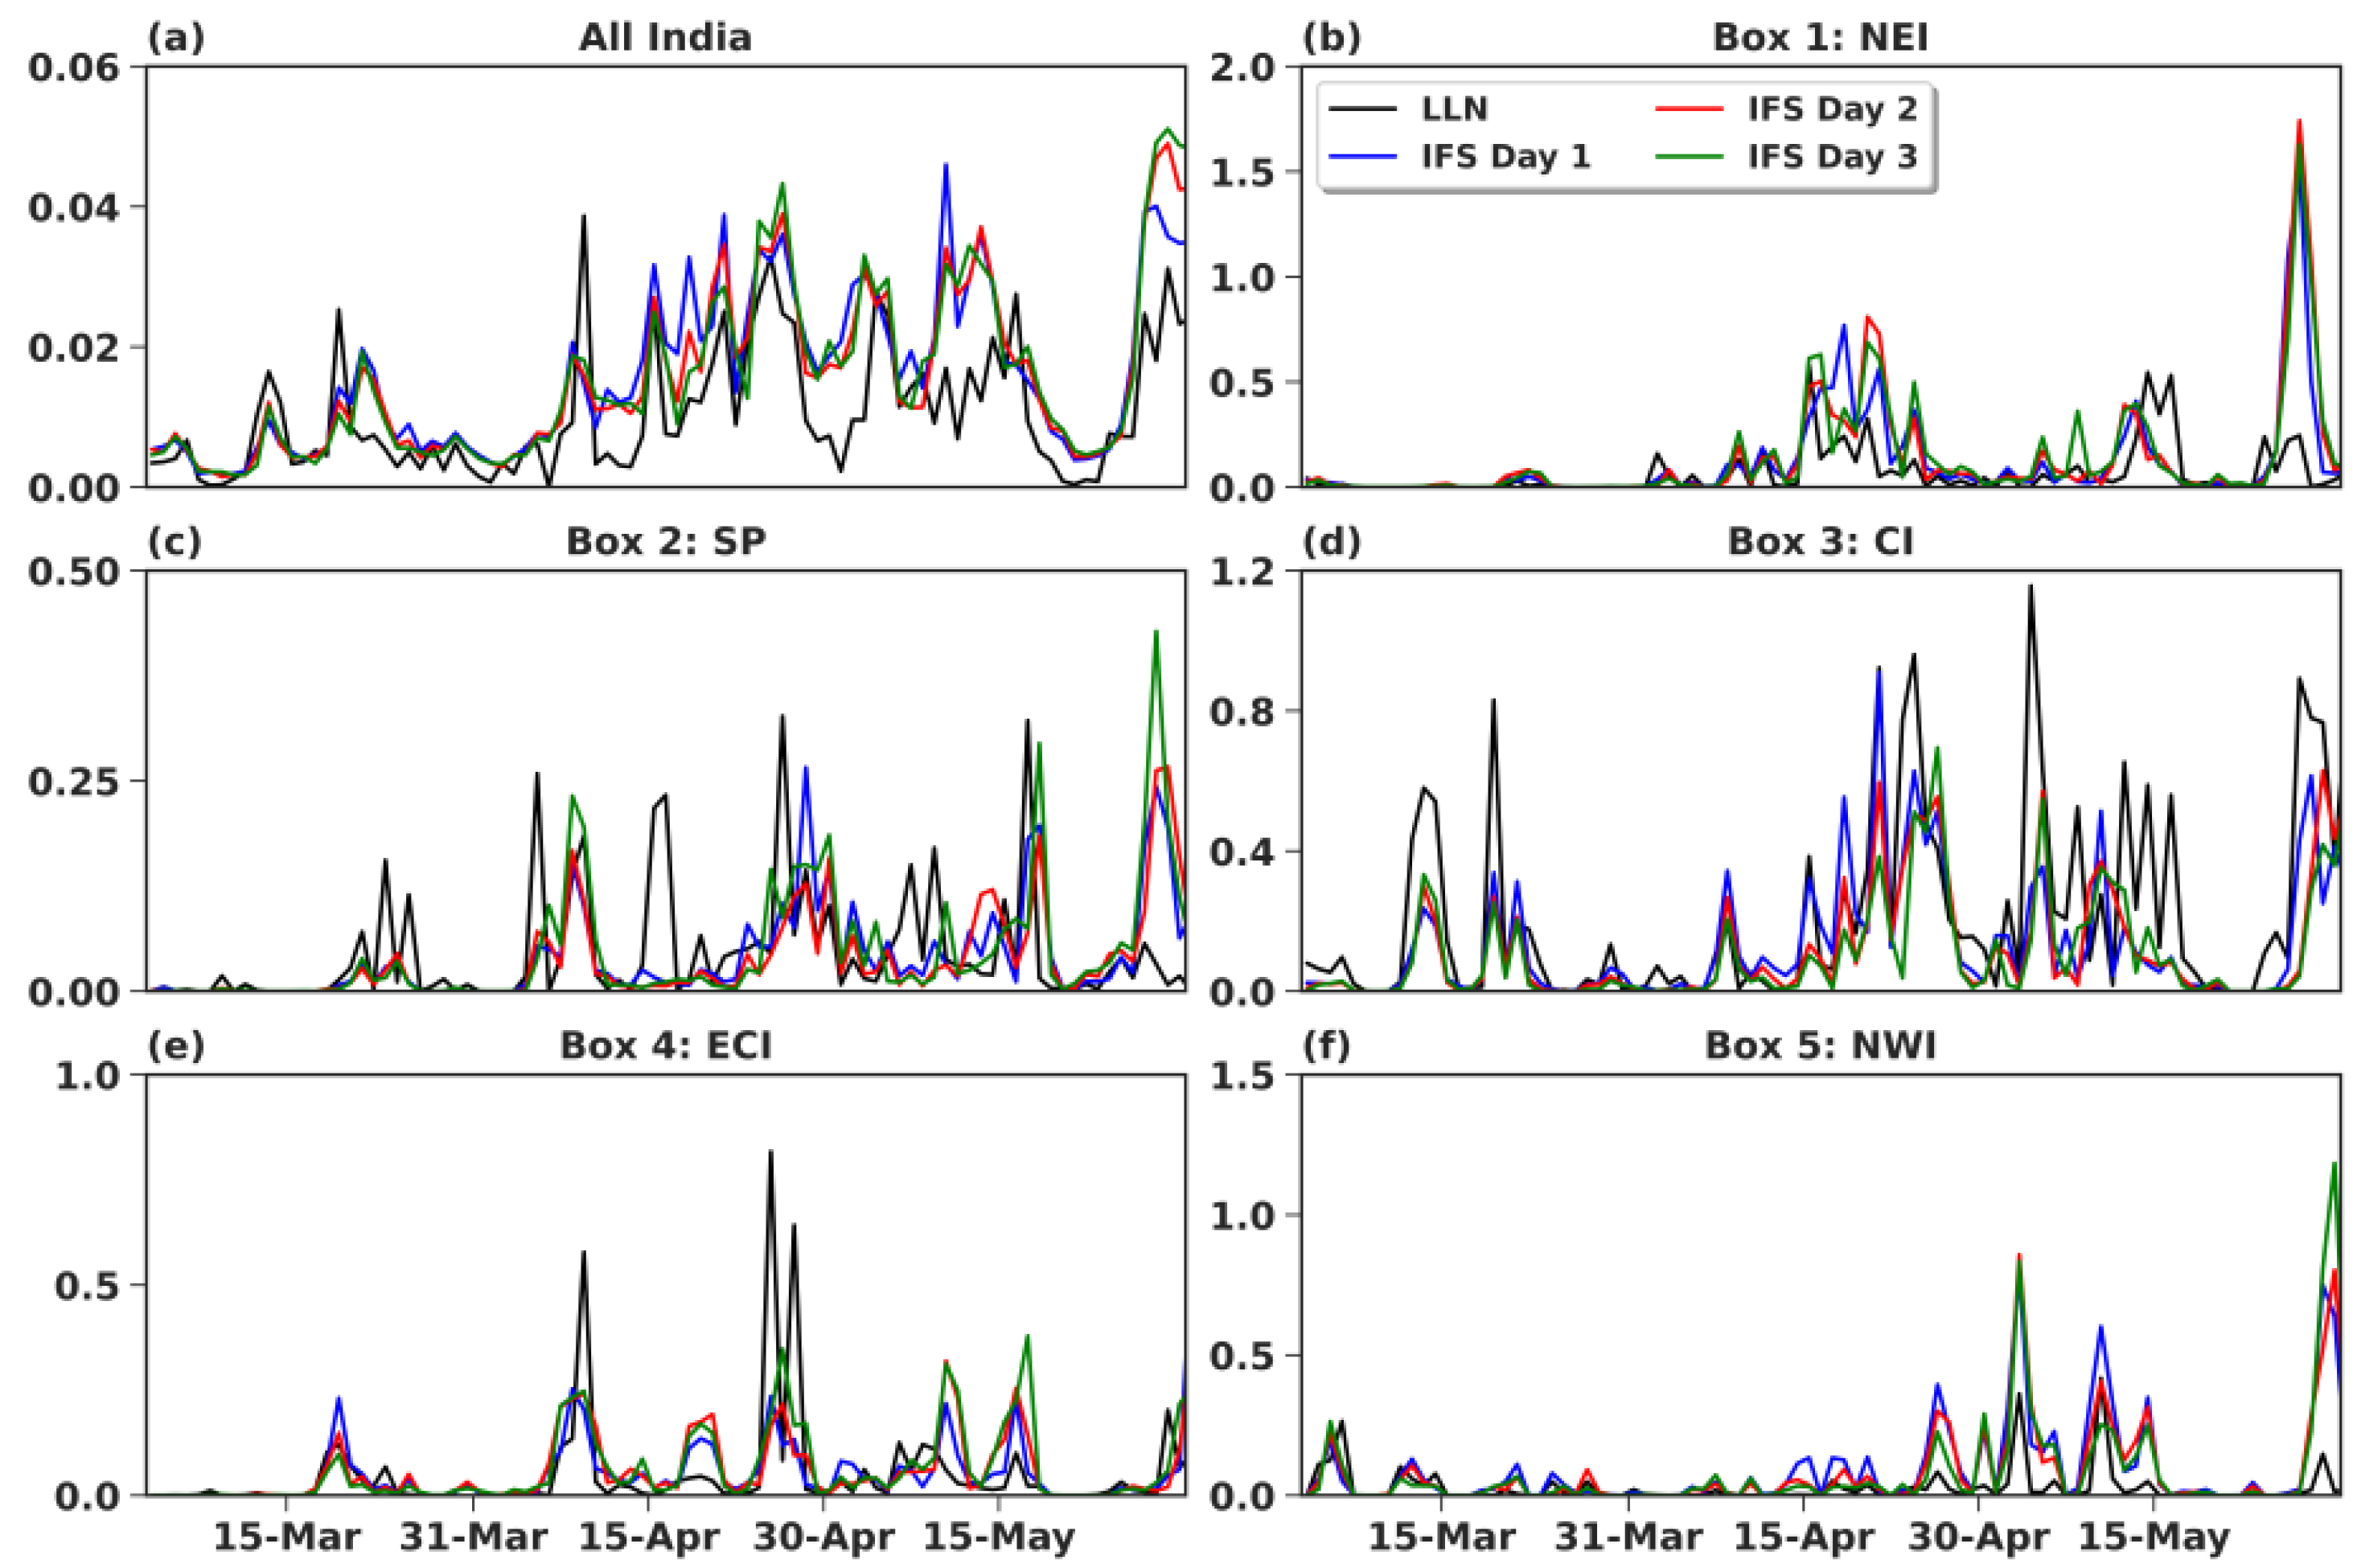
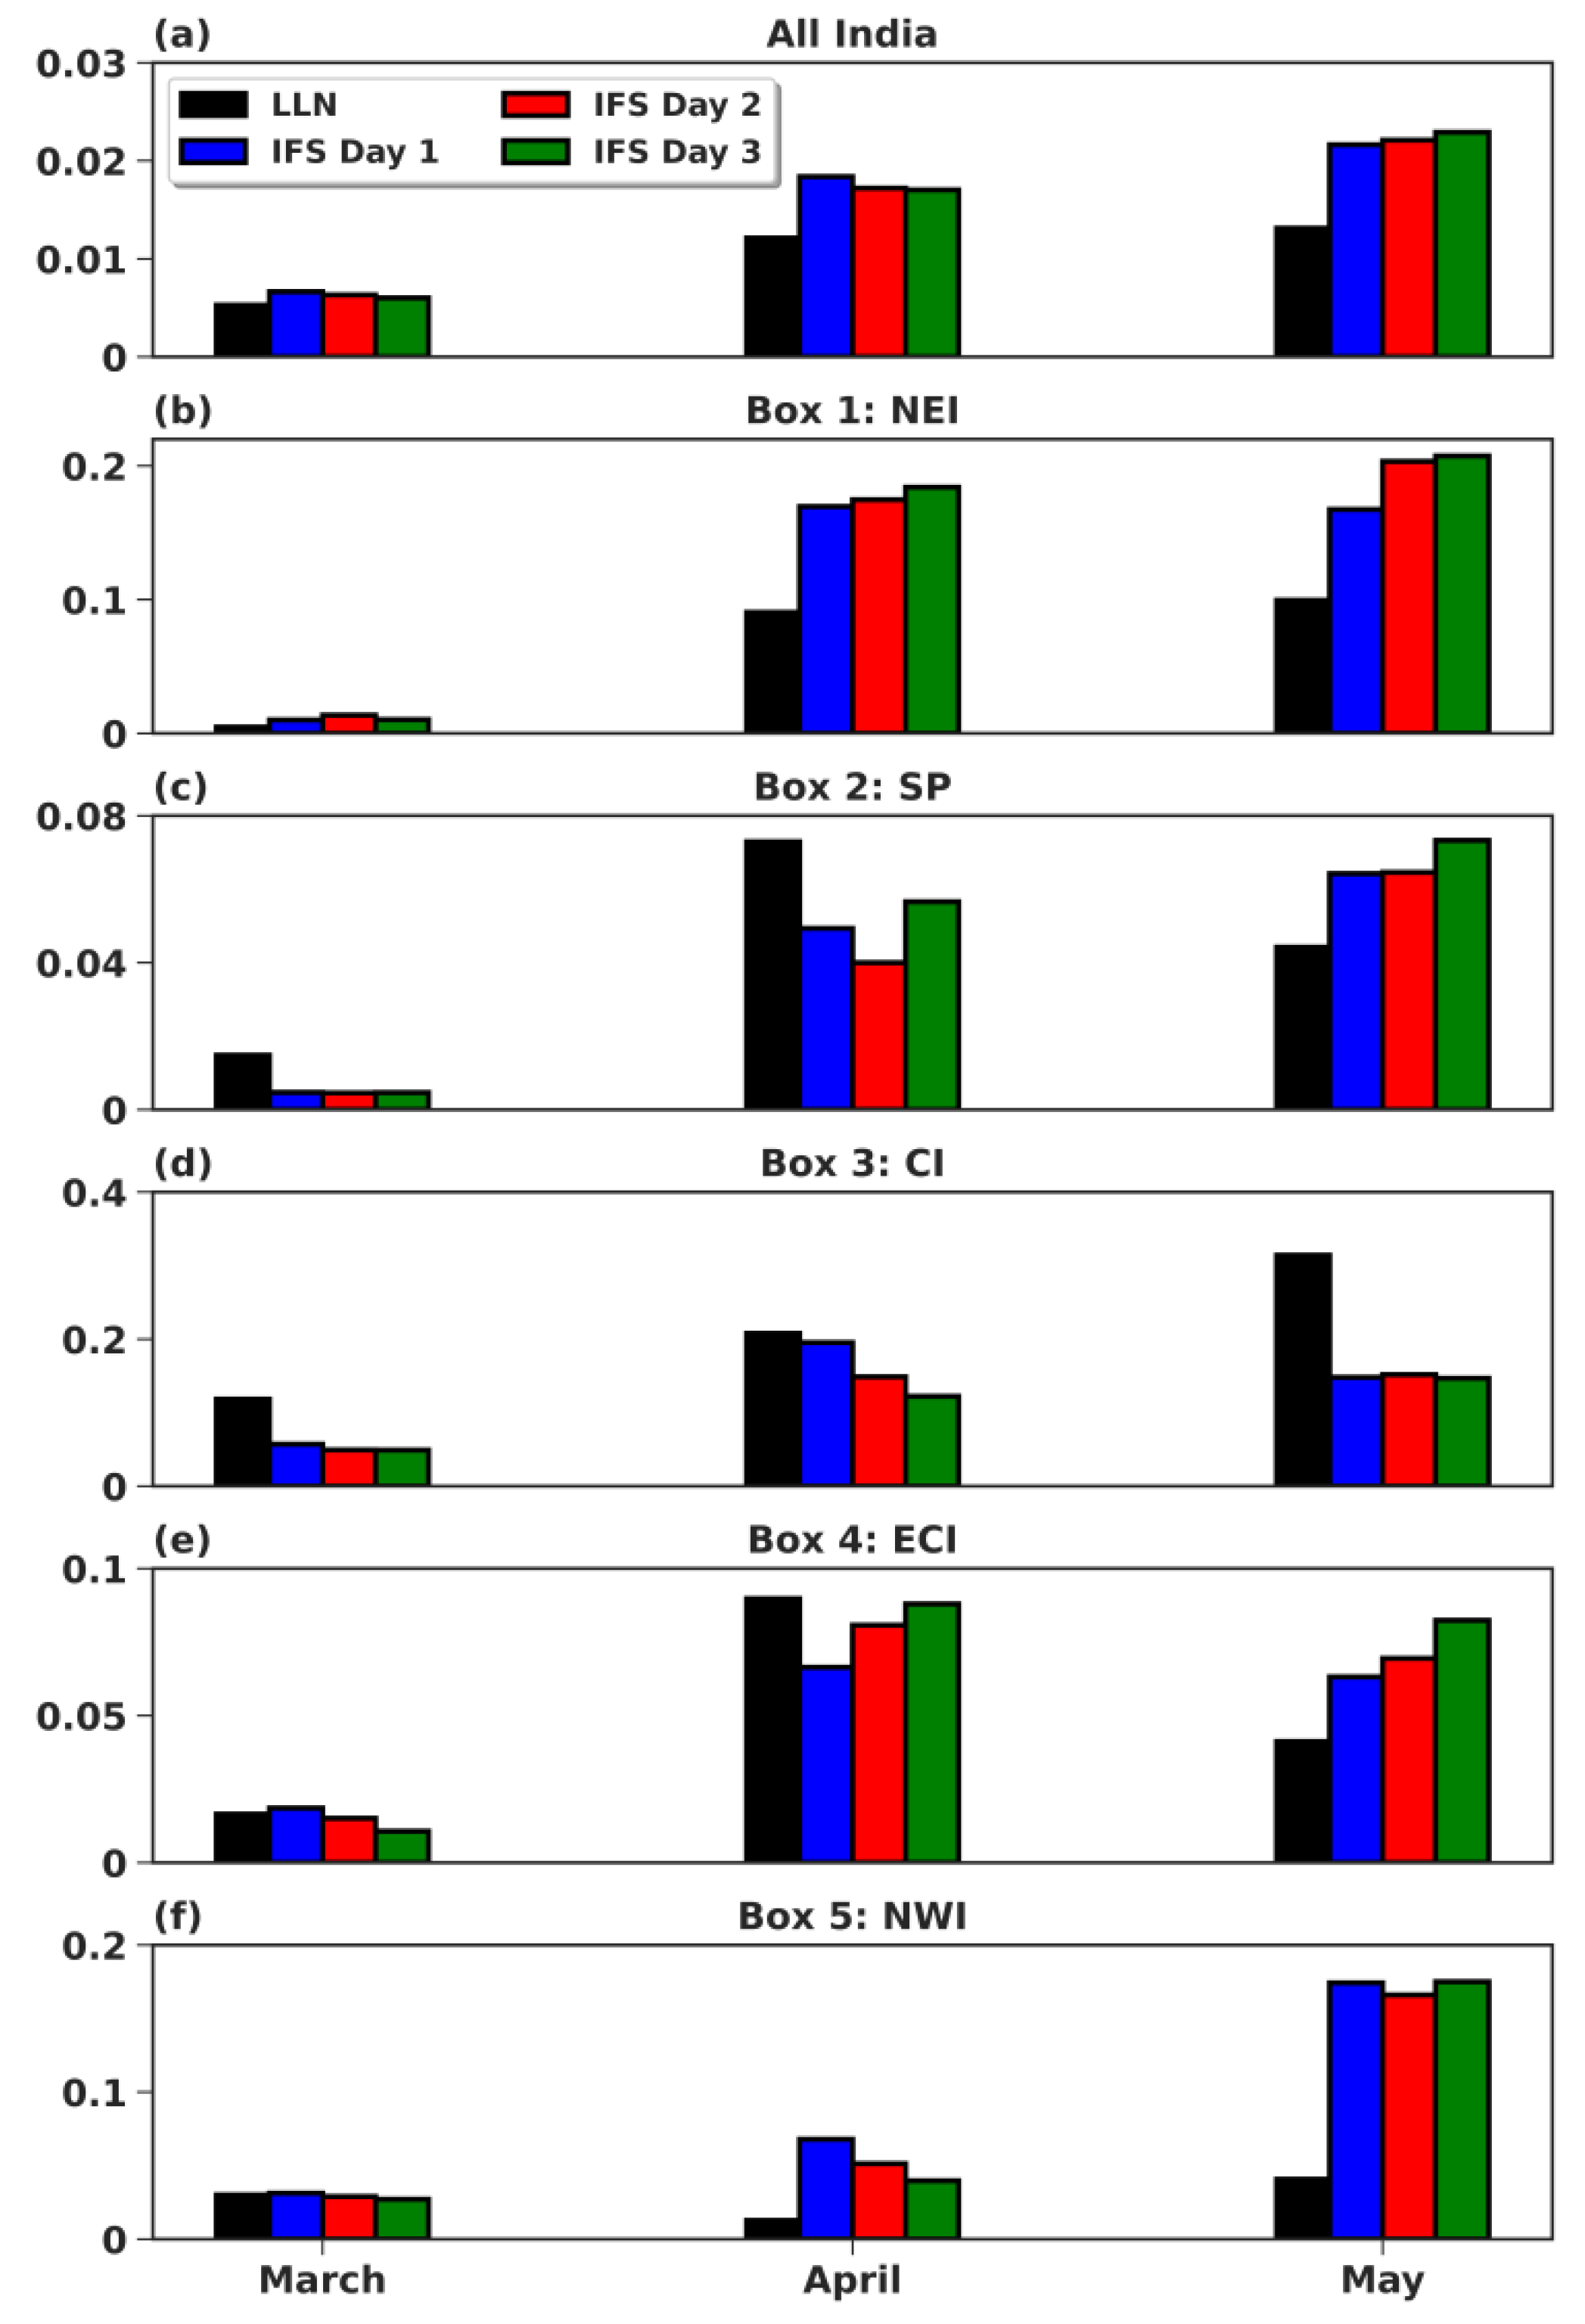
3.2. Evaluation of IFS Lightning Forecast

In Figure 4, the mean lightning flash density is plotted for (a) the LLN observations, (b) IFS Day 1, (c) Day 2, and (d) Day 3 lead times, respectively, along with the bias between LLN and IFS forecast for (e) Day 1, (f) Day 2, and (g) Day 3 lead times. The figure shows that the IFS lightning forecasts capture the pre-monsoon lightning-prone regions rather well. However, there is positive bias along with the Himalayan foothills and a negative bias over eastern India. With increasing lead time, over-estimation across Himalayan foothills decreases while under-estimation over eastern India increases.
Figure 5 shows the mean diurnal variation of lightning density over (a) all India and over (b)–(f) the thunderstorm-prone regions, as indicated in Figure 1. The diurnal variation of lightning usually exhibits a distinct peak during the local afternoon, as can be seen in Figure 5, where LLN lightning peaks after 15:00 local time for all regions except for Northeast India (Figure 5b), as thunderstorms in this region are mostly orographically initiated. The IFS lightning diurnal cycle follows the observed diurnal cycle, albeit with a two to three hours lead for all three forecast days, consistent with the 2–3 h lead in forecast convective precipitation compared to rainfall observations [37]. Furthermore, for the NWI and ECI regions, the observations indicate a double peak in lightning which is not present in the forecasts. For different lead time, the diurnal variation of lightning does not have noticeable differences over all India and all thunderstorm regions, except CI region where Day 3 forecast underperforms compared to Day 1 and Day 2 forecast.
Figure 6 shows the time series of the average daily lightning flash density over (a) all India and over (b)–(f) five thunderstorm-prone regions during MAM 2020. The model reasonably reproduces the day-to-day lightning variations over all India for all forecast lead times, while some of the daily fluctuations are missed in the forecasts when the subregions are considered.
In Figure 7, we have plotted the total monthly flash density over (a) all India and over (b)–(f) five thunderstorm-prone regions. All India, along with NEI and CI, shows an increasing trend with months, with lightning peaking in May. In April, the mean flash density observed by LLN is maximum over the SP and ECI regions but lowest over the NWI region. IFS performs best in March, with more considerable differences between observation and forecast in April and May. In May, the model positive bias increases with increasing lead time for all India, NEI, SP and ECI regions while over NWI the positive bias is less affected by increasing lead time. On the contrary, over CI region IFS forecast underperformes independent of model lead time.

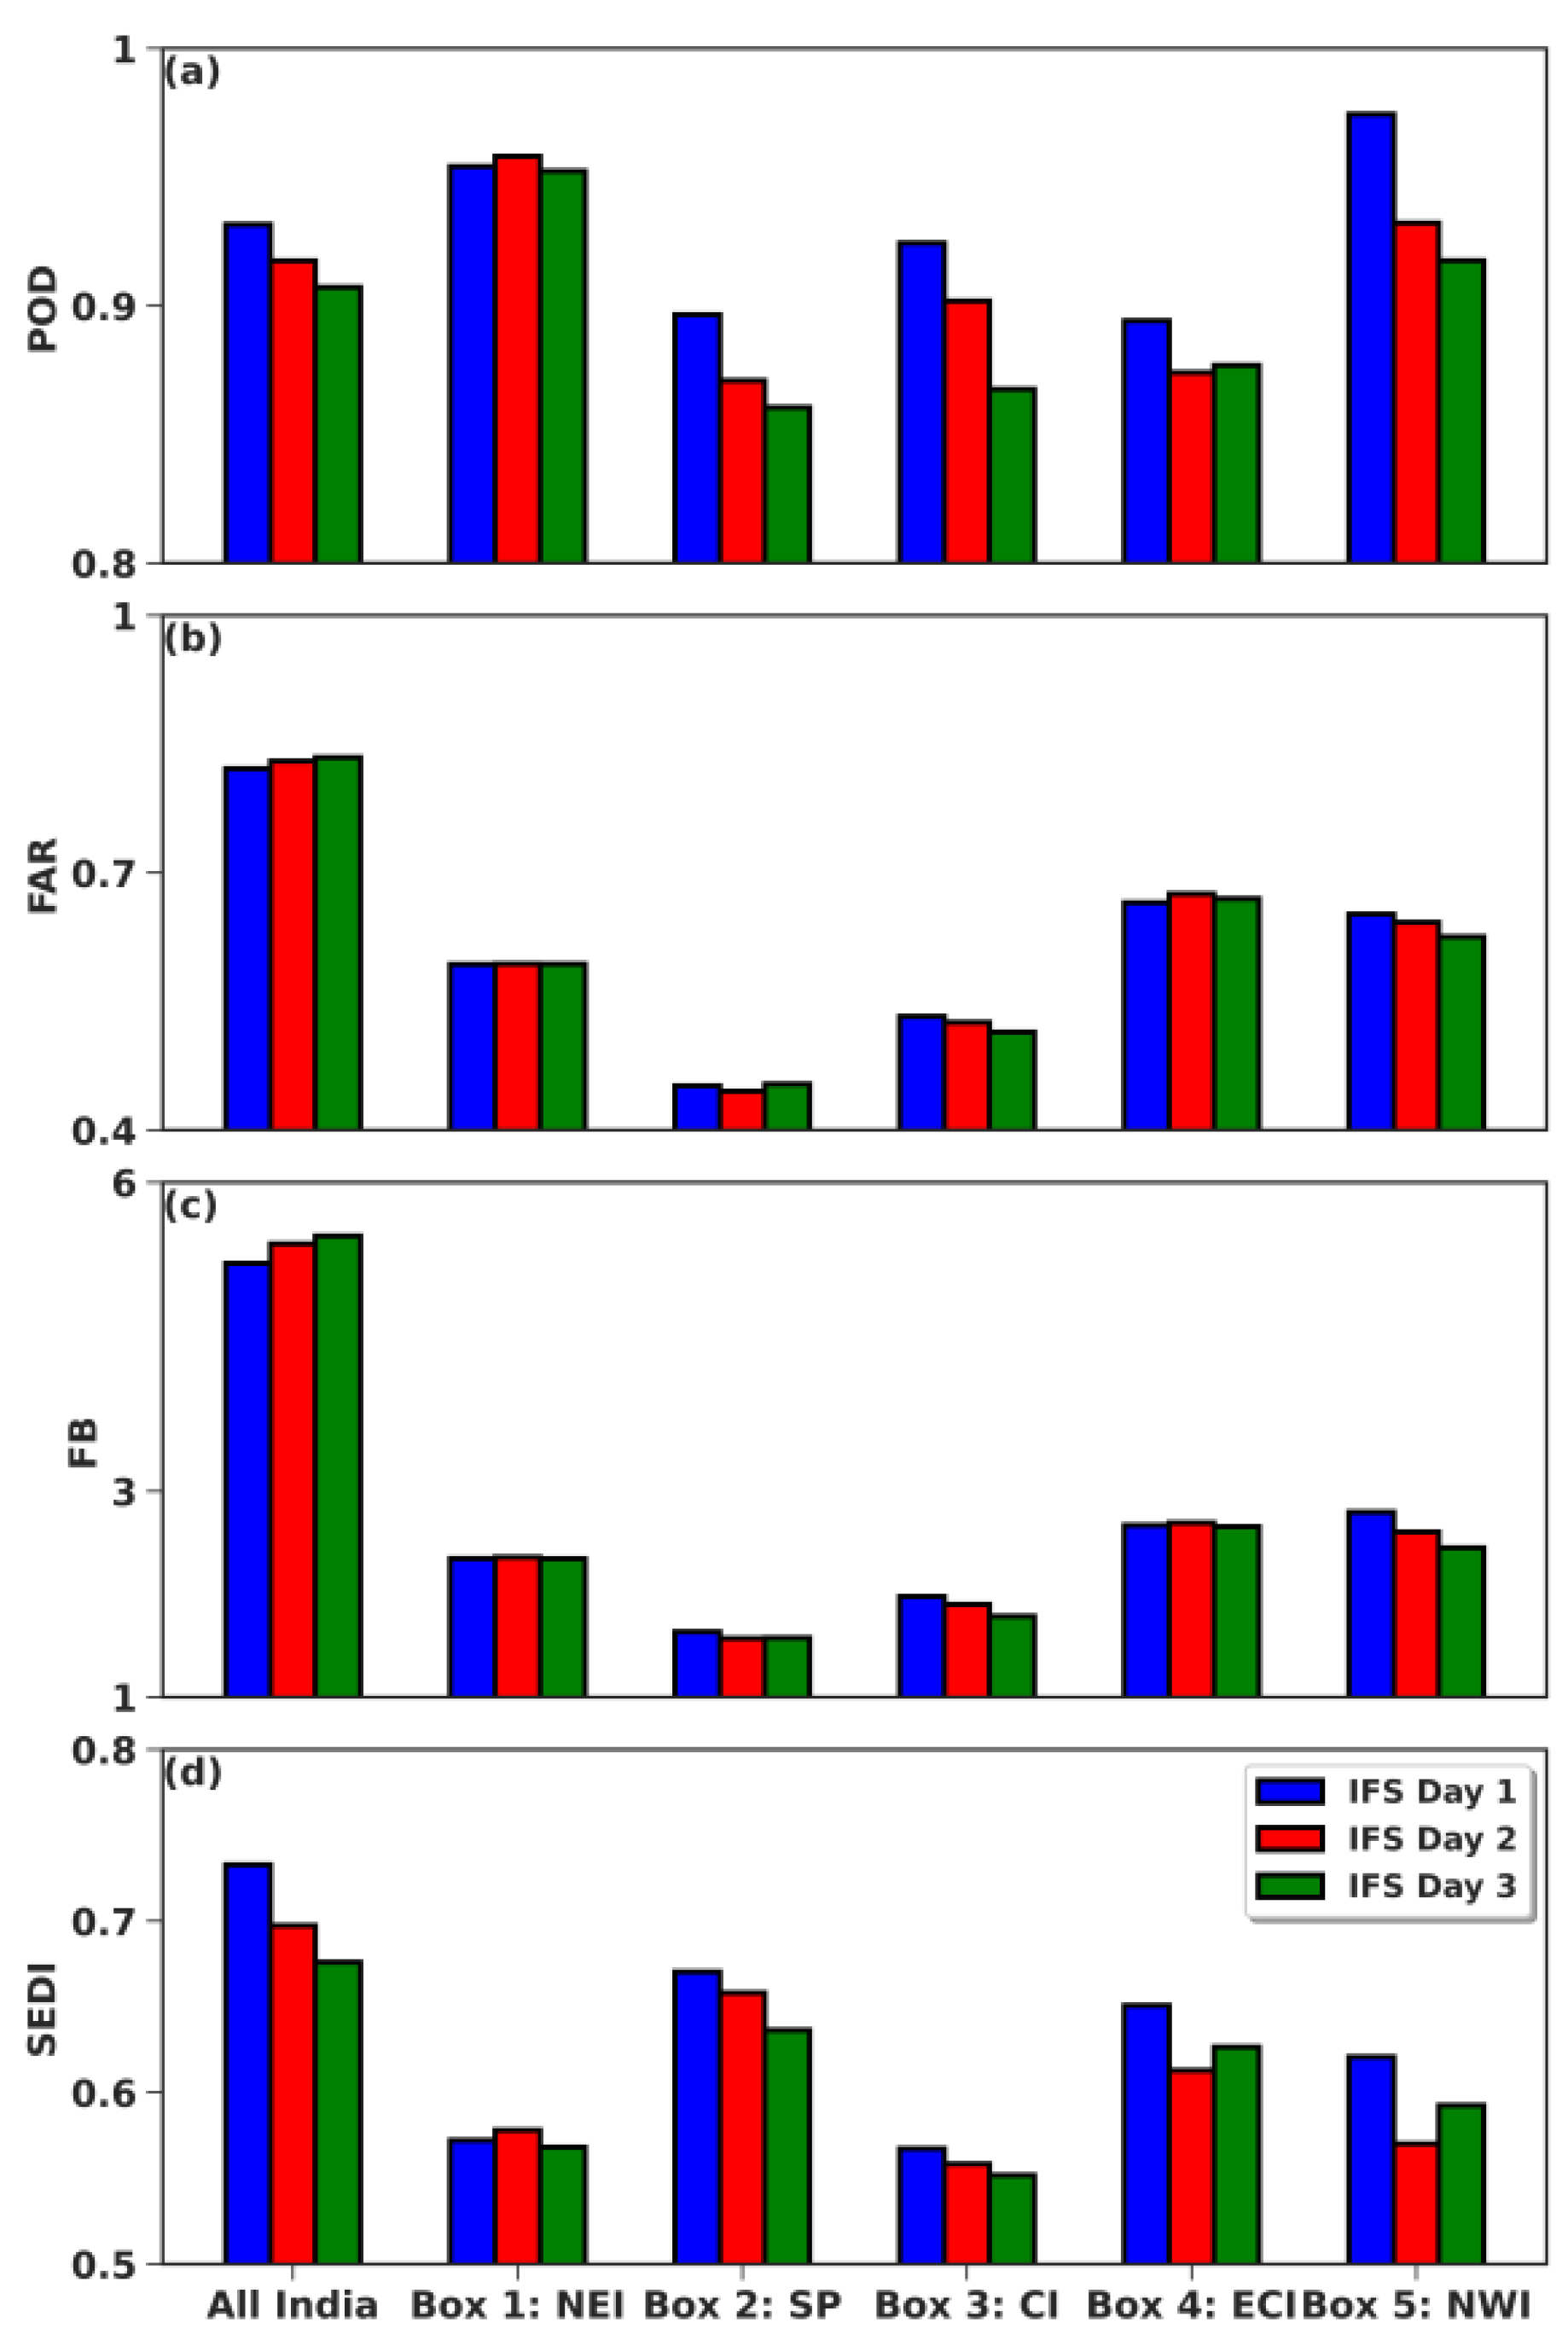
3.3. IFS Lightning Forecast Verification

For further quantitative evaluation, skill score analysis has been performed. Since the IITM LLN sensors and IFS grid points may not coincide, we have binned both the observed and forecasted data into 0.3° × 0.3° boxes. For each day and for both observation and forecasted data, if the total lightning flash density is greater than zero in one bin, we denote it as ‘yes’ and ‘no’ if the total lightning in a bin is zero. The corresponding contingency table [33] is illustrated in Table 1.
We have then calculated four skill scores using the contingency table to evaluate the forecast for Day 1, Day 2, and Day 3 lead times (Table 1). The skill scores are POD, FAR, Bias score or Frequency Bias (FB), and SEDI. POD, or probability of detection, is defined as the ratio of the number of correct forecasts to the total number of events,
POD = hits hits + misses ,
FAR, or false alarm ratio, is defined as the ratio of false alarms to the total number of non-occurrence of the event or the conditional relative frequency of a wrong forecast given that the event does not occur,
FAR = false   alarms hits + false   alarms ,
FB or frequency bias, also know as Bias score or simply Bias, is defined as,
FB = hits + false   alarms hits + misses .
FB is the ratio of the number of yes forecasts to the number of yes observations. FB > 1 indicates over-forecasting, where the event has been forecasted more than it is observed, FB < 1 is under-forecasting, where the event is forecasted less often than it has been observed, and FB = 1 is an unbiased forecast, where an equal number of events have been forecasted and also been observed.
SEDI, or the Symmetric Extremal Dependence Index, is defined as [50],
SEDI = ln F ln H + ln ( 1 H ) ln ( 1 F ) ln F + ln H + ln ( 1 H ) + ln ( 1 F ) ,
with H being the hit rates or POD and F being the False alarm rate or probability of false detection, defined as,
F = false   alarms true   negative + false   alarms .
SEDI has been defined as assessing rare or extreme events and is resistant to ‘hedging’ or biases in forecasts. SEDI is independent of the base rate and ranges between [−1, 1]. As the forecasted events become more random, SEDI reaches 0.
The skill score analysis summarized in Figure 8 shows that, for all three forecast lead days, the probability of detection is over 0.8 for all regions, including all India, indicating that IFS can accurately forecast 8 out of 10 observed lightning events, which is also supported by the low false alarm ratio, especially over thunderstorm-prone regions. FB > 1 for all regions indicates that IFS forecasts more lightning events than observed ones. SEDI shows values > 0 for all cases, indicating that the forecast is not random and has a positive skill that decreases with increasing lead time over most regions.

4. Summary

During the pre-monsoon, India experienced extensive thunderstorms and enhanced lightning activity, specifically in the northeastern parts of the country, followed by the northwestern and southern peninsula (Figure 2). Mean moisture, surface and upper-level winds, and the sheared atmosphere in the lower level create favorable conditions for these thunderstorms, which are supported by high positive values of VIMFC, high CAPE, and low CIN (Figure 3). These meteorological conditions support high lightning occurrences throughout the season.
IITM LLN, since its inception, has played a crucial role in the development of real-time lightning warning systems in India. With over 80 sensors (Figure 1) across the nation, IITM LLN is also crucial for forecast evaluation, which will help further development of early warning systems for lightning. For the first time, IITM LLN has been used to verify lightning forecasts from a global operational forecasting system over India—ECMWF IFS—which includes a lightning parameterization [36] capable of predicting total lightning flash density with a lead time of 15 days. This paper has analyzed lightning events over the Indian subcontinent during the 2020 pre-monsoon season, focusing on five thunderstorm-prone regions. Despite positive bias along the Himalayan foothills and negative bias over eastern India, the IFS forecasts can capture the spatial structure of the mean lightning flash density for MAM 2020 (Figure 4).
During the pre-monsoon seasons, thunderstorms over many parts of the country reach their mature stage in the afternoon except in the northeast region, where the thunderstorms occur primarily between midnight and early morning. The diurnal variation of lightning closely follows this. The IFS-forecasted primary lightning peak could be seen 2 to 3 h ahead of observations during the day, corresponding to an early onset of convective precipitation [37]. Furthermore, the model has difficulties representing the double daily peak of lightning flash density as observed over the east coast of India (Figure 5). We further investigated the daily variations of observed and forecasted lightning flash densities. The day-to-day variations of forecasted lightning agree well with the observed fluctuations, especially when averaged over larger basins. In the observations, lightning instances gradually increase from March to May, with lightning values peaking in May over all India except for the southern peninsula and northwest India, where the maximum total lightning peaks in April. The IFS forecast captures the monthly trend of total lightning flash density overall well in all regions, except the southern peninsula.
We have also calculated statistical skill scores to quantitatively analyze the forecast using a statistical contingency table. The main intention of this statistical analysis is to assess how well IFS can predict 1 to 3 days in advance whether a location will be hit by lightning or not. The POD values show that IFS can correctly predict 80% of thunderstorm events nationwide. The rate of false alarms is lower in thunderstorm-prone regions than in all India. The IFS is also found to over-predict the frequency of lightning events over all India and the five thunderstorm-prone regions.
Since, the relative frequency or the ratio of number of grid points that has observed lightning to total number of available grid points (or sample size; Table 1) converges to zero, we have plotted the SEDI score [42], which is independent of the relative frequency. SEDI score (Figure 8d) indicates that the forecast model can predict lightning with sufficient high skill over all regions.
Overall, the analysis shows that a 9 km global forecasting model, using a convective parameterization scheme and a coupled lightning parameterization, is able to produce a lightning forecast with a 3-day lead time that has a 90% success rate. We consider this to be a substantial step toward an early lightning warning system for India.

Author Contributions

Conceptualization, R.S., P.M., P.B. and P.L.; methodology, R.S., P.M., P.B. and P.L.; software, R.S.; validation, R.S., P.M., P.B., P.L. and S.D.P.; formal analysis, R.S., P.M., P.B., P.L., S.D.P. and K.C.; investigation, R.S., P.M., P.B. and P.L.; resources, P.B., P.L. and S.D.P.; data curation, R.S., P.M., P.B., P.L., S.D.P. and K.C.; writing—original draft preparation, R.S., P.M., P.B. and P.L.; writing—review and editing, P.M., P.B. and P.L.; visualization, R.S.; supervision, P.M.; project administration, P.M.; funding acquisition, Not applicable. All authors have read and agreed to the published version of the manuscript.

Funding

This research received no external funding.

Institutional Review Board Statement

Not applicable.

Informed Consent Statement

Not applicable.

Data Availability Statement

No new data were created or analyzed in this study. Data sharing is not applicable to this article.

Acknowledgments

Integrated Forecasting System (IFS) is run by European Centre for Medium-Range Weather Forecasts (ECMWF). IITM LLN has provided lightning observation data. ERA5 data are available on the Copernicus Climate Change Service (C3S) Climate Data Store [47]. We acknowledge NASA Global Hydrology Resource Center for providing access to the LIS/OTD lightning [38]. We also express our gratitude towards IITM and DST-INSPIRE for their resources and financial support. This study is a part of the Ph.D. thesis of Rituparna Sarkar.

Conflicts of Interest

The authors declare no conflict of interest.

References

  1. Das, S. Severe Thunderstorm Observation and Modeling—A Review. Vayu Mandal. 2017, 43, 1–29. [Google Scholar]
  2. Mukhopadhyay, P.; Mahakur, M.; Singh, H.A.K. The interaction of large scale and mesoscale environment leading to formation of intense thunderstorms over Kolkata Part I: Doppler radar and satellite observations. J. Earth Syst. Sci. 2009, 118, 441–466. [Google Scholar] [CrossRef]
  3. Mukhopadhyay, P.; Sanjay, J.; Singh, S.S. Impact of resolution and vertical coordinate on ETA model forecast over Indian region. J. Ind. Geophys. Union 2003, 7, 201–211. [Google Scholar]
  4. Müller, R.; Haussler, S.; Jerg, M.; Heizenreder, D. A novel approach for the detection of developing thunderstorm cells. Remote Sens. 2019, 11, 443. [Google Scholar] [CrossRef]
  5. Gaskell, W.; Illingworth, A.J. Charge transfer accompanying individual collisions between ice particles and its role in thunderstorm electrification. Q. J. R. Meteorol. Soc. 1980, 106, 841–854. [Google Scholar] [CrossRef]
  6. Mason, B.J. On the generation of charge associated with graupel formation in thunderstorms. Q. J. R. Meteorol. Soc. 1953, 79, 501–509. [Google Scholar] [CrossRef]
  7. Williams, E.; Montanyà, J. A closer look at lightning reveals needle-like structures. Nature 2019, 568, 319–320. [Google Scholar] [CrossRef]
  8. Cooper, M.A.; Holle, R.L. Current Global Estimates of Lightning Fatalities and Injuries; Springer Natural Hazards; Springer: Cham, Switzerland, 2019; pp. 65–73. [Google Scholar]
  9. Sharma, S.; Neupane, B.; Hari, B.K.C.; Koirala, M.P.; Damase, N.P.; Dhakal, S.; Gomes, C.; Cooper, M.A.; Holle, R.L.; Bhusal, R.J.; et al. Lightning threats in Nepal: Occurrence and human impacts. Geomat. Nat. Hazards Risk 2022, 13, 1–18. [Google Scholar] [CrossRef]
  10. Edirisinghe, M.; Maduranga, U.G.D. Distribution of Lightning Accidents in Sri Lanka from 1974 to 2019 Using the DesInventar Database. ISPRS Int. J. Geo-Inf. 2021, 10, 117. [Google Scholar] [CrossRef]
  11. Holle, R.L.; Dewan, A.; Said, R.; Brooks, W.A.; Hossain, M.F.; Rafiuddin, M. Fatalities related to lightning occurrence and agriculture in Bangladesh. Int. J. Disaster Risk Reduct. 2019, 41, 101264. [Google Scholar] [CrossRef]
  12. Accidental Deaths & Suicides in India (ADSI)|National Crime Records Bureau. Available online: https://ncrb.gov.in/en/accidental-deaths-suicides-india-adsi (accessed on 2 May 2022).
  13. Singh, O.; Singh, J. Lightning fatalities over India: 1979–2011. Meteorol. Appl. 2015, 22, 770–778. [Google Scholar] [CrossRef]
  14. Ray, K.; Giri, R.K.; Ray, S.S.; Dimri, A.P.; Rajeevan, M. An assessment of long-term changes in mortalities due to extreme weather events in India: A study of 50 years’ data, 1970–2019. Weather Clim. Extrem. 2021, 32, 100315. [Google Scholar] [CrossRef]
  15. Price, C.; Rind, D. A simple lightning parameterization for calculating global lightning distributions. J. Geophys. Res. 1992, 97, 9919–9933. [Google Scholar] [CrossRef]
  16. Carey, L.D.; Rutledge, S.A.; Petersen, W.A. The relationship between severe storm reports and cloud-to-ground lightning polarity in the contiguous United States from 1989 to 1998. Mon. Weather Rev. 2003, 131, 1211–1228. [Google Scholar] [CrossRef]
  17. Gilmore, M.S.; Wicker, L.J. Influences of the local environment on supercell cloud-to-ground lightning, radar characteristics, severe weather on 2 June 1995. Mon. Weather Rev. 2002, 130, 2349–2372. [Google Scholar] [CrossRef]
  18. Smith, S.B.; LaDue, J.G.; MacGorman, D.R. The relationship between cloud-to-ground lightning polarity and surface equivalent potential temperature during three tornadic outbreaks. Mon. Weather Rev. 2000, 128, 3320–3328. [Google Scholar] [CrossRef]
  19. Williams, E.; Mushtak, V.; Rosenfeld, D.; Goodman, S.; Boccippio, D. Thermodynamic conditions favorable to superlative thunderstorm updraft, mixed phase microphysics and lightning flash rate. Atmos. Res. 2005, 76, 288–306. [Google Scholar] [CrossRef]
  20. Williams, E.R. Lightning and climate: A review. Atmos. Res. 2005, 76, 272–287. [Google Scholar] [CrossRef]
  21. Mukhopadhyay, P.; Singh, H.A.K.; Singh, S.S. Two severe nor’westers in April 2003 over Kolkata, India, using Doppler radar observations and satellite imagery. Weather 2005, 60, 343–353. [Google Scholar] [CrossRef]
  22. Murugavel, P.; Pawar, S.D.; Gopalakrishan, V. Climatology of lightning over Indian region and its relationship with convective available potential energy. Int. J. Climatol. 2014, 34, 3179–3187. [Google Scholar] [CrossRef]
  23. Tyagi, A. Thunderstorm climatology over Indian region. Mausam 2007, 58, 189–212. [Google Scholar] [CrossRef]
  24. Zipser, E.J.; Cecil, D.J.; Liu, C.; Nesbitt, S.W.; Yorty, D.P. where are the most intense thunderstorms on earth? Bull. Am. Meteorol. Soc. 2006, 87, 1057–1072. [Google Scholar] [CrossRef] [Green Version]
  25. Romatschke, U.; Medina, S.; Houze, R.A. Regional, seasonal, diurnal variations of extreme convection in the South Asian region. J. Clim. 2010, 23, 419–439. [Google Scholar] [CrossRef]
  26. Halder, M.; Mukhopadhyay, P. Microphysical processes and hydrometeor distributions associated with thunderstorms over India: WRF (cloud-resolving) simulations and validations using TRMM. Nat. Hazards 2016, 83, 1125–1155. [Google Scholar] [CrossRef]
  27. Litta, A.J.; Mohankumar, K. Simulation of vertical structure and dynamics of thunderstorm over Cochin using MM5 mesoscale model—A case. Sci. Technol. 2007, 12, 51–79. [Google Scholar]
  28. Penki, R.K.; Kamra, A.K. Lightning distribution with respect to the monsoon trough position during the Indian summer monsoon season. J. Geophys. Res. Atmos. 2013, 118, 4780–4787. [Google Scholar] [CrossRef]
  29. Choudhury, B.A.; Konwar, M.; Hazra, A.; Mohan, G.M.; Pithani, P.; Ghude, S.D.; Deshamukhya, A.; Barth, M.C. A diagnostic study of cloud physics and lightning flash rates in a severe pre-monsoon thunderstorm over northeast India. Q. J. R. Meteorol. Soc. 2020, 146, 1901–1922. [Google Scholar] [CrossRef]
  30. Pawar, S.D.; Murugavel, P.; Gopalakrishnan, V. Anomalous electric field changes and high flash rate beneath a thunderstorm in northeast India. J. Earth Syst. Sci. 2010, 119, 617–625. [Google Scholar] [CrossRef]
  31. Biswasharma, R.; Roy, P.; Imolemba; Imlisunup; Samanta, D.; Pramanik, G.P.; Sharma, S. Regional variation of electrical and lightning properties of thunderclouds during the pre-monsoon season over the north-eastern and eastern part of India. Atmos. Res. 2021, 260, 105683. [Google Scholar] [CrossRef]
  32. Koutavarapu, R.; Umakanth, N.; Manepalli, R.N.R.; Srikumar, T.; Rao, M.C.; Lee, D.; Shim, J. Convection-based assessment of pre-monsoon season instability indices over Chandigarh and Ladakh regions, India. Arab. J. Geosci. 2022, 15, 571. [Google Scholar] [CrossRef]
  33. Sen Roy, S.; Sharma, P.; Sen, B.; Devi, K.S.; Devi, S.S.; Gopal, N.K.; Kumar, N.; Mishra, K.; Katyar, S.; Singh, S.P.; et al. A new paradigm for short-range forecasting of severe weather over the Indian region. Meteorol. Atmos. Phys. 2021, 133, 989–1008. [Google Scholar] [CrossRef]
  34. Srivastava, S. Annual Lightning Report 2021–2022: Executive Summary; Climate Resilient Observing Systems Promotion Council (CROPC): New Delhi, India, 2022; pp. ii–xx. Available online: http://cropc.org/lightning-report.php (accessed on 22 July 2022).
  35. Lopez, P. Promising results for lightning predictions. ECMWF Newsl. 2018, 155, 14–19. [Google Scholar]
  36. Lopez, P. A Lightning Parameterization for the ECMWF Integrated Forecasting System. Mon. Weather Rev. 2016, 144, 3057–3075. [Google Scholar] [CrossRef]
  37. Bechtold, P.; Semane, N.; Lopez, P.; Chaboureau, J.-P.P.; Beljaars, A.; Bormann, N. Representing equilibrium and nonequilibrium convection in large-scale models. J. Atmos. Sci. 2014, 71, 734–753. [Google Scholar] [CrossRef] [Green Version]
  38. Cecil, D.J.; Buechler, D.E.; Blakeslee, R.J. Gridded lightning climatology from TRMM-LIS and OTD: Dataset description. Atmos. Res. 2014, 135–136, 404–414. [Google Scholar] [CrossRef]
  39. Takahashi, T. Determination of Lightning Origins in a Thunderstorm Model. J. Meteorol. Res. Jpn. 1987, 28, 5241–5244. [Google Scholar]
  40. Williams, E.R.; Zhang, R.; Rydock, J. Mixed-phase microphysics and cloud electrification. J. Atmos. Sci. 1991, 48, 2195–2203. [Google Scholar] [CrossRef]
  41. Saunders, C.P.R. A Review of Thunderstorm Electrification Processes. J. Appl. Meteorol. 1993, 32, 642–655. [Google Scholar] [CrossRef]
  42. Saunders, C. Charge separation mechanisms in clouds. Space Sci. Rev. 2008, 137, 335–353. [Google Scholar] [CrossRef]
  43. Mudiar, D.; Pawar, S.D.; Hazra, A.; Gopalkrishnan, V.; Lal, D.M.; Chakravarty, K.; Domkawale, M.A.; Srivastava, M.K.; Goswami, B.N.; Williams, E. Lightning and precipitation: The possible electrical modification of observed raindrop size distributions. Atmos. Res. 2021, 259, 105663. [Google Scholar] [CrossRef]
  44. Pawar, V.S.; Domkawale, M.A.; Pawar, S.D.; Salvekar, P.S.; Kumar, P.P. Inter annual variability of tropospheric NO2 and tropospheric ozone over Maharashtra (India): The role of lightning. Remote Sens. Lett. 2017, 8, 1015–1024. [Google Scholar] [CrossRef]
  45. Utsav, B.; Deshpande, S.M.; Das, S.K.; Pandithurai, G.; Niyogi, D. Observed Vertical Structure of Convection During Dry and Wet Summer Monsoon Epochs Over the Western Ghats. J. Geophys. Res. Atmos. 2019, 124, 1352–1369. [Google Scholar] [CrossRef]
  46. Roy, S.S.; Mohapatra, M.; Tyagi, A.; Bhowmik, S.K.R. A review of nowcasting of convective weather over the Indian region. Mausam 2019, 70, 465–484. [Google Scholar] [CrossRef]
  47. Hersbach, H.; Bell, B.; Berrisford, P.; Hirahara, S.; Horányi, A.; Muñoz-Sabater, J.; Nicolas, J.; Peubey, C.; Radu, R.; Schepers, D.; et al. The ERA5 global reanalysis. Q. J. R. Meteorol. Soc. 2020, 146, 1999–2049. [Google Scholar] [CrossRef]
  48. Srinivasan, V.; Ramamurthy, K.; Nene, Y.R. India Meteorological Department Forecasting Manual: Discussion of Typical Synoptic Weather Situations; Part III-2.2; India Meteorological Department: Pune, India, 1973.
  49. Van Zomeren, J.; van Delden, A. Vertically integrated moisture flux convergence as a predictor of thunderstorms. Atmos. Res. 2007, 83, 435–445. [Google Scholar] [CrossRef]
  50. Ferro, C.A.T.; Stephenson, D.B. Extremal dependence indices: Improved Verification measures for deterministic forecasts of rare binary events. Weather Forecast. 2011, 26, 699–713. [Google Scholar] [CrossRef] [Green Version]
Figure 2. Pre-monsoon (March–April–May or MAM) mean flash rates (flash count km2 day1) obtained from Lightning Imaging Sensor (LIS)/Optical Transient Detector (OTD) Gridded 1995–2015 Climatology data sets [38]. Colored boxes highlight five thunderstorm-prone regions as defined by [26].
Atmosphere 13 01520 g002
Figure 3. 2020 MAM mean (a) relative humidity (%; shaded), sea-level pressure (hPa; contours in red) and 850 hPa wind vector; (b) low-level wind shear between 850 and 700 hPa (m s1; shaded) and 200 hPa mean wind vector; and (c) vertically integrated moisture flux convergence (VIMFC; ×105 kg m2 s1). Plotted using ECMWF reanalysis (ERA5) hourly data [47].
Atmosphere 13 01520 g003
Figure 4. MAM 2020 mean flash density (flash count km2 day1) (a) observed by LLN and forecasted by IFS for (b) Day 1, (c) Day 2, and (d) Day 3 lead times. (eg) shows the forecast bias (flash count km2 day1) for Day 1, Day 2, and Day 3 lead times, respectively.
Atmosphere 13 01520 g004
Figure 5. Mean diurnal cycle of flash density (×103 km2 day1) during MAM 2020 for LLN (black) and IFS Day 1 (blue), Day 2 (red), and Day 3 (green) lead times, spatially averaged over (a) the Indian subcontinent and (bf) over each predefined subregion.
Atmosphere 13 01520 g005
Figure 6. Mean daily time-series of observed and IFS forecast lightning flash density (km2 day1) for MAM 2020 over (a) All India, (b) Box 1: NEI, (c) Box 2: SP, (d) Box 3: CI, (e) Box 4: ECI, and (f) Box 5: NWI.
Atmosphere 13 01520 g006
Figure 7. MAM 2020 mean monthly total lightning flash density (km2) averaged over (a) All India (40° N–10° S, 50° E–100° E), (b) Box 1: NEI, (c) Box 2: SP, (d) Box 3: CI, (e) Box 4: ECI and (f) Box 5: NWI.
Atmosphere 13 01520 g007
Figure 8. Forecast Skills—(a) probability of detection (POD), (b) false alarm ratio (FAR), (c) Frequency Bias (FB), and (d) Symmetric Extremal Dependence Index (SEDI) for Yes/No forecast over all India and five thunderstorm-prone regions for Day 1 (blue), Day 2 (red) and Day 3 (green) lead time.
Atmosphere 13 01520 g008
Table 1. Contingency table.
Observed
YesNo
ForecastYesHitsFalse AlarmsForecast yes
NoMissesCorrect NegativesForecast no
Observation yesObservation NoTotal
(Sample size)
Publisher’s Note: MDPI stays neutral with regard to jurisdictional claims in published maps and institutional affiliations.

