Article

Changes in Air Pollutants from Fireworks in Chinese Cities

by
Yonghang Lai
1 and
Peter Brimblecombe
2,3,*
1
National Institute for Environmental Studies (NIES), 16-2 Onogawa, Tsukuba 305-8506, Ibaraki, Japan
2
School of Environmental Sciences, University of East Anglia, Norwich NR4 7TJ, UK
3
Department of Marine Environment and Engineering, National Sun Yat-sen University, Kaohsiung 804, Taiwan
*
Author to whom correspondence should be addressed.
Atmosphere 2022, 13(9), 1388; https://doi.org/10.3390/atmos13091388
Submission received: 15 July 2022 / Revised: 19 August 2022 / Accepted: 26 August 2022 / Published: 29 August 2022
(This article belongs to the Special Issue Feature Papers in Atmosphere Science)

Abstract

:
Chinese New Year has traditionally been welcomed with fireworks, but this has meant this holiday can experience intense peaks of pollutants, particularly as particulate matter. Such environmental issues add to other risks (e.g., accident, fire, and ecological and health threats) posed by firework displays, but cultural reasons encourage such celebrations. This study examines air pollution from fireworks across a time of increasingly stringent bans as a time series from 2014–2021 using a random forest (decision-tree) model to explore the effect of year-to-year weather changes on pollutant concentrations at Chinese New Year. Peak concentrations of firework pollutants have decreased in cities and hint at the importance of well-enforced regulation of these traditional celebrations, e.g., Beijing, Tianjin, and Chongqing. The model suggested relative humidity was an important controlling variable, perhaps as the presence of water vapor might also accelerate particle growth but also as a surrogate parameter related to atmospheric mixing. Bans on fireworks, resisted at first, have shown evidence of growing public acceptance. The regulations are increasingly effective, even in the outer parts of cities. Celebrations might safely return as public firework displays, including light shows and the use of lanterns.

1. Introduction

Firework displays pose many risks, so there are often attempts to reduce environmental and health impacts while maintaining a sense of celebration. As with many air pollution problems, there is a conflict between individual freedom and the adoption of restrictive regulatory policies, e.g., choice of fuel [1] or to live in remote suburbs that require a car [2]. Cultural issues can be a special problem with fireworks, as for many centuries, these have been an important part of the spring festival, which welcomes the Chinese New Year [3].
The problems of fireworks are widely experienced, and include direct injury [4], visibility reduction [5], and health effects [6]. Air quality during and after festivals may decline, with enhanced levels of toxic metals (e.g., [7,8]) and increased particulate loads in many places: Columbia [9], Slovenia [10], the USA on Independence Day [11], at German New Year [12], and in India during the Diwali festival [13,14,15]. Chinese New Year has been the basis of much research over many years [16,17,18,19], with the focus on the pollution within northeast China, where there is a high population density and gross domestic product (GDP) combined with persistent local customs [17,20]. As regulations have tightened and lowered concentrations, research has recently focused on the response to restrictions [21,22,23,24,25] and decreased use of fireworks during the COVID-19 pandemic [26,27]. Regulatory concern is driven by fears of health effects associated with short exposure to firework pollution [28,29,30,31], though claims of health effects are often potential as changes in health outcomes are difficult to detect [32]. However, it is likely that pyrotechnic workers experience a more extended exposure [33,34], along with aerobiological effects [35], reactive oxygen species [36], and toxicological and ecological risk [8,37,38].
Concerns regarding fireworks and air pollution during New Year celebrations have been broadly recognized, so there have been shifts away from private use to public pyrotechnic displays [17]. Lai and Brimblecombe [22] showed that in Beijing, despite a long-held enthusiasm for fireworks to welcome the Chinese New Year, inhabitants have gradually come to accept the need for restrictions.
The current study explores changes in firework-related air pollution in some large Chinese cities. Control of such pollution has often been difficult to implement because fireworks are such an important part of many celebrations and cultural events [39]. In Hong Kong, for example, fireworks were used in frequent public displays over the harbor but have gradually been replaced by light shows [40]; such alternatives are also possible for New Year celebrations [17]. In Beijing, regulations were not really developed until the 1990s, but even then, fireworks remained popular in Beijing, so many wanted the ban removed [41]. In 2006, the Beijing bans were redefined to limit the varieties of fireworks and time and place of use, and finally, fireworks in urban areas were banned in 2018; however, fireworks continued to be allowed in suburban areas. Regulation in Beijing has generally become more stringent while, in parallel, public acceptance of the bans has increased [22]. However, restrictions on mobility during the COVID-19 lockdowns led to a period with reduced air pollution [42] while also meaning that people missed the celebratory use of fireworks [26]. Another important difficulty in comparing firework pollution events in different cities are the meteorological conditions. Weather is a key factor influencing urban air pollutants, and thus the dispersion of firework pollutants.
Our previous work [17,22] suggested the importance of restrictions on private use of fireworks and a shift to public displays to reduce pollutant concentrations. However, meteorological conditions have a strong effect on the level of pollutants resulting from firework displays, most notably mixing height and vertical dispersion [9,22]. High humidity and low wind speed are also important [19]. This means the effects of varying meteorological conditions year to year need to be considered when assessing the effectiveness of firework regulations. The current work aimed to: (i) use the machine learning method to normalize the meteorological conditions and predict the pollution concentrations under business-as-usual scenarios during firework celebrations in some Chinese cities, (ii) further compare the pollution levels from different celebrations from 2014 to 2021, (iii) assess potential improvements arising from regulation rather than changes in weather, and (iv) examine the spatial difference across the cities, with a special interest in the potential for weaker regulation remote from city centers. Such work hopes to provide insight to tackling the firework pollution problem.

2. Materials and Methods

In the current study, five Chinese cities were examined separately: Beijing, Tianjin, Chongqing, Guangzhou, and Shenzhen (Figure 1). While the use of fireworks in China has been regulated for some time, the stringency of the regulations and the level of enforcement has varied [22,24]. Legislation in Beijing only banned private fireworks within the 5th Ring Road from 2018; although, in more remote suburban areas, these could be used at New Year. Thus, Beijing was considered in terms of the pollution within and outside the 5th Ring Road.

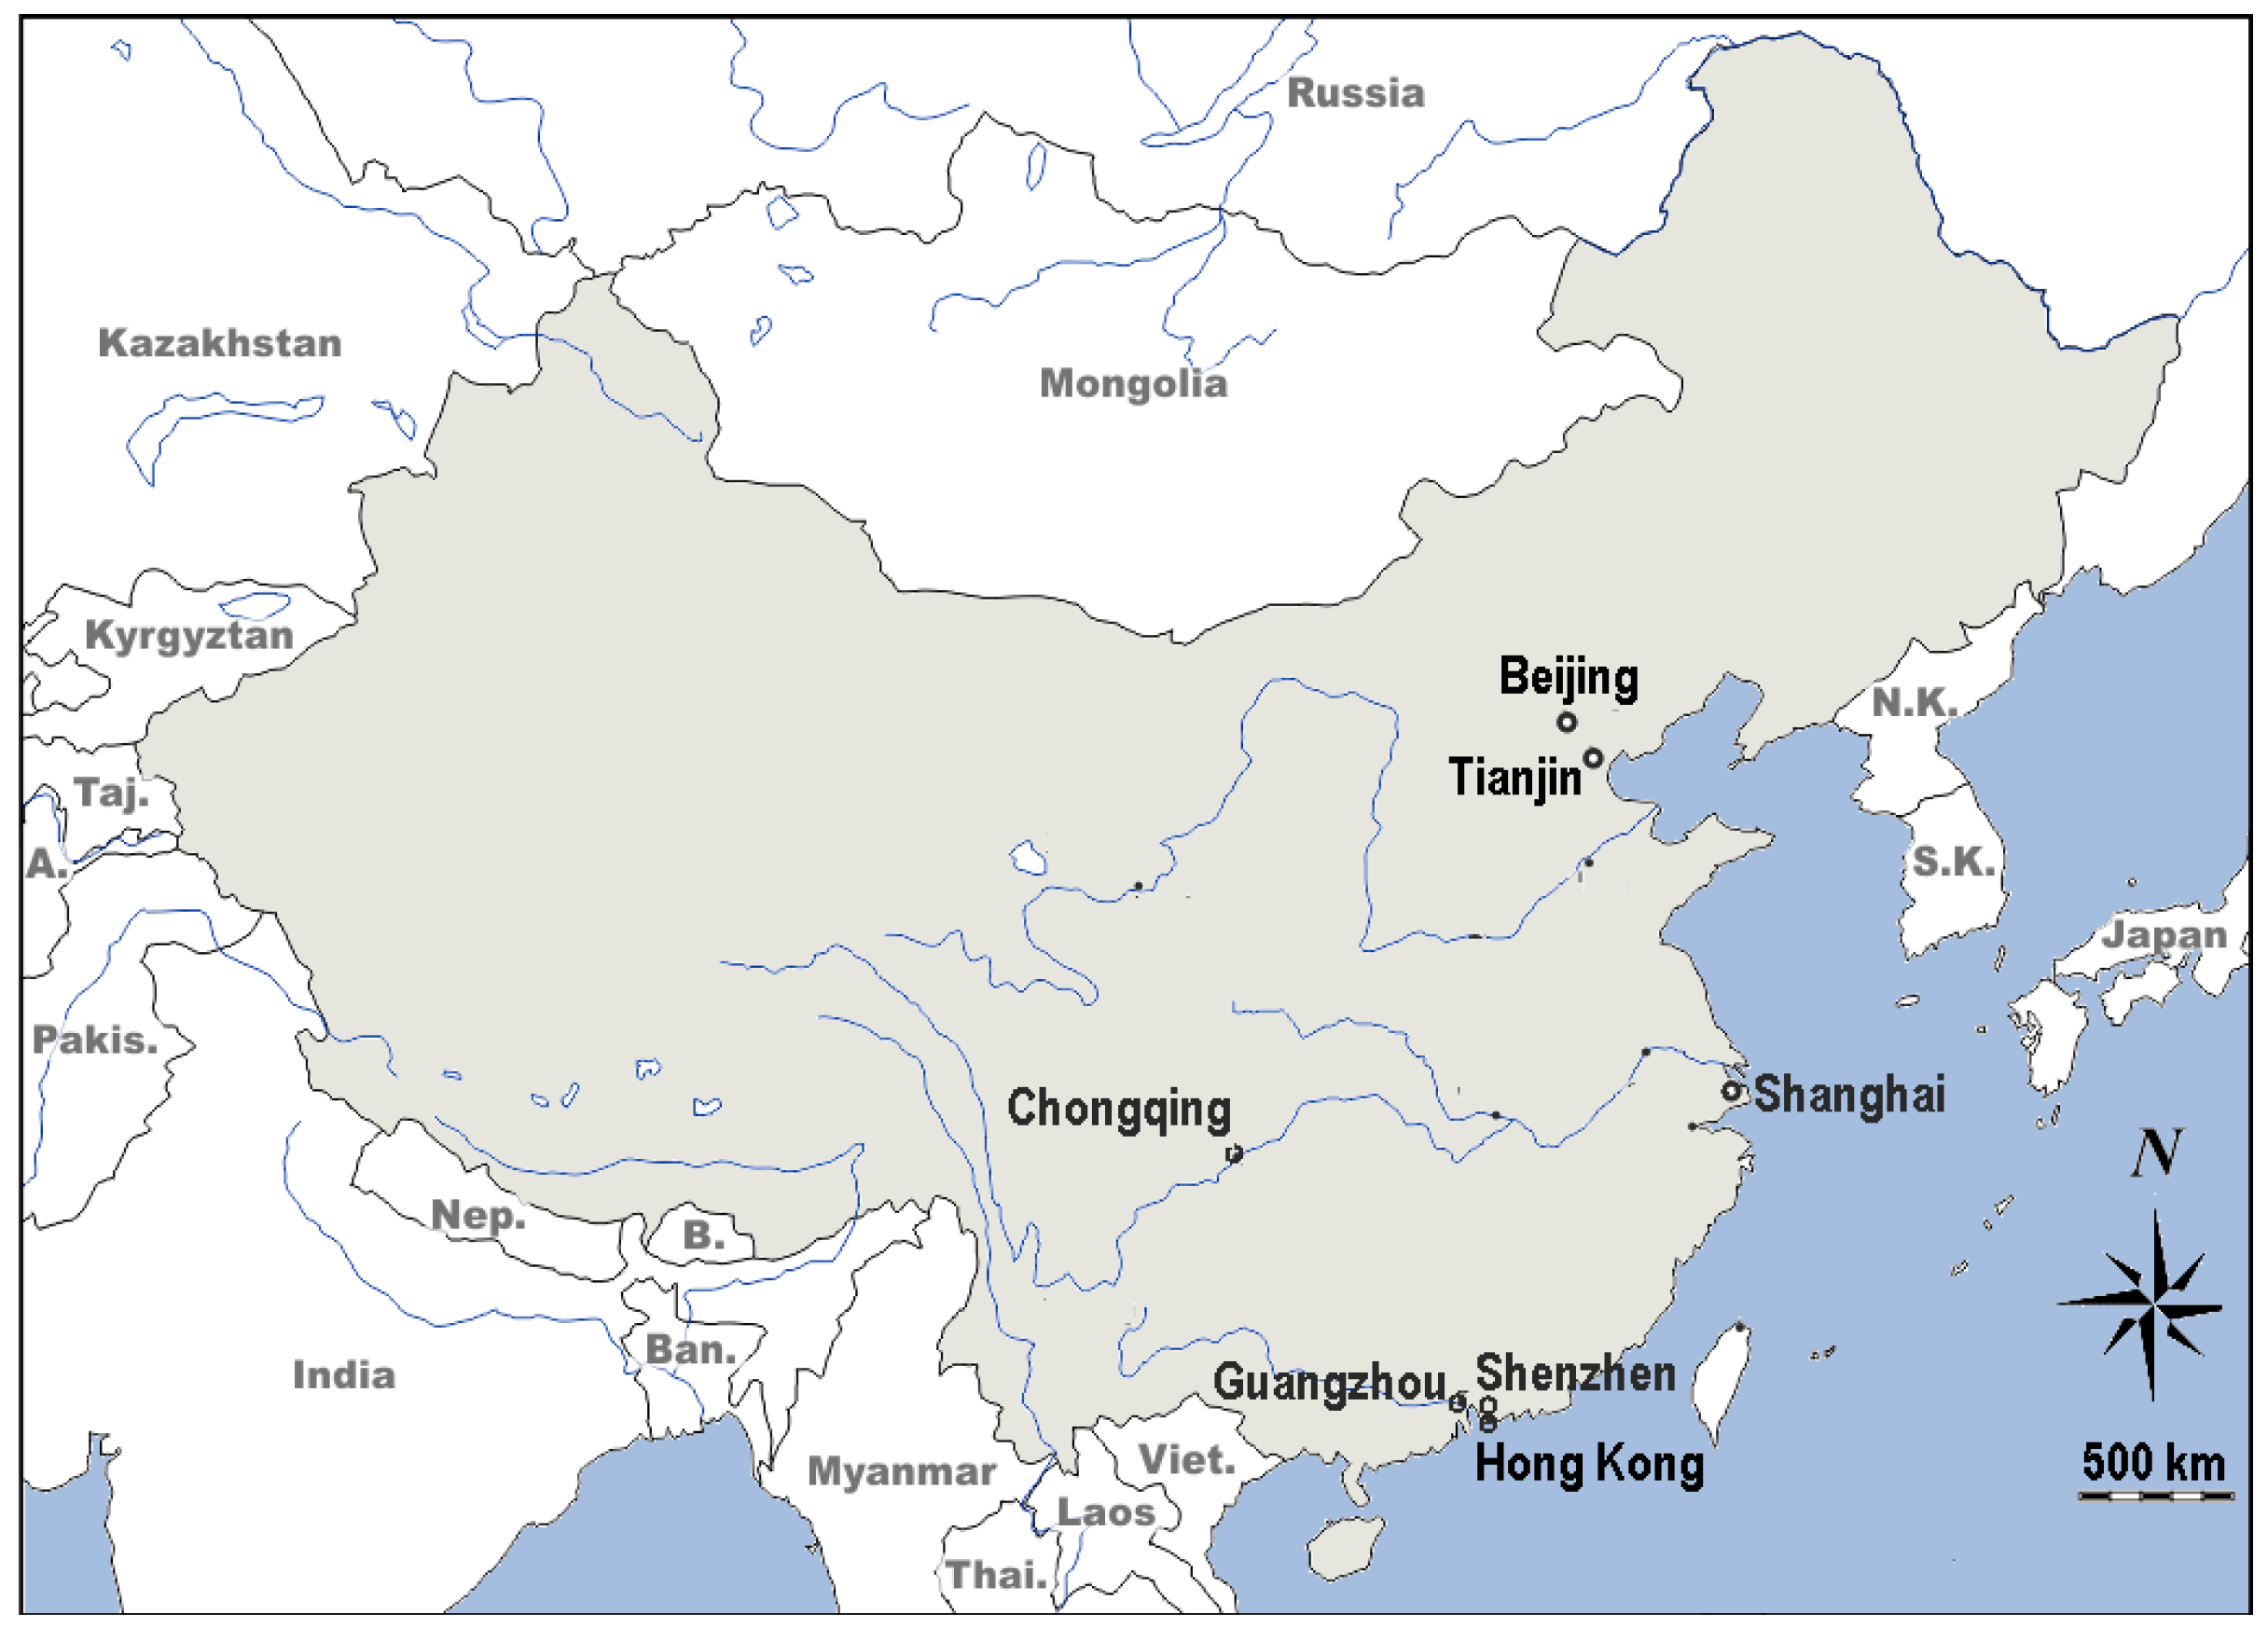
2.1. Air Pollution and Meteorological Data

Hourly measurements of six pollutants (PM10, PM2.5, CO, NO2, O3, and SO2) have been available from air quality monitoring stations in each of the cities for almost a decade. This study focused on particulate matter (PM10 and PM2.5) as these concentrations illustrate the clearest signature of the Chinese New Year firework events [17]. Beijing has data from 12 monitoring stations in the central urban area and 11 stations beyond the 5th Ring Road (http://aqicn.org/city/ accessed on 29 August 2022), although there are gaps in some years. In Tianjin, Chongqing, Guangzhou, and Shenzhen, data was taken from 8, 12, 10, and 11 sites, respectively. On occasions, we referred to specific sites in Tianjin and Chongqing and used their official site code in Tianjin: 1015A, 1017A, 1018A, 1019A, 1021A, 1023A, 1024A, and 1026A; and in Chongqing: 1416A, 1417A, 1418A, 1419A, 1420A, 1421A, 1422A, 1425A, 1426A, 1427A, 1428A, and 1429A. The average concentration over all stations was used to represent the overall concentration in the cities.
The meteorological observations used in this study were obtained from the website of timeanddate (timeanddate.com accessed on 27 August 2022). All data came from the official records at the local airport. The hourly averaged meteorological parameters included air temperature, relative humidity, air pressure, wind speed, and wind direction.

2.2. Weather Effects

Grange and Carslaw [43] pointed out that a central issue in determining the changes in pollutant concentration arises from variations in the meteorological conditions or emission source strength. This problem is widespread and affects timescales from hours to years. It is particularly important in before–after studies as the meteorological change can easily dominate the variation in concentrations. Simply accounting for the average of concentrations during a period cannot account for change due to weather differences. Both firework activity and weather conditions vary over time, so the effect of reduced firework emissions is hard to isolate. It means that considerable care is needed to quantify the effectiveness of intervention measures such as firework regulation.
In this study, we trained a random forest (decision-tree) model as described by Grange et al. [44] on meteorological and air pollution data using the rmweather R package (more information on the model used can be found in Grange et al. [44]). All random forest models used the same explanatory variables to predict the hourly PM10 and PM2.5 concentrations. The explanatory variables were wind speed, wind direction, atmospheric temperature, relative humidity, atmospheric pressure, and a linear trend term, including the Unix time of the observation (number of seconds since 1970-01-01) as the trend term, Julian day (day of the year) as the seasonal term, and day of the week. All variables were used within their response scale, with no transformations applied. The particulate concentration was only modeled if valid meteorological data were available for that day. Training of the models was conducted on 80% of the input data and the other 20% was withheld and used to validate the models once they were grown. To determine the optimal values, this model performance statistics used the test set (data withheld from the training step) and run times were evaluated to judge what hyperparameters grew the best-performing models. The number of variables used to grow a tree was set to 3, the minimum node size or depth was 5, and the number of trees within a forest was set at 300 for all models.
The random forest models were trained to explain hourly mean particulate concentrations (mostly PM10 and PM2.5 in this study) using surface meteorology and time as explanatory variables. The test set was used to run and select the best-performing models and the training period covered hourly observations on days where no fireworks were used. In examining the effect of fireworks, six hours (00:00/05:00) on the first day of Chinese New Year in China were defined as the firework period. Thus, 12 h before and after the firework period were used to grow the model, including the training and testing. We used this time window as it captured other aspects of celebration such as increased vehicle traffic; however, it is noted that wider time windows might have provided different results. However, a 24-h before-and-after window gave very similar results (Supplementary Figure S1). The trained model was then used to predict the pollutant concentrations from 12 h before to after the firework period in the cities and included measured meteorological data for these periods in different years. The pollutant concentrations predicted by the model represent business-as-usual (i.e., without fireworks) as they are based on observations made before and after the firework use. Thus, the predicted concentrations can be compared to the original data, which includes the firework peaks. This method for determining the counterfactual is more robust than methods that use the average pollutant concentrations across the firework period, as the approach adopted here uses available weather data during the firework period, which is not part of the model training. This model adopted historical data (training dataset) and predicted concentrations based on the observed meteorological variables, which allowed us to compare the observation and expectation [45].
While the training–testing split was 80% and 20%, the random forest algorithm does not directly offer the ability to determine error or estimates of uncertainty. Uncertainty is important in many situations, so 50 random forest models were grown for each case, with the hyperparameters described above but with randomly sampled (bootstrapped) input sets. Bootstrapping observational data ensured the models were grown on different training sets. The statistical performance of 50 models was evaluated using 4 indicators: Pearson’s correlation coefficient (r), mean bias (MB; in µg m−3), normalized mean bias (NMB), and normalized root-mean-square error (NRMSE) as summarized in the Supplementary Materials (Table S2). All statistical indicators and input variables such as the importance values (a measure of the variables’ strength or influence on prediction) and predicted concentration were calculated in 50 models and the mean and the 2.5% and 97.5% quantiles from the 50 estimates, i.e., a range that spans the 95% confidence interval in the mean, were further evaluated. All models performed well, with most values of r2 greater than 0.7 (Table S2), suggesting the model can predict the results effectively. Most biases were negative, and the absolute value was less than unity in the training set for the Beijing models, suggesting that it may have led to some models under-predicting the concentrations at this time.

2.3. Statistics

As the data were not necessarily normally distributed, so we used non-parametric techniques, notably the Mann–Whitney test (statistic U). The changes over time used the Kendall τ test, as only eight years were available to express the trend and, again, the distribution was uncertain.

3. Results and Discussion

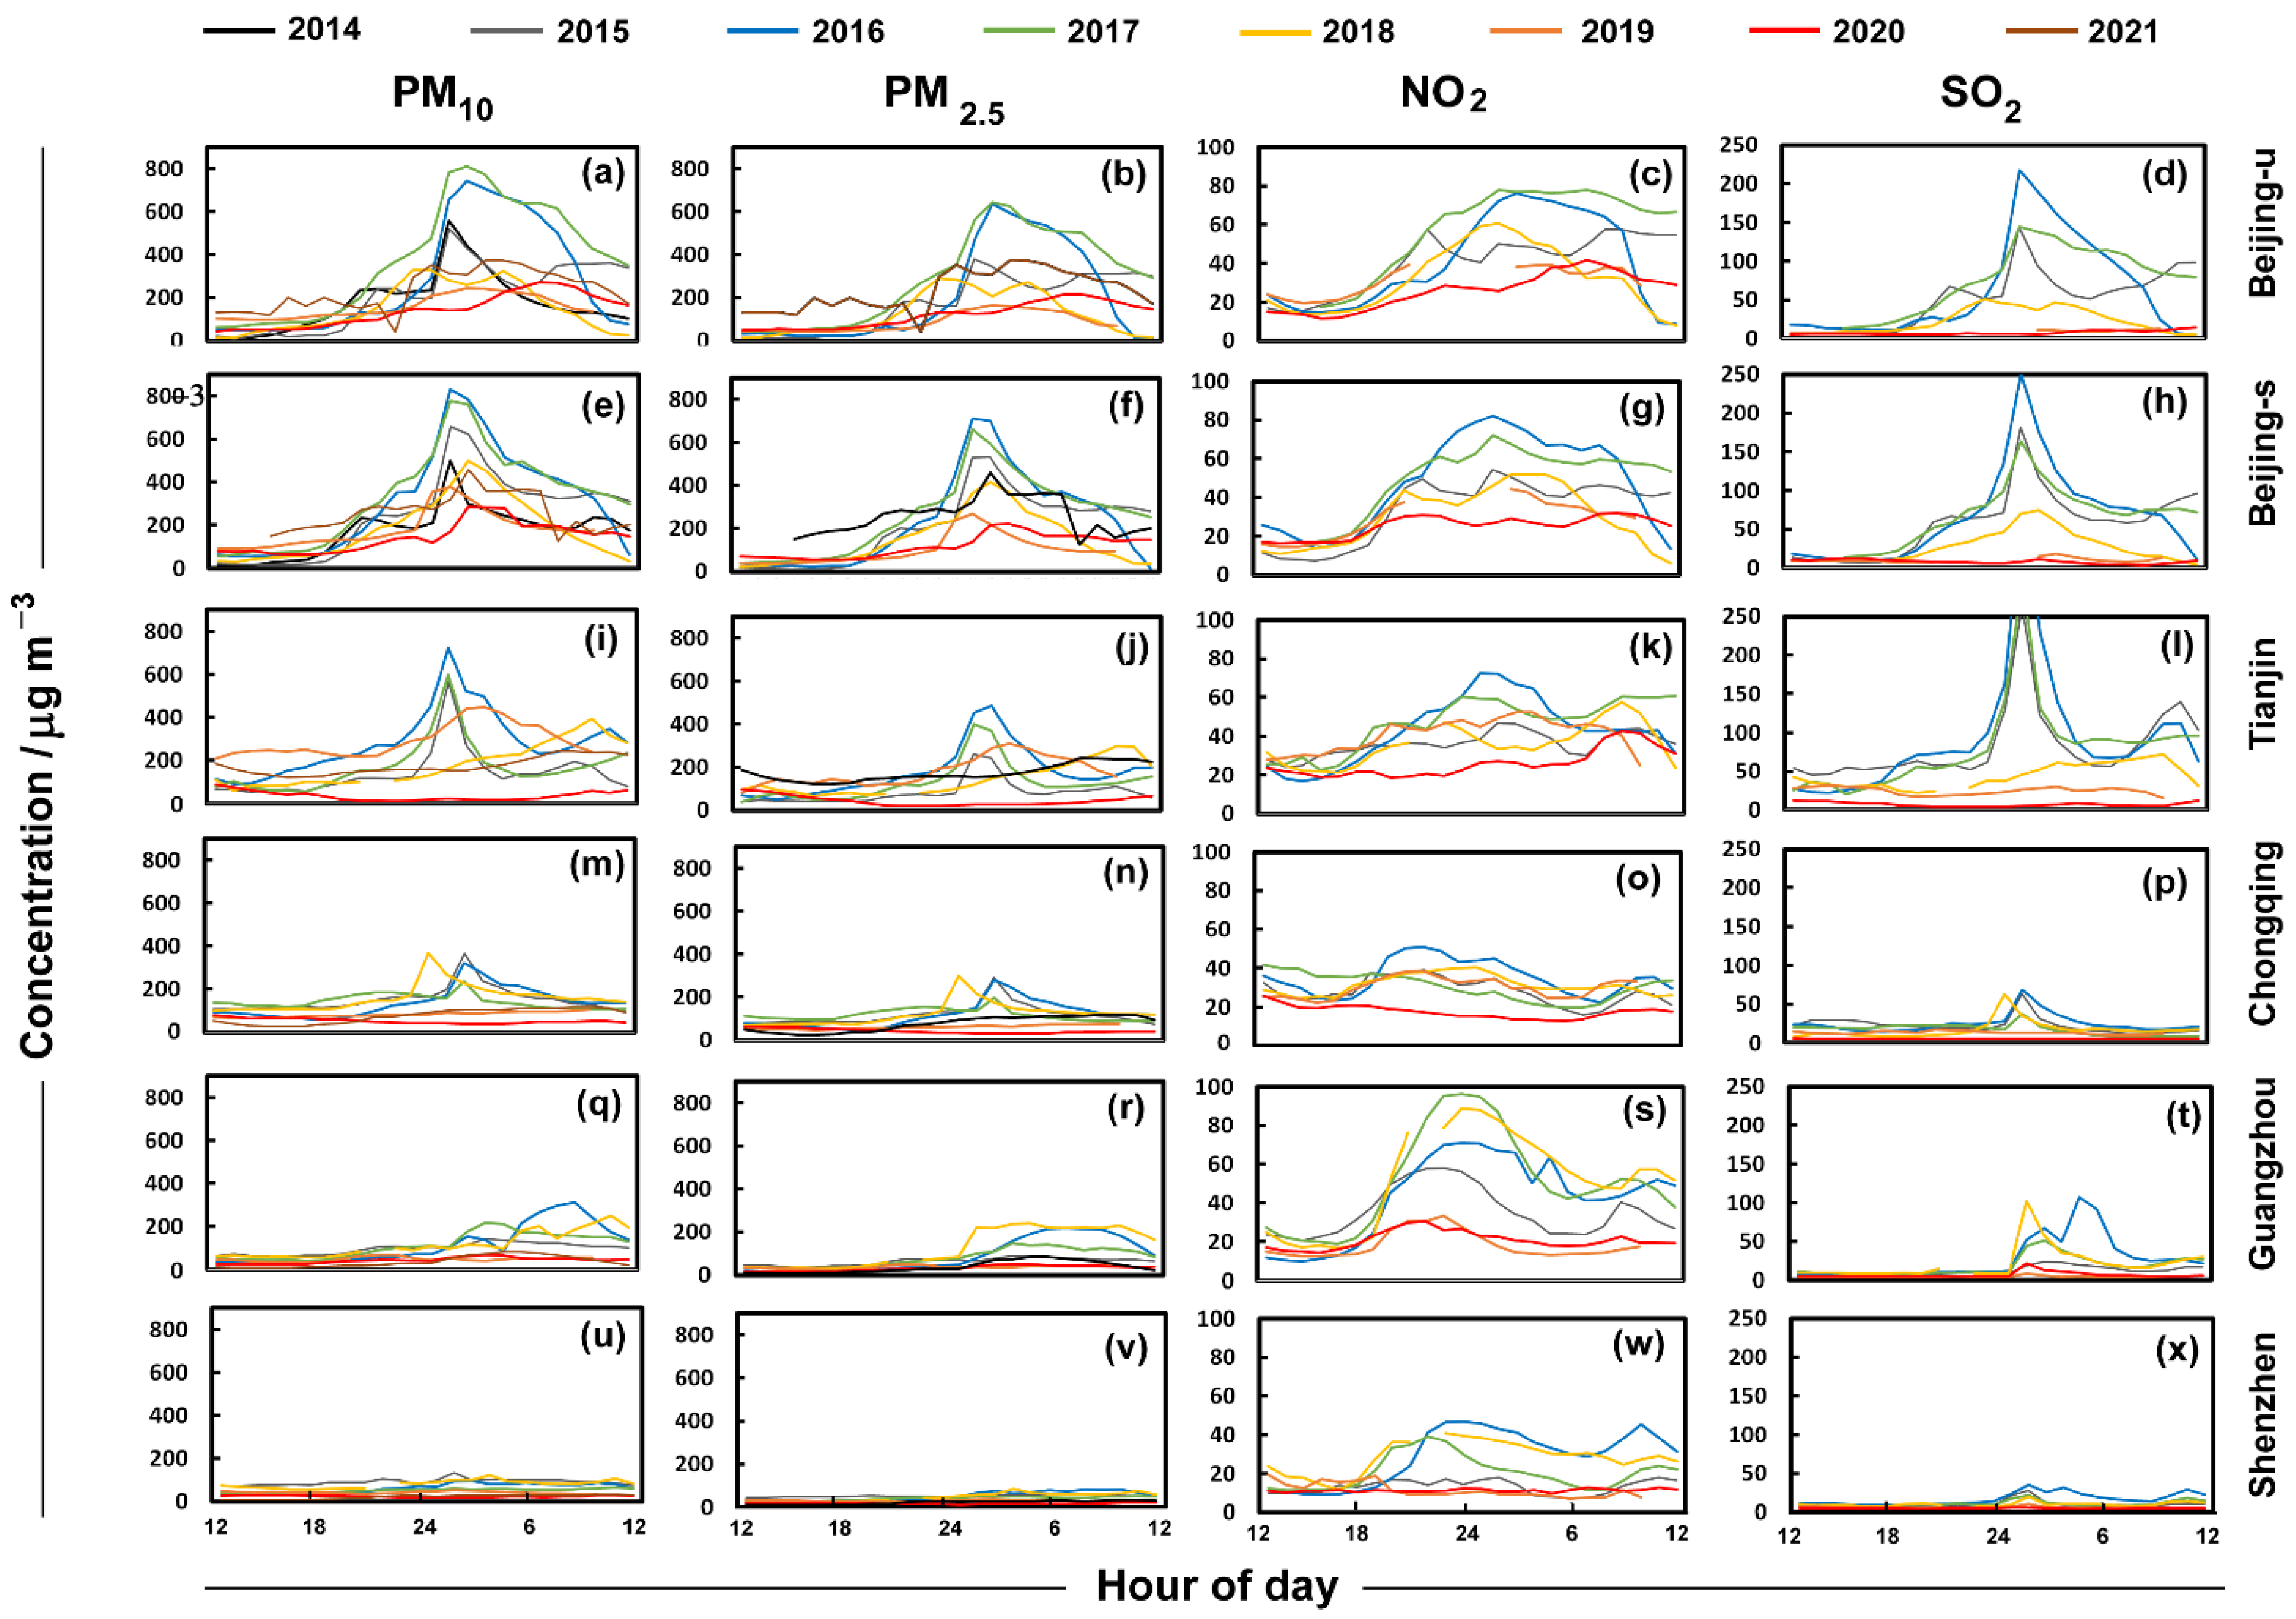
3.1. Air Pollution from Fireworks

Figure 2 shows the average concentrations of PM10, PM2.5, NO2, and SO2 in both urban Beijing and its surroundings (i.e., lying beyond the 5th Ring Road), Tianjin, Chongqing, Guangzhou, and Shenzhen. The pollutant concentrations in Beijing (Figure 2a–d show characteristic increases across the eve of the New Year, which were described in some detail in earlier work [17,21]). The peaks are often very sharp (e.g., [17]); however, here, they are averaged so appear broader. The peaks are more noticeable for earlier years 2014/2017 but are less distinct later, which is attributed to increasing restrictions on the use of fireworks in Beijing (e.g., [22]). This pattern is also distinctive in the outer parts of Beijing beyond the 5th Ring Road (Figure 2e–h) and in Tianjin (Figure 2i–l), with rather narrow peaks for PM10, PM2.5, and SO2 as these are very characteristic of fireworks. There is a weaker signal for Chongqing (Figure 2m,n,p), but Guangzhou and Shenzhen show scant evidence of changes in PM10, PM2.5, and SO2 from fireworks, typical of the lower impact of celebrations in the cities of southern China [17].
Figure 2a–h shows the concentrations of PM10, PM2.5, NO2, and SO2 in both urban Beijing and at the more remote locations beyond the 5th Ring Road. The nitrogen oxides are not especially characteristic of fireworks, so the observed elevated NO2 might have arisen from other sources, such as heavy traffic during the celebration of the Chinese New Year. These NO2 concentrations appear as broad peaks and are similar across the sites, suggesting dispersed sources, such as traffic. They contrast with the sharp changes in the particulate concentration just after midnight. The early morning is also associated with a slight increase in SO2 as observed in other studies (e.g., [17,46]), which are also clear in the case of Beijing and Tianjin (Figure 2g,h,l).
The change in particulate matter is evident in the temporal plots, so the concentrations of PM10 and PM2.5 were used here as a marker of pollution derived from fireworks. Thus, we largely restricted our study to particulate matter. Other markers, such as perchlorate and trace metals, though distinctive, were measured at few sites [17]. Peaks of PM10 and PM2.5, in urban Beijing (Figure 2a,b) were clearly observed from 2014 to 2017 at around 01:00 or 02:00 of the first day of the Chinese New Year but were less distinct after 2018. This is largely due to Beijing government’s publication of new restrictions banning residents from discharging fireworks in urban areas (within the 5th Ring Road) at the end of 2017. Figure 2e–h illustrates the changes in the concentration of air pollutants in outer areas of Beijing over the same years. The changes show a similar pattern to those in urban areas, but high concentrations of PM10 and PM2.5 were observed in all years. Nevertheless, the peak values after 2018 were lower than previously. Beijing residents were still allowed to set off fireworks in these suburban areas beyond the 5th Ring Road, so some people travelled to those locations to celebrate the important festival. However, the restrictive policy seems to have gradually changed public opinion such that the private use of fireworks has declined, resulting in lower particulate concentrations after 2018 [22]. The year 2022 revealed extremely low concentrations, as a result of not only increasing restrictions but also efforts aiming for clearer air related to preparations for the winter games that ran 4 February 2022/20 February [47,48]. There was much concern about air pollution and the interface of the games with the period of New Year celebrations [47] while COVID-19 imposed restrictions that also reduced the air pollution concentrations [48]. There were expectations of blue skies for the Winter Olympics; a concept termed “Beijing Blue” [48] has emerged to describe improved pollution during important events ever since the Olympic Games of 2008 and the APEC (Asia-Pacific Economic Cooperation) meeting of 2015 [49].
After the early years with substantial firework use, most notably in Beijing, the particulate concentrations declined from the high concentrations in the early morning and after 06:00, levels returned to that of the previous evening (before 00:00), as shown in Figure 2a,b,e,f. The early morning hours of the New Year (00:00/05:00) were taken in this study as the firework period and were compared with concentrations on New Year’s Eve at all Beijing monitoring sites (12:00/23:00), as in earlier work [17], using the Mann–Whitney test to test the differences between mornings and evenings (Table S1 for details). This showed that the concentrations of particulate matter were larger (p < 0.0025) for all years. Perhaps because of improvements in emissions, the year 2019 was an exception, with differences less significant (p < 0.05). There were differences in NO2 and SO2, but these were both less convincing and inconsistent, although NO2 can derive from increased vehicle use during New Year celebrations. However, SO2 is emitted as an air pollutant because of the large concentrations of sulfur present in fireworks [17]. The differences in particulate matter persisted into 2020, a time when Beijing was under restrictions due to COVID-19. On social media in China, some people in Beijing hoped to use fireworks to drive away the epidemic. The government focused more on the battle against the disease, so some firecrackers might have been used privately [22] even in urban areas, causing an increase in the particulate concentrations that year.
Similar overall patterns were found in Tianjin, although SO2 (Figure 2i–l) was more dominant than in Beijing. The changes due to fireworks were smaller in Chongqing (Figure 2m–p). They were hardly apparent in Guangzhou (Figure 2q–t) and Shenzhen (Figure 2u–x), where pollutant concentrations from this source were typically lower (Tables S3–S6).

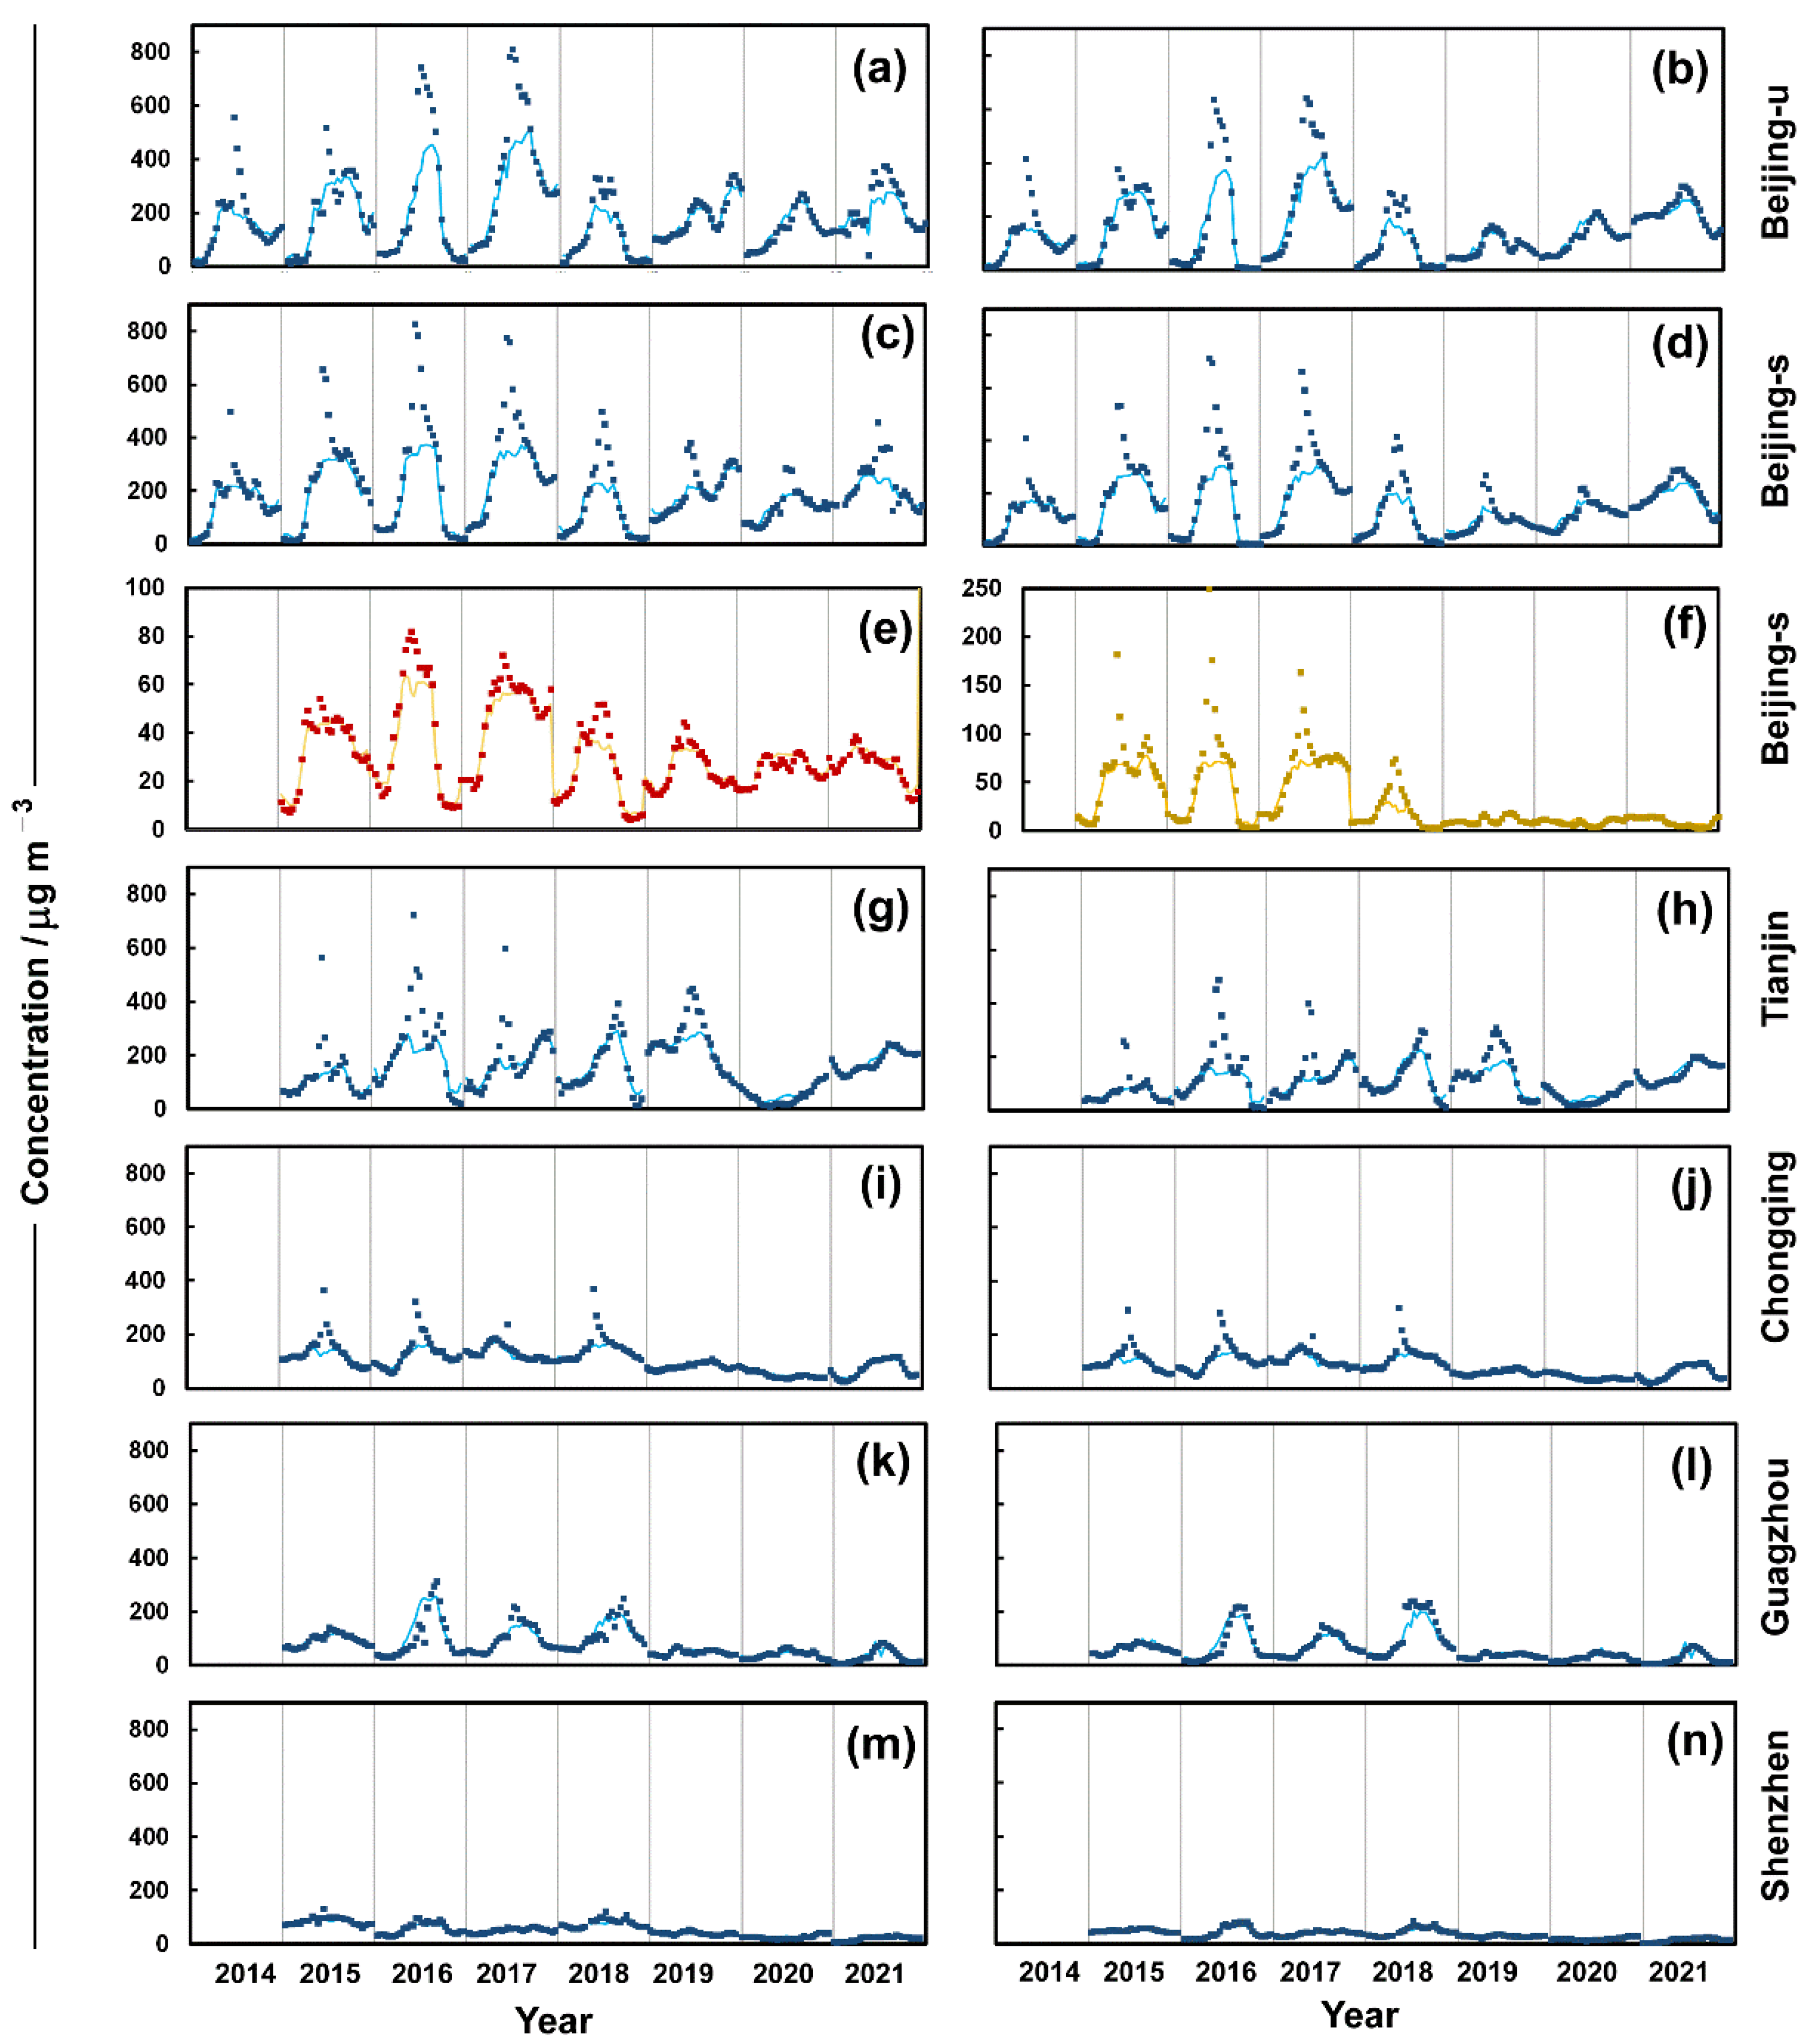
3.2. Pollutant Simulation and Weather Effects

We used a machine learning model to simulate the particulate concentration without fireworks under changing meteorological conditions. This technique allows comparison between the observed particulate concentrations and estimates from the model that simulate the situation without firework emissions.
The model was built for both PM10 and PM2.5 for the Beijing areas within the 5th Ring Road during the period when the fireworks were more widely used and had r2 values of 0.84–0.85 (see Table S2 for some of the statistics). Therefore, the models had good explanatory ability for the particulate concentrations. Figure 3a,b show the PM10 and PM2.5 concentrations in urban Beijing that were fitted using a random forest method. In the early years, before 2018, a large difference is observed between the measured and modeled particulate concentrations. There were significant reductions in illegal sales after 2017, especially in the outer parts of Beijing [26]. In areas beyond the 5th Ring Road, the models (Figure 3c,d) show predicted particulate concentrations that are less than the observed values and illustrate the firework contributions from 2014 to 2021. By 2019, the agreement between the model and observation was better, even beyond the 5th Ring Road. This improved agreement occurred despite the less stringent restrictions on fireworks and tardier application in areas distant from the center of Beijing.
Figure 3e,f compare the observed concentrations of NO2 and SO2 using the trained model for Beijing beyond the 5th Ring Road. These show modest differences in concentrations related to firework use in the earlier years, which have largely disappeared in recent years, particularly for SO2, which decreased to very low concentrations.
Some peaks cannot be explained by the random forest model for particulate concentrations in Tianjin (Figure 3g–h), which again suggests that fireworks made important contributions to particulate matter in this city. At the end of 2018, authorities in Tianjin placed restrictions on the private use of fireworks. A questionnaire was posted in a special column “Tianjin ban fireworks” and asked whether respondents supported a ban on fireworks during Spring Festival [50]. The results suggested that most people did not favor such restrictions as they argued that without fireworks, there can be no Chinese New Year. Additionally, respondents thought that poor air quality was largely associated with emissions from industries and factories, an argument that is similar those found in Beijing during attempts to reduce firework use there [26]. Posts to personal accounts showed that most people were unhappy as the new regulations were to be enforced in the New Year holidays of 2019. However, the ban became a reality; although, after this, some people said that they could still hear the sound of firecrackers during the holiday celebrations in Tianjin. Official government media sites continued to remind people that fireworks and firecrackers were not allowed during the holiday period, and such activities could lead to punishment for violation of the regulations.
The local government in Chongqing also banned fireworks starting in 2019. Particulate concentrations around the city have become much lower in recent years (Figure 3i,j), and the difference between the random forest estimates made from meteorological conditions and particulate observations decreased. The random forest model agrees with the observations for Guangzhou (Figure 3k,l) and Shenzhen (Figure 3m,n) as fireworks were not allowed in these cities over many years. While significant differences were found between the observation and simulation during the firework period in central Beijing, Chongqing, and Tianjin prior to 2018, after they were less marked. This suggests that bans on firework use may have been effective in reducing particulate matter (Table S7). As restrictions have been in place for some time in Guangzhou and Shenzhen, the differences between observation and simulation were small.

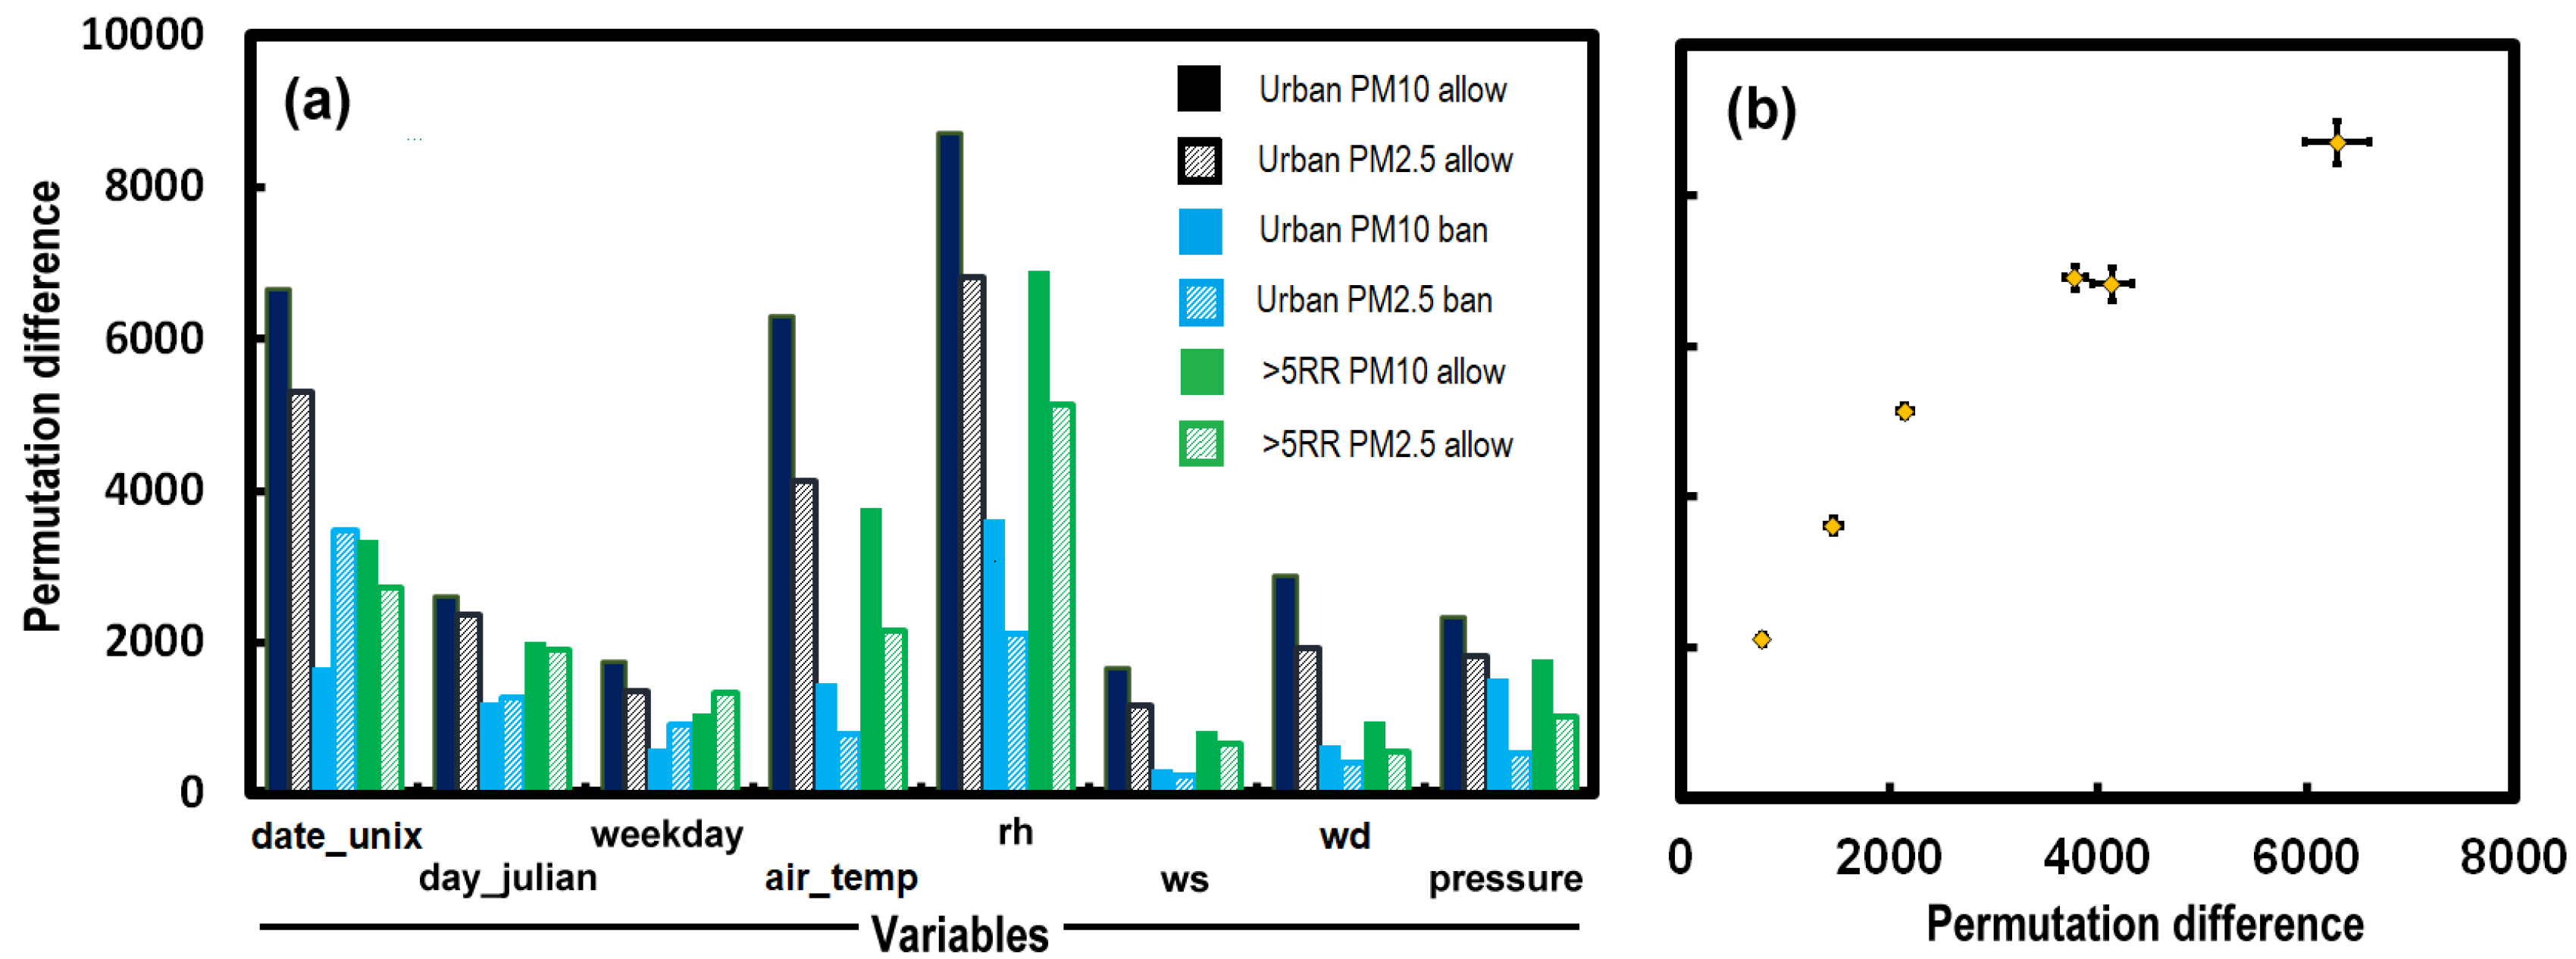
3.3. Controlling Variables

The random forest model provides estimates of the contributions from various parameters to pollutant concentrations. Figure 4a compares the importance of variables and highlights the significance of relative humidity (rh) in predicting both PM10 and PM2.5 concentrations via the random forest model for the more central Beijing urban area from 2014/2017 (allow), when fireworks were less well regulated, and the better regulated period 2018/2021 (ban). Beyond the 5th Ring Road, fireworks have typically been allowed from 2014/2021. It may seem odd that the particulate concentration was most strongly related to humidity and not wind-related parameters, but this was also found in previous studies [51,52,53]. This suggests that humidity is an important factor that influences particle loading. The presence of water vapor might also accelerate particle growth and encourage the accumulation of airborne firework particles.
It is also possible for humidity to be a surrogate parameter for other important control variables, so, for example, low humidity may occur when the conditions are very cold, which is likely to occur when the air is stable and pollutants accumulate [22,54]. It seems that factors such as the inversion height might be more critical in controlling Beijing’s firework particulate concentrations as celebratory fireworks come from a very large area source [22]. After fireworks were banned in 2018, the relative humidity continued to be the most important variable that influences both PM10 and PM2.5 (Figure 4). The parameter date_unix suggests a longer-term variation. Figure 4b shows that the contributions of relative humidity and temperature are related. The story is not so different at other locations, which showed similar plots of variable importance with weather data (not displayed here).

3.4. Changes over Space and Time

The development of restrictions on firework use in Beijing has evolved over many years [22,41], with increasing pressure to impose these beyond the 5th Ring Road. This has left its mark on particulate concentrations, as noted in Section 3.1, with a change in the firework pollution peaks, which differ between the inner city compared with more remote regions, places where firework pollution may be more apparent. Since 2011, firework sales have been declining, so vendors have often conducted business in outlying areas around Beijing [22]. The outer parts of Shenzhen have shown ineffective bans in the past as the highest particulate loads observed at Chinese New Year were in localities far from the city center (e.g., Kuiyong, Nanyou, and Nan’au) [17].
Thus far, our analysis has looked at average pollutant concentrations for a city, with the exception of Beijing, which was split into the values obtained from within and outside the 5th Ring Road. Figure 5a shows the maximum hourly PM2.5 concentrations for each site collected at 00:00/05:00 at each of the sites on the first morning of the New Year. Naturally, maximum values can be highly variable, but the picture is one of decreasing peak particulate concentrations over the years 2016/2019. However, the outer areas of Beijing became more polluted at the New Year as discussed in Section 3.1. Concentrations were low in 2020 when the COVID-19 pandemic resulted in many limitations on public activities. There was a rebound in 2021, but in 2022, New Year particulate concentrations fell to single digits, as noted on social media [55].
The inset of Figure 5a shows the difference between the maximum concentrations 00:00/05:00 on the first day of the New Year across the central sites of Beijing compared with the estimates for the maximum from the random forest method. This shows that the excess concentrations of PM2.5 have declined over the years (Kendall τ = −0.5; p2~0.1). It suggests that the increasing regulation of fireworks within the 5th Ring Road has led to the observed concentrations being in line with those predicted. It supports the notion that the firework bans in the city have led to a notable decline in firework-derived pollutants.
In Tianjin, the increasing regulation of fireworks resulted in a decline in the peak concentrations across the city after 2019 (Figure 5b). The concentrations in the urban areas (sites: 1015A, 1017A, 1018A, 1019A, and 1021A) showed a more notable decline compared with the more distant sites to the east (1023A, 1024A, and 1026A). There is little evidence of any increase in firework use at these more remote sites over time. The local government in Chongqing banned fireworks starting in 2019 [56]. The effectiveness of these regulations is very clear, as shown by a notable decline overall at the sites in 2019. The three sites in the more central urban areas that lie within the city Ring Expressway initially showed higher peak concentrations but decreased in 2019. Interestingly, the more remote sites, which were not necessarily covered by the regulations, also benefitted from the increasing restrictions placed on the use of fireworks. It reminds us that patterns of social behavior may have improvements well beyond the immediate area where regulations are directly applied (e.g., [57]).

4. Summary Discussion

Over the most recent decade, the use of fireworks to celebrate the New Year in China has gradually decreased. Such declines have a lengthier history in cities of southern China, such as Guangzhou and Hong Kong, and regulations in Nanjing were effective at reducing fireworks after 2013 [17]. Beijing has also increasingly enforced restrictions that have reduced firework use and the resultant pollution. Cities such as Hong Kong have long encouraged public rather than private displays of fireworks, which has kept the pollutants from celebrations low in this city and environmental impacts to a minimum [58]. Beijing has also promoted public displays, such as the pyrotechnic spectacle in Tiananmen Square to commemorate the 70th anniversary of the People’s Republic of China (20:00 on 1 October 2019). During these celebrations, nearby monitoring sites in Dongsi and Tiantan showed no peak because of the fireworks, and other researchers observed little effect from local emissions [59].
Our random forest analysis suggests that relative humidity dominates the variations in the particulate concentration in Beijing, before and after the six-hour fireworks periods. The model is effective in the absence of fireworks as variation arises from meteorological factors and broader trends in pollutant emissions within the city. The predicted concentrations during the firework period (in the early morning) were much lower than those observed concentrations at times when fireworks were heavily used. This supports the belief that on the first day of Chinese New Year, high concentrations can be attributed to fireworks rather than any special meteorological condition. When fireworks were banned in the central parts of Beijing in 2018, the modeled particulate concentrations were similar to those observed, suggesting a great reduction in emissions from the New Year celebrations.
Reduction in the private use of fireworks and the promotion of public pyrotechnic displays has led to low concentrations of particulate matter (e.g., in Hong Kong). The adoption of public displays has brought additional advantages, which include high-quality fireworks, large and spectacular displays, controlled times of emission, and the use of pyrotechnic experts who contribute to safe use of the explosives.

5. Conclusions

The private use of fireworks leads to a sharp peak in particulate concentrations across cities where there are no well-enforced restrictions in place. The random forest model is a useful predictor of the trend of particulate concentrations, allowing for contemporaneous weather conditions. Relative humidity was found to be an important predictor of particulate concentrations when firework sources were not dominant. The modeling supported the idea that the firework peak was the result of high pollutant emissions during New Year celebrations. In Beijing, large concentrations during the early part of the previous decade suggested that the widespread private use of fireworks led to peaks in particulate concentrations but increasing restrictions on fireworks have resulted in decreased concentrations at New Year. This pattern was repeated slightly later at Tianjin and Chongqing, as they imposed effective regulations. There are some hints that regulations may have been less stringently enforced in the outer parts of cities. Nevertheless, it is likely that social change caused a decline in firework use even beyond the areas where regulations were enforced. This study suggests that the replacement of private use of fireworks with public displays, light shows, and lanterns can reduce the concentration of particulate matter during Chinese New Year while maintaining the special character of these culturally significant celebrations.

Supplementary Materials

The following supporting information can be downloaded at: https://www.mdpi.com/article/10.3390/atmos13091388/s1, Figure S1: Comparison of observed and predicted PM2.5 concentrations using the random forest model trained using a window that covered 12 h before and after the firework period (00.00/05:00) and a window covering a 24 h before and after; Table S1: Statistical results of Mann-Whitney test for PM10, PM2.5, NO2 and SO2 between New Year’s Eve (before) [12:00/23:00] and fireworks period [00:00/05:00] in Beijing urban and suburban areas from 2014 to 2021; Table S2: Mean random forest model performance statistics for five sets of 50 models grown for the analysis; Table S3: Statistical results of Mann–Whitney test for PM10, PM2.5, NO2, and SO2 between New Year’s Eve (before) [12:00/23:00] and fireworks period [00:00/05:00] in Tianjin from 2015 to 2021; Table S4: Statistical results of Mann–Whitney test for PM10, PM2.5, NO2, and SO2 between New Year’s Eve (before) [12:00/23:00] and fireworks period [00:00/05:00] in Chongqing from 2015 to 2021; Table S5: Statistical results of Mann–Whitney test for PM10, PM2.5, NO2, and SO2 between New Year’s Eve (before) [12:00/23:00] and fireworks period [00:00/05:00] in Guangzhou from 2015 to 2021; Table S6: Statistical results of Mann–Whitney test for PM10, PM2.5, NO2, and SO2 between New Year’s Eve (before) [12:00/23:00] and fireworks period [00:00/05:00] in Shenzhen from 2015 to 2021; Table S7: Statistical results of Mann–Whitney test for PM10 and PM2.5 comparing observations and simulation [00:00/05:00].

Author Contributions

Conceptualization, Y.L. and P.B.; statistics, P.B.; machine learning, Y.L.; data curation, Y.L.; formal analysis, Y.L. and P.B.; writing—original draft preparation, Y.L. and P.B.; writing—review and editing, P.B.; visualization, P.B. All authors have read and agreed to the published version of the manuscript.

Funding

This research received no external funding.

Institutional Review Board Statement

Not applicable.

Informed Consent Statement

Not applicable.

Data Availability Statement

Data is available from the websites denoted with URLs.

Conflicts of Interest

The authors declare no conflict of interest.

References

  1. Brimblecombe, P. The clean air act after 50 years. Weather 2006, 61, 311–314. [Google Scholar] [CrossRef]
  2. Tao, A.; Liang, Q.; Kuai, P.; Ding, T. The Influence of Urban Sprawl on Air Pollution and the Mediating Effect of Vehicle Ownership. Processes 2021, 9, 1261. [Google Scholar] [CrossRef]
  3. Chao, Y.; Chen, R.; Young, C. Nian: When Chinese mythology affects air pollution. Lancet 2014, 383, 2125. [Google Scholar]
  4. Abdulwadud, O.; Ozanne-Smith, J. Injuries associated with fireworks in Victoria: An epidemiological overview. Inj. Prev. 1998, 4, 272–274. [Google Scholar] [CrossRef]
  5. Singh, A.; Bloss, W.J.; Pope, F.D. Remember, remember the 5th of November; gunpowder, particles and smog. Weather 2015, 70, 320–324. [Google Scholar] [CrossRef]
  6. Singh, A.; Pant, P.; Pope, F.D. Air quality during and after festivals: Aerosol concentrations, composition and health effects. Atmos. Res. 2019, 227, 220–232. [Google Scholar] [CrossRef]
  7. Kong, S.F.; Li, L.; Li, X.X.; Yin, Y.; Chen, K.; Liu, D.T.; Yuan, L.; Zhang, Y.J.; Shan, Y.P.; Ji, Y.Q. The impacts of firework burning at the Chinese Spring Festival on air quality: Insights of tracers, source evolution and aging processes. Atmos. Chem. Phys. 2015, 15, 2167–2184. [Google Scholar] [CrossRef]
  8. Liu, J.; Chen, Y.; Chao, S.; Cao, H.; Zhang, A. Levels and health risks of PM2.5-bound toxic metals from firework/firecracker burning during festival periods in response to management strategies. Ecotoxicol. Environ. Saf. 2019, 171, 406–413. [Google Scholar] [CrossRef]
  9. Hoyos, C.D.; Herrera-Mejía, L.; Roldán-Henao, N.; Isaza, A. Effects of fireworks on particulate matter concentration in a narrow valley: The case of the Medellín metropolitan area. Environ. Monit. Assess. 2020, 192, 6. [Google Scholar] [CrossRef]
  10. Mlakar, P.; Božnar, M.Z.; Grašič, B.; Popović, D. Fireworks air pollution in Slovenia. Int. J. Environ. Pollut. 2012, 50, 31–40. [Google Scholar] [CrossRef]
  11. Seidel, D.J.; Birnbaum, A.N. Effects of Independence Day fireworks on atmospheric concentrations of fine particulate matter in the United States. Atmos. Environ. 2015, 115, 192–198. [Google Scholar] [CrossRef]
  12. Tanda, S.; Ličbinský, R.; Hegrová, J.; Goessler, W. Impact of New Year’s Eve fireworks on the size resolved element distributions in airborne particles. Environ. Int. 2019, 128, 371–378. [Google Scholar] [CrossRef] [PubMed]
  13. Bhatnagar, S.; Dadhich, S. Measurement of airborne particulate matter concentration levels in the ambient atmosphere. J. Energy Res. Environ. Technol. 2015, 2, 12–13. [Google Scholar]
  14. Ambade, B. The air pollution during Diwali festival by the burning of fireworks in Jamshedpur city, India. Urban Clim. 2018, 26, 149–160. [Google Scholar] [CrossRef]
  15. Mukherjee, T.; Asutosh, A.; Pandey, S.K.; Yang, L.; Gogoi, P.P.; Panwar, A.; Vinoj, V. Increasing potential for air pollution over megacity New Delhi: A study based on 2016 Diwali episode. Aerosol Air Qual. Res. 2018, 18, 2510–2518. [Google Scholar] [CrossRef]
  16. Li, L.J.; Li, J.X.; Xin, L.Z.; Li, H.J.; Wei, Q. Analysis of atmospheric air pollution of Beijing City in Spring Festival period (Chinese). China Environ. 2006, 26, 537–541. [Google Scholar]
  17. Lai, Y.; Brimblecombe, P. Regulatory effects on particulate pollution in the early hours of Chinese New Year, 2015. Environ. Monit. Assess. 2017, 189, 467. [Google Scholar] [CrossRef]
  18. Huang, K.; Zhuang, G.; Lin, Y.; Wang, Q.; Fu, J.S.; Zhang, R.; Li, J.; Deng, F.Q. Impact of anthropogenic emission on air quality over a megacity -revealed from an intensive atmospheric campaign during the Chinese Spring Festival. Atmos. Chem. Phys. 2012, 12, 11631–11645. [Google Scholar] [CrossRef]
  19. Qian, Y.; Yuan, X.; Dou, W.; Hu, J.; Xia, J.; Li, D.; Zheng, Q.; Zhang, P.; Quan, Q.; Li, Y. Effects of fireworks on air quality in the main urban area of Nanchong City during the spring festival of 2014–2019. Environ. Eng. Res. 2022, 28, 220038. [Google Scholar] [CrossRef]
  20. Liu, Z.; Liu, Q.; Cao, X.; Zhang, X. Effects of residential customs on spatio-temporal pollution characteristics of fireworks burning during Chinese New Year. Asia Pac. J. Atmos. Sci. 2022, 58, 169–180. [Google Scholar] [CrossRef]
  21. Yao, L.; Wang, D.; Fu, Q.; Qiao, L.; Wang, H.; Li, L.; Sun, W.; Li, Q.; Wang, L.; Yang, X.; et al. The effects of firework regulation on air quality and public health during the Chinese Spring Festival from 2013 to 2017 in a Chinese megacity. Environ. Int. 2019, 126, 96–106. [Google Scholar] [CrossRef] [PubMed]
  22. Lai, Y.; Brimblecombe, P. Changes in air pollution and attitude to fireworks in Beijing. Atmos. Environ. 2020, 231, 117549. [Google Scholar] [CrossRef]
  23. Sun, Y.; Lei, L.; Zhou, W.; Chen, C.; He, Y.; Sun, J.; Li, Z.; Xu, W.; Wang, Q.; Ji, D.; et al. A chemical cocktail during the COVID-19 outbreak in Beijing, China: Insights from six-year aerosol particle composition measurements during the Chinese New Year holiday. Sci. Total Environ. 2020, 742, 140739. [Google Scholar] [CrossRef] [PubMed]
  24. Pang, N.; Gao, J.; Zhao, P.; Wang, Y.; Xu, Z.; Chai, F. The impact of fireworks control on air quality in four Northern Chinese cities during the Spring Festival. Atmos. Environ. 2020, 244, 117958. [Google Scholar] [CrossRef]
  25. Liu, D.; Li, W.; Peng, J.; Ma, Q. The effect of banning fireworks on air quality in a heavily polluted city in Northern China during Chinese Spring Festival. Front. Environ. Sci. 2022, 10, 872226. [Google Scholar] [CrossRef]
  26. Brimblecombe, P.; Lai, Y. Effect of fireworks, Chinese new year and the COVID-19 lockdown on air pollution and public attitudes. Aerosol Air Qual. Res. 2020, 20, 2318–2331. [Google Scholar] [CrossRef]
  27. Dai, Q.; Hou, L.; Liu, B.; Zhang, Y.; Song, C.; Shi, Z.; Hopke, P.K.; Feng, Y. Spring Festival and COVID-19 lockdown: Disentangling PM sources in major Chinese cities. Geophys. Res. Lett. 2021, 48, e2021GL093403. [Google Scholar] [CrossRef]
  28. Andradottir, H.O.; Thorsteinsson, T. Repeated extreme particulate matter episodes due to fireworks in Iceland and stakeholders’ response. J. Clean. Prod. 2019, 236, 117511. [Google Scholar] [CrossRef]
  29. Dangi, B.; Bhise, A. Effect of fireworks pollution on human health during Diwali Festival: A study of Ahmedabad, India. Indian J. Physiother. Occup. Ther. 2020, 14, 19–23. [Google Scholar]
  30. Garaga, R.; Kota, S.H. Characterization of PM10 and impact on human health during the annual festival of lights (Diwali). J. Health Pollut. 2018, 8, 181206. [Google Scholar] [CrossRef]
  31. Gudmundsson, G.; Andradottir, H.O.; Thorsteinsson, T. Fireworks pollution and its impacts on pulmonary health of Icelanders (In Icelandic: Mengun af völdum flugelda og áhrif á lungnaheilsu Íslendinga). Læknabladid 2018, 104, 576–577. [Google Scholar]
  32. Greven, F.E.; Vonk, J.M.; Fischer, P.; Duijm, F.; Vink, N.M.; Brunekreef, B. Air pollution during New Year’s fireworks and daily mortality in the Netherlands. Sci. Rep. 2019, 9, 5735. [Google Scholar] [CrossRef] [PubMed]
  33. Croteau, G.; Dills, R.; Beaudreau, M.; Davis, M. Emission factors and exposures from ground-level pyrotechnics. Atmos. Environ. 2010, 44, 3295–3303. [Google Scholar] [CrossRef]
  34. Pirker, L.; Gradišek, A.; Višić, B.; Remškar, M. Nanoparticle exposure due to pyrotechnics during a football match. Atmos. Environ. 2020, 233, 117567. [Google Scholar] [CrossRef]
  35. Prakash, N.U.; Sripriya, N.; Gowtham, K.; Suresh, S.; Sampathkumar, B.; Bhuvaneswari, S. A study on the impact of fire crackers on airborne microflora during diwali. Heliyon 2019, 5, e02202. [Google Scholar] [CrossRef] [PubMed] [Green Version]
  36. Hickey, C.; Gordon, C.; Galdanes, K.; Blaustein, M.; Horton, L.; Chillrud, S.; Ross, J.; Yinon, L.; Chen, L.C.; Gordon, T. Toxicity of particles emitted by fireworks. Part. Fibre Toxicol. 2020, 17, 28. [Google Scholar] [CrossRef]
  37. Fu, H.; Yang, Z.; Liu, Y.; Shao, P. Ecological and human health risk assessment of heavy metals in dust affected by fireworks during the Spring Festival in Beijing. Air Qual. Atmos. Health 2021, 14, 139–148. [Google Scholar] [CrossRef]
  38. Kumar, M.; Snow, D.D.; Li, Y.; Shea, P.J. Perchlorate behavior in the context of black carbon and metal cogeneration following fireworks emission at Oak Lake, Lincoln, Nebraska, USA. Environ. Pollut. 2019, 253, 930–938. [Google Scholar] [CrossRef]
  39. Kaur, B.; Kaul, V.K. Consumers of Fireworks and Pollution in India: Implications for Marketers and State Policy. Indian J. Market. 2018, 48, 50–60. [Google Scholar] [CrossRef]
  40. Nicholson, R.D. Banal Profundity and Profound Banality: Three Exercises in Reading Hong Kong. TDR 2022, 66, 158–173. [Google Scholar] [CrossRef]
  41. Zhou, X.; Zhou, C. Folklore and law: Fireworks and firecrackers as a “China issue”. J. Hubei Univ. Natl. 2018, 36, 48–58. [Google Scholar]
  42. Sokhi, R.S.; Singh, V.; Querol, X.; Finardi, S.; Targino, A.C.; de Fatima, A.M.; Pavlovic, R.; Garland, R.M.; Massagué, J.; Kong, S.; et al. A global observational analysis to understand changes in air quality during exceptionally low anthropogenic emission conditions. Environ. Int. 2021, 157, 106818. [Google Scholar] [CrossRef] [PubMed]
  43. Grange, S.K.; Carslaw, D.C. Using meteorological normalisation to detect interventions in air quality time series. Sci. Total Environ. 2019, 653, 578–588. [Google Scholar] [CrossRef] [PubMed]
  44. Grange, S.K.; Carslaw, D.C.; Lewis, A.C.; Boleti, E.; Hueglin, C. Random forest meteorological normalisation models for Swiss PM10 trend analysis. Atmos. Chem. Phys. 2018, 18, 6223–6239. [Google Scholar] [CrossRef]
  45. Grange, S.K.; Lee, J.D.; Drysdale, W.S.; Lewis, A.C.; Hueglin, C.; Emmenegger, L.; Carslaw, D.C. COVID-19 lockdowns highlight a risk of increasing ozone pollution in European urban areas. Atmos. Chem. Phys. 2021, 21, 4169–4185. [Google Scholar] [CrossRef]
  46. Chatterjee, A.; Sarkar, C.; Adak, A.; Mukherjee, U.; Ghosh, S.K.; Raha, S. Ambient air quality during Diwali Festival over Kolkata-a mega-city in India. Aerosol Air Qual. Res. 2013, 13, 1133–1144. [Google Scholar] [CrossRef] [Green Version]
  47. Wang, X.; Duan, W.; Zhu, J.; Wei, W.; Cheng, S.; Mao, S. Nonlinear influence of winter meteorology and precursor on PM2.5 based on mathematical and numerical models: A COVID-19 and Winter Olympics case study. Atmos. Environ. 2022, 278, 119072. [Google Scholar]
  48. Zhang, Z.; Zhao, X.; Mao, R.; Xu, J.; Kim, S.J. Predictability of the winter haze pollution in Beijing—Tianjin—Hebei region in the context of stringent emission control. Atmos. Pollut. 2022, 13, 101392. [Google Scholar] [CrossRef]
  49. Brimblecombe, P.; Zong, H. Citizen perception of APEC blue and air pollution management. Atmos. Environ. 2019, 214, 116853. [Google Scholar] [CrossRef]
  50. Gao, Y. Tianjin Bans Fireworks in City Proper; CGTN: Beijing, China, 2018. [Google Scholar]
  51. Peng, Y.; Sui, Z.; Zhang, Y.; Wang, T.; Norris, P.; Pan, W.-P. The effect of moisture on particulate matter measurements in an ultra-low emission power plant. Fuel 2019, 238, 430–439. [Google Scholar] [CrossRef]
  52. Hernandez, G.; Berry, T.A.; Wallis, S.; Poyner, D. Temperature and humidity effects on particulate matter concentrations in a sub-tropical climate during winter. Int. Proc. Chem. Biol. Environ. 2017, 102, 8. [Google Scholar]
  53. Han, X.; Zhang, X. Experimental study on a residential temperature–humidity separate control air-conditioner. Energy Build. 2011, 43, 3584–3591. [Google Scholar] [CrossRef]
  54. Cheng, Y.; He, K.B.; Du, Z.Y.; Zheng, M.; Duan, F.K.; Ma, Y.L. Humidity plays an important role in the PM2.5 pollution in Beijing. Environ. Pollut. 2015, 197, 68–75. [Google Scholar] [CrossRef] [PubMed]
  55. BEMW. The Night Air Quality in Chinese New Year’s Eve 2022 Was the Best in the Same Period of the Calendar Year (in Chinese), Beijing Enablevironmental Monitoring Weibo. 2022. Available online: https://www.bevoice.com.cn/newbevoice/content.jsp?urltype=news.NewsContentUrl&wbtreeid=1004&wbnewsid=55278 (accessed on 25 May 2022).
  56. CQGov. Chongqing Municipal Regulation on the Administration of Fireworks and Firecrackers, Chongqing Government. Available online: http://gaj.cq.gov.cn/zwgk/zfxxgkml/zcwj/dfxfg/202101/t20210121_8795088_wap.html (accessed on 15 July 2022).
  57. Brimblecombe, P.; Lai, Y. Effect of sub-urban scale lockdown on air pollution in Beijing. Urban Clim. 2020, 34, 100725. [Google Scholar] [CrossRef]
  58. HKSAR. Impacts of Fireworks on Air Quality (2013), The Government of the Hong Kong Special Administrative Region. Available online: http://www.info.gov.hk/gia/general/201302/20/P201302200272.htm (accessed on 18 August 2017).
  59. Wang, Z.; Liu, C.; Dong, Y.; Hu, Q.; Liu, T.; Zhu, Y.; Xing, C. Profiling of dust and urban haze mass concentrations during the 2019 National Day Parade in Beijing by polarization Raman LIDAR. Remote Sens. 2021, 13, 3326. [Google Scholar] [CrossRef]
Figure 1. Map showing the cities mentioned in the text. Notes A. Afghanistan; B. Bhutan; Ban. Bangladesh; Nep. Nepal; N.K. North Korea; Pakis. Pakistan; S.K. South Korea; Taj. Tajikistan; Thai. Thailand; Viet. Vietnam.
Atmosphere 13 01388 g001
Figure 2. Concentrations of PM10, PM2.5, NO2, and SO2 for Beijing-u (ad) and Beijing-s (eh), which are the more urban and suburban parts within and beyond the 5th Ring Road, Tianjin (il), Chongqing (mp), Guangzhou (qt), and Shenzhen (ux) from midday on New Year’s Eve to the middle of the first day of the new year from 2014 to 2021. Note: 2014 and 2021 absent from some sites.
Atmosphere 13 01388 g002
Figure 3. Mean modeled (light blue line) and observed (dark blue points) concentrations for more urban and central Beijing (a) PM10 and (b) PM2.5; suburban Beijing beyond the 5th Ring Road (c) PM10, (d) PM2.5, (e) NO2 and (f) SO2; Tianjin (g) PM10 and (h) PM2.5; Chongqing (i) PM10 and (j) PM2.5; Guangzhou (k) PM10 and (l) PM2.5; and Shenzhen (m) PM10 and (n) PM2.5. Note: in the case of NO2 the modeled output is as a yellow line with observed values as red points and in the case of SO2 the observed values are ochre.
Atmosphere 13 01388 g003
Figure 4. (a) Mean variable importance (permutation difference) for particles from fireworks in Beijing under different regulatory conditions and (b) variable importance of relative humidity (rh) as a function of temperature (air-temp) Note: the small error bars represent the 95% confidence interval of the average predicted value from 50 random forest models.
Atmosphere 13 01388 g004
Figure 5. Maximum hourly PM2.5 concentrations for measurements at individual sites 00:00/05:00 on the first day of the New Year at more central sites (red) and remote sites (green) in (a) Beijing (b)Tianjin, and (c) Chongqing. The inset shows the difference between observations of PM2.5 concentrations at more central sites in Beijing and random forest predictions. Note: the site definitions are defined in the text.
Atmosphere 13 01388 g005
Publisher’s Note: MDPI stays neutral with regard to jurisdictional claims in published maps and institutional affiliations.

