Article

Spatio-Temporal Variation of Precipitation and Evaporation on the Tibetan Plateau and Their Influence on Regional Drought

1
Changjiang River Scientific Research Institute, Wuhan 430010, China
2
Department of Hydraulic Engineering, Tsinghua University, Beijing 100084, China
3
State Key Laboratory of Hydroscience and Engineering, Tsinghua University, Beijing 100084, China
*
Author to whom correspondence should be addressed.
Atmosphere 2022, 13(8), 1323; https://doi.org/10.3390/atmos13081323
Submission received: 22 July 2022 / Revised: 12 August 2022 / Accepted: 17 August 2022 / Published: 19 August 2022
(This article belongs to the Special Issue Hydrological Responses under Climate Changes)

Abstract

:
The Tibetan Plateau (TP) is an important water source in Asia, and precipitation and evaporation patterns at different geographical and temporal scales play a significant role in managing water resource distribution. Based on quality control data from 87 meteorological stations, this study analyzed the spatial and temporal evolution patterns of precipitation and pan evaporation (Epan) on the TP in 1966–2016 using the Mann–Kendall test, the moving t-test, wavelet analysis, Sen’s slope method, and correlation analysis. The results revealed that the average mean temperature in the TP area increased by about 2.1 °C during the study period, and precipitation steadily increased at an average rate of 8.2 mm/10a, with summer and autumn precipitation making up about 80% of the year. In contrast, Epan showed an overall decreasing trend at a decline rate of 20.8 mm/10a, with spring and summer Epan values making up about 67% of the year. The time series of the precipitation and Epan within the TP region clearly exhibit nonstationary features. Precipitation is more concentrated in the southeast than in the northwest, while Epan is mostly concentrated in the southwest and northeast of the plateau around the Qaidam Basin. The “evaporation paradox” phenomenon was common in the TP region for about 40 years (1960s–1990s) and gradually faded in the 21st century. In addition, we introduced a standardized precipitation evaporation index (SPEI) to investigate the differences and relationships between precipitation and Epan time series over the past 50 years. The findings indicate that the southern Qinghai was dominated by an arid trend, while the central and southeast TP remained wet. Droughts and floods coexist in the eastern Qinghai and southern Tibet areas with high population concentrations, and the risk of both is rising as the inhomogeneity of precipitation distribution in the TP region will increase in the future. This study can be used as a reference for managing water resources and predicting regional drought and flood risk.

1. Introduction

Precipitation and evaporation are not only two essential hydrological processes in the regional water cycle, but also closely related key factors in determining the spatial pattern of water resources [1,2]. The hydrological cycle processes of precipitation, runoff, and evaporation have accelerated and altered the spatial and temporal distribution of water resources based on the global warming, with significant implications on natural eco-environmental systems, resource development, and utilization [3,4,5]. Additionally, the alteration of the caused by human activities has had an impact on the intensity of regional evaporation [6] and destabilized the atmospheric water content, which to some extent increased the risk of regional flood and drought disasters and endangers vegetation ecosystems [7,8], agricultural security [9], and economic and social development [10]. Therefore, investigating regional precipitation and evaporation patterns and trends is of practical significance for regional drought risk assessment and water security planning and management.
Being the highest-altitude region in the world, unique natural geomorphic units and fragile natural environment of the Tibetan Plateau (TP) present high sensitivity to climate change [11,12], which has recently received widespread attention. In the context of climate change, seasonal droughts and extreme heavy precipitation events brought on by anomalies in precipitation and evaporation are taking place in the TP area [13,14]. Many studies have reported that there has been an overall trend of some increase in precipitation on the TP since the 1950s [15,16], which has also sped up the plateau’s inner water resource buildup and plateau lake expansion [17]. Due to the impact of monsoon circulation, the commencement of the precipitation season is more regionally heterogeneous [18]. Current scholarly research mainly focuses on precipitation trends, intensity and frequency indicators [16,19,20], and it is widely considered to have significant seasonal and regional characteristics. However, studies on meteorological drought brought on by precipitation fluctuation on the TP are relatively lacking, and specific area differences in drought variability are not well-understood. On the other hand, it is impossible to overlook how regional water balance and drought are affected by evaporation anomalies [21]. Pan evaporation (Epan) has been utilized as a significant method by meteorological departments to determine the demand for atmospheric evaporation due to the numerous challenges associated with the measurement and calculation of actual evaporation [22]. Epan displays a strong consistency with the actual evaporation in terms of trend despite the variations [23]. Based on this, various researchers have examined the topic extensively and widely concluded that Epan has shown a decreasing trend in recent decades both worldwide [24,25,26,27,28] and in the TP regions [29,30]. For example, Liu et al. [31] pointed out that the overall decreasing trend of Epan in the TP region was 3.06 mm/a from 1970 to 2005, and Yao et al. [32] simulated TP evaporation based on the PenPan model and found that there was a significant decreasing trend in the 1980s, with abrupt changes in 1989 and 1996 [33]; some scholars also suggested that this decreasing trend continued into the early 21st century [34,35]. Hence, it is clear that there are still some controversies regarding the analysis of the Epan trend in the TP region over a short period of time. Additionally, precipitation and evaporation on the TP are governed by various factors, such as water vapor content, radiation flux, wind speed, and relative humidity [36,37]. Researchers have established regional precipitation and evaporation models and produced a series of innovative findings using meteorological observation data, MSWEP, TRMM, other multisource reanalysis datasets, and GIS technology [38,39,40]. However, previous studies mostly focused on the exploration of single factors of meteorological elements and largely treated precipitation and evaporation as separate hydrological processes for attribution analysis, while studies using their trend changes and interconversion mechanisms to assess the influence of the hydrological cycle on the climate system are still relatively few, and the limitations of the study area and differences in data simulations lead to an unclear understanding of the TP water resources change patterns. Hence, the discussion of particular variations in precipitation and evaporation trends and their hydrological response to climate change remains attractive.
Based on the data of each meteorological station on the TP in 1966–2016, this study attempted to analyze the spatial and temporal distribution patterns and trends of precipitation and evaporation against the backdrop of climate change and explore the interactions and constraints between the two hydrological processes. The methods used include the Mann–Kendall test, the moving t-test, wavelet analysis, and correlation analysis. Considering the effects of regional evaporation and temperature changes on water deficit, we also introduced a standardized precipitation evaporation index (SPEI) to quantitatively assess the drought distribution and drought characteristics in the TP region and predict water abundance and deficit in the future based on the current drought trend. Therefore, the study of the TP precipitation and evaporation trends and interrelationships is a significant reference for uncovering regional hydrological cycle change patterns and scientifically formulating countermeasures for water resources management in response to future climate change.

2. Study Area and Data

2.1. Overview of the Study Area

The TP is a region geographically located in southwest China (26.2–39.8° N, 73.4−104.5° E) (Figure 1), with an average elevation of 4000 m above sea level and a total area of around 2.5 million kilometers. It mainly includes the whole of the Tibet Autonomous Region, Qinghai Province, and parts of the Xinjiang Uygur Autonomous Region, Gansu Province, Sichuan Province, and Yunnan Province. Strong solar radiation, complex and varied climate, and different dry and wet seasons are all results of the unique topography and geomorphological features of the plateau. The average annual temperature in the study area varies from south to north between 20 and 5 °C, and the average annual precipitation varies between 2000 and 50 mm. The TP is rich in water resources as the source of many Asian rivers, including the Yangtze River, the Yellow River, and the Indus River. However, the stability of water resource systems is being seriously challenged with the growing trend of global warming.

2.2. Data Sources

The meteorological data applied for this study mainly include daily average temperature (Tavg), daily maximum temperature (Tmax), daily minimum temperature (Tmin), relative humidity (RH), daily precipitation (P), and daily pan evaporation (Epan), etc. The earliest year that the meteorological stations in the TP region were cataloged is 1951, but some of the them lack data due to variances in station building dates, monitoring methods, and other considerations. Therefore, 87 meteorological stations with good integrity in the study area were selected to have quality-controlled time series data from 1966 to 2016 (51 years), which were obtained from the National Meteorological Information Center (http://www.nmic.cn/, accessed on 1 March 2022). Temperature and relative humidity were standardized to eliminate wrong data. The daily value meteorological data with null values were defined as missing data. According to statistical analysis, the percentage of missing precipitation data among the selected meteorological stations was about 1.70% and the percentage of missing Epan was about 18.08%. For the problem of missing precipitation data, correlation analysis was carried out based on station location and record years, and interpolation was performed using adjacent stations or similar years with correction for singular values. For the problem of missing Epan data, the Hargreaves–Samani model [41] was used to linearly fit the existing data, and the fitted relationship was then used to linearly interpolate the missing data. The seasons were divided into spring (March–May), summer (June–August), autumn (September–November), and winter (December–the following February). The location and distribution of each meteorological station are shown in Figure 1.

3. Research Methods

3.1. Standardized Precipitation Evaporation Index

The standardized precipitation evaporation index (SPEI), an improved drought index [42], takes into account the impact of evaporation on drought in a changing environment [43]; it can characterize regional multiscale drought intensity, frequency, and spatial and temporal variability in terms of water deficit and duration. This approach has been used successfully in numerous studies [44,45,46]. The main step in this study’s calculation of the SPEI was application of the Hargreaves–Samani formula to estimate potential evaporation (PET):
P E T = 0.0023 · R a · T 0.5 ( T a v g + 17.8 )
where Tavg is the average temperature (°C), T is the temperature difference (°C), and Ra is the extraterrestrial radiation (mm/day).
The cumulative difference series of precipitation and PET over various timescales was built as follows:
D n k = i = 0 k 1 ( P n i P E T n i )
A three-parameter log-logistic probability distribution function was introduced to fit Di, calculate the probability density of the difference series, and derive the cumulative probability distribution function:
f ( x ) = β α ( x γ α ) β 1 [ 1 + ( x γ α ) β ] 2
F ( x ) = [ 1 + ( α x γ ) β ] 1
The SPEI was determined after the difference series were standardized to be normal:
S P E I = W C 0 + C 1 + C 2 W 2 1 + d 1 W + d 2 W 2 + d 3 W 3
W = 2 l n ( P ) ,   P 0.5
where P is the cumulative probability, P is replaced by 1 − P if P > 0.5, and the value takes the opposite number. The other parameters are C0 = 2.515517, C1 = 0.802853, C2 = 0.010328, d1 = 1.432788, d2 = 0.189269, and d3 = 0.001308, respectively. Based on the annual and monthly scales, the SPEI is divided into eight categories of drought: extreme drought (SPEI ≤ −2.0), severe drought (−2.0 < SPEI ≤ −1.5), moderate drought (−1.5 < SPEI ≤ −1.0), mild drought (−1.0 < SPEI ≤ 0) and mildly wet (0 < SPEI ≤ 1), moderately wet (1 < SPEI ≤ 1.5), severely wet (1.5 < SPEI ≤ 2), and extremely wet (SPEI > 2) [47].

3.2. Trend Testing and Cycle Analysis

3.2.1. Mann–Kendall Test

Due to its simplicity and validity, the M–K test, a reliable nonparametric statistical test, is frequently used to examine results of trend analyses of hydrological variables, meteorological components, and other time series [48]. The null hypothesis H0 constructed in this study was that long time series were independent identically distributed random sample values with no trend of variation, and its statistical variables S were computed as follows:
S = i = 1 n 1 j = i + 1 n s g n ( x j x i )
s g n ( x j x i ) = { 1 ,     x j x i > 0 0 ,     x j x i = 0 1 ,     x j x i < 0
The statistic S is thought to roughly follow a normal distribution when the sample size n > 10, and its variance can be expressed as follows:
v a r ( S ) = 1 18 [ n ( n 1 ) ( n 5 ) t f t ( f t 1 ) ( 2 f t + 5 )
where ft is the number of samples in each group and t is the number of groups of identical samples in the time series.
The statistic variable Z for the standard normal distribution was calculated as follows:
Z = { S 1 v a r ( S ) ,     S > 0 0 ,     S = 0 S + 1 v a r ( S ) ,     S < 0
At a particular degree of confidence, if |Z| ≥ |Z1−α/2|, the null hypothesis H0 is rejected, there is a significant upward (Z > 0) or downward (Z < 0) trend in this time series. When |Z| ≥ 1.28, 1.96, or 2.32, the time series is said to pass the significance test with a 90%, 95%, or 100% confidence level, respectively.
The rank sequence Sk was created based on the time series (x1, x2, …, xn) for additional mutation checks:
S k = i = 1 k r i , k = 2 , 3 , , n
r i = { + 1 ,     x i > x j 0 ,     o t h e r
The statistics were established as follows:
U F k = S k E ( S k ) v a r ( S k ) ,   k = 2 , 3 , , n
E ( S k ) = n ( n 1 ) 4 ,   k = 2 , 3 , , n
v a r ( S k ) = n ( n 1 ( 2 n + 5 ) ) 72 ,   k = 2 , 3 , , n
where E(Sk), var (Sk) are the mean and variance of Sk, respectively.
The above process was repeated in the inverse order of the time series (xn, xn − 1, …, x1) and let UB1 = 0 and UBk = −UFk (k = n, n − 1, …, 1). A mutation in the sequence was indicated when the resulting statistical sequence UFk and UBk intersected between the critical lines.

3.2.2. Moving T-Test

This work introduced the moving t-test to compound the time series to increase the accuracy of mutation analysis because the M–K test may include virtual mutation spots. The fundamental concept is to define the statistic t and subdivide the time series sample values into two subseries, x1 and x2:
t = ( x 1 ¯ x 2 ¯ ) / ( s 1 n 1 + 1 n 2 )
s = ( n 1 s 1 2 + n 2 s 2 2 ) / ( n 1 + n 2 2 )
where x1 and x2, s1 and s2 are the mean and variance of the subseries, respectively, and the statistic t follows t-distribution with degrees of freedom equal to n1 + n2 − 2. The time series detected abrupt changes at the benchmark if |ti| > tα at a particular significance level α.

3.2.3. Wavelet Analysis

Wavelet analysis can accurately analyze nonstationary hydrological time series from the time domain and the frequency domain perspectives to reveal the periodic variation patterns and intrinsic structural characteristics of precipitation and evaporation series at multiple timescales and has been widely used in climate research [49,50]. The Morlet wavelet used in this study is a nonorthogonal complex-valued wavelet with good temporal aggregation and high frequency resolution. Following is the primary calculating formula.
Wavelet function is a cluster of functions with an oscillation period defined as follows:
+ φ ( t ) d t = 0
Morlet wavelets are the wavelet basis functions used in this study:
φ ( t ) = e t 2 / 2 e i ω 0 t
where i is the imaginary number and ω0 is the constant.
The supplied time series signal was decomposed using the discrete wavelet transform (DWT), and various wavelet coefficients were produced by altering the scale scaling and time translation parameters.
W f ( a , b ) = | a | 0.5 Δ t k = 1 N f ( k · Δ t ) · φ ( k · Δ t b a )
where Wf(a,b) is the wavelet transform coefficient, f(k·Δt) indicates the time series, Δt is the time interval, a is the timescale factor, and b indicates the time translation factor.
The wavelet variance (Var) was calculated as follows:
V a r ( a ) = + | W f ( a , b ) | 0.5 d b
The main cycles of the time series’ fluctuation evolution trend could be reflected in the wavelet coefficient diagram created using the wavelet transform. Positive coefficients indicate large values of meteorological elements in the corresponding period, while negative coefficients indicate small values. The wavelet variance diagram could show the fluctuation trend’s strong and weak change characteristics for various cycles of the time series. The extreme value of the variance corresponds to the main period of the meteorological element values, and the combination of the two has significant benefits for improving the comprehension of period and timescale features.

3.3. Other Methods

In order to reduce the influence of time series outliers on the trend, the linear trend of precipitation, Epan, and the SPEI on the TP was determined using Sen’s slope (β) and the moving average approach. Arcgis was used to analyze the spatial pattern of precipitation, Epan, and the SPEI on the TP. Additionally, correlation coefficients (confidence level taken as 95% or 99%) and normalized index were calculated to study the relationship between precipitation, Epan, and the SPEI in time and space.

4. Results and Analysis

4.1. Precipitation Characteristics and Trends at Multiple Scales

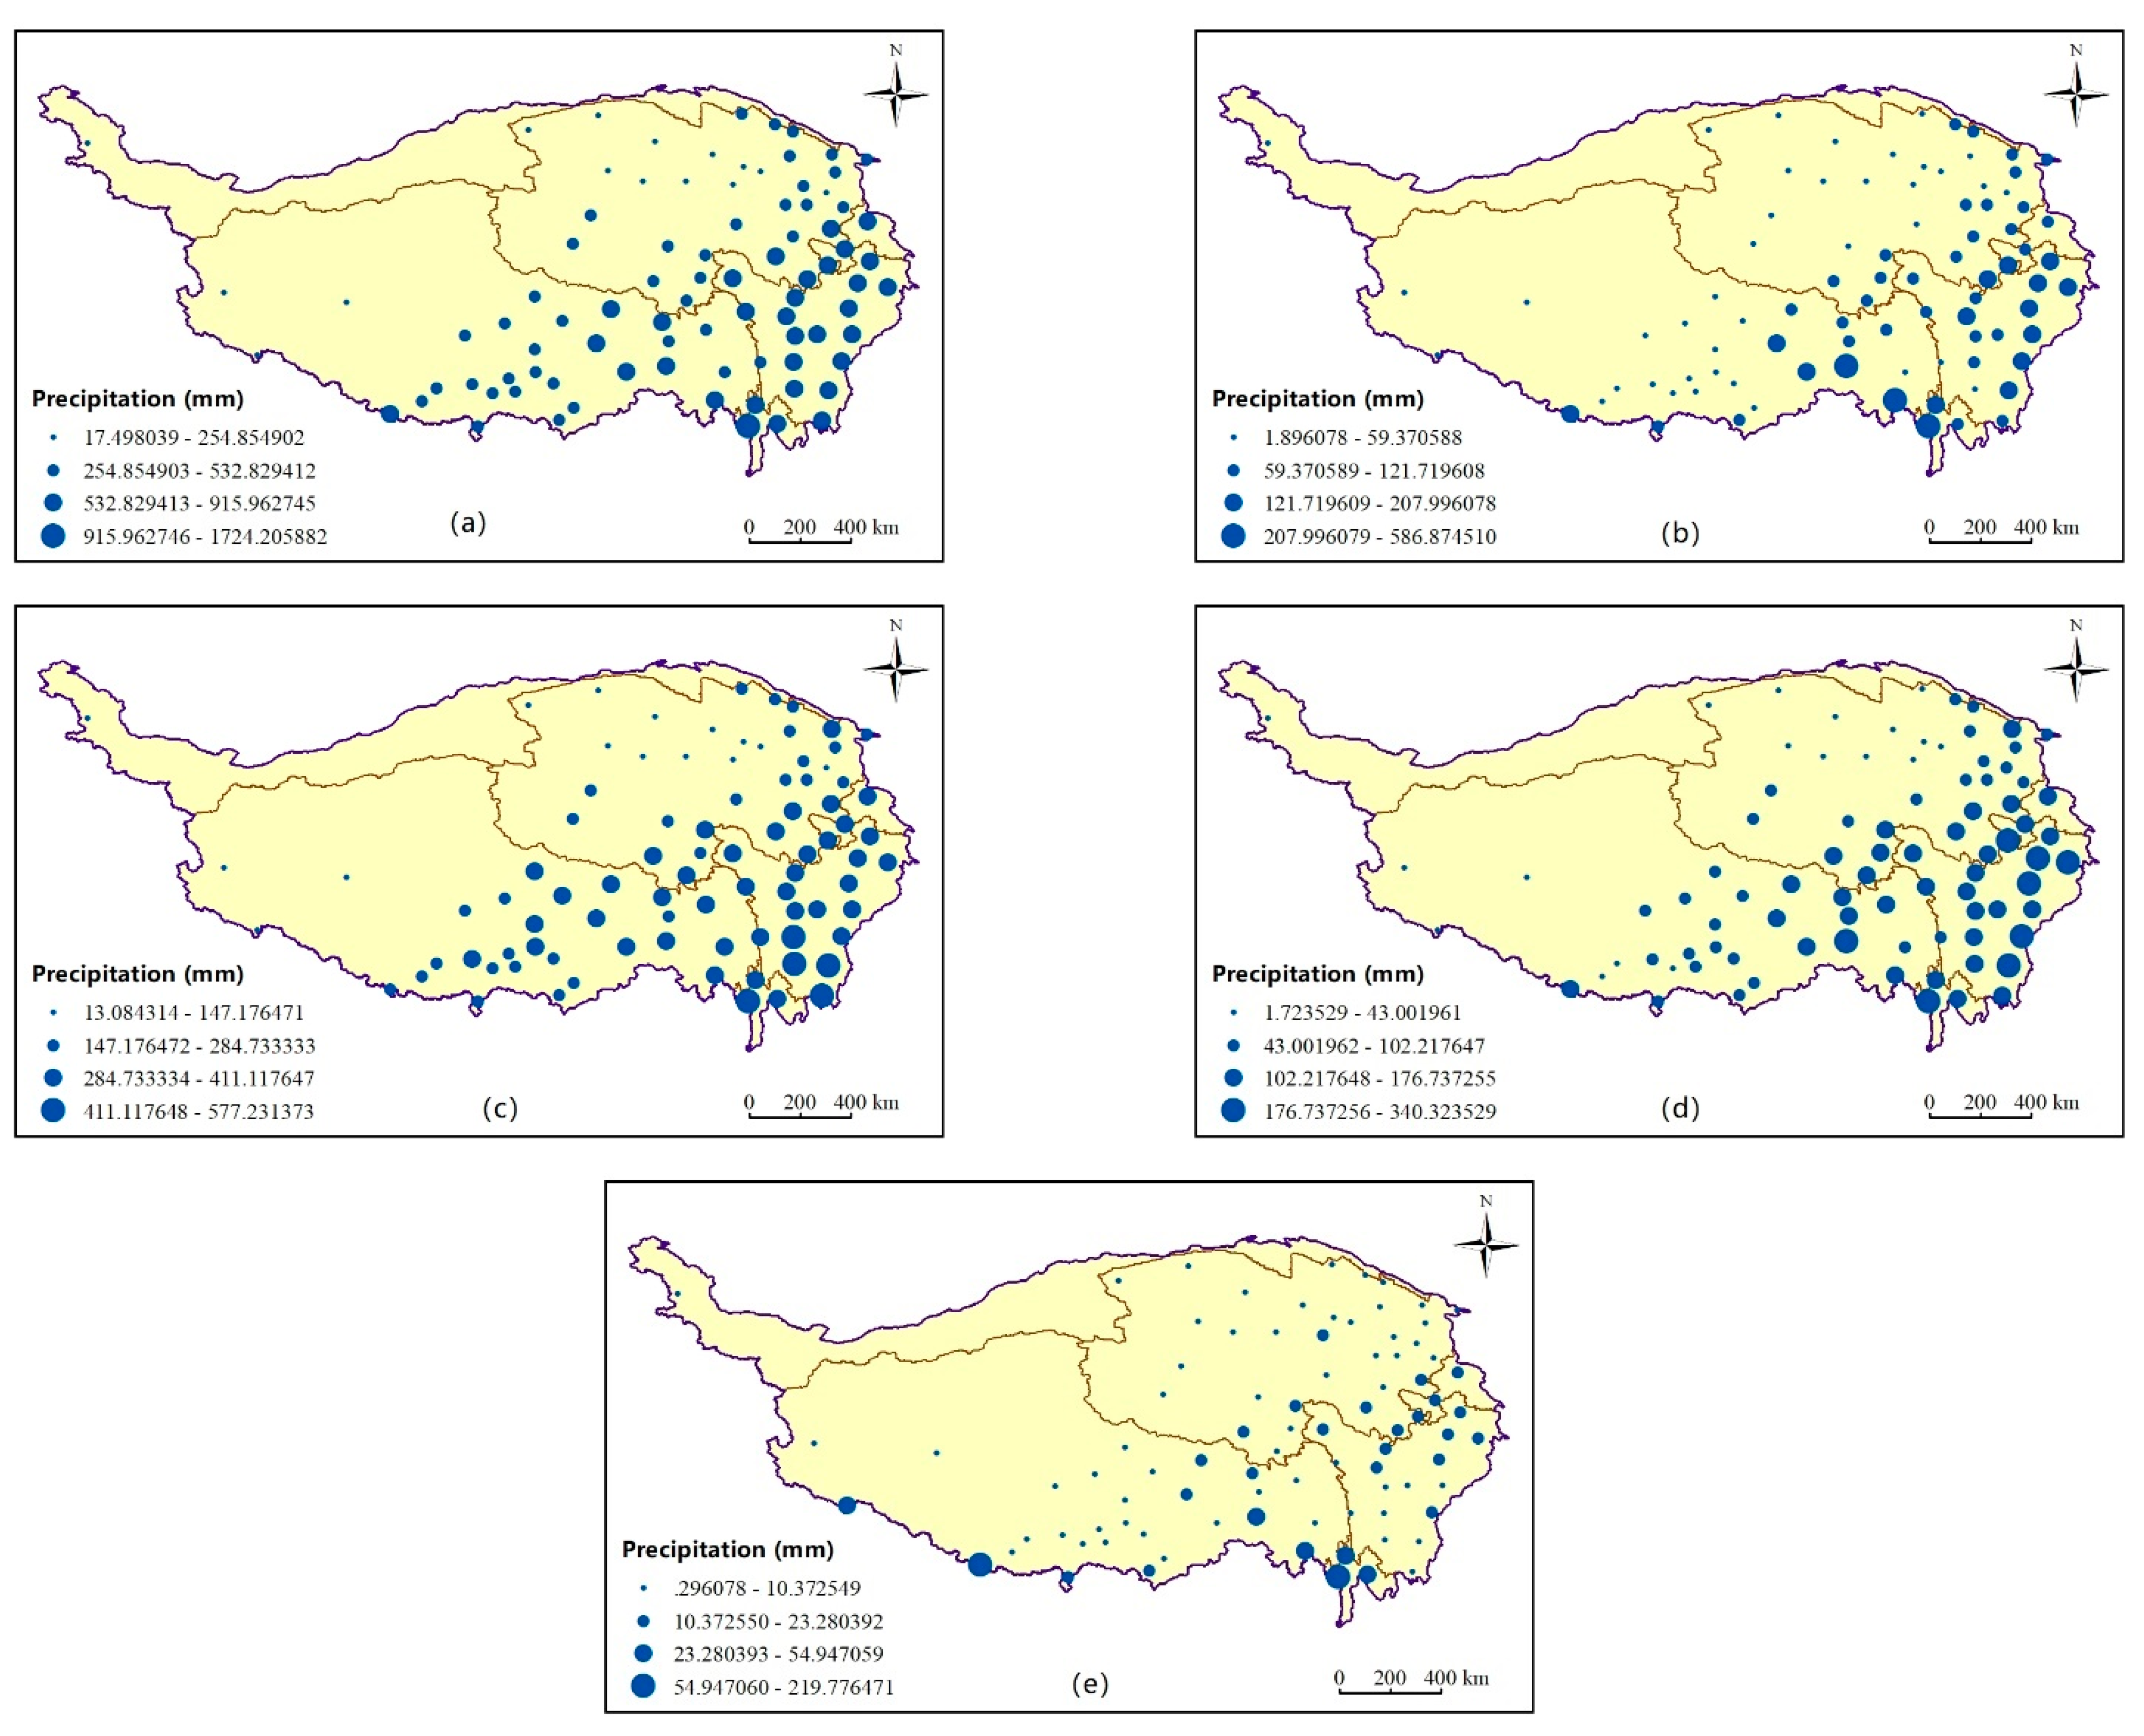
4.1.1. Spatial and Temporal Patterns of Precipitation

Based on the precipitation data from each meteorological station, the TP area’s annual average precipitation and seasonal precipitation variation were determined (Figure 2). As can be seen, between 1966 and 2016, the plateau received 340.3 mm of precipitation a year on average, with a variation of 289.2 to 385.8 mm. According to the results of the Sen’s slope trend analysis, the plateau’s annual precipitation exhibited a moderately significant fluctuating increasing trend (β = 8.2 mm/10a). Specifically, precipitation was below average and slowly increased from the 1960s to the 1980s, with a brief significant dip in the 1990s and then a generally consistent upward trend.
In the spring, summer, autumn, and winter, respectively, there were 56.0 mm, 204.7 mm, 69.2 mm, and 10.4 mm of precipitation on average during the research period. The spring and summer precipitation values passed the significance test at a 95% confidence level, as shown in Figure 2b,c, and exhibited a comparable annual variance with a fluctuating increasing trend. The 5-year moving average curve demonstrated that the increasing trend of spring precipitation was comparatively stable over the study period, whereas the summer precipitation values were almost nonexistent prior to 1997, then suddenly increased after 1997 and were stable at the beginning of the 21st century, with multiyear average precipitation increasing from 198.6 mm to 215.1 mm. The results of the M–K trend test found that the series of precipitation data in autumn and winter showed an overall nonsignificant increasing trend, with the exception that the autumn precipitation series fluctuated more and the winter counterpart increased and then decreased, with 1988 as the dividing line.
The spatial distribution of the multiyear average precipitation in the TP area over the course of the study was depicted in Figure 3. With the maximum precipitation value occurring at Gongshan station in the southeast (1723.97 mm) and the minimum precipitation value occurring at Lenghu station in the northwest (17.11 mm), the precipitation in the southeastern part of the plateau was specifically higher than that in the northwestern part, indicating a significant difference in the annual average precipitation in different regions. According to Figure 3b, spring precipitation had a sort of “boundary effect” (higher precipitation levels) in the southern and eastern parts of the plateau, whereas the middle portion received less. After the start of the warm and humid season, precipitation progressively moved to the central and western parts of the TP, where it increased significantly across a wide area. However, the increase in precipitation values near the Qaidam Basin in the plateau’s northern half was less than 100 mm. Precipitation differences within the plateau were not noticeable against the backdrop of generally lower winter temperatures, with heavier precipitation taking place solely near the southern plateau boundary and 86.2% of the stations receiving less than 20 mm of precipitation (Figure 3e). Additionally, precipitation is concentrated in the western Sichuan and northern Yunnan areas, especially in summer and autumn, and the precipitation recharge continues being a crucial water foundation for the region.
The annual and seasonal precipitation was analyzed using the M–K method on a site-by-site basis inside the plateau in order to evaluate the spatial pattern of precipitation trend variations in the TP region. It can be seen that 84% of the stations in the TP region showed an increasing trend in the annual mean precipitation series in 1966–2016, with 22 of them exceeding the significance level (α = 5%). The growing tendency was noticeably stronger in the northern and southern parts of the plateau (Figure 4a), with the northern Wudaoliang station (β = 20.3 mm/10a) showing the strongest trend. Some areas of the Jinsha River basin showed an insignificant decreasing trend of precipitation (the minimum Sen’s slope was −15 mm/10a at Muli station), while the stations with insignificantly increasing trends of precipitation were concentrated in the Yarlung Tsangpo River basin and some parts of western Sichuan, and the average annual precipitation in all these areas was relatively abundant.
From the seasonal scale trends, it can be seen that 33 sites exhibited a significant increase in precipitation series in spring, with a maximum Sen’s slope of 20.8 mm/10a, whereas only 11 sites in winter had an increase rate of less than 3 mm/10a due to the small amount of precipitation. However, more than 70% of the sites showed an increase in both spring and winter, which may be explained by the fact that the warming of the TP in recent decades has led to higher temperatures in spring and winter, and enhanced atmospheric circulation has contributed to higher precipitation. Thirteen sites exhibited statistically significant increases during the summer, mainly in the northeastern part of the plateau, while most sites in the eastern part of the TP showed minor increasing or decreasing trends. In contrast, autumn precipitation failed the trend significance test at more than 90% of the sites throughout the research period with the most consistent variability. At the spatial scale, seasonal precipitation in most parts of the TP showed an increasing trend, and the decreasing trend occurred mainly in the lower elevation areas in the east, which was consistent with the trend in the annual mean precipitation series.

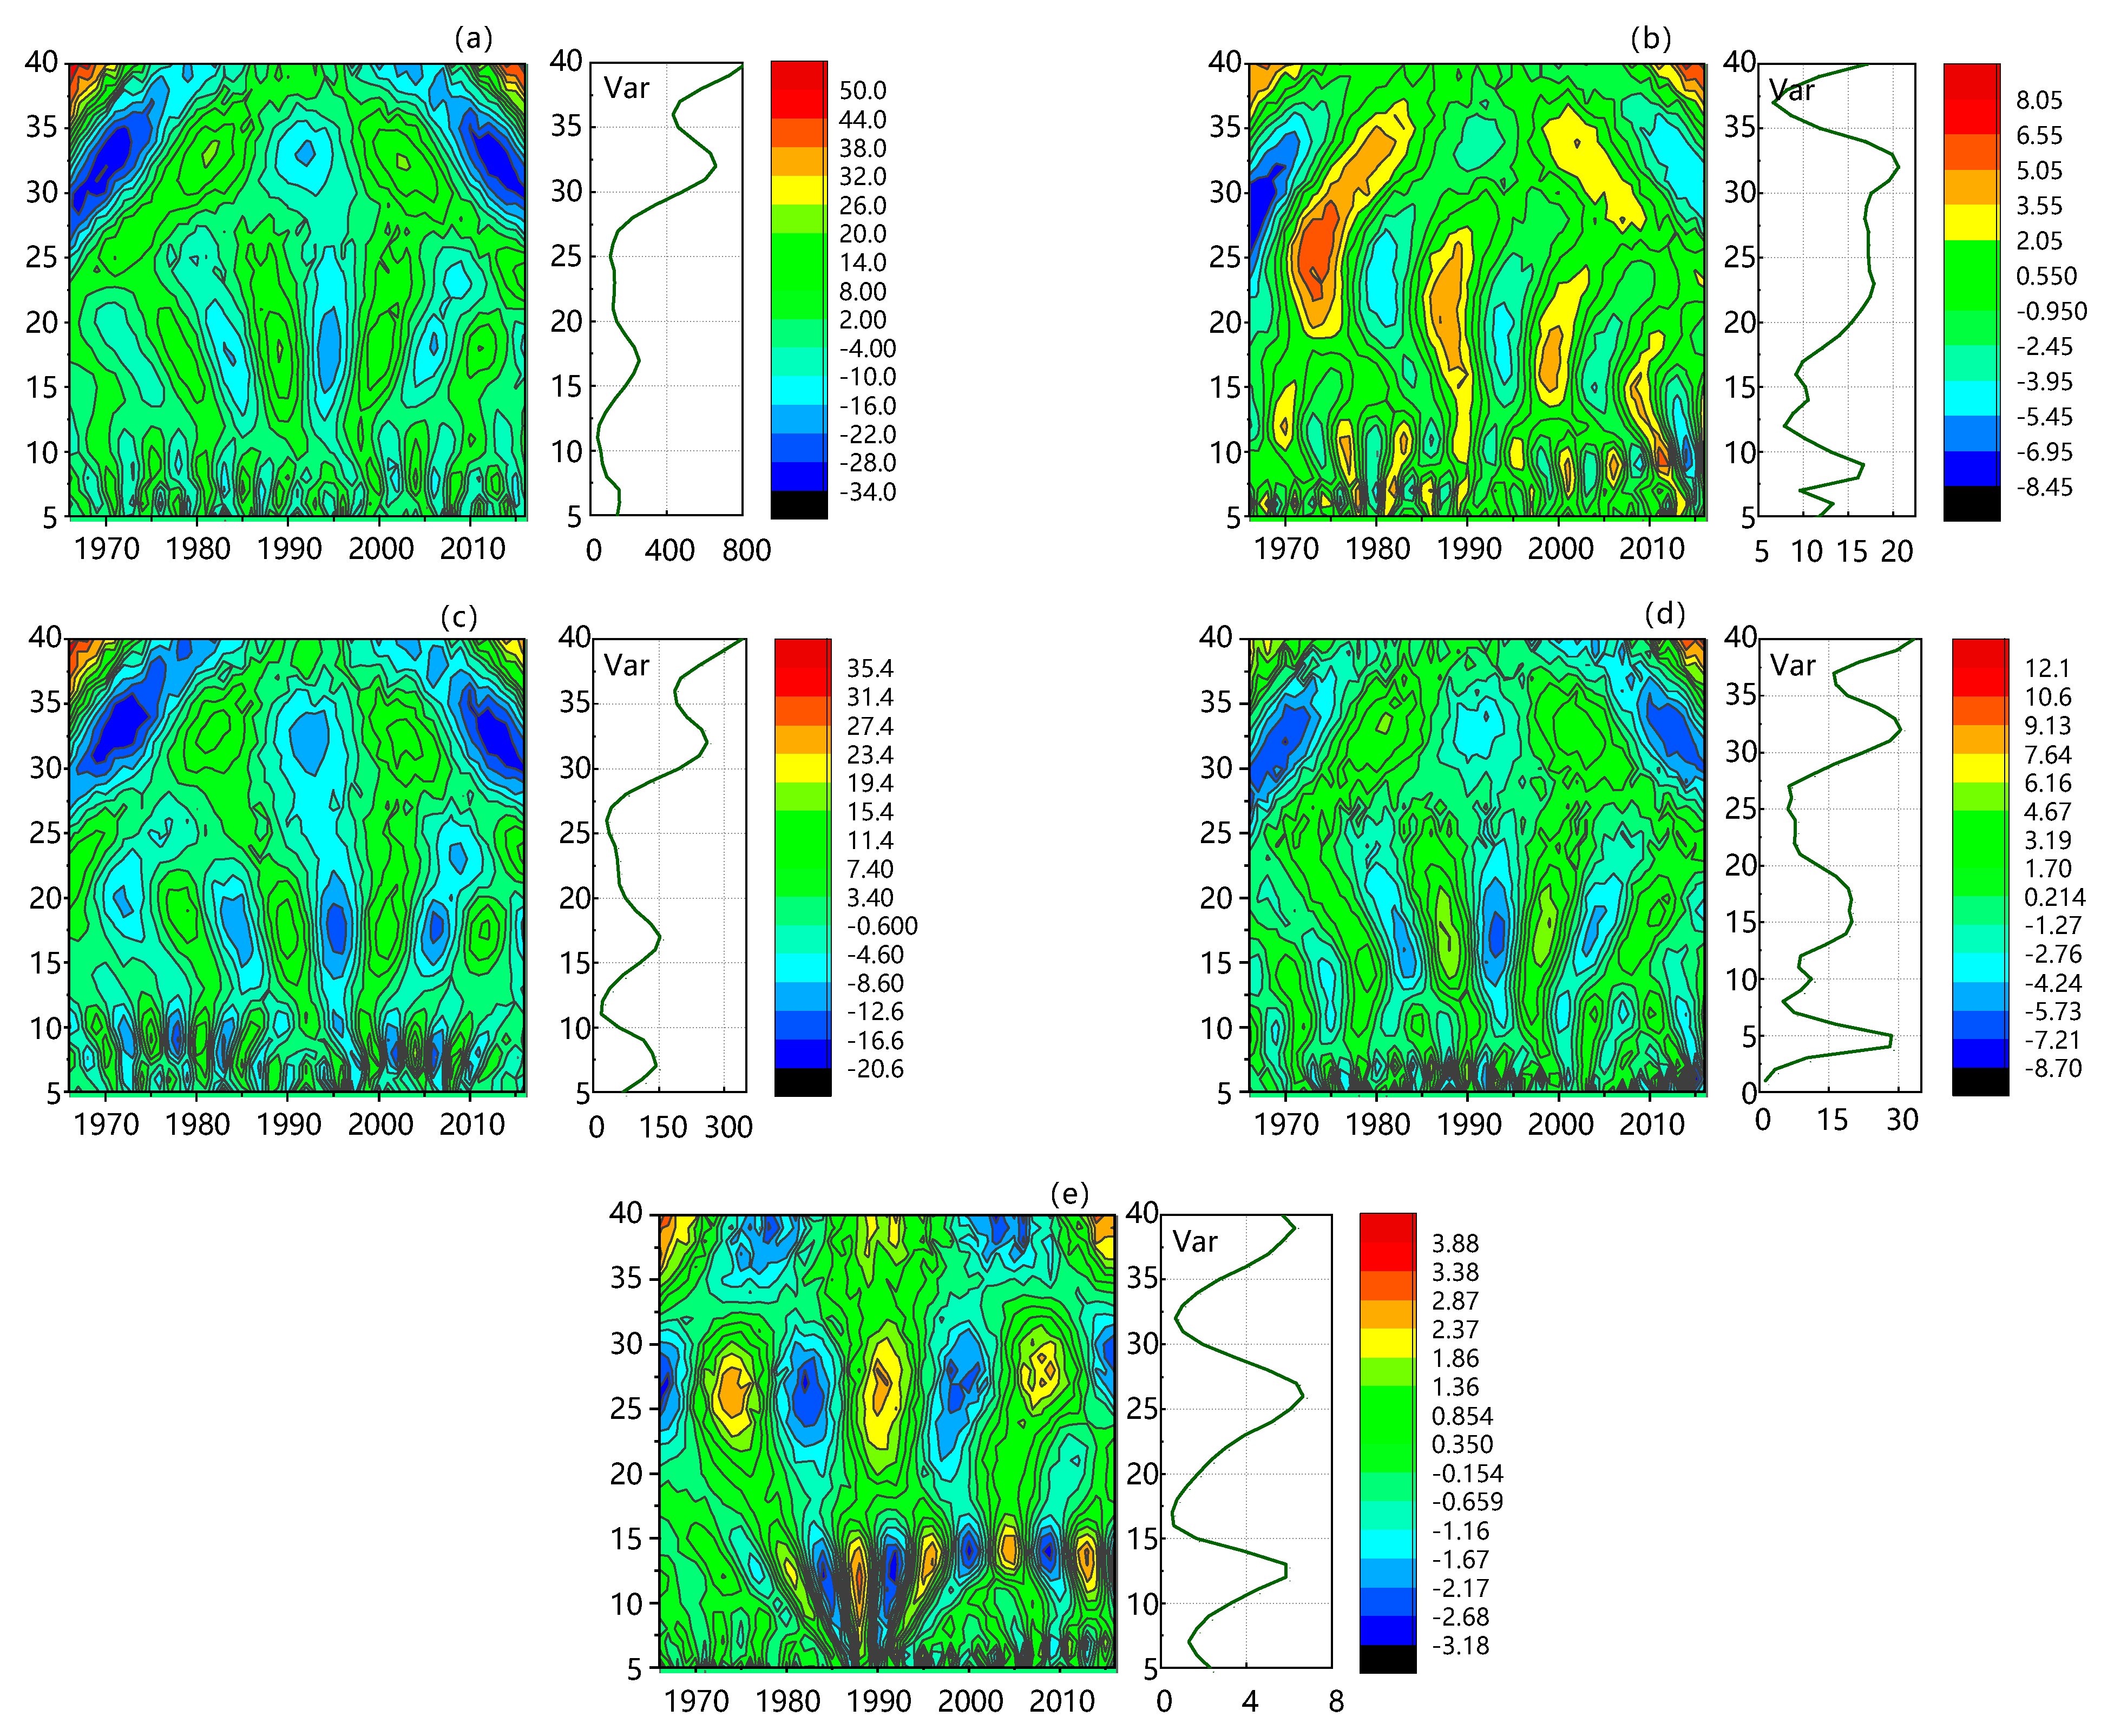
4.1.2. Precipitation Abrupt Changes and Cycles Analysis

A frequent and significant phenomenon in the climate system, abrupt climate change is the fast transition of climate elements from one stable state to another [51]. It is crucial for the detection of changes in the climate system and the analysis of the attribution of climate factors. The M–K approach and the moving t-test model were utilized in this study to assess and examine the abrupt changes in precipitation. Table 1 shows the test results of the two methods for abrupt changes in precipitation. It can be found that the mean annual precipitation of the TP at a significance level of 5% has undergone multiple mutation points during the research period, with the majority of these changes occurring in the years 1980 to 1995. The seasonal trends in mutation demonstrated that the spring mutation test was passed by both methods in 1996, the summer mutation point was reached in 1998, and there was no statistically significant mutation found in the autumn. The M–K method and the t-test both determined that the mutation point for the winter precipitation data was in 1970 and 1971, respectively. It is clear that the abrupt shift in the annual mean precipitation trend is the combined effect of precipitation in each season and is significantly influenced by the inconsistent variations in spring and summer precipitation.
Wavelet coefficient identification and variance analysis at various timescales can be used to characterize the oscillatory cycle of precipitation, which is intricate and accompanied by a number of timescale properties. We plotted the annual and seasonal precipitation wavelet coefficient’s real part contours and the wavelet variance diagram for the TP region in 1966–2016, with higher values denoting more precipitation and vice versa. The time corresponding to the great value of wavelet variance is the main period of the precipitation series at different timescales. It was noticeable that the plateau has seen three distinct oscillating cycles (i.e., 7, 16, 32 years) of yearly precipitation over the past 51 years (Figure 5a). Combining the variations in the number of oscillations in various cycles (Table 2), it was revealed that the fluctuation cycle was very significant in 16 and 32 years. Since precipitation exhibited the phenomenon of alternating abundance and depletion and the wavelet coefficient was situated in the study period’s final trough, it is possible to anticipate that future precipitation will demonstrate an increasing trend.
Figure 5b–e shows that the plateau’s seasonal precipitation cycle followed a similar pattern. Spring precipitation had 8-, 21-, and 32-year oscillatory cycles, and the 21-year cycle was not significant, while the 32-year cycle revealed three more substantial oscillatory variations. Figure 5b indicates that spring precipitation is likely to increase in the coming period. We observed that the significant oscillation periods (16 and 32 years) and trends were essentially the same as those of annual precipitation by evaluating the change of wavelet variance and wavelet coefficients in the real part of summer and autumn precipitation, which also illustrated their dominant role on annual precipitation. There were two different cycles of winter precipitation, 12 and 27 years, as shown in Figure 5e. It underwent three oscillatory variations on a 27-year cycle scale and achieved a minimal value in 2016 (Table 2), indicating a potential increase in winter precipitation in the upcoming half cycle.

4.2. The Spatiotemporal Variation Pattern of Epan

4.2.1. Temporal Trend Characteristics of Epan

Figure 6 depicts the annual and seasonal mean Epan temporal fluctuation and linear trend in the TP region in 1966–2016. It was visible that the plateau’s multiyear average Epan over the research period was 1974.9 ± 143.4 mm. The 5-year moving average curve demonstrated that after a brief increase in the 1960s and 1970s, the Epan series began to fluctuate and decline year to year, reaching the minimum value at the end of the 20th century (1831.5 mm in 1997), though there were also instances of unusual increases in evaporation during this period, such as 2103.9 mm in 1984. Epan began to slowly increase after the beginning of the 21st century, although it was still essentially below the evaporation average. The M–K trend test found that the overall annual Epan showed a significant decreasing trend at the 95% confidence level, with a Sen’s slope of −20.8 mm/10a.
Epan in the TP region also reported significant seasonal variations. Overall, the mean Epan in summer was the largest of the annual total with 37%, followed by spring (30%), autumn (21%), and winter (12%). Consistent with the annual variation, the spring and summer mean Epan demonstrated a significant declining trend at the 95% confidence level with rates of −10.35 mm/10a and −7.6 mm/10a, respectively, while the variation trend of the mean Epan in autumn (β = −3.06 mm/10a) was not statistically significant (α = 95%). In contrast, the mean Epan in winter displayed a stable or slightly increasing trend, which might be a result of strong contribution to evaporation rates due to the general increase in winter temperatures caused by the warming of the TP region.
We performed trend testing and mutation analysis using the M–K test and moving t-test on the annual Epan series of 87 sites in the TP area (Figure 7). Compared with the regional mean annual precipitation, only 47.1% of the stations showed an increasing trend in annual Epan during the study period, half of which possessed significance characteristics (a = 5%), mainly in southern Qinghai and at the southern border of Tibet areas. Epan for 16 sites in the southeastern and northern regions, on the other hand, displayed a significant declining trend. Additionally, a weak declining trend in Epan was detected at the majority of sites in the Yarlung Tsangpo River basin in southern Tibet. According to Epan’s seasonal trend, more than 59% of the stations showed a declining trend in both spring and summer, and the regional distribution was consistent with the annual change. The percentage of sites with a decreasing trend in autumn and winter was relatively small (42% and 35%, respectively), while the majority of them had a strong increasing trend and were concentrated in eastern Tibet and southeastern Qinghai. With over 20% of the stations displaying seasonal decreasing and increasing trends in each of the four seasons’ Epan, the overall percentage of positive and negative trend shifts of Epan in the TP region was around the same.
The results of the mutation test showed that 77% of the stations experienced at least one mutation in the annual Epan series over the course of the study period, with Langkazi, Qingshuihe, and Markang stations experiencing the most changes (all four times) (Figure 8). The majority of the Epan mutations in the TP region, according to a statistical analysis of the abrupt changes era, occurred in the 1970s and at the beginning of the 21st century, particularly around 1974 and 2005, when 20 and 13 mutations, respectively, occurred. In addition, the mutation sites also showed various regional characteristics. Figure 8 shows that the initial mutation began earlier in the eastern portion of the TP, followed by the northern portion, and later in the central region, with the latest mutation occurring near 2010.

4.2.2. Spatial Evaluation of Epan

We investigated the relationship between Epan and latitude, longitude, and altitude in order to evaluate the spatial heterogeneity of Epan in the TP region (Figure 9). It can be acknowledged that the annual average value of Epan at each station on the TP ranged from 1120.1 to 3087.1 mm, which generally demonstrated the features of substantial evaporation in the north and south of the TP and small evaporation in the central and eastern parts. According to the significance test of the correlation coefficient, we found that the relationship between Epan and longitude was statistically negative (R = −0.57) at a level of confidence of 99% (Figure 9a), indicating that Epan fell by 44 mm on average for each degree of longitude increase in the TP area. For sites at high latitudes over 33° N, there was a strong linear relationship between Epan and latitude (p < 0.01), and Epan typically increased by 173.36 mm every degree of latitude. When the latitude was below 33°, this correlation was much weaker. It is worth noting that the distribution of Epan was more discrete at various elevations, and there was no significant correlation between them.
The relationship between seasonal Epan and longitude actually showed that while the winter Epan presented an extraordinary increase in the center and gradually fell toward the east and west, the spring, summer, and autumn Epan was consistent with the trend of the annual Epan. Regarding the variation of Epan with latitude, spring, summer, and autumn saw a progressive increase in Epan from the center to the north and south, while winter displayed a monotonic decline from the south to the north. This may be connected to winter temperatures since evaporation is promoted by the relatively high temperatures in the low-latitude region.

4.3. Precipitation–Evaporation Relationship and Regional Drought

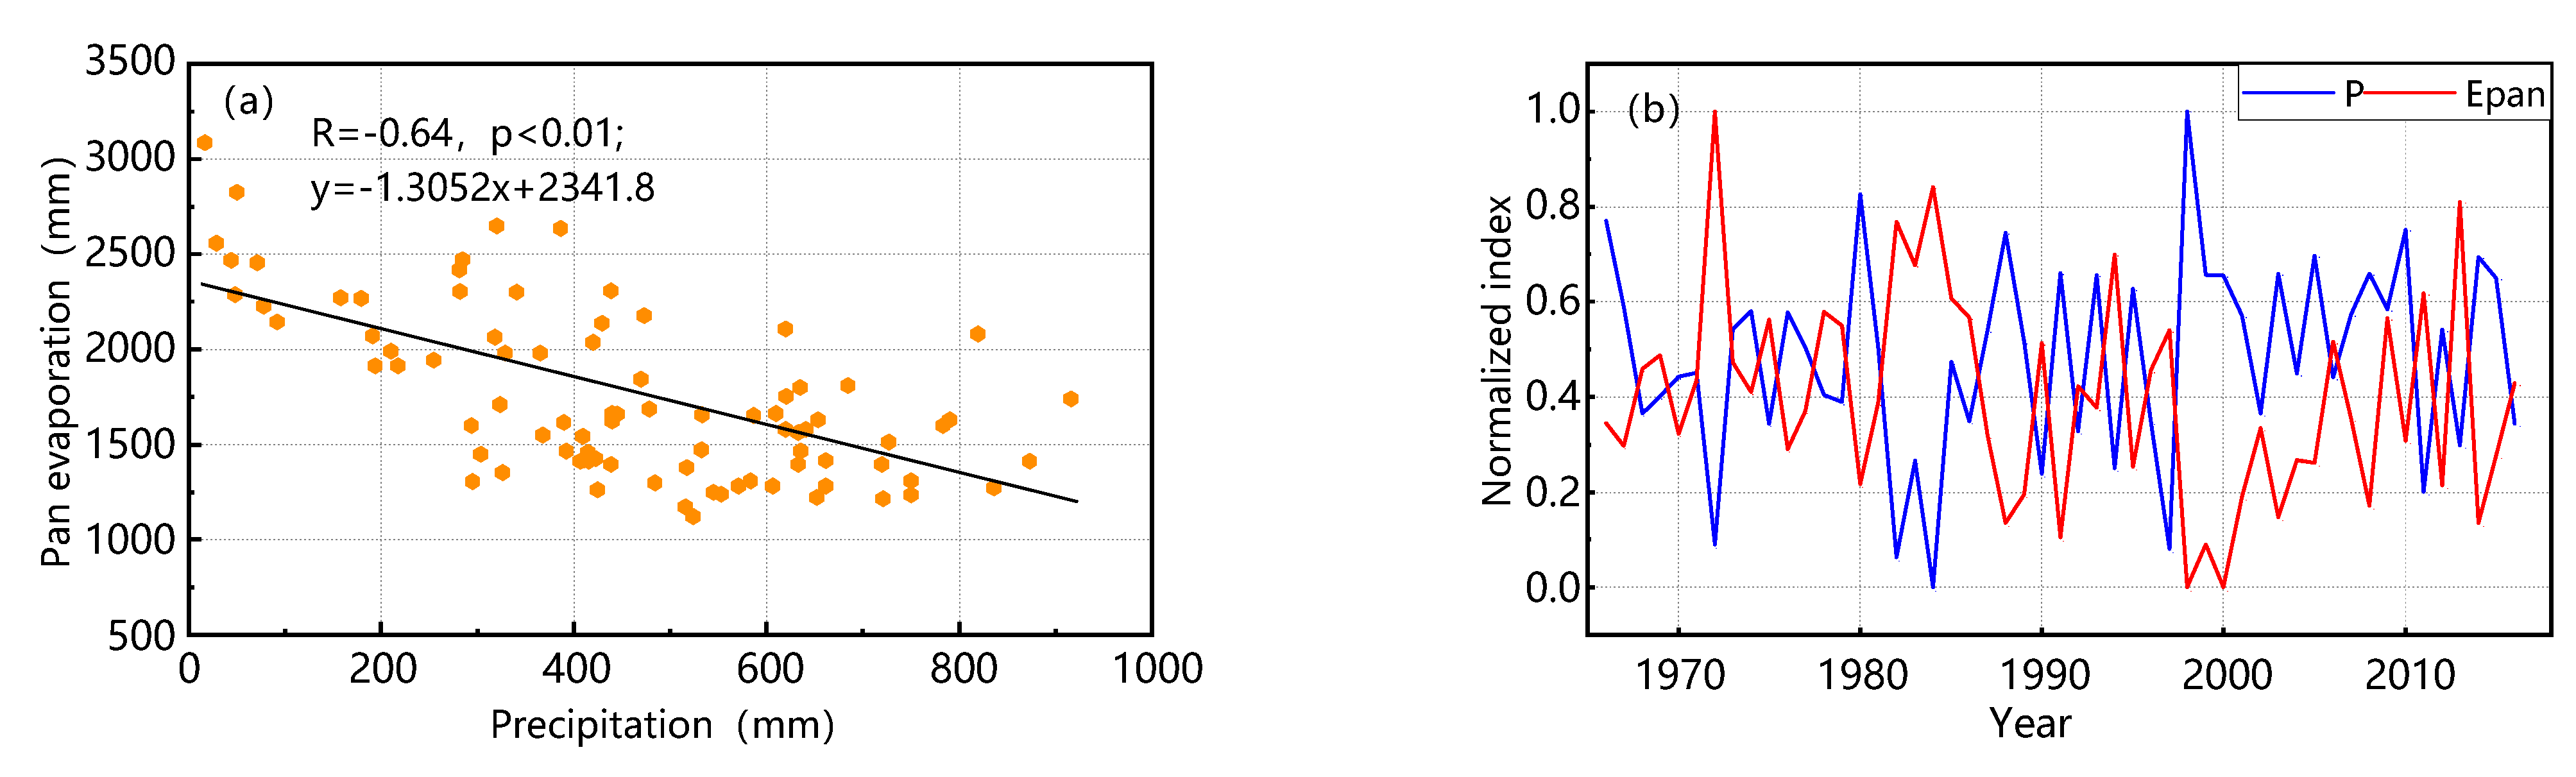
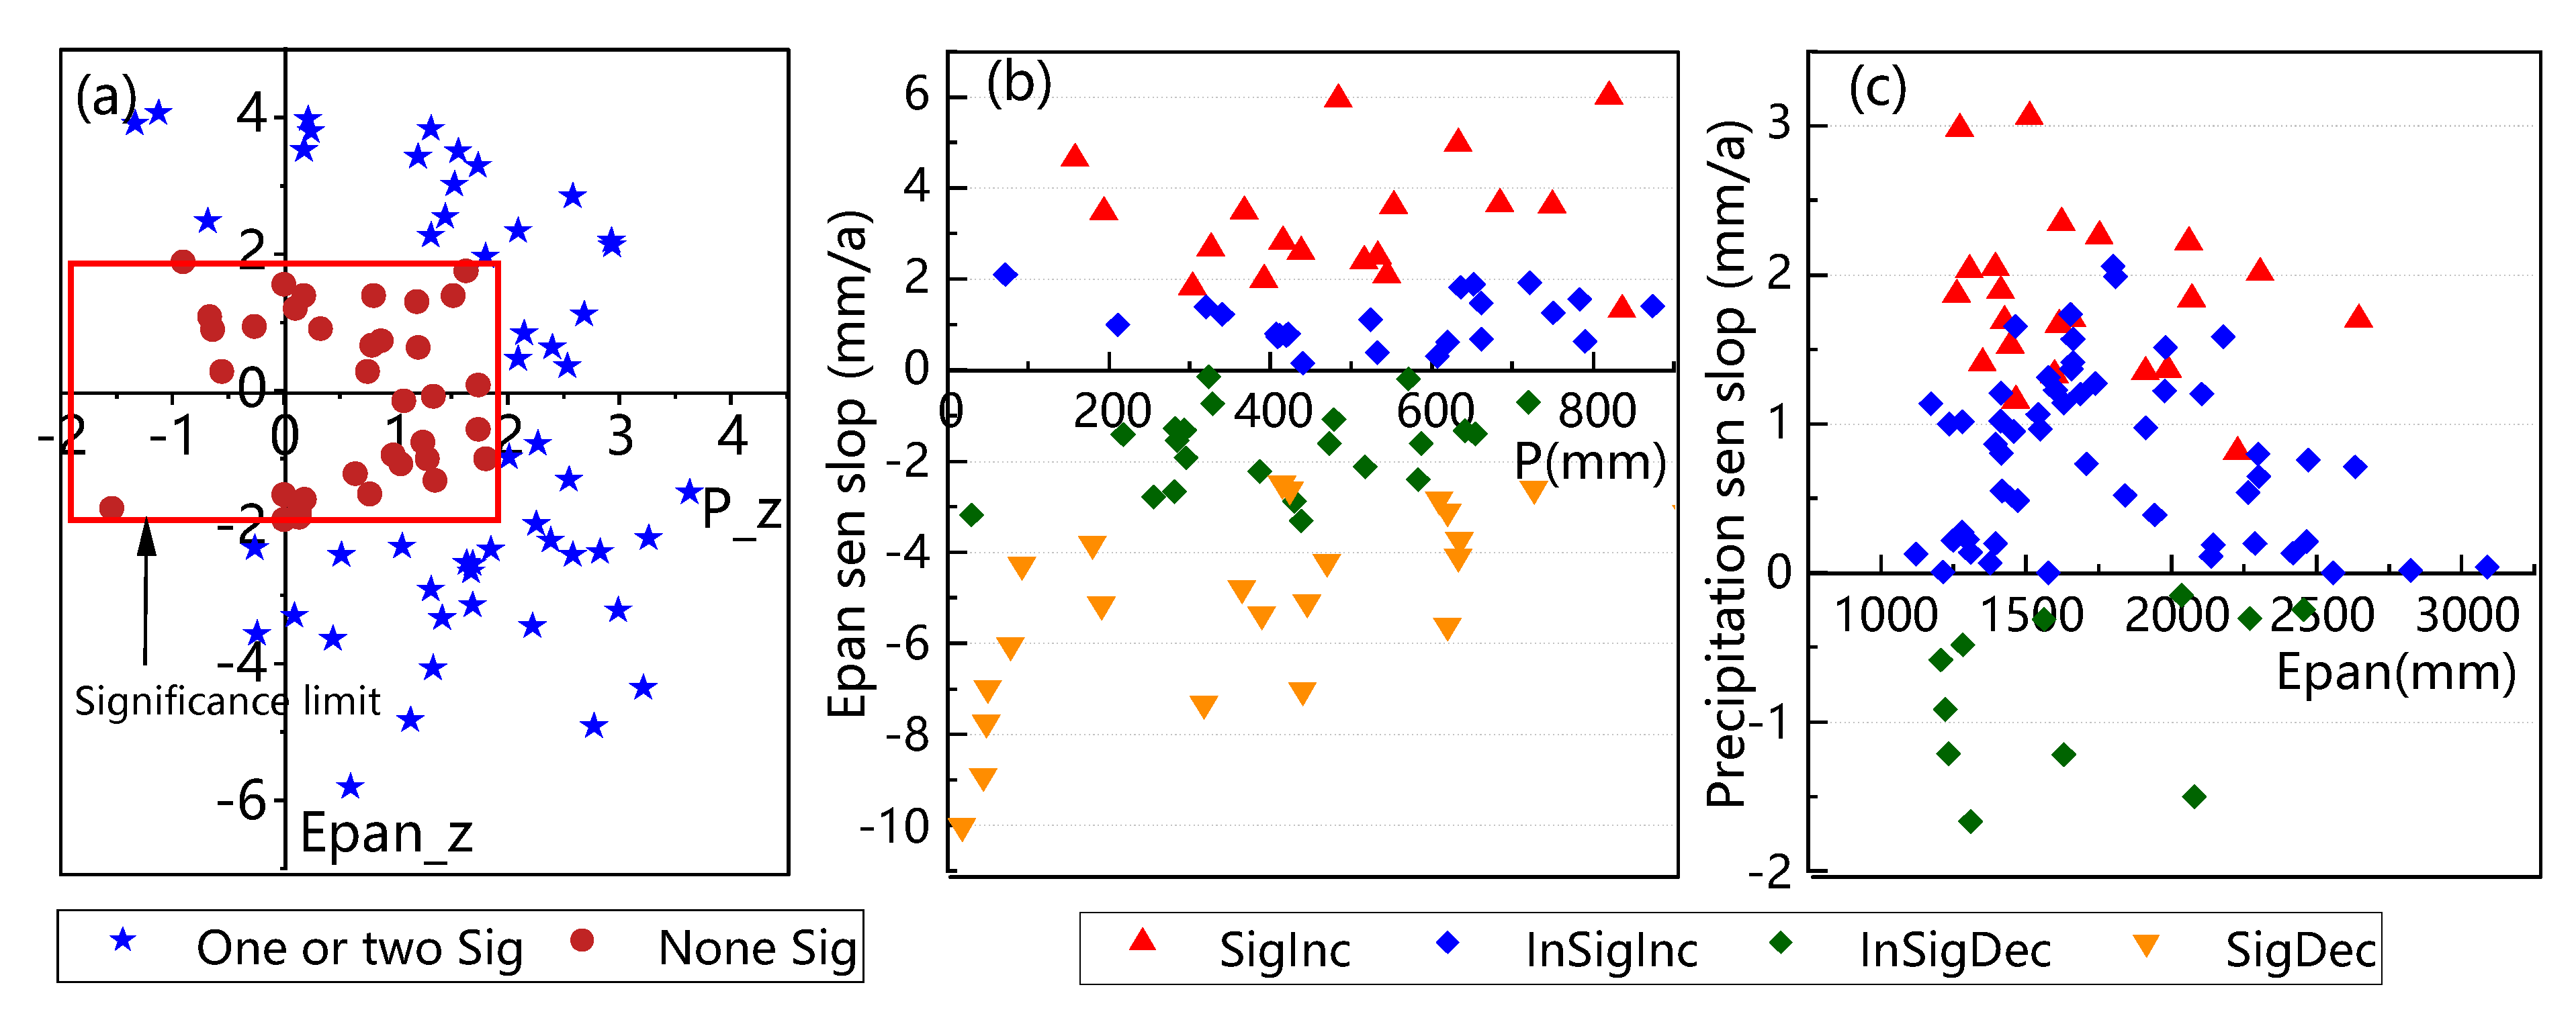
4.3.1. Relationship between Precipitation and Evaporation on the TP

Precipitation and subsurface evaporation as major producers and consumers of the surface water cycle have a substantial influence on the regional water cycle in terms of magnitude trends and degree of interconversion. The link between the monthly mean precipitation and Epan in the TP area over the course of the study is summarized in Table 3 and Figure 10. The multiyear average precipitation and Epan at each site generally correlated negatively (Figure 10a), with each 10 mm increase in precipitation causing an average drop in Epan of 13.1 mm. The magnitude of this relationship varied significantly by month, with August having the highest negative correlation (R = −0.83). The long-term trend from June to September had a strong nonconsistency, while this phenomenon weakened in spring and winter and the correlation dropped to a minimum in February.
To investigate the lead-lag correlations between precipitation and evaporation series, a correlation analysis was carried out between precipitation (Epan) for two consecutive months and Epan (precipitation) for that month on the TP (Table 3). The Re values for all months increased when Epan was advanced to one month, indicating that evaporation as one of the sources of precipitation can be transformed in a relatively short period of time and that changes in precipitation were less affected by evaporation in the previous period. Continuous calculation of precipitation caused the Rp value to decrease in some months in spring and winter, with the largest decrease of 0.11 occurring in April. It was interesting to note that the R value showed an increase in both models from July to November. These results suggest that the interconversion of evaporation and precipitation is quicker in the warm and wet seasons with increased insolation hours and air flow, but precipitation is enriched at the surface for a longer period of time and plays a more decisive role in evaporation during the cold season.
To further compare the trend relationship between precipitation and Epan, Figure 11 depicts the trend changes of the annual mean values of both at various stations as well as the interannual variation of Epan (precipitation) under various precipitation (Epan) conditions. Although precipitation increased at the majority of the stations, the trend of increasing Epan on the TP was not significant. Only four stations showed a significant increasing trend at the same period, while more than half of them had opposite trends (Figure 11a). Epan typically expressed a substantial falling trend (with the lowest values as low as −100 mm/10a) in the regions with low precipitation (less than 100 mm). The decreasing trend of Epan at the 400–800 mm precipitation condition gradually became insignificant, and nearly half of the stations showed an increasing trend, which indicated that the change of Epan in the TP’s semi-humid areas revealed a polarized situation. In contrast, the trend of precipitation becomes progressively more homogeneous (increasing but not significant) with the increase in Epan.

4.3.2. Patterns of Regional Drought

Regional drought is frequently the result of the hydrological response to variations in precipitation and evaporation, which can be identified by multiple types of drought indicators. In this paper, the SPEI index was used as a criterion to assess the characteristics of drought in TP regions. Figure 12 shows the change in the area-weighted mean SPEI over the course of the study at various timescales (1-, 3-, 6-, and 12-month). According to the SPEI values on the 1-month scale, the TP experienced 213 months of mild drought, 47 months of moderate drought, and 8 months of severe drought, with frequencies of 34.8%, 7.68%, and 1.31%, respectively (Table 4). This means that the study area is in drought for nearly half of the year on average. Comparing the SPEI series at the 3-month timescale, it was found that the seasonal drought frequency decreased to 34.8%, including 24.02% for mild drought, 8.33% for moderate drought, and 2.45% for severe drought. The primary factor may be the enhanced regional water regulation capacity at the seasonal scale and corresponding homogenization of SPEI values. Figure 12’s SPEI variation curves on the 6- and 12-month timescales reveal four concentrated drought periods on the TP in 1966–1974, 1993–1996, 1983–1985, and 2006–2007, which is consistent with the years in the study area that experienced negative precipitation anomalies (Figure 2). Overall, the TP region experienced less intense drought as time went on, but the alternating pattern of dryness and wetness in different SPEIs was comparable, and the SPEI values all increased at a slow rate. For instance, the correlation coefficient of SPEI-12 with years passed the significance test at the confidence level of 95% and increased at a rate of 0.08/10a, indicating an increase in humidity in the TP area.
M–K trend tests were run on the SPEI values at various timescales at each station in the study area for this paper. The results demonstrated that SPEI-1 had an increasing trend mostly in the central and southeastern regions of the TP, and the majority of the stations that passed the test for trend significance were located in southeastern TP (western Sichuan) (Figure 13a). By contrast, a huge percentage of stations in the lower-elevation and at the northeastern Qaidam Basin edge displayed a mixed pattern of increasing and falling trends and were essentially insignificant. SPEI-3 displayed a declining trend over a broader area near the plateau’s southern edge, similarly to SPEI-1 (but not significant at the 95% confidence level, except for some stations). We noticed that several stations unexpectedly turned from a decreasing trend to an increasing trend when the timescale was 6 months, and these stations were mostly in the northeastern and eastern regions (Figure 13c). For SPEI-12, it can be observed that the decreasing trend of the SPEI continued for sites in the eastern part of the plateau, on the one hand, and the increasing trend of the SPEI values gradually became significant for sites in the southern part of it, on the other. This proves that the polarization between drought and humidity on the TP is serious, particularly in the major populated areas in southern Tibet and eastern Qinghai; the situation with and risk of droughts and floods occurring simultaneously are getting worse.

5. Discussion

5.1. Incoherence in the Trends of Precipitation and Epan

As can be observed from the study above, there was a distinct spatial and temporal distribution pattern for both precipitation and Epan on the TP. Similarly to the results of earlier studies [16,52,53], precipitation in the TP region typically showed an increasing trend at a rate of 8.2 mm/10a in 1966–2016. The general consensus is that rising global surface temperatures speed up the hydrological cycle and significantly contribute to increasing precipitation [54,55]. We examined the temperature changes at various meteorological stations on the TP (Figure 14a) and discovered that the regional average temperature increased by roughly 2.1 °C during the course of 51 years, which further validated the previous viewpoint. On the other hand, the high reliance of Epan on temperature should have indicated a theoretical increasing trend [56]. However, contrary to our findings, this phenomenon, also known as the “evaporation paradox”, existed especially in the 1960s–1990s and gradually disappeared after the beginning of the 21st century (Figure 6a). Similar conclusions have been reached in related studies [34,57], but there was some discrepancy regarding the precise timing of disappearance. For instance, Yao et al. [32] noted that the “evaporation paradox” on the TP vanished around 1993. Zhao et al. [58] came to the conclusion that Epan of the Zoige Alpine Wetland at the eastern edge of the TP changed from a decreasing trend to an increasing trend in 1990, while the evaporation inflection point in the Nam Co basin occurred in 1995 [59]. Based on the regional topography and diverse climatic circumstances, our analysis indicated that choice of the study area and inconsistent Epan time series acquisition were the main causes of this disparity. The “evaporation paradox” phenomenon, however, was unquestionably common on the TP. Hence, it has been proposed that the substantial temporal anisotropy of wind speed and vapor pressure deficit were the primary causes of this phenomenon [60,61]. Additionally, we discovered that the average temperature over the TP tended to rise steadily throughout the research period, which suggested that the increase in temperature may not have reached the threshold to induce significant increase in Epan or that other sensitive factors have had a strong negative feedback effect, offsetting the contribution of temperature increase to Epan. From the precipitation perspective, in the second half of the 20th century, precipitation and Epan showed an overall negative correlation, and as the 21st century began, Epan displayed a fluctuating increasing tendency consistent with its ongoing increase in precipitation. As a result, we believe that Epan may be suppressed to some extent by increasing precipitation; however, this suppressive effect may be lessened when specific wetting conditions are met in the regional environment.
In terms of spatial differences, precipitation was concentrated at lower elevations in the eastern and southern portions of the TP, where rivers were extensively developed, and decreased from southeast to northwest, whereas Epan had larger values in the southwest and northeast TP, decreasing from the northern and southern ends toward the mid-latitudes of the plateau. The varying levels of solar radiation and air water vapor content were the key contributors to this phenomenon [23]. The main way that solar radiation affected the insolation conditions at the surface was cloud cover [34]. The dense cloud cover in the TP mid-latitudes reduced the amount of net radiation received by the surface, and the lack of sufficient energy-driven conditions for water evaporation caused Epan to tend to be small [33]. On the other hand, the crucial indication for preserving the air–water balance, the water vapor content, significantly positively regulated precipitation [37]. Up to 90% of the annual precipitation was produced during the rainy season [62] due to the high water vapor content of the Indian Ocean summer winds and southeastern monsoon in the southern part of the plateau [63]. Precipitation and evaporation may be in opposition to one another due to the oversaturation of water vapor concentration, which may impact the water balance in the atmosphere and partially inhibit evaporation. The changes in monthly-scale precipitation and evaporation mentioned above (Figure 10) also lent credence to this theory, further indicating a widespread interconversion between the regional precipitation and evaporation. However, complex topography, harsh environment, and low population density of the central and northern regions of the TP make meteorological observation more challenging, and the availability of only a few monitoring stations also limits the precision of the whole area of the TP. Therefore, in order to quantitatively assess the conversion mechanism of precipitation–evaporation under inconsistent conditions of trend changes and more fully understand the variation patterns of precipitation and Epan, future research should investigate multisource remote sensing satellite datasets, and calibration and correction should be performed using ground-based observations.

5.2. Evolution of Regional Water Resources

The nature and intensity of hydrological cycle processes in the TP region have changed significantly over 51 years in the context of climate change. With the exception of Southern Qinghai and northern Sichuan, more than 60% of the stations with precipitation below the Epan of 1000 mm or more could be found in other parts of the TP. According to the difference analysis, severe precipitation deficit was the root cause of the local drought [64]. To further explore the extent of the regional water abundance, we compared and analyzed the interannual trend variation of the drought index (Epan/P) (Figure 14b). The drought index (Epan/P) showed a fluctuating decreasing trend in the 1960s–1990s and remained largely stable after 1999, whereas the years of anomalous values (1972, 1984, 1994, and 2006) were consistent with the SPEI drought concentration period, indicating that the drought index and the SPEI had strong objectivity in identifying drought [53].
The SPEI study in this paper demonstrated that the TP region was dominated by mild drought and mild wetness in 1966–2016, and that the proportion of the two varied at different timescales (Table 4). However, overall, the aridity status of the TP region is weakening, i.e., the wetness trend is gradually becoming significant and the water abundance is further enhanced. These results are consistent with earlier research. Feng et al. [14] suggested that there was a general trend toward wetting in the TP region and a positive correlation with altitude; Gao et al. [65] noted that the northwest of the TP experienced significant wetting, while the eastern semi-humid region gradually dried out. When seen from a seasonal viewpoint, the wetting trend on the TP was more notable in spring and summer than it was in autumn and winter [66]. In addition to the pervasive wetting trend, we also discovered that some places had consistent aridification 1966–2016. For instance, the SPEI in eastern Qinghai province and the southern part of the Plateau displayed a declining trend over a range of timescales, which was demonstrated by He et al. [32,67]. This is a result of the regional water shortage brought on by the decline in precipitation, particularly in summer when the drought trend is aggravated by the large negative association between precipitation and evaporation. As can be seen, the drought on the TP may be a combined regional hydrological response of insufficient precipitation and abnormally reduced evaporation [68]. Current research indicates that changes in sunshine hours, wind speed, and humidity are not negligible in influencing the spatial and temporal patterns of drought [66,69] and that high temperature anomalies are also a significant determinant of the occurrence of “heat wave droughts” [70,71]. However, we think that meteorological elements like the amount of sunshine and wind speed may have an impact on evaporation rather than create a direct demand for drought. On the other hand, despite the background of widespread temperature increases, the average temperature in the TP region has remained low for a long time, making it challenging to meet the criteria for a “heat wave”. Additionally, glacial snowmelt in some regions of the TP is developing into a significant recharge item for the regionally accessible water resources [17,72], suggesting that the diversification of water resources plays a significant role in dealing with drought. However, little is known about how much glacial melting in a changing environment tempers local dryness [73], which requires more investigation.

6. Conclusions

In this study, the spatiotemporal variation patterns of precipitation and Epan on the TP in 1966–2016 were analyzed based on the precipitation and evaporation data from 87 meteorological stations, and the influence of precipitation and Epan inconsistency on the regional drought was explored by calculating the SPEI on 1-, 3-, 6-, and 12-month timescales. The main findings are as follows:
(1) Precipitation on the TP as a whole was characterized by higher precipitation in the southeast than in the northwest, and the average annual precipitation increased progressively at a rate of approximately 8.2 mm/10a, with 80% of the annual precipitation falling in the summer and autumn. The precipitation time series also had a 32-year primary cycle and multiple abrupt change points.
(2) There was significant nonconsistency between Epan and the precipitation variation on the TP, especially under the warm and humid conditions from June to September, and the correlation coefficient could be as low as −0.83. The larger values of Epan were mainly concentrated in the southwest and northeast of the TP, and Epan showed an overall decreasing trend, with a rate of approximately −20.8 mm/10a.
(3) Although the temperature rose by around 2.1 °C on average during the study period, the “evaporation paradox” persisted on the TP for almost 40 years, from the 1960s to the 1990s, and generally disappeared after the beginning of the 21st century.
(4) The distribution of water resources on the TP showed significant differences, with a continuous wet trend in the central and southeastern portion of the TP and a predominately arid trend in southern Qinghai. Both arid and humid conditions characterized the major populated areas in eastern Qinghai and southern Tibet.
According to the analysis of precipitation and Epan trends over the past 50 years, the TP drought may continue on its current trajectory, the dry and wet conditions will coexist, and the polarization of water resources will become more significant. As a result, it is urgently necessary to have a thorough understanding of the regional drought patterns and water dynamics for water resources management.

Author Contributions

Conceptualization, Y.T. and J.H.; Data curation, T.G. and X.J.; Formal analysis, D.Z.; Funding acquisition, J.H. and D.Z.; Resources, J.H.; Visualization, X.J.; Writing—original draft preparation, Y.T.; Writing—review and editing, Y.T. and T.G. All authors have read and agreed to the published version of the manuscript.

Funding

This research was supported by grants from the National Key Research and Development Project (No. 2021YFC3000202).

Institutional Review Board Statement

The new information created during the data analysis stage is described in this paper, and all of the data utilized are public knowledge.

Informed Consent Statement

Not applicable.

Data Availability Statement

The journal’s editors, reviewers, and readers will have access to the data.

Conflicts of Interest

The authors declare no conflict of interest.

References

  1. Sun, C.; Zheng, Z.; Chen, W.; Wang, Y. Spatial and Temporal Variations of Potential Evapotranspiration in the Loess Plateau of China During 1960–2017. Sustainability 2020, 12, 354. [Google Scholar] [CrossRef]
  2. Zhang, Q.; Xu, C.; Chen, X. Reference evapotranspiration changes in China: Natural processes or human influences? Theor. Appl. Climatol. 2011, 103, 479–488. [Google Scholar] [CrossRef]
  3. Tang, L.; Duan, X.; Kong, F.; Zhang, F.; Zheng, Y.; Li, Z.; Mei, Y.; Zhao, Y.; Hu, S. Influences of climate change on area variation of Qinghai Lake on Qinghai-Tibetan Plateau since 1980s. Sci. Rep. 2018, 8, 7331. [Google Scholar] [CrossRef] [PubMed]
  4. Yang, K.; Wu, H.; Qin, J.; Lin, C.; Tang, W.; Chen, Y. Recent climate changes over the Tibetan Plateau and their impacts on energy and water cycle: A review. Glob. Planet. Chang. 2014, 112, 79–91. [Google Scholar] [CrossRef]
  5. Liu, R.; Ma, T.; Qiu, W.; Peng, Z.; Shi, C. The Environmental Functions and Ecological Effects of Organic Carbon in Silt. J. Earth Sci.-China 2020, 31, 834–844. [Google Scholar] [CrossRef]
  6. Qiu, G.; Li, H.; Zhang, Q.; Chen, W.; Liang, X.; Li, X. Effects of Evapotranspiration on Mitigation of Urban Temperature by Vegetation and Urban Agriculture. J. Integr. Agric. 2013, 12, 1307–1315. [Google Scholar] [CrossRef]
  7. Piao, S.; Ciais, P.; Huang, Y.; Shen, Z.; Peng, S.; Li, J.; Zhou, L.; Liu, H.; Ma, Y.; Ding, Y.; et al. The impacts of climate change on water resources and agriculture in China. Nature 2010, 467, 43–51. [Google Scholar] [CrossRef]
  8. Chen, J.; Yan, F.; Lu, Q. Spatiotemporal Variation of Vegetation on the Qinghai–Tibet Plateau and the Influence of Climatic Factors and Human Activities on Vegetation Trend (2000–2019). Remote Sens. 2020, 12, 3150. [Google Scholar] [CrossRef]
  9. Van Dijk, A.I.J.M.; Beck, H.E.; Crosbie, R.S.; De Jeu, R.A.M.; Liu, Y.Y.; Podger, G.M.; Timbal, B.; Viney, N.R. Millennium Drought in southeast Australia (2001–2009): Natural and human causes and implications for water resources, ecosystems, economy, and society. Water Resour. Res. 2013, 49, 1040–1057. [Google Scholar] [CrossRef]
  10. Arnell, N.W.; Lowe, J.A.; Challinor, A.J.; Osborn, T.J. Global and regional impacts of climate change at different levels of global temperature increase. Clim. Chang. 2019, 155, 377–391. [Google Scholar] [CrossRef]
  11. Liu, X.; Kutzbach, J.E.; Liu, Z.; An, Z.; Li, L. The Tibetan Plateau as amplifier of orbital-scale variability of the East Asian monsoon. Geophys. Res. Lett. 2003, 30, 1–4. [Google Scholar] [CrossRef]
  12. Liu, X.; Chen, B. Climatic warming in the Tibetan Plateau during recent decades. Int. J. Climatol. 2000, 20, 1729–1742. [Google Scholar] [CrossRef]
  13. Sun, S.; Zhang, Q.; Xu, Y.; Yuan, R. Integrated Assessments of Meteorological Hazards across the Qinghai-Tibet Plateau of China. Sustainability 2021, 13, 10402. [Google Scholar] [CrossRef]
  14. Yang, C.; Tuo, Y.; Ma, J.; Zhang, D. Spatial and Temporal Evolution Characteristics of Drought in Yunnan Province from 1969 to 2018 Based on SPI/SPEI. Water Air Soil Pollut. 2019, 230, 1–13. [Google Scholar] [CrossRef]
  15. Liu, B. Observed trends of precipitation amount, frequency, and intensity in China, 1960–2000. J. Geophys. Res. 2005, 110, 1–10. [Google Scholar] [CrossRef]
  16. Wu, Y.; Wu, S.; Wen, J.; Xu, M.; Tan, J. Changing characteristics of precipitation in China during 1960–2012. Int. J. Climatol. 2016, 36, 1387–1402. [Google Scholar] [CrossRef]
  17. Zhang, G.; Yao, T.; Xie, H.; Yang, K.; Zhu, L.; Shum, C.K.; Bolch, T.; Yi, S.; Allen, S.; Jiang, L.; et al. Response of Tibetan Plateau lakes to climate change: Trends, patterns, and mechanisms. Earth-Sci. Rev. 2020, 208, 103269. [Google Scholar] [CrossRef]
  18. Hu, Y.; Xu, J.; Huang, Y.; Zhou, Y.; Pang, Y.; Shi, Z.; Chen, X. Spatial and Temporal Variations in the Rainy Season Onset over the Qinghai–Tibet Plateau. Water 2019, 11, 1960. [Google Scholar] [CrossRef]
  19. Wu, Y.; Huang, A.; Huang, D.; Chen, F.; Yang, B.; Zhou, Y.; Fang, D.; Zhang, L.; Wen, L. Diurnal variations of summer precipitation over the regions east to Tibetan Plateau. Clim. Dyn. 2018, 51, 4287–4307. [Google Scholar] [CrossRef]
  20. Guo, B.; Zhang, J.; Meng, X.; Xu, T.; Song, Y. Long-term spatio-temporal precipitation variations in China with precipitation surface interpolated by ANUSPLIN. Sci. Rep. 2020, 10, 81. [Google Scholar] [CrossRef]
  21. Oki, T.; Kanae, S. Global Hydrological Cycles and World Water Resources. Science 2006, 313, 1068–1072. [Google Scholar] [CrossRef] [PubMed]
  22. Wang, T.; Zhang, J.; Sun, F.; Liu, W. Pan evaporation paradox and evaporative demand from the past to the future over China: A review. WIREs Water 2017, 4, e1207. [Google Scholar] [CrossRef]
  23. Niu, Z.; Wang, L.; Chen, X.; Yang, L.; Feng, L. Spatiotemporal distributions of pan evaporation and the influencing factors in China from 1961 to 2017. Environ. Sci. Pollut. Res. 2021, 28, 68379–68397. [Google Scholar] [CrossRef] [PubMed]
  24. Borin, M.; Milani, M.; Salvato, M.; Toscano, A. Evaluation of Phragmites australis (Cav.) Trin. evapotranspiration in Northern and Southern Italy. Ecol. Eng. 2011, 37, 721–728. [Google Scholar] [CrossRef]
  25. Hoffman, M.T.; Cramer, M.D.; Gillson, L.; Wallace, M. Pan evaporation and wind run decline in the Cape Floristic Region of South Africa (1974–2005): Implications for vegetation responses to climate change. Clim. Chang. 2011, 109, 437–452. [Google Scholar] [CrossRef]
  26. Shan, N.; Shi, Z.; Yang, X.; Zhang, X.; Guo, H.; Zhang, B.; Zhang, Z. Trends in potential evapotranspiration from 1960 to 2013 for a desertification-prone region of China. Int. J. Climatol. 2016, 36, 3434–3445. [Google Scholar] [CrossRef]
  27. Hobbins, M.; Wood, A.; Streubel, D.; Werner, K. What Drives the Variability of Evaporative Demand across the Conterminous United States? J. Hydrometeorol. 2012, 13, 1195–1214. [Google Scholar] [CrossRef]
  28. Roderick, M.L.; Hobbins, M.T.; Farquhar, G.D. Pan Evaporation Trends and the Terrestrial Water Balance. II. Energy Balance and Interpretation. Geogr. Compass 2009, 3, 761–780. [Google Scholar] [CrossRef]
  29. Zongxing, L.; Qi, F.; Wei, L.; Tingting, W.; Yan, G.; Yamin, W.; Aifang, C.; Jianguo, L.; Li, L. Spatial and temporal trend of potential evapotranspiration and related driving forces in Southwestern China, during 1961–2009. Quat. Int. 2014, 336, 127–144. [Google Scholar] [CrossRef]
  30. Zhu, G.; He, Y.; Pu, T.; Wang, X.; Jia, W.; Li, Z.; Xin, H. Spatial distribution and temporal trends in potential evapotranspiration over Hengduan Mountains region from 1960 to 2009. J. Geogr. Sci. 2012, 22, 71–85. [Google Scholar] [CrossRef]
  31. Liu, X.; Zheng, H.; Zhang, M.; Liu, C. Identification of dominant climate factor for pan evaporation trend in the Tibetan Plateau. J. Geogr. Sci. 2011, 21, 594–608. [Google Scholar] [CrossRef]
  32. Yao, T.; Lu, H.; Yu, Q.; Feng, W.; Xue, Y. Change and attribution of pan evaporation throughout the Qinghai-Tibet Plateau during 1979–2017 using China meteorological forcing dataset. Int. J. Climatol. 2022, 42, 1445–1459. [Google Scholar] [CrossRef]
  33. Yao, T.; Lu, H.; Feng, W.; Yu, Q. Evaporation abrupt changes in the Qinghai-Tibet Plateau during the last half-century. Sci. Rep. 2019, 9, 10181. [Google Scholar] [CrossRef] [PubMed]
  34. Zhang, C.; Liu, F.; Shen, Y. Attribution analysis of changing pan evaporation in the Qinghai-Tibetan Plateau, China. Int. J. Climatol. 2018, 38, e1032–e1043. [Google Scholar] [CrossRef]
  35. Zhang, Y.; Liu, C.; Tang, Y.; Yang, Y. Trends in pan evaporation and reference and actual evapotranspiration across the Tibetan Plateau. J. Geophys. Res. 2007, 112. [Google Scholar] [CrossRef]
  36. Zhao, J.; Xu, Z.; Singh, V.P.; Zuo, D.; Li, M. Sensitivity of Potential Evapotranspiration to Climate and Vegetation in a Water-Limited Basin at the Northern Edge of Tibetan Plateau. Water Resour. Manag. 2016, 30, 4667–4680. [Google Scholar] [CrossRef]
  37. Wang, Z.; Sun, M.; Yao, X.; Zhang, L.; Zhang, H. Spatiotemporal Variations of Water Vapor Content and Its Relationship with Meteorological Elements in the Third Pole. Water 2021, 13, 1856. [Google Scholar] [CrossRef]
  38. Zhu, Y.; Yang, S. Evaluation of CMIP6 for historical temperature and precipitation over the Tibetan Plateau and its comparison with CMIP5. Adv. Clim. Chang. Res. 2020, 11, 239–251. [Google Scholar] [CrossRef]
  39. Bai, L.; Wen, Y.; Shi, C.; Yang, Y.; Zhang, F.; Wu, J.; Gu, J.; Pan, Y.; Sun, S.; Meng, J. Which Precipitation Product Works Best in the Qinghai-Tibet Plateau, Multi-Source Blended Data, Global/Regional Reanalysis Data, or Satellite Retrieved Precipitation Data? Remote Sens. 2020, 12, 683. [Google Scholar] [CrossRef]
  40. Su, T.; Feng, T.; Feng, G. Evaporation variability under climate warming in five reanalyses and its association with pan evaporation over China. J. Geophys. Res. Atmos. 2015, 120, 8080–8098. [Google Scholar] [CrossRef]
  41. Hargreaves, G.H.; Samani, Z.A. Reference Crop Evapotranspiration from Temperature. Appl. Eng. Agric. 1985, 1, 96–99. [Google Scholar] [CrossRef]
  42. Vicente-Serrano, S.M.; Beguería, S.; López-Moreno, J.I. A Multiscalar Drought Index Sensitive to Global Warming: The Standardized Precipitation Evapotranspiration Index. J. Clim. 2010, 23, 1696–1718. [Google Scholar] [CrossRef]
  43. Zhang, Q.; Qi, T.; Singh, V.P.; Chen, Y.D.; Xiao, M. Regional Frequency Analysis of Droughts in China: A Multivariate Perspective. Water Resour Manag. 2015, 29, 1767–1787. [Google Scholar] [CrossRef]
  44. Feng, W.; Lu, H.; Yao, T.; Yu, Q. Drought characteristics and its elevation dependence in the Qinghai–Tibet plateau during the last half-century. Sci. Rep. 2020, 10, 14323. [Google Scholar] [CrossRef]
  45. Guojiang, D.; Guangsheng, L.; Lianrong, C. Application of SPEI Index in Drought Evolution in Fujian Province. IOP Conf. Ser. Earth Environ. Sci. 2020, 435, 12016. [Google Scholar]
  46. Mokhtar, A.; Jalali, M.; He, H.; Al-Ansari, N.; Elbeltagi, A.; Alsafadi, K.; Abdo, H.G.; Sammen, S.S.; Gyasi-Agyei, Y.; Rodrigo-Comino, J. Estimation of SPEI Meteorological Drought Using Machine Learning Algorithms. IEEE Access 2021, 9, 65503–65523. [Google Scholar] [CrossRef]
  47. Sein, Z.M.M.; Zhi, X.; Ogou, F.K.; Nooni, I.K.; Lim Kam Sian, K.T.C.; Gnitou, G.T. Spatio-Temporal Analysis of Drought Variability in Myanmar Based on the Standardized Precipitation Evapotranspiration Index (SPEI) and Its Impact on Crop Production. Agronomy 2021, 11, 1691. [Google Scholar] [CrossRef]
  48. Gocic, M.; Trajkovic, S. Analysis of changes in meteorological variables using Mann-Kendall and Sen’s slope estimator statistical tests in Serbia. Glob. Planet. Chang. 2013, 100, 172–182. [Google Scholar] [CrossRef]
  49. Zhang, H.; Song, J.; Wang, G.; Wu, X.; Li, J. Spatiotemporal characteristic and forecast of drought in northern Xinjiang, China. Ecol. Indic. 2021, 127, 107712. [Google Scholar] [CrossRef]
  50. Liu, L.; Zhao, X.; Meng, Q.; Zhao, H.; Lu, X.; Gao, J.; Chang, X. Annual Precipitation Fluctuation and Spatial Differentiation Characteristics of the Horqin Region. Sustainability 2017, 9, 111. [Google Scholar] [CrossRef]
  51. Zhang, X.; Lohmann, G.; Knorr, G.; Purcell, C. Abrupt glacial climate shifts controlled by ice sheet changes. Nature 2014, 512, 290–294. [Google Scholar] [CrossRef] [PubMed]
  52. Zhang, B.; Zhou, W. Spatial–Temporal Characteristics of Precipitation and Its Relationship with Land Use/Cover Change on the Qinghai-Tibet Plateau, China. Land 2021, 10, 269. [Google Scholar] [CrossRef]
  53. Wu, S.; Yin, Y.; Zheng, D.; Yang, Q. Climatic trends over the Tibetan Plateau during 1971–2000. J. Geogr. Sci. 2007, 17, 141–151. [Google Scholar] [CrossRef]
  54. Wentz, F.J.; Ricciardulli, L.; Hilburn, K.; Mears, C. How Much More Rain Will Global Warming Bring? Science 2007, 317, 233–235. [Google Scholar] [CrossRef]
  55. Berg, P.; Moseley, C.; Haerter, J.O. Strong increase in convective precipitation in response to higher temperatures. Nat. Geosci. 2013, 6, 181–185. [Google Scholar] [CrossRef]
  56. Zhao, Z.; Wang, H.; Wang, C.; Li, W.; Chen, H.; Deng, C. Changes in reference evapotranspiration over Northwest China from 1957 to 2018: Variation characteristics, cause analysis and relationships with atmospheric circulation. Agric. Water Manag. 2020, 231, 105958. [Google Scholar] [CrossRef]
  57. Brutsaert, W. Use of pan evaporation to estimate terrestrial evaporation trends: The case of the Tibetan Plateau. Water Resour. Res. 2013, 49, 3054–3058. [Google Scholar] [CrossRef]
  58. Zhao, N.; Gou, S.; Zhang, B.; Yu, Y.; Han, S. Changes in Pan Evaporation and Their Attribution to Climate Factors in the Zoige Alpine Wetland, the Eastern Edge of the Tibetan Plateau (1969–2014). Water 2017, 9, 971. [Google Scholar] [CrossRef]
  59. Yang, K.; Wang, J.; Lei, Y.; Chen, Y.; Zhu, L.; Ding, B.; Qin, J. Quantifying evaporation and its decadal change for Lake Nam Co, central Tibetan Plateau. J. Geophys. Res. Atmos. 2016, 121, 7578–7591. [Google Scholar]
  60. Farooq, U.; Liu, H.; Zhang, Q.; Ma, Y.; Wang, J.; Shen, L. Spatial variability of global lake evaporation regulated by vertical vapor pressure difference. Environ. Res. Lett. 2022, 17, 54006. [Google Scholar] [CrossRef]
  61. You, Q.; Kang, S.; Flügel, W.A.; Pepin, N.; Yan, Y.; Huang, J. Decreasing wind speed and weakening latitudinal surface pressure gradients in the Tibetan Plateau. Clim. Res. 2010, 42, 57–64. [Google Scholar] [CrossRef]
  62. Zhou, S.; Wu, P.; Wang, C.; Han, J. Spatial distribution of atmospheric water vapor and its relationship with precipitation in summer over the Tibetan Plateau. J. Geogr. Sci. 2012, 22, 795–809. [Google Scholar] [CrossRef]
  63. Shi, Y.; Song, L. Spatial Downscaling of Monthly TRMM Precipitation Based on EVI and Other Geospatial Variables over the Tibetan Plateau From 2001 to 2012. Mt. Res. Dev. 2015, 35, 180–194. [Google Scholar] [CrossRef]
  64. Moazzam, M.F.U.; Rahman, G.; Munawar, S.; Farid, N.; Lee, B.G. Spatiotemporal Rainfall Variability and Drought Assessment during Past Five Decades in South Korea Using SPI and SPEI. Atmosphere 2022, 13, 292. [Google Scholar] [CrossRef]
  65. Gao, Y.; Li, X.; Ruby Leung, L.; Chen, D.; Xu, J. Aridity changes in the Tibetan Plateau in a warming climate. Environ. Res. Lett. 2015, 10, 34013. [Google Scholar] [CrossRef]
  66. Wang, H.; Chen, Y.; Pan, Y.; Chen, Z.; Ren, Z. Assessment of candidate distributions for SPI/SPEI and sensitivity of drought to climatic variables in China. Int. J. Climatol. 2019, 39, 4392–4412. [Google Scholar] [CrossRef]
  67. He, B.; Lü, A.; Wu, J.; Zhao, L.; Liu, M. Drought hazard assessment and spatial characteristics analysis in China. J. Geogr. Sci. 2011, 21, 235–249. [Google Scholar] [CrossRef]
  68. Li, Z.; Chen, Y.; Yang, J.; Wang, Y. Potential evapotranspiration and its attribution over the past 50 years in the arid region of Northwest China. Hydrol. Process. 2014, 28, 1025–1031. [Google Scholar] [CrossRef]
  69. Li, S.; Yao, Z.; Liu, Z.; Wang, R.; Liu, M.; Adam, J.C. The spatio-temporal characteristics of drought across Tibet, China: Derived from meteorological and agricultural drought indexes. Theor. Appl. Climatol. 2019, 137, 2409–2424. [Google Scholar] [CrossRef]
  70. Zhang, Y.; You, Q.; Chen, C.; Li, X. Flash droughts in a typical humid and subtropical basin: A case study in the Gan River Basin, China. J. Hydrol. 2017, 551, 162–176. [Google Scholar] [CrossRef]
  71. Mo, K.C.; Lettenmaier, D.P. Heat wave flash droughts in decline. Geophys. Res. Lett. 2015, 42, 2823–2829. [Google Scholar] [CrossRef]
  72. Huo, J.; Qu, X.; Zhu, D.; Yuan, Z.; Tang, Y. Impacts of Climate Change on Blue and Green Water Resources in the Middle and Upper Yarlung Zangbo River, China. Atmosphere 2021, 12, 1280. [Google Scholar] [CrossRef]
  73. Pritchard, H.D. Asia’s shrinking glaciers protect large populations from drought stress. Nature 2019, 569, 649–654. [Google Scholar] [CrossRef] [PubMed]
Figure 1. Overview of the TP and the locations of meteorological stations.
Atmosphere 13 01323 g001
Figure 2. Variation of precipitation in the TP region on different timescales in 1966–2016. (a) Annual, (b) spring, (c) summer, (d) autumn, (e) winter.
Atmosphere 13 01323 g002
Figure 3. Spatial distribution of the multiyear average precipitation on the TP in 1966–2016. (a) Annual, (b) spring, (c) summer, (d) autumn, (e) winter.
Atmosphere 13 01323 g003
Figure 4. Spatial distribution of precipitation trends at different timescales on the TP in 1966–2016. (a) Annual, (b) spring, (c) summer, (d) autumn, (e) winter.
Atmosphere 13 01323 g004
Figure 5. Wavelet variance of the annual and seasonal precipitation series and a contour map of the real part of wavelet coefficients in the TP area in 1966–2016. (a) Annual, (b) spring, (c) summer, (d) autumn, (e) winter.
Atmosphere 13 01323 g005
Figure 6. Variation of Epan on the TP on different timescales in 1966–2016. (a) Annual, (b) spring, (c) summer, (d) autumn, (e) winter.
Atmosphere 13 01323 g006
Figure 7. Annual and seasonal spatial trends of Epan on the TP in 1966–2016. (a) Annual, (b) spring, (c) summer, (d) autumn, (e) winter.
Atmosphere 13 01323 g007
Figure 8. The relationship between the Epan mutation time and the longitude (a) and latitude (b) for each site on the TP.
Atmosphere 13 01323 g008
Figure 9. Correlation of the annual and seasonal mean Epan with longitude (a), latitude (b), and altitude (c) at each site on the TP.
Atmosphere 13 01323 g009
Figure 10. Comparison of Epan and precipitation at different timescales of the TP. (a) Correlation between the annual mean precipitation and Epan at each site, (b) interannual variation of normalized precipitation and Epan in August.
Atmosphere 13 01323 g010
Figure 11. Comparison of the trends of precipitation and Epan at different stations on the TP. (a) Trend’s z-value relationship, (b) relationship between precipitation and Epan’s Sen’s slope, (c) relationship between Epan and precipitation’s Sen’s slope.
Atmosphere 13 01323 g011
Figure 12. Temporal evolution of the SPEI at 1-, 3-, 6-, and 12-month timescales on the TP in 1966–2016.
Atmosphere 13 01323 g012
Figure 13. Spatial trend distribution of the SPEI at different timescales on the TP in 1966–2016. (a) SPEI-1, (b) SPEI-3, (c) SPEI-6, (d) SPEI-12.
Atmosphere 13 01323 g013
Figure 14. Interannual trends of the average temperature (a) and the drought index (b) on the TP.
Atmosphere 13 01323 g014
Table 1. Abrupt precipitation change year on the TP based on the M–K test and t-test methods.
MethodsAnnual PrecipitationSpring PrecipitationSummer PrecipitationAutumn PrecipitationWinter Precipitation
M–K1980/1988/199419961998No mutation1970
T1980/1988/199819961998No mutation1971
Table 2. Oscillatory variation of precipitation at different timescales on the TP in 1966–2016.
Date RangeFirst Primary CycleNumber of OscillationsSecond Primary CycleNumber of OscillationsThird Primary CycleNumber of OscillationsForecast for Future Precipitation
Annual323165711Increase
Spring32321489Increase
Summer323164711Increase
Autumn323174515Increase
Winter273126 Increase
Table 3. Correlation coefficients between precipitation and Epan on the TP at the monthly scale.
Month123456789101112
R−0.36 ** −0.29 * −0.41 ** −0.57 ** −0.42 ** −0.67 ** −0.74 ** −0.83 ** −0.71 ** −0.46 ** −0.53 ** −0.46 **
Re−0.09 −0.10 −0.38 ** −0.37 ** −0.30 ** −0.54 ** −0.25 −0.60 ** −0.35 * −0.36 * −0.33 * −0.39 **
Rp−0.40 ** −0.27 −0.45 ** −0.68 ** −0.44 ** −0.67 ** −0.68 ** −0.63 ** −0.44 ** −0.24 −0.32 * −0.57 **
Note: */** denotes significance at the 95%/99% confidence level. R denotes the correlation coefficient between Epan and precipitation. Re denotes the correlation coefficient between the sum of Epan in the previous month and the current month and the precipitation in the current month, while Rp is the same.
Table 4. Classification of the SPEI on the TP in 1966–2016.
CategoryClassesSPEI-1 (%)SPEI-3 (%)SPEI-6 (%)SPEI-12 (%)
Extreme drought<−20.16 0.00 0.00 0.00
Severe drought−2–−1.51.31 2.45 0.98 0.00
Moderate drought−1.5–−1.07.68 8.33 3.92 0.00
Mild drought−1.0–034.80 24.02 43.14 54.90
Mildly wet0–1.056.05 65.20 51.96 45.10
Publisher’s Note: MDPI stays neutral with regard to jurisdictional claims in published maps and institutional affiliations.

