Article

Spatiotemporal Variation of Snow Cover and Its Response to Climate Change in the Source Region of the Yangtze River, China

1
College of Geomatics, Xi’an University of Science and Technology, Xi’an 710054, China
2
Changjiang River Scientific Research Institute, Changjiang Water Resources Commission of the Ministry of Water Resources of China, Wuhan 430010, China
3
Hubei Key Laboratory of Water Resources & Eco-Environmental Sciences, Wuhan 430010, China
4
China National Forestry-Grassland Development Research Center, Beijing 100010, China
*
Authors to whom correspondence should be addressed.
Atmosphere 2022, 13(8), 1161; https://doi.org/10.3390/atmos13081161
Submission received: 6 June 2022 / Revised: 3 July 2022 / Accepted: 20 July 2022 / Published: 22 July 2022
(This article belongs to the Special Issue Hydrological Responses under Climate Changes)

Abstract

:
In the context of global warming, snow cover changes have an extremely important impact on the hydrological cycle and the redistribution of water resources in arid and semi-arid regions. In this paper, based on the daily cloud-free snow area remote sensing product data in the source region of Yangtze River (SRYR) from 2000 to 2019, the snow phenology variables such as the snow cover day (SCD), snow onset date (SOD), snow end date (SED), and snow duration day (SDD) were extracted separately for each hydrological year, and the vertical distribution of snow cover area (SCA) in the SRYR was analyzed by combining with the digital elevation model (DEM). In addition, we also combined climate factors and land cover types to further explore the spatiotemporal variation characteristics of snow phenology in response to different influencing factors, in order to reveal the spatiotemporal variation patterns of snow cover in the SRYR. The results showed that: (1) The SCA in the SRYR has a more obvious vertical distribution, with the maximum SCA reaching 61.58% at high elevation, while at low elevation, the SCA is mostly below 20%. The distribution of SCD in the study area showed a significant exponential correlation with DEM (R2 = 0.87). (2) The area of SOD in the SRYR showed an advanced trend of about 63.37%, while the area of SED showed a delayed trend of about 69.59%, and the area which showed significant trends is 4.29% and 4.36%, respectively. Therefore, the trends of both SOD and SED showed insignificant changes. (3) Temperature change is the main factor affecting the change of snow cover in the SRYR. Among them, 90.9% of the regions showed a significant positive correlation between temperature and SCD, while precipitation showed a significant negative correlation with SCD in about 75.3% of the total area of SRYR. Under the stable snow area (SCD > 60), the land cover type is glacial or permanent snow about 1.5 × 10³ km2, which covers almost the entire glacial or permanent snow of the SRYR.

1. Introduction

Snow cover is an important component of the cryosphere and a key part of the hydrological cycle [1,2], and snow cover has properties such as high reflectivity, high latent heat of phase change, and low heat conduction [3]. Snow accumulation and melting have important effects on surface energy balance, atmospheric circulation, and water cycle and water allocation [4], which play a critical role in the self-adjustment of the global and regional climate system. Snow cover is extremely sensitive to climate change [2,5], and with increasing global warming, the snow cover in the Northern Hemisphere is showing a decline, which in turn triggers a series of climatic, hydrological, and disaster effects [6,7]. At present, snow melt is still the main source of water resources in arid and semi-arid regions [8]; therefore, it is of great importance to effectively monitor snow phenology (including snow onset date (SOD), snow end date (SED), and snow duration day (SDD)) and snow cover changes for water redistribution and response to climate change.
In recent years, with the continuous development of remote sensing technology, the advantage of remote sensing data in obtaining snow information on a large scale for a long time has gradually been highlighted, which also provides new ideas for scholars to analyze snow changes over a long time series [9]. The key to using remote sensing data to monitor snow changes lies in the discrimination of snow pixels, and whether the pixels can be accurately identified as snow or not directly affects the results of related analysis. Yang et al. [10] conducted surveying and mapping of snow cover in China based on Chinese meteorological satellite data FY-2D, FY-2E, and FY-3B, and the accuracy of the measurements was verified with meteorological station observations. The results showed that the combined use of FY-2D and FY-2E VISSR data reduces the cloud occlusion by 30.47%, and the accuracy of snow accumulation images reaches 91.28%. Gascoin et al. [11] conducted surveying and mapping of snow cover in the Pyrenees (France) by calculating the normalized difference snow index using 20 m high-resolution Sentinel-2 data. Muhuri et al. [12] constructed an algorithm for snow monitoring in forest landscapes by combining satellite data such as Sentinel-2 and Landsat-7/8, and evaluated the algorithm at test sites in forest landscapes in the Pyrenees (Spain) and the Sierra Nevada (USA). The results showed that the algorithm has high accuracy in snow detection in forested landscapes. Traditional optical remote sensing methods are limited to daytime monitoring, and the monitoring accuracy is greatly affected by frequent cloud occlusions. Therefore, Huang et al. [13] developed a minimum error thresholding algorithm to detect snow in combination with S-NPP VIIRS satellite data based on the property that nighttime light sensors have a strong perception of low-level reflected moonlight, and the results showed that S-NPP VIIRS nighttime satellite data can provide reliable snow products for polar and mid-latitude mountains, which are complementary to the standard moderate-resolution imaging spectroradiometer (MODIS) snow products.
Currently, MODIS snow product data, such as MOD10A2 and MYD10A2, are widely used in snow cover monitoring in different regions [14,15], and relevant studies have shown that the overall absolute accuracy of MODIS snow cover data reaches 93% [16,17], which also demonstrates the advantages of MODIS snow cover area product for snow cover monitoring. Zhang et al. [18] focused on the vertical distribution of snow in different elevation zones of the Manas River basin and its relationship with elevation and temperature by combining the measured surface temperature data and MODIS 8-day snow data. Jin et al. [8] analyzed the spatiotemporal characteristics of snow cover on the Loess Plateau using MODIS 8-day snow product data and found that the distribution of snow cover was significantly correlated with elevation and snow cover was significantly negatively correlated with temperature change. Notarnicola [19] analyzed global snow cover changes and associated phenology based on MODIS snow product data and found that the global snow cover in alpine regions has mainly shown a decreasing trend since the start of the 21st century and that nearly 78% of the regions had a decrease in snow duration of 43 days or more. Anjum et al. [20] combined TRMM and MODIS multi-source remote sensing data to analyze the snow cover variability in the Swat basin of the Hindu Kush, Pakistan, and explored the influence of climatic and hydrological variables on snow cover variability, and the results showed that snow and temperature effects at high elevation can have a significant impact on net flows.
The source region of the Yangtze River (SRYR) is located in the eastern alpine region of the Qinghai-Tibet Plateau with higher elevation, and the SRYR is rich in alpine snow and glacier resources. In recent years, the snow cover of glaciers in the SRYR has changed with increasing global warming. At present, there are few studies on snow cover changes in the SRYR; most of them are on the large-scale snow cover changes in the whole Qinghai-Tibet Plateau, but the spatiotemporal changes of snow cover at the small scale are neglected, so it is necessary to carry out research on snow cover change monitoring in the SRYR. Using the MODIS daily cloud-free snow cover area product for SRYR from 2000 to 2019, this paper analyzed the spatiotemporal characteristics of snow cover in the SRYR by extracting snow phenology and snow cover area (SCA), and further explored the effects of different factors on snow cover changes by combining digital elevation model (DEM), land cover type, and meteorological data.

2. Materials and Methods
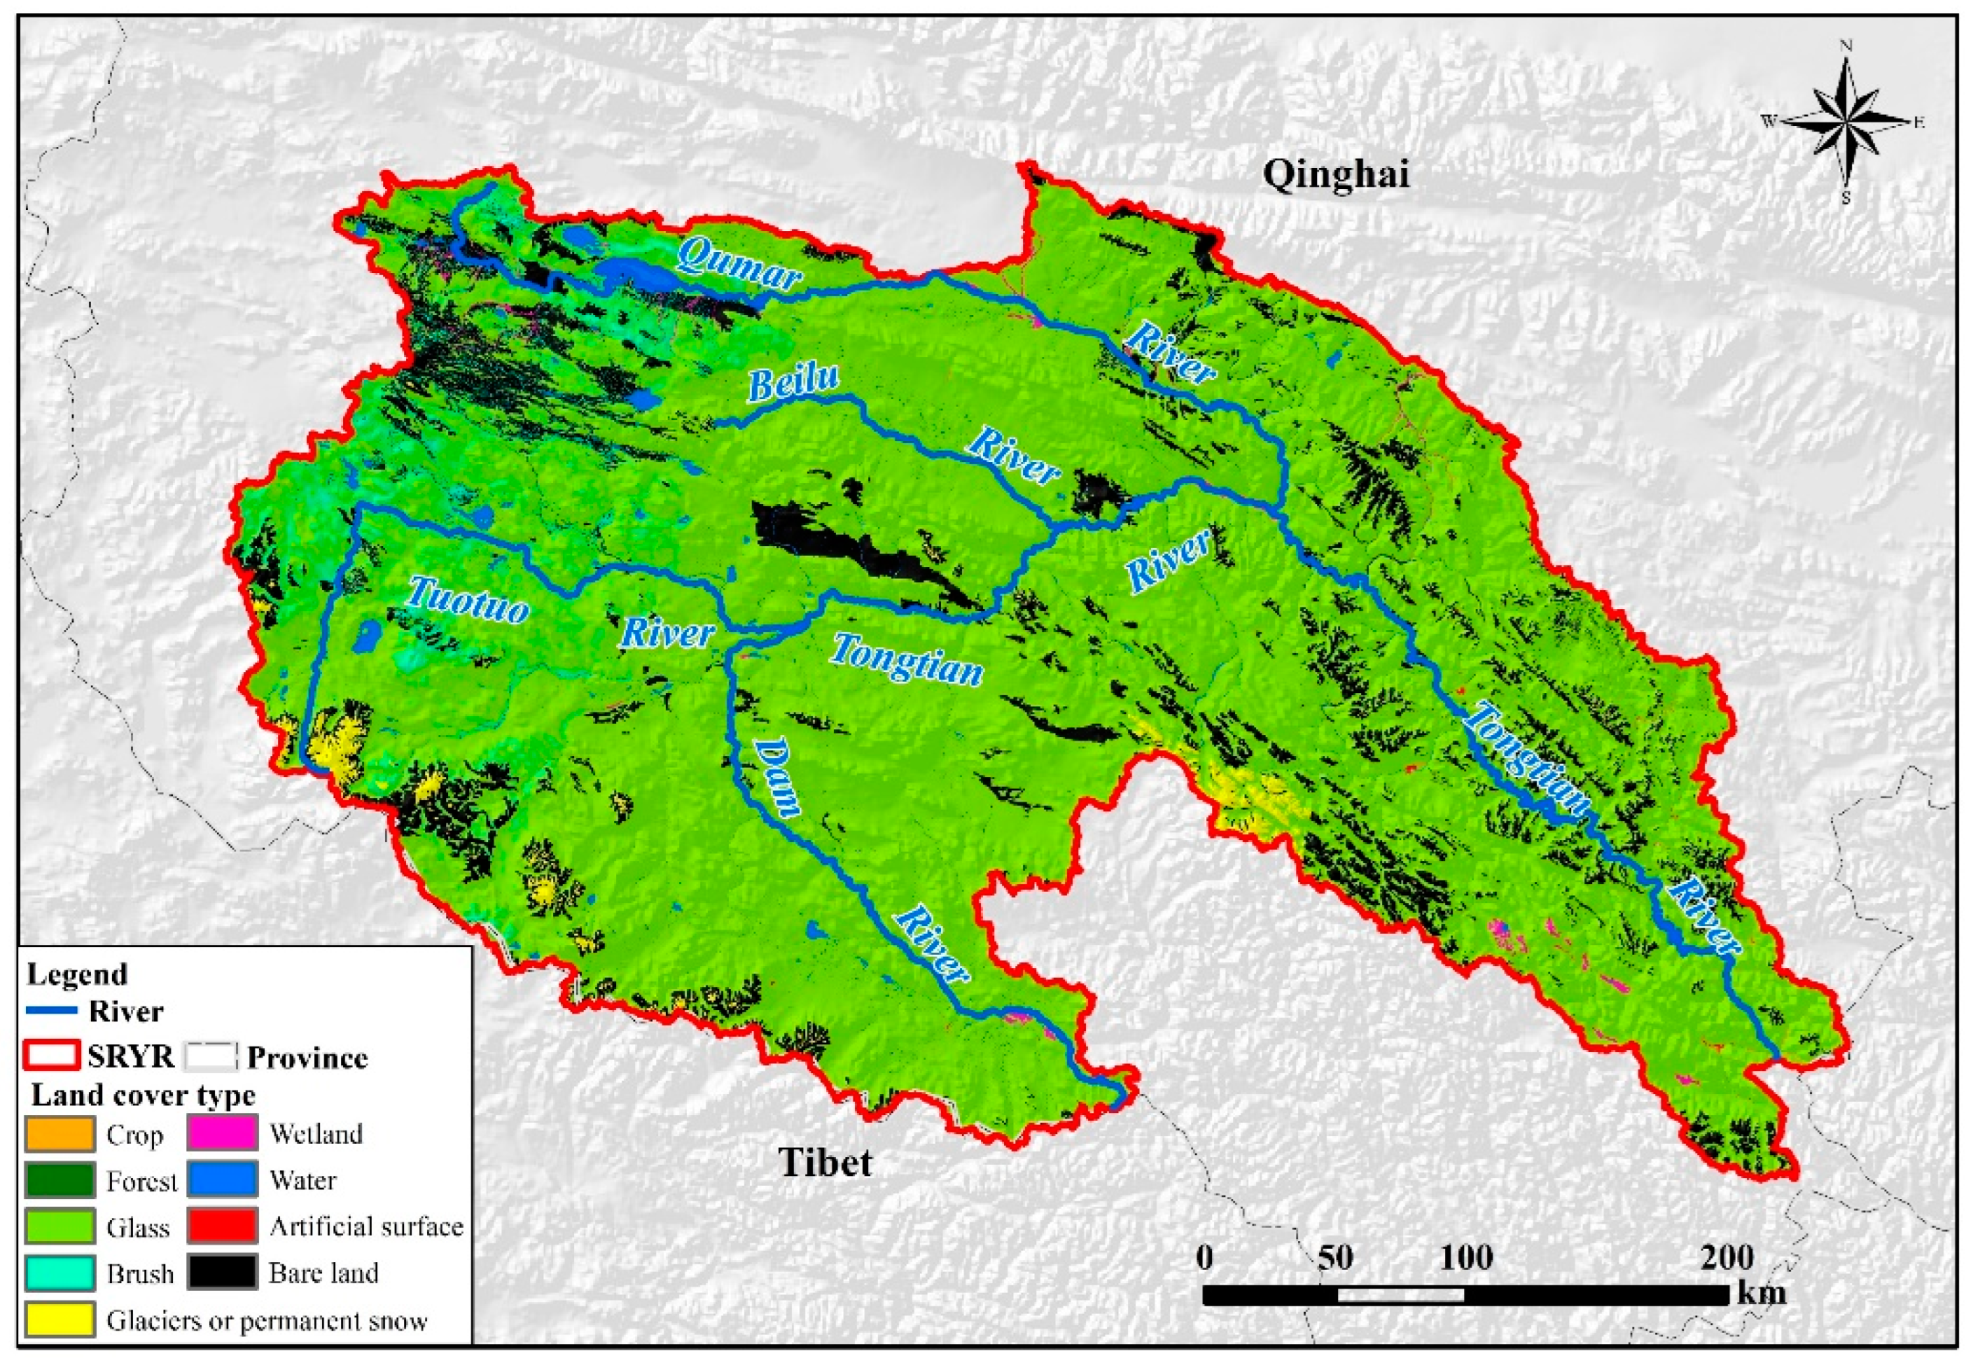
2.1. Study Area

The Yangtze River, which originates in the Tanggula Mountains on the Tibetan Plateau, is the third longest river in the world. The SRYR is the catchment region above the Zhimenda hydrological station, with a basin area of about 1.59 × 10⁵ km2 [21], accounting for about 8.83% of the total area of the Yangtze River basin. The SRYR (32°25′~35°53′ E, 89°43′~97°19′ N) is located in the southern part of Qinghai Province, which belongs to the hinterland of the Qinghai-Tibet Plateau, and the main rivers are the Tuotuo River, the Dangqu River, and the Chumal River, etc. (Figure 1). The elevation of the study area ranges from 3512 m to 6456 m, with an average elevation of about 4779 m [22], and the topography shows an overall trend of high in the west and low in the east. The SRYR has a typical plateau continental monsoon climate with a clear distinction between dry and rainy seasons. The average annual temperature in the study area ranges from −5.5 to 4 °C, and the average annual precipitation is about 429.7 mm, of which the precipitation from June to September can account for 76.7% of the total annual precipitation [23]. The land cover type in the SRYR is mainly grassland, which has an area of about 1.16 × 10⁵ km2, followed by bare land with an area of about 1.52 × 10⁴ km2. In addition, the SRYR is rich in rivers, lakes, alpine snow, and glaciers, with about 1.55 × 10³ km2 of glaciers and permanent snow, and is an important flow-producing and water-conserving area in China. Therefore, the SRYR, together with the source region of the Yellow River and the source region of Lancang River, is known as the largest alpine wetland ecosystem in the world [24].

2.2. Dataset

The snow cover data used in this paper are the “MODIS daily cloud-free snow cover area product for Sanjiangyuan from 2000 to 2019” [25] provided by the National Tibetan Plateau Data Center (http://data.tpdc.ac.cn (accessed on 5 May 2022)). Based on MODIS snow data, this dataset guarantees the recognition accuracy of snow extent by improving different snow extraction methods for different subsurfaces, while combining the hidden Markov model algorithm and Special Sensor Microwave/Imager to achieve the production of completely cloud-free daily snow cover products [26,27]. The dataset has a spatial resolution of 0.005° (approximately 500 m) and the time span is from 2000 to 2019.
The monthly precipitation data were obtained from the “1-km monthly precipitation dataset for China (1901–2020)” [28] provided by the National Tibetan Plateau Data Center (http://data.tpdc.ac.cn (accessed on 6 May 2022)) with a spatial resolution of 1 km, and only the data from 2000 to 2019 were selected in this paper. The dataset was generated by downscaling in the Chinese region using the Delta spatial downscaling scheme based on the global 0.5° climate dataset published by CRU and the global high-resolution climate dataset published by WorldClim. This dataset was validated using data from 496 independent meteorological observation sites before publication and the validation results were credible [29,30,31,32].
The land surface temperature data were obtained from the “A combined Terra and Aqua MODIS land surface temperature and meteorological station data product for China (2003–2017)” [33] provided by the National Tibetan Plateau Data Center (http://data.tpdc.ac.cn (accessed on 5 May 2022)). The dataset has a spatial resolution of 5600 m and spans the period from January 2003 to December 2017. This dataset mainly combines MODIS daily data (MOD11C1 and MYD11C1), monthly data (MOD11C3 and MYD11C3), and meteorological station data to recalculate the true monthly-scale surface temperature, and further improves the accuracy by constructing a regression analysis model. The accuracy analysis showed that the surface temperature reconstruction results were closely related to the in situ measurements [34].
The DEM data were obtained from the Geospatial Data Cloud site, Computer Network Information Center, Chinese Academy of Science (http://www.gscloud.cn/ (accessed on 10 March 2022)) with a spatial resolution of 90 m. The land cover types were obtained from Globeland30: Global Geographic Information Public Product (http://www.globallandcover.com (accessed on 25 April 2022)) with a spatial resolution of 30 m (Figure 2).

2.3. The Research Methods

2.3.1. Snow Cover Indices

The main purpose of this paper is to study the vertical distribution of snow cover and the relationship between snow cover changes and meteorological factors, including the vertical distribution of SCA in different months, the intra-annual variation of snow cover area in different elevation zones, the spatial distribution and change trend of annual average snow cover days (SCD), the correlation between SCD and meteorological factors, and the variation of snow phenology. Some indices are calculated as follows:
(1)
Calculation of SCA and SCD
In the snow cover data adopted in this paper, 1 represents snow cover and 0 represents non-snow cover. Therefore, the ratio of the number of snow pixels to the number of total pixels can be used to represent the proportion of SCA. SCD represents the total number of days covered by snow for a certain pixel in a hydrological year, and its calculation formula is as follows:
S C D = i = 1 365 i s   s n o w   ( i )
where is_snow(i) = 1 represents a snow cover. is_snow(i) = 0 represents a non-snow cover; i represents the position of a day in a hydrological year, where the hydrological year can be defined as 1 September of the current year to 31 August of the following year. SCD represents the number of days of snow cover in a year [18,35].
(2)
Extraction of snow phenology
The snow phenology to be extracted in this paper includes: SOD, SED, and SDD. SOD is the time of the first snow event in a hydrological year, and we record the first day of the first snow event as SOD. Similarly, SED is the time of the last snow event in a hydrological year, and we record the last day of that snow event as SED. SDD is the number of days from SOD to SED, which is the difference between SED and SOD.

2.3.2. Trend Analysis Method

The trend analysis method used in this paper is a one-dimensional linear regression analysis of a set of variables that vary with time series using the least squares method. This method detects the trend of dynamic changes of variables on the pixel scale and can reflect the spatiotemporal characteristics of variables in an integrated manner [18]. The calculation formula is as follows:
s l o p e = n × i = 1 n i × X i i = 1 n i i = 1 n X i n × i = 1 n i 2 i = 1 n i 2
where n is the total number of time series, Xi represents the variable for the ith year, slope is the variation trend, slope > 0 represents an increasing trend of the variable, and slope < 0 represents a decreasing trend of the variable.

2.3.3. The Pearson Correlation Coefficient

The Pearson correlation coefficient method is used in this paper to calculate the correlation between SCD and meteorological factors (precipitation and surface temperature), and then the potential relationship between them is analyzed. The calculation formula is as follows:
R = i = 1 n x i x ¯ y i y ¯ i = 1 n x i x ¯ 2 i = 1 n y i y 2
where R is the correlation coefficient; n is the total research year; Xi and Yi represent the two variables needed to be calculated for the ith year, respectively. x ¯ and y ¯ are the corresponding multi-year averages of the two variables, respectively.

3. Results

Based on the daily snow cover data of SRYR, the corresponding analytical study on the snow cover variation of SRYR was conducted in this paper. We found that the SCA of SRYR is generally higher from October to December each year. Among them, the largest SCA occurred on 7 November 2008, and nearly 1.005 × 10⁵ km2 of SRYR was covered by snow on that day, which accounted for 73.1% of the total area of SRYR. The snow cover variation of SRYR is analyzed as follows.

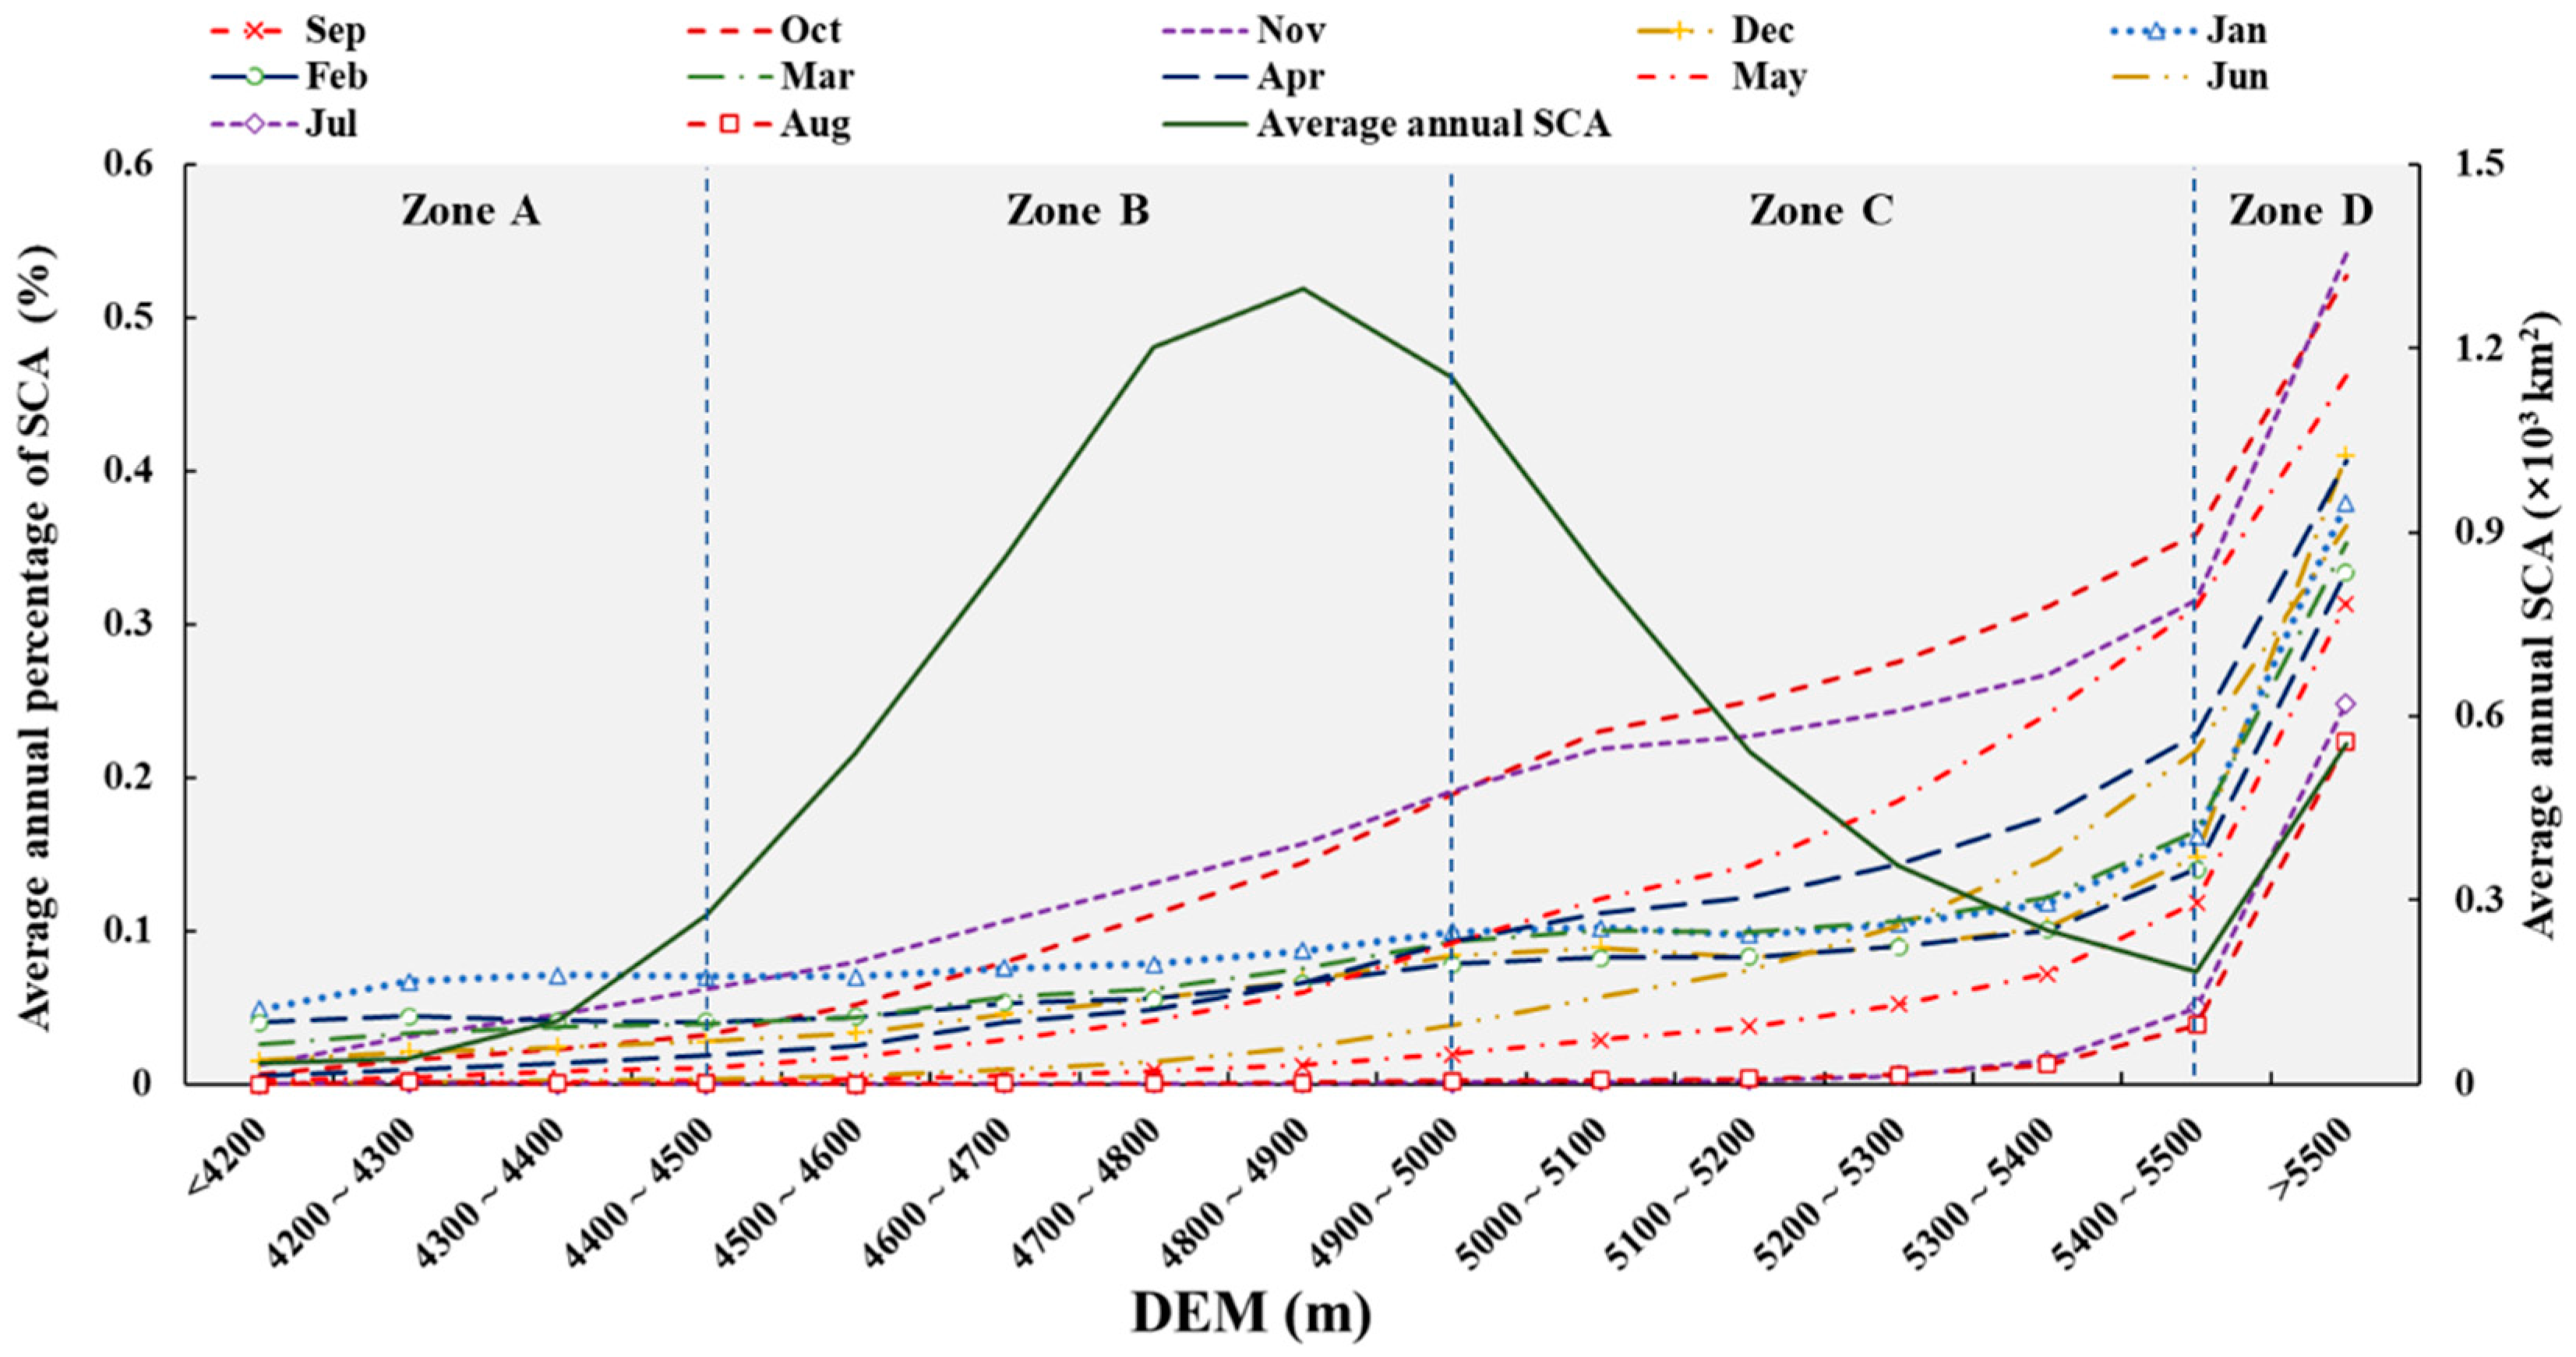
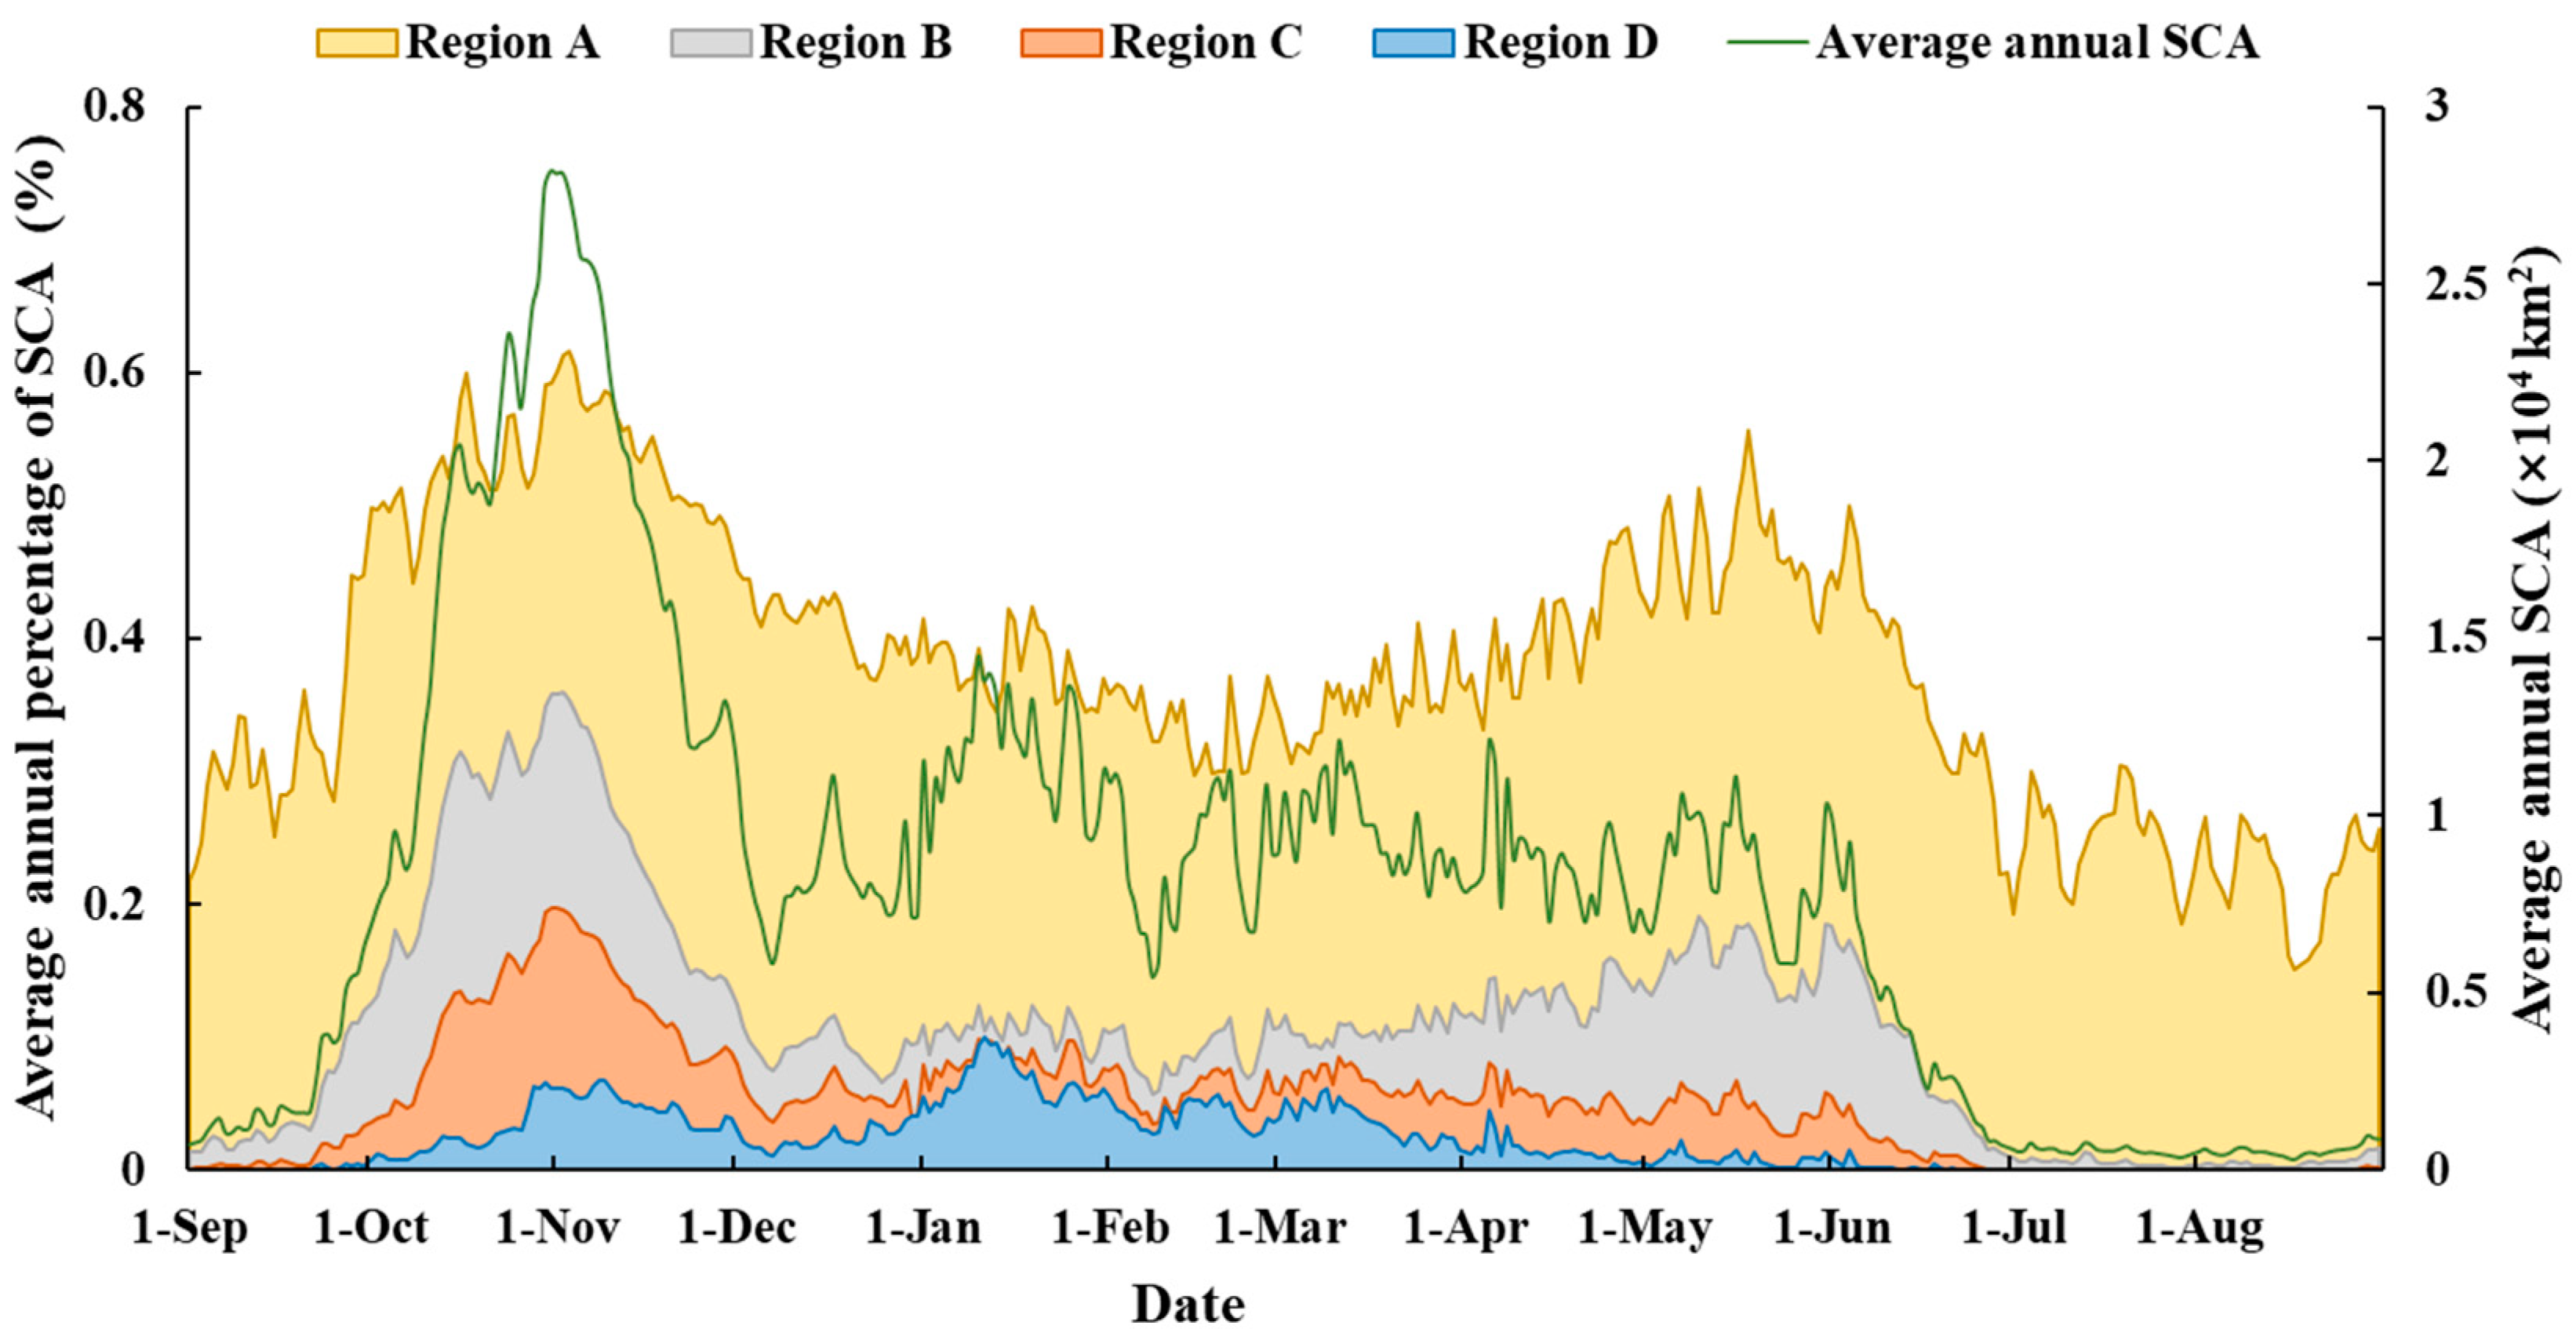
3.1. Vertical Distribution of SCA

In this paper, the elevation of SRYR was divided into 15 zones at an interval of 100 m. Then, the percentage of SCA within each zone was calculated by counting the total number of pixels in different elevation intervals with the number of pixels under snow cover, and finally the vertical distribution of snow area in different months in SRYR was plotted (Figure 3). The SCA is the ratio of the total number of pixels under snow cover to the total number of pixels in the elevation area. The SCA is monthly averages for the 2000–2019 time span. Based on the trends of SCA at different elevations, this paper further divided the SRYR into four main elevation zones (A: <4500 m, B: 4500–5000 m, C: 5000–5500 m, and D: >5000 m), and the areas are 2.02 × 10⁴ km2, 9.6 × 10⁴ km2, 1.95 × 10⁴ km2, and 0.13 × 10⁴ km2, respectively. On the whole, the vertical distribution of SCA in SRYR was more obvious. In the elevation Zone A, the SCA percentage of each month was below 10%, and the snow accumulation is mainly concentrated in November to February, and the SCA of these four months is slightly higher than that of other months. In the elevation Zone B, the SCA in October and November changed more obviously by elevation, and increased significantly with the increasing elevation. In this elevation zone, although the SCA from December to May also increased with the rising elevation, the overall SCA did not change much and the SCA was relatively less influenced by the elevation. Within the C elevation zone, the effect of elevation change on SCA in each month was more obvious, especially in July and August when there were few changes in both A and B zones, and the SCA in October and November was still high, ranging from 20% to 40%. In addition, the SCA from April to June also showed a significant increase with the rise of elevation, and they were 22.8%, 31.2%, and 21.8% in the 5400–5500 m elevation range, respectively. In the elevation Zone D, the SCA reached the maximum in each month, and it can be seen that in the high elevation area above 5500 m, the snow coverage rate was above 20% throughout the year, and in the middle of November, the SCA was 54.1%, which reached the maximum.
Based on the four different elevation zones, the daily SCA of different elevation zones in the SRYR in 19 hydrological years was extracted in this paper, and the interannual variation of SCA of the four elevation zones was plotted (Figure 4). Among them, the SCA is the ratio of the total number of pixels under snow cover to the total number of pixels in the elevation area, and the SCA is the average of 19 hydrological years.
As can be seen in Figure 4, the overall trend of SCAs at different elevations was generally consistent, but each elevation partition had its own characteristics. In Zone A, the snow accumulation period was mainly in autumn and winter and the SCA reached a maximum of 9.98% in January. From March, the snow in Zone A started to melt gradually and melts away by early June, and from June to October, Zone A was basically free of snow cover. Only after October, with the onset of the snowfall season and the decrease in temperature, the SCA in Zone A steadily increased. The trend of SCA in Zone B was basically the same as that in Zone A, and the SCA in Zone B was below 20% and peaked at the beginning of November (19.76%). Compared to Zone A, the snow accumulation period in Zone B was slightly advanced, and the snow melt in Zone B continued until the end of June. The snow accumulation period in Zone C can be divided into two periods, one from October to November in the fall and the other in the winter and spring. During the first snow accumulation period, the SCA in Zone C increased abruptly and reached 36.01% in early November. However, soon in mid to late November, the snow melted rapidly and the SCA decreased to 7.45%. At the beginning of the second snow accumulation period, the SCA in Zone C increased at a slow rate of increase and reached an extreme value (18.6%) at the end of May. After two accumulation periods, the snow cover in Zone C began to gradually melt. By the end of July, the SCA in Zone C was almost zero, and then again in late August, with the appearance of seasonal snowfall, the SCA in Zone C gradually increased again. The elevation of Zone D was above 5500 m. Zone D has low temperatures all year round and the snow melts more slowly. The percentage of SCA in Zone D was mostly between 20 and 60% throughout the year, and the snow accumulation period was also mainly in autumn (September–November) and spring (March–May). The duration of the snow melt period in Zone D was relatively long, with a slow melt rate from November to March and a faster melt rate from June to August, probably due to the gradual warming of temperatures in the summer.

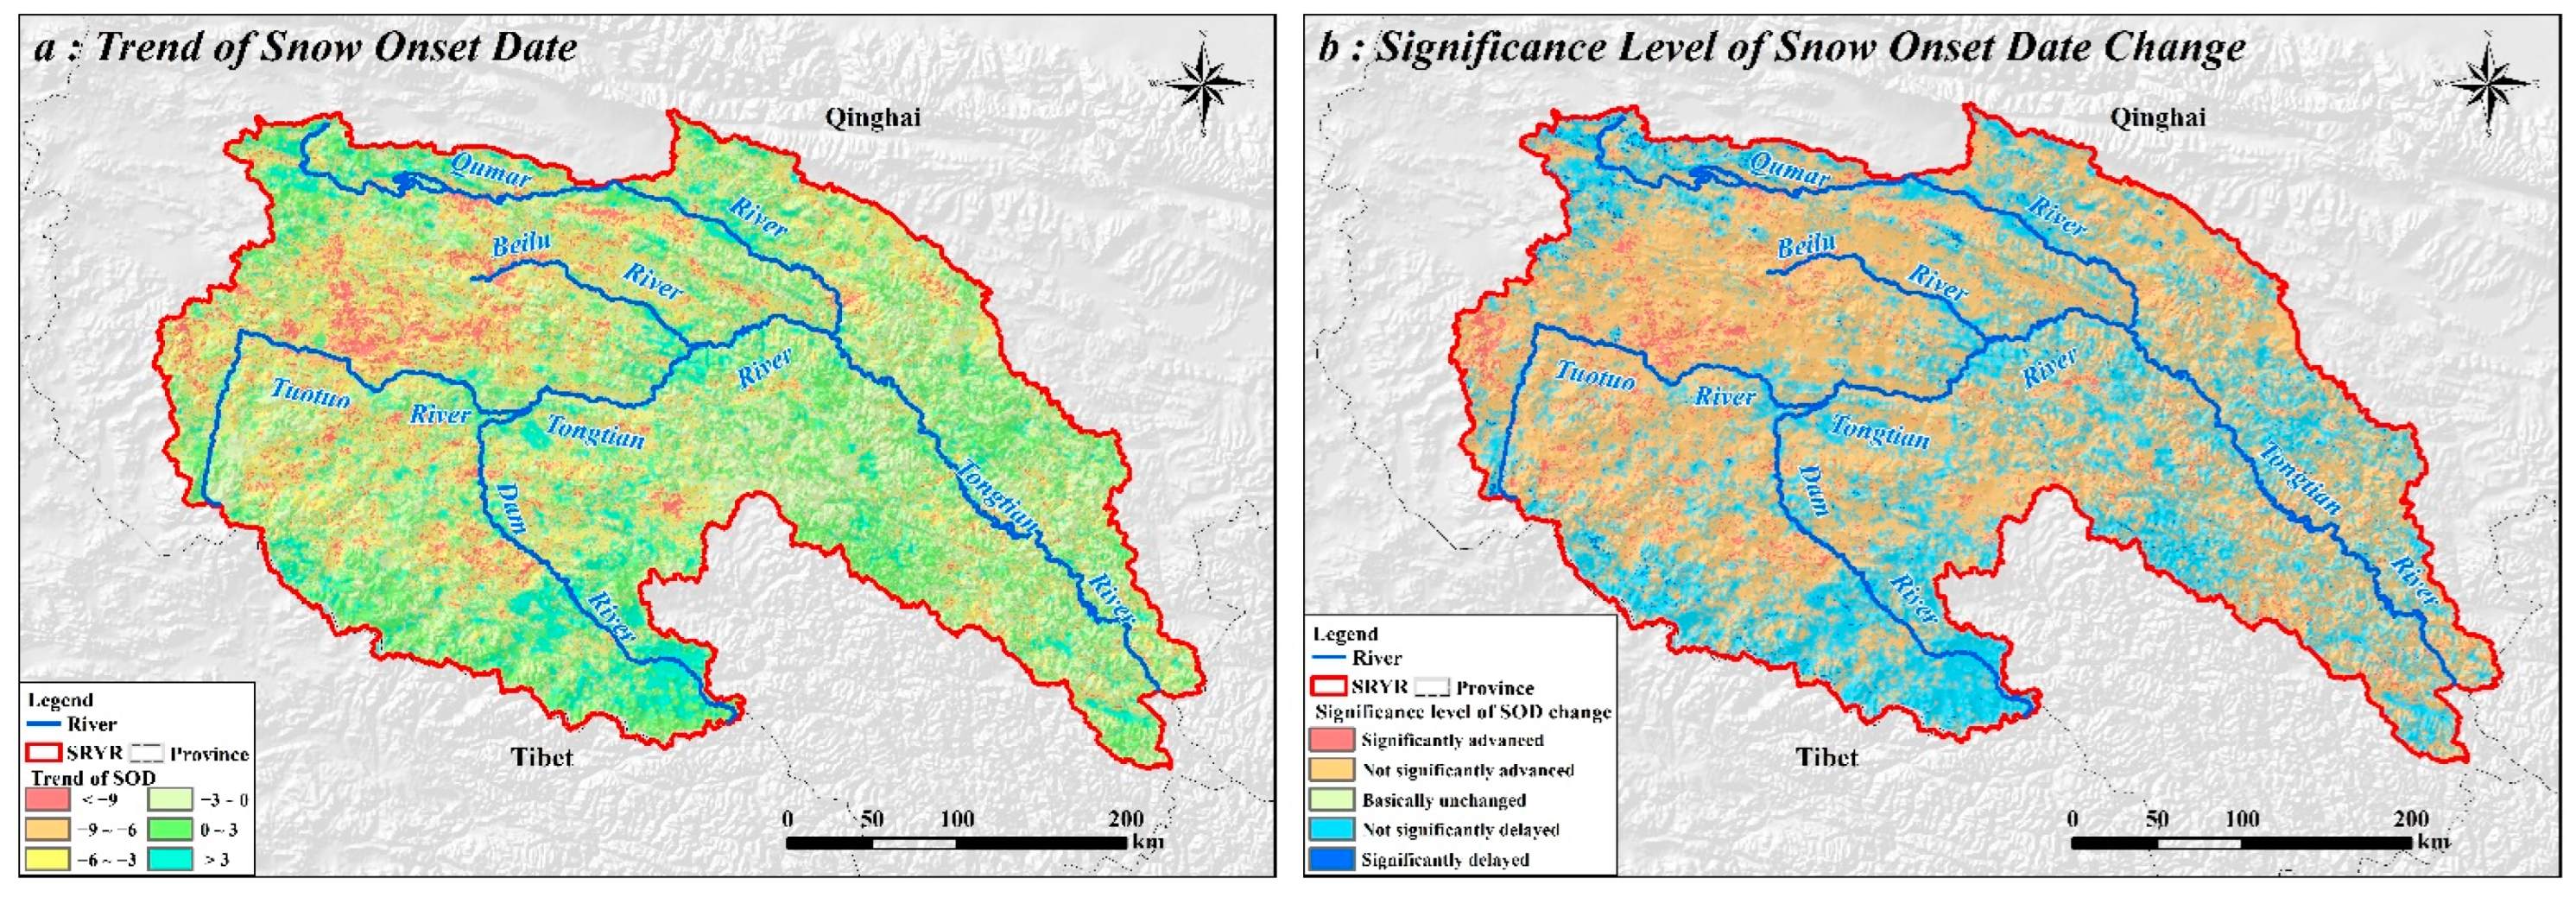
3.2. The Spatiotemporal Variation Trend of the Snow Phenology

Generally, the distribution of snow phenology in the study area showed strong spatial variability. Based on the SCD, the study area can be divided into stable snow zone and unstable snow zone, and generally speaking, SCD over 60 days can be called stable snow zone. The average SCD of 19 hydrological years in the SRYR was calculated in this paper (Figure 5a). Among them, the stable snow area was mainly distributed in the southeast Tibetan Plateau, the eastern Tibetan Plateau, and the high elevation areas of the Qinghai Plateau, accounting for 7.21% of the total area of the SRYR, while the area of the area with SCD over 100 days only accounts for 2.35%. Nearly 67.27% of the area of SRYR had SCD below 20 days, mainly distributed in the elevation Zone A and Zone B, which are below 5000 m in elevation. Topographically, Zone A and Zone B are surrounded by high elevation areas, resulting in obstructed water vapor transport and thus little precipitation in the area, which may be the main reason for the low SCD in low elevation areas.
The spatial distribution of SOD, SED, and SDD of SRYR in recent years is shown in Figure 5b–d. On the whole, both SOD and SED of SRYR were closely related to the change of elevation, with SOD gradually advancing and SED gradually delayed as the elevation gradually increases. The SOD in most areas of SRYR was after 20 December, accounting for 62.76% of the total area, and most of these areas were below 5000 m in elevation. The areas with earlier SOD were still mainly located in the southwestern part of SRYR and some higher elevation areas such as the eastern part, especially in the southwestern part of SRYR, where the elevation is above 5500 m, and the SOD was also advanced to before October, much earlier than the other areas of SRYR. In terms of the spatial distribution of SED, the areas where SED appeared after 20 June were mainly distributed in the southwestern and western parts of SRYR and on both sides of the Tongtian River, and these areas were mostly at the summit of the mountain range, where SED was slightly later than other areas due to their special geographical location as well as environment. The areas at 4400–4800 m elevation, such as the sides of Dangqu River and Beilu River, the central part of Chumal River, and the part of the confluence of Tuotuo River and Dangqu River, were the earliest areas of SED in SRYR, and their area accounts for 51.99% of the total area of the study area. SDD differs numerically from SCD because SDD only considers the time of the start and end of snow accumulation, but both showed a more similar spatial distribution pattern.
In this paper, the trends of three snow phenology (SOD, SED, and SDD) in the SRYR were calculated, respectively, by using the one-dimensional linear regression analysis, and the Mann–Kendall trend test was combined to test the significance of the trends of snow phenology. The SOD of SRYR showed a slow advance trend on the whole, but the trend of SOD in most areas was not significant (Figure 6a,b). The areas with gradual advancement of SOD were mainly distributed on the eastern side of Ulan-Ula Mountain, the western part of the Qinghai Plateau, and some areas on both sides of the lower part of the Tongtian River, accounting for about 63.37% of the total area. Among them, in the source of the Beilu River and most of the northern part of the Tuotuo River, the areas where the rate of SOD advancement was above 6 d/y accounted for 12.21% of the total area, and only 3.41% of the areas showed a significant advancement trend. The area showed that a delayed trend of SOD in SRYR accounted for 36.63%, and the rate of delay was about 1–6 d/y, but only 0.55% of the area showed a significant delayed trend. From the trend of SED and the distribution of significance (Figure 6c,d), 69.59% of the regions in SRYR showed a delayed trend of SED, mainly in the northwestern part of SRYR, with 13.48% of the regions having a delay rate of 6 d/y or more. The area where SED showed a significant delayed trend accounted for 4.14% of the total area, while only 0.5% of the area showed a significant advanced trend. Figure 6e,f illustrate the trend of SDD in the SRYR and the significance distribution, respectively. The SDD in 55.81% of the SRYR showed an increasing trend, mainly in the high elevation areas in the southwestern part of the SRYR, the mountainous areas on both sides of the lower part of the Tongtian River, and the confluence of the Beilu River and the Tongtian River, while the SDD showed a decreasing trend in 44.19% of the total area of the area. From the distribution of significance of SDD change trends, the percentage of area that showed a significant increase and decrease in SDD was 0.67% and 0.45%, respectively, which indicated that the change of SDD in the SRYR was not significant. In general, the SOD in the northwest part of SRYR, such as the east side of Ulan-Ula Mountain, the north side of Tuotuo River, and the south side of Beilu River, showed an advanced trend and the SED showed a delayed trend. While in the high elevation areas such as the southern and southwestern regions of SRYR, SOD showed a delayed trend, SED showed an advanced trend, and SDD showed a shortened trend.

3.3. Correlation of SCD with Temperature and Precipitation

Figure 7a,b show the spatial distribution of multi-year average temperature and the correlation coefficient between temperature and SCD in the SRYR, respectively. Combined with the elevation distribution of SRYR (Figure 1), we can see that the average temperature is above 0 °C at lower elevations, such as parts of the river confluence and both sides of the banks of the Tongtian River. The elevation of these areas was generally below 4500 m, and the temperature change had a greater influence on the snow melt rate, and the correlation coefficient between temperature and SCD in this region was mostly below −0.4, showing a strong negative correlation. Therefore, temperature was a major factor influencing the change of snow cover in this region. As the elevation gradually increases, the average temperature also gradually decreases, and the influence of temperature on snow cover also gradually decreases. In areas such as the southwestern and northwestern parts of SRYR, the annual average temperature was below −4 °C, and in some areas, the average temperature was even below −6 °C. The effect of temperature change on SCD in these areas was relatively small, and the correlation coefficients are mostly between −0.2 and 0, showing a weak negative correlation. In general, the area showing a significant negative correlation between temperature and SCD in SRYR was about 1.25 × 10⁵ km2, which accounted for about 90.9% of the total area of SRYR. In addition, 18.35% of the regions have a correlation coefficient below −0.4, especially in the southeastern part of the SRYR. In some areas such as the southwest and northwest of SRYR, although temperature and SCD also showed negative correlation, the overall correlation coefficient was smaller, mainly because the effect of temperature change on snow melt rate decreases significantly with increasing elevation, thus leading to a poor correlation between temperature and SCD in some high elevation areas.
Figure 8a,b illustrate the spatial distribution of average precipitation in the SRYR and the correlation coefficient between precipitation and SCD, respectively. The average precipitation in SRYR showed a high spatial distribution pattern in the northwest and a low spatial distribution pattern in the southeast. Among them, the areas with more precipitation were mainly concentrated in the southeast side of Tuotuo River and Tongtian River, and the precipitation in these areas is mostly above 380 mm, especially in the lower part of Tongtian River, where the average precipitation reaches more than 500 mm. Different from temperature, precipitation showed a positive correlation with SCD in 85.36% of the regions. As can be seen in Figure 8b, the areas with correlation coefficients above 0.4 were mainly distributed in the northern part of the upper part of Tongtian River, which accounted for 14.94% of the total area. On the whole, the area showing a significant positive correlation between precipitation and SCD is about 1.04 × 10⁵ km2, accounting for 7% of the total area of SRYR, and the correlation coefficients are mainly concentrated between 0.2 and 0.4. In addition, combined with the elevation distribution of SRYR (Figure 1), we can see that some regions with low correlation coefficients were mainly located in some high elevation regions, such as the eastern side of Ulan-Ula Mountains, Zulqen-Ula Mountains, and the northern side of Tanggula Mountains. These high elevation regions had relatively low temperatures and precipitation mostly occurs in the form of snow, so they may be covered with snow all year round, which makes the influence of precipitation events on SCD changes gradually decrease. The relatively low elevation region does not have the same stable snow cover as the high elevation region, and its snow cover mainly comes from precipitation, so the correlation between precipitation and SCD is more obvious.

4. Discussion

Based on the DEM data, the distribution of snow variation at different elevations was discussed, and the influence of precipitation and temperature on SCD variation in SRYR was analyzed by using the Pearson correlation coefficient method. The results showed that there is a very obvious vertical distribution of snow phenology and snow variation, and both temperature and precipitation have an obvious correlation with snow variation, among which temperature is the main factor to determine snow variation.

4.1. The Effect of Elevation Changes on Snow Cover

In this paper, the vertical distribution of SCA and the spatial distribution of snow phenology were focused on based on the DEM data of SRYR, and the distribution of SCD under different DEM was counted (Figure 9). The results showed that the change in elevation has a significant effect on snow cover, and SCD showed an exponential correlation with DEM. In the area above 5000 m, the SCD changed significantly with the change of elevation. The spatial distribution of snow in SRYR varies more obviously, with more snow in the high mountain areas in the west, southwest, and southeast, and less in the interior, so the SCA shows more obvious differences in different elevation zones. In addition, the results also showed that SCA was generally less and SCD was relatively less at low elevations, while SCA was generally high at high elevations and SCD showed a significant correlation with elevation, which is consistent with the findings of Chu [36] in the Tuotuo River basin. In the low elevation area, the snow mainly comes from seasonal snowfall, and the snow melts quickly, so it is difficult to form stable snow, so the SCD in this area is mostly below 20 d. In contrast, at high elevation, where temperatures are subzero year-round, snow melting rates are slow, especially at summits or ridges [6,36,37], and stable snow is highly susceptible to formation. At elevation above 5500 m, snow cover gradually decreases in November, and the main reason for this phenomenon may be the sublimation of snow in low temperatures, strong winds, and low-pressure environments [38].

4.2. The Effect of Climatic Factors on Snow Cover

The change in elevation not only affects the distribution of snow cover, but, most importantly, it also affects the change in climatic factors [39]. Since the variation of SCD with elevation is more obvious in the area above 5000 m, we combined the distribution of elevation and climatic factors in the SRYR, and plotted the variation of temperature and precipitation in the area above 5000 m elevation (Figure 10). By comparing the trend distribution of temperature (Figure 10a) and precipitation (Figure 10b) with DEM, as Figure 10 shows, the change of temperature has a highly significant negative correlation with the elevation, while the precipitation gradually increases with the elevation and shows a positive correlation with DEM. Since SRYR is located in the plateau area with an average elevation of 4779 m and a year-round low temperature, the temperature in the study area gradually decreases with the rise in elevation and shows a significant negative correlation. From the distribution of temperature, precipitation, and SCD at different elevations, the change of snow cover is significantly influenced by the temperature and precipitation at different elevation zones. The influence of precipitation and temperature on the change of snow cover can be visualized in the area with elevation above 5000 m. The gradual decrease of temperature and the gradual increase of precipitation are the main reasons for the obvious increase of SCD at high elevation.
Since the start of the 21st century, temperature and precipitation in the SRYR have shown a yearly increasing trend in the context of global climate change, which is mainly characterized by warming [40]. However, as the trend of global change becomes more pronounced, the temperature of the SRYR is also affected, which will inevitably lead to an increase in the rate of glacial snow melt in the SRYR [41,42]. From the results of this paper, the spatial distribution of temperature is more obviously influenced by elevation, and temperature shows a negative correlation with SCD. At low elevation, the increase of temperature accelerates the melting of snow, so temperature is the main factor determining the change of SCD, which is consistent with the results of previous studies [15,18]. In addition, in some low elevation areas, the average annual temperature is mostly above 0 °C. The increase in temperature will make it difficult for snow to exist for a long time in these areas and will prevent the formation of a stable snow cover. However, as the elevation continues to rise, the effect of temperature and SCD gradually decreases, which is due to the fact that at high elevation where the temperature is often changing below 0 °C all year round, it is difficult for the snow to melt in this environment. The main factor affecting snow melt at this time is snow sublimation under low-pressure conditions [38], so the effect of temperature change on snow accumulation is significantly lower at high elevation than at low elevation.
Snow cover variation is a more complex process that is influenced not only by elevation and temperature alone [38,43], but also by changes in precipitation, especially during the warm season when temperatures begin to rise [18,44]. Huang et al. [41] conducted a systematic analysis of precipitation and snowfall in the Tibetan Plateau region, and the results showed that some of the precipitation at high elevation is in the form of snow, and there is a non-significant trend of increasing snowfall in the western part of the SRYR, while there is a significant trend of increasing precipitation. Due to the lack of stable snow cover, precipitation is the driving factor of snow cover variability at lower elevations. In contrast, at some high elevations, precipitation may delay the period of snow melt due to the presence of stable snow, but the effect on snow variability also decreases significantly, which is consistent with the results of some studies in the Qinghai-Tibet Plateau and Tianshan region [44,45].

4.3. The Effect of Land Cover Type on Snow Cover

This paper also analyzes the differences in snow cover under different land cover types. We divided the areas with SCD over 60 d (stable snow cover area), then compared the land cover type distribution of the SRYR, and counted the proportion of land cover type under stable snow cover area (Table 1). Combined with SRYR’s land cover type and SCD spatial distribution, it was found that the total area of stable snow cover was about 9.73 × 10³ km2, and the main land cover types in the stable snow cover area were grassland, bare land, and glacier or permanent snow. In the eastern part of SRYR, the stable snow cover is mainly distributed in grassland and bare land, while in the southwest part of SRYR, the main land cover type is glacier or permanent snow, and the SCD under glacier or permanent snow is more than 60 d in almost all of SRYR. In addition, the SCD of some lakes in the western part of SRYR is also above 60 d, which may be due to the snow cover caused by the freezing of the lake surface.

4.4. Future Studies

Combining precipitation and temperature data, this paper focuses on the effect of precipitation and temperature variability on snow cover. However, there are many other factors that affect snow cover variability, such as wind speed, slope, aspect, and subsurface [46,47], which can affect snow cover and snow melt. In addition, snow sublimation is also an important hydrological process at high elevation, which also affects the change of snow cover [18,38]. Due to the thin air and low air pressure at high elevation, the local snow distribution will also change when there are strong winds blowing through, and this will also accelerate the snow sublimation process [39]. Therefore, we will continue to investigate the effects of other different factors on snow cover in our subsequent study.

5. Conclusions

Based on the daily snow cover data of SRYR, the SCD, SOD, SED, and SDD of each hydrological year were extracted in this paper, and the spatiotemporal variation trends of different snow cover were analyzed by one-dimensional linear regression analysis. In addition, the vertical distribution of snow cover and the correlation between SCD and meteorological factors were also analyzed by combining DEM, temperature, and precipitation data. The results of the study indicate that:
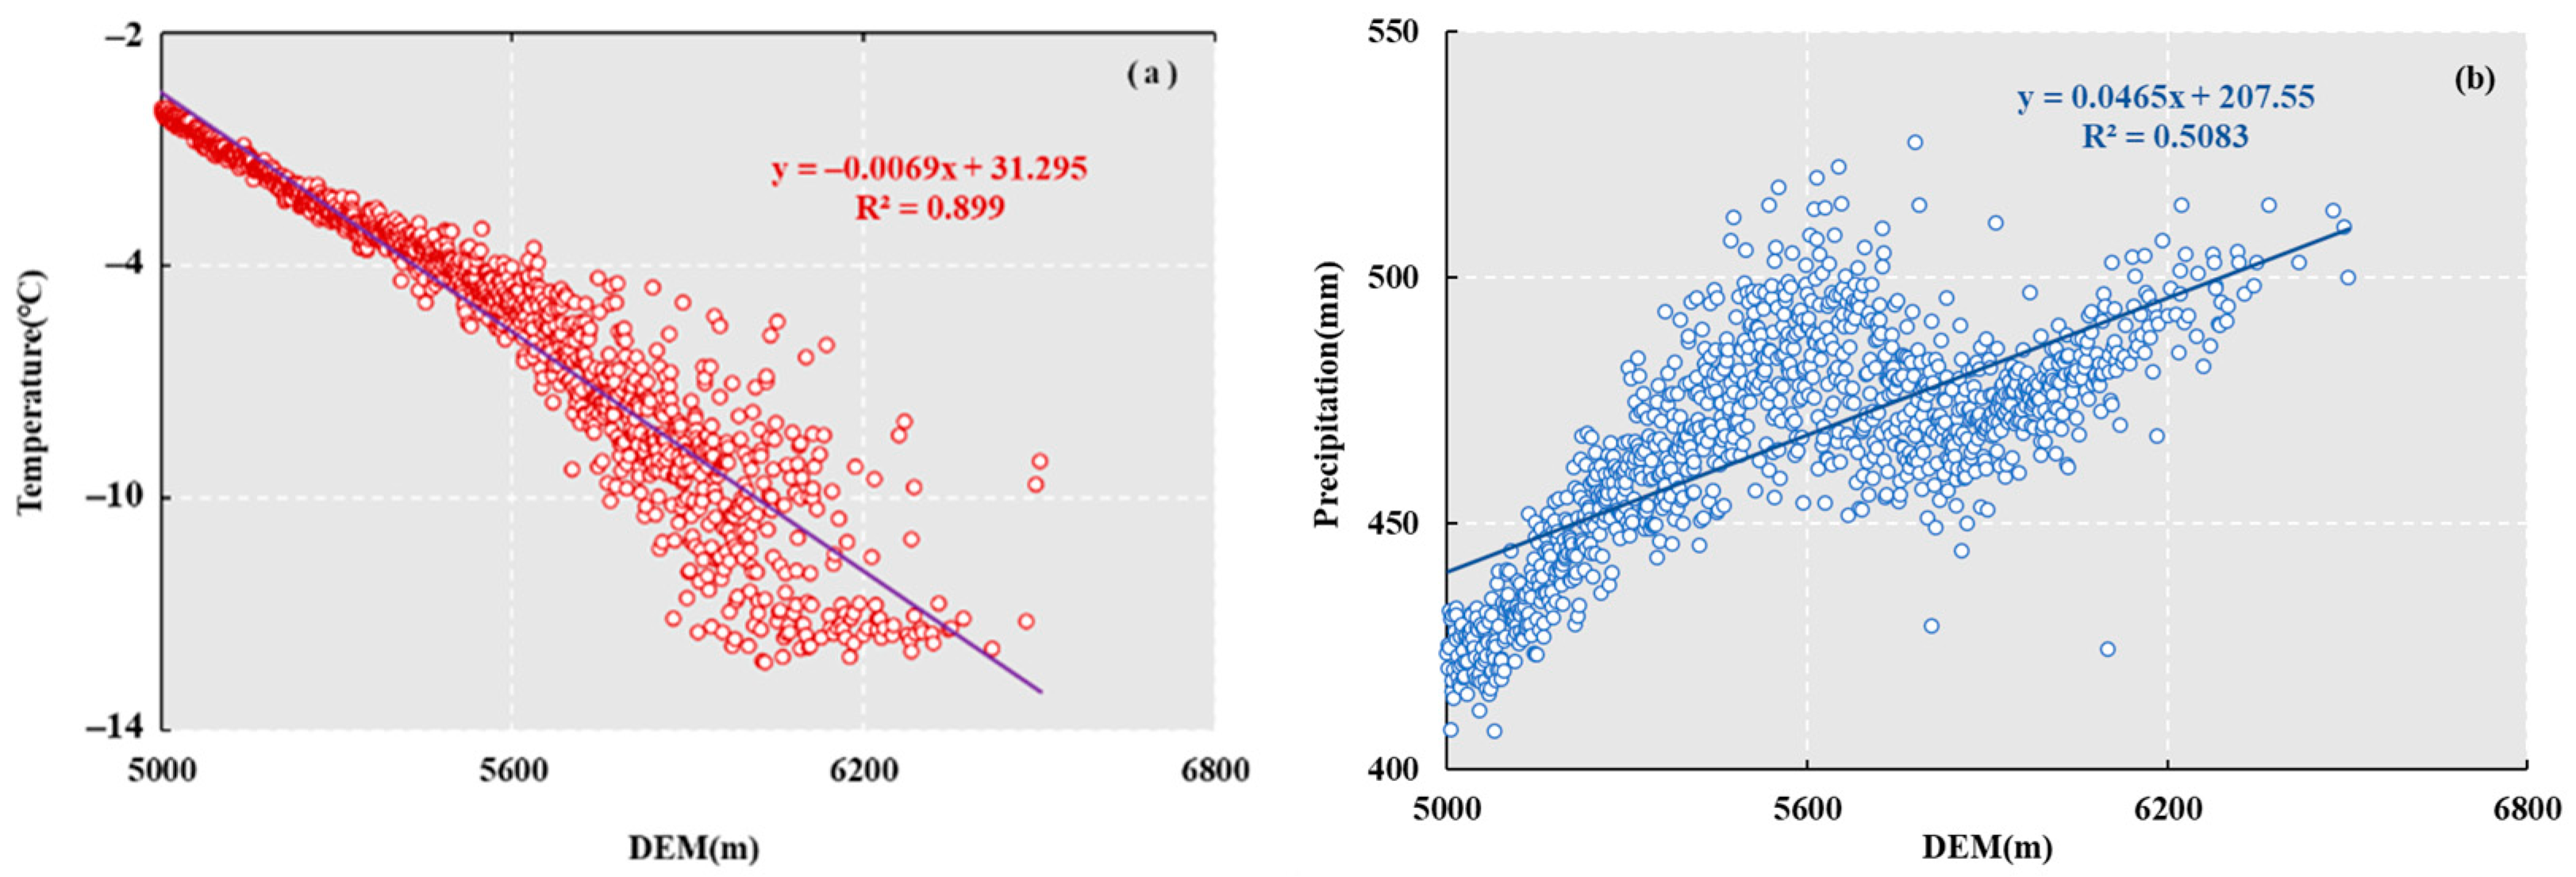
  • The SCA of SRYR has more obvious differences in the distribution at different elevations; the higher the elevation, the larger the SCA, and the SCD showed a significant exponential correlation with the elevation, with R2 reaching 0.87. In the elevation above 5500 m, the SCA can reach a maximum of 61.58%, while in the lower elevations, the SCA is mostly below 20%. The snow accumulation period in SRYR is mainly from September to November each year, while the snow melting period is mainly from June to August.
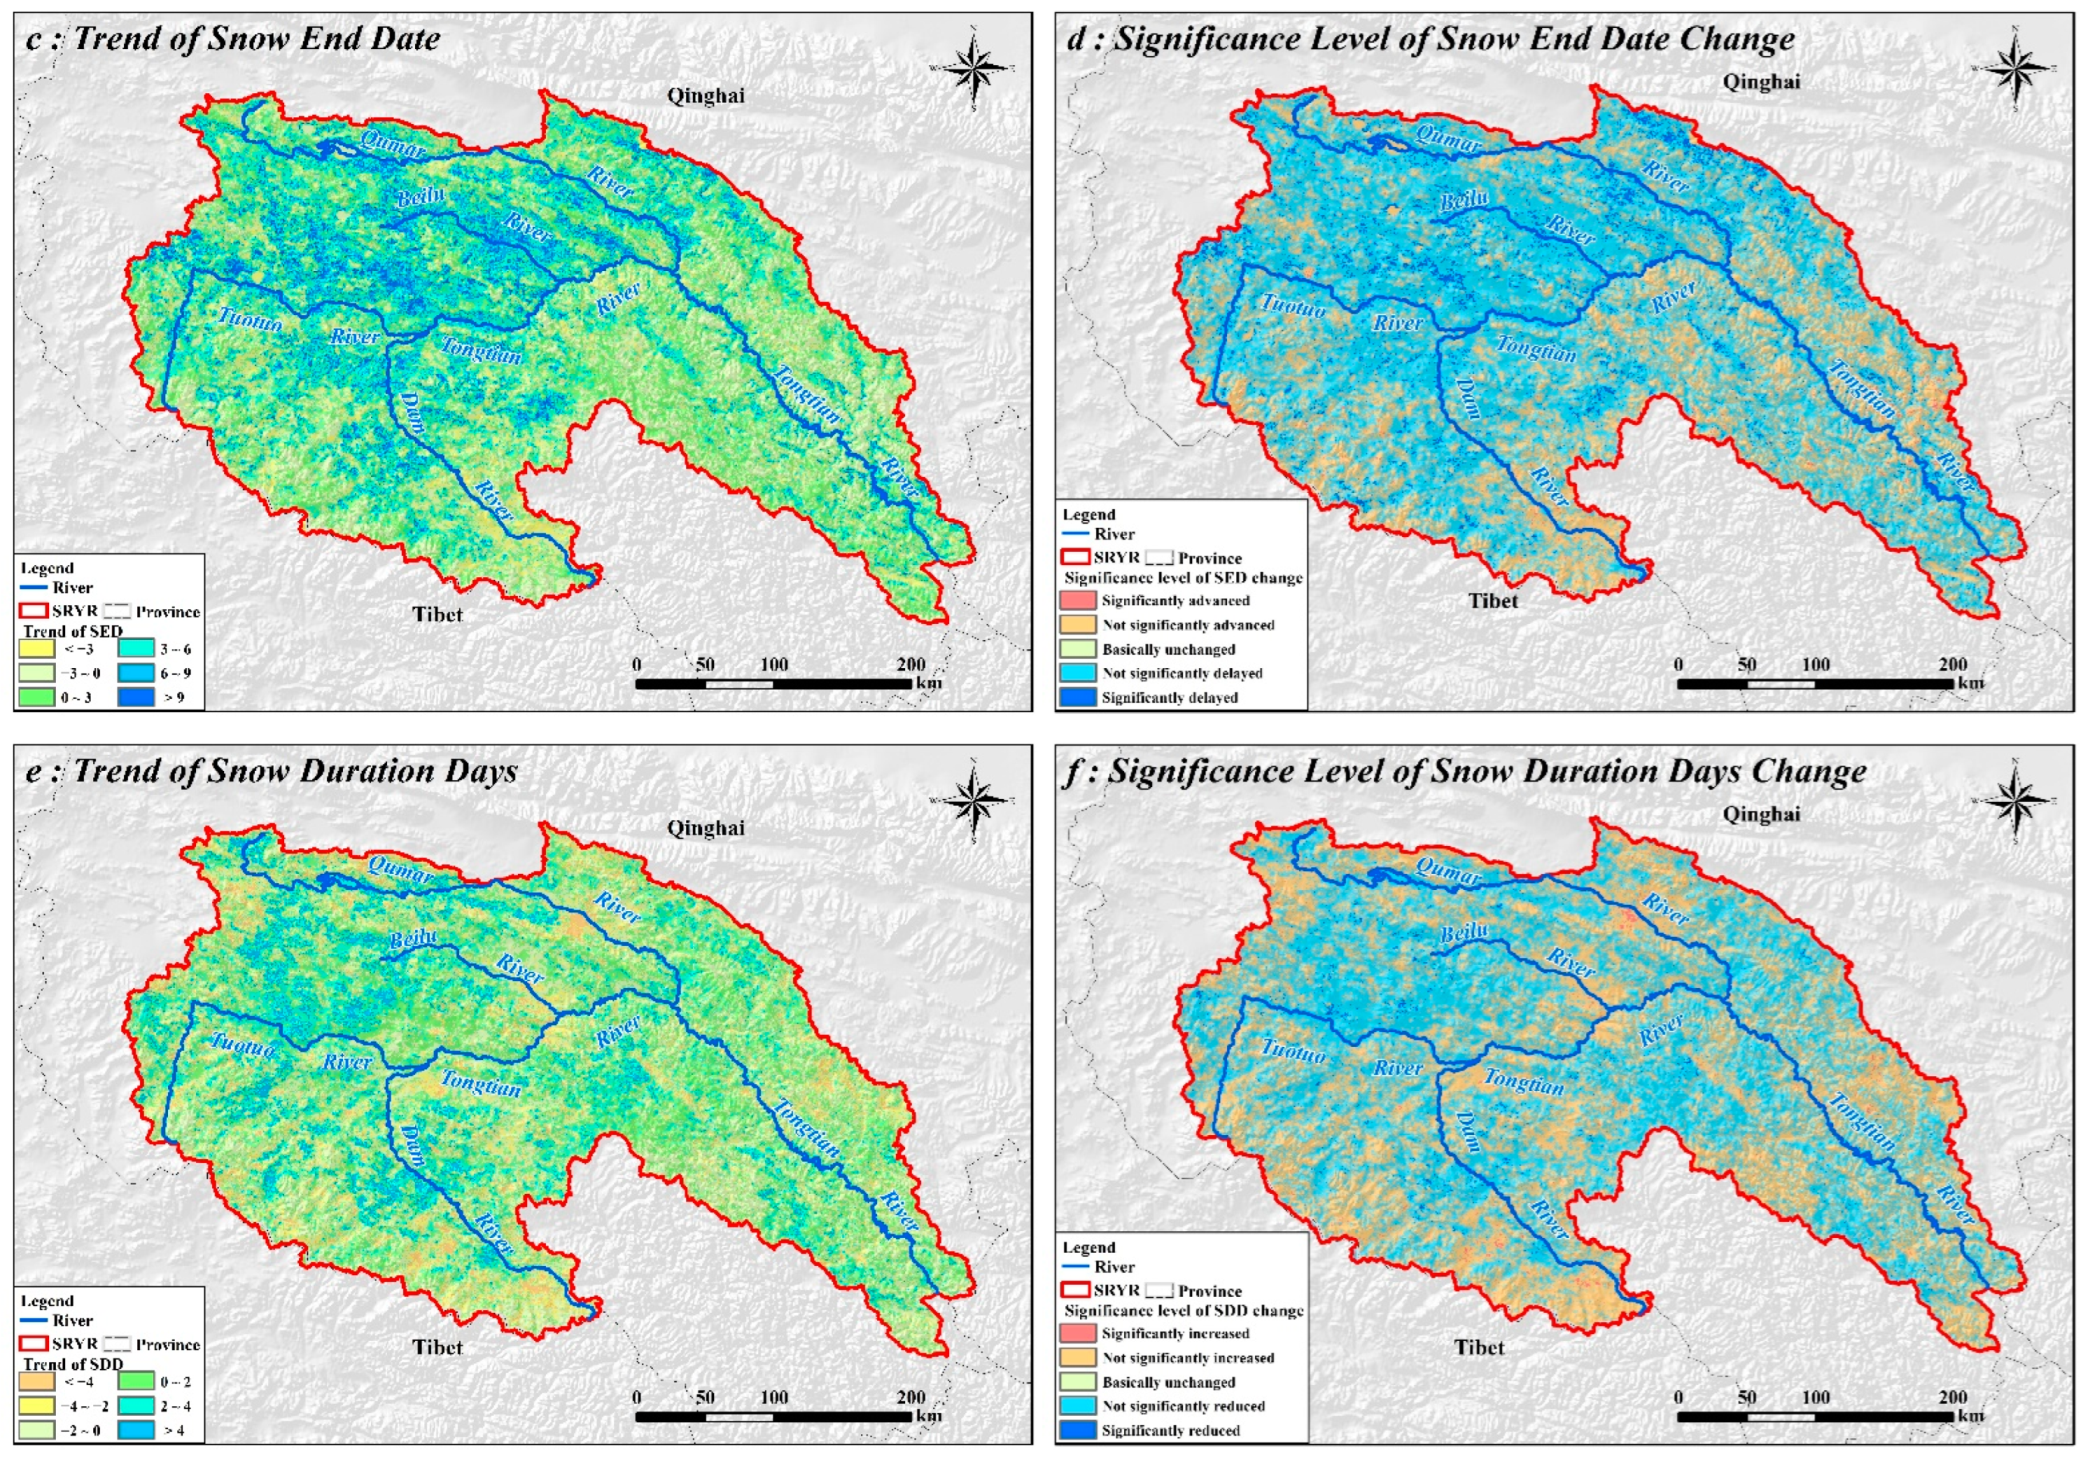
  • Overall, the distribution of snow phenology in SRYR showed an obvious vertical trend. Nearly 63.37% of the areas in SRYR showed an advanced trend in SOD and nearly 69.59% showed a delayed trend in SED, but only 4.29% and 4.36% of the areas showed significant trends in SOD and SED, respectively. This indicates that the snow phenology changes in SRYR showed a non-significant trend. The results also showed that the SOD in the low elevation area mostly showed an advanced trend and the SED showed a delayed trend in the area, while in the high elevation area, the SOD mostly showed a delayed trend and the SED showed an advanced trend.
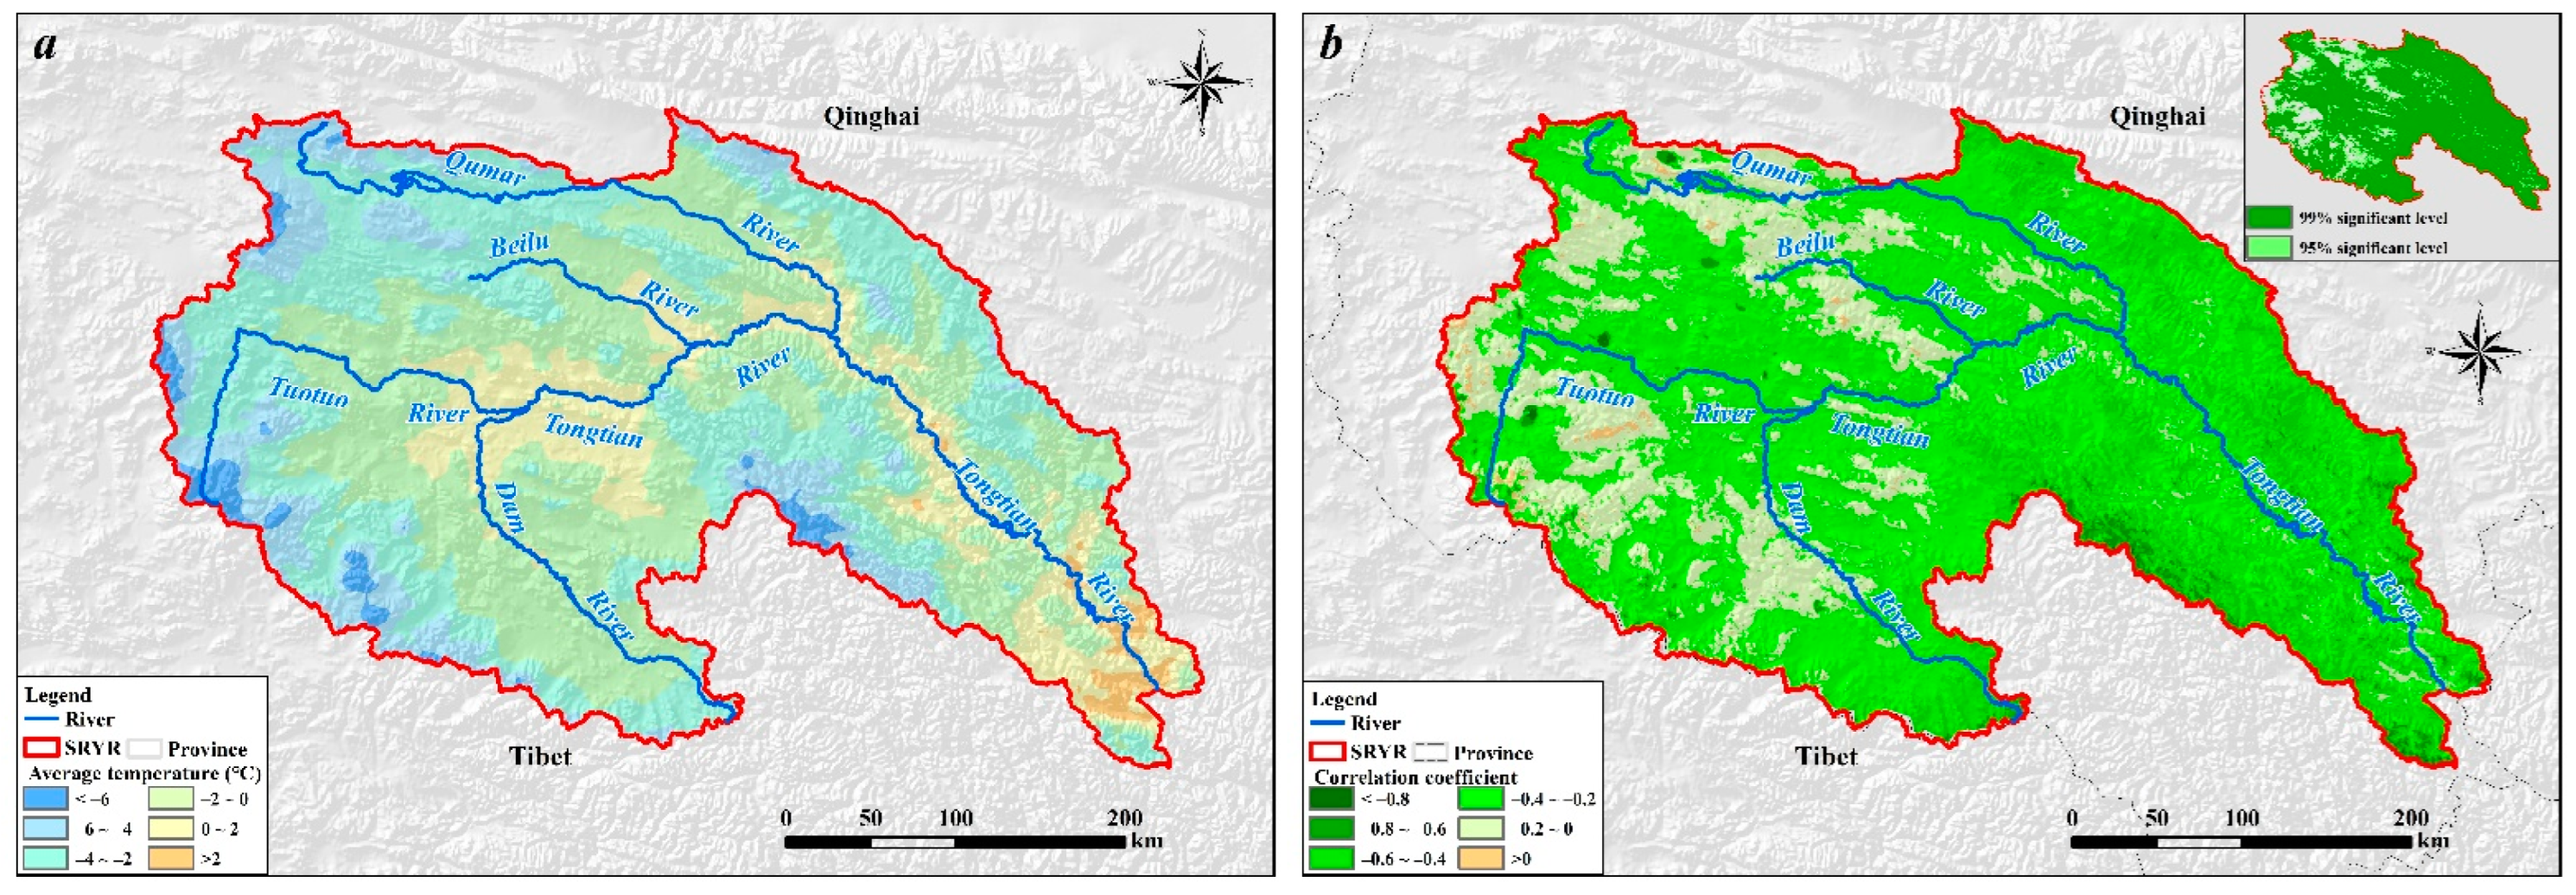
  • The variation of precipitation and temperature is the main reason for the variation of SCA in the SRYR. As the elevation rises, the SCD gradually increases, while the temperature gradually decreases. The temperature of SRYR showed a negative correlation with SCD, and the areas with a more significant negative correlation were about 1.04 × 10⁵ km2, accounting for 90.9% of the total area of SRYR. Precipitation, on the other hand, showed a positive correlation with SCD, with 1.25 × 10⁵ km2 areas showing a significant correlation, standing at 75.3% of the total area of SRYR. The correlation of SCD with both precipitation and temperature decreases significantly with increasing elevation, which may be caused by the influence of the perennial stable snow cover (SCD > 60) at high elevation. In addition, the land cover types under the stable snow area in SRYR are mainly grassland, bare ground, and glacial or permanent snow, where the areas with land cover types of grassland and bare ground are mainly in the southeastern part of SRYR. Although the area with the land cover type of glacier or permanent snow only accounts for 14.81% of the stable snow area, it contains almost all of the glacier or permanent snow in SRYR.

Author Contributions

Conceptualization, Z.Y. and M.S.; Methodology, M.S.; Software, Z.Y.; Validation, X.H., S.L. and M.S.; Formal analysis, Z.Y.; Investigation, M.S.; Resources, M.S.; Data curation, S.L.; Writing—original draft preparation, M.S.; Writing—review and editing, Z.Y.; Visualization, X.H.; Supervision, X.H.; Project administration, Z.Y.; Funding acquisition, Z.Y. and X.H. All authors have read and agreed to the published version of the manuscript.

Funding

This research was funded by National Natural Science Foundation of China, grant number 41890821, 52079008, 51909080; National Public Research Institutes for Basic R&D Operating Expenses Special Project, grant number CKSF2021485/SZ.

Institutional Review Board Statement

Not applicable.

Informed Consent Statement

Informed consent was obtained from all subjects involved in the study.

Data Availability Statement

Not applicable.

Acknowledgments

We give thanks for the product data provided by the National Tibetan Plateau Data Center.

Conflicts of Interest

The authors declare no conflict of interest.

References

  1. Tekeli, A.E.; Sonmez, I.; Erdi, E. Snow-covered area determination based on satellite-derived probabilistic snow cover maps. Arab. J. Geosci. 2016, 9, 198. [Google Scholar] [CrossRef]
  2. Tan, X.J.; Wu, Z.N.; Mu, X.M.; Gao, P.; Zhao, G.J.; Sun, W.Y.; Gu, C.J. Spatiotemporal changes in snow cover over China during 1960–2013. Atmos. Res. 2019, 218, 183–194. [Google Scholar]
  3. Guan, X.; Liu, C.; Bao, Z.; Jin, J.; Wang, G. Spatial-temporal variability of the snow over the Yellow River source region and its influencing climate factors. China Environ. Sci. 2021, 41, 1045–1054. [Google Scholar]
  4. Chen, X.; Yang, Y.; Ma, Y.; Li, H. Distribution and Attribution of Terrestrial Snow Cover Phenology Changes over the Northern Hemisphere during 2001–2020. Remote Sens. 2021, 13, 1843. [Google Scholar] [CrossRef]
  5. Dong, C. Remote sensing, hydrological modeling and in situ observations in snow cover research: A review. J. Hydrol. 2018, 561, 573–583. [Google Scholar] [CrossRef]
  6. Wang, R.; Yao, Z.J.; Liu, Z.F.; Wu, S.S.; Jiang, L.G.; Wang, L. Snow cover variability and snowmelt in a high-altitude ungauged catchment. Hydrol. Process. 2015, 29, 3665–3676. [Google Scholar] [CrossRef]
  7. Yang, J.; Ding, Y.; Fang, Y. Adaptation research of cryosphere change in China: Advances and prospections. Climate Change Res. 2019, 15, 178–186. [Google Scholar]
  8. Jin, X.; Ke, C.; Xu, Y.; Li, X. Spatial and temporal variations of snow cover in the Loess Plateau, China. Int. J. Climatol. 2015, 35, 1721–1731. [Google Scholar] [CrossRef]
  9. Largeron, C.; Dumont, M.; Morin, S.; Boone, A.; Lafaysse, M.; Metref, S.; Cosme, E.; Jonas, T.; Winstral, A.; Margulis, S.A. Toward Snow Cover Estimation in Mountainous Areas Using Modern Data Assimilation Methods: A Review. Front. Earth Sci. 2020, 8, 325. [Google Scholar] [CrossRef]
  10. Yang, J.; Jiang, L.; Shi, J.; Wu, S.; Sun, R.; Yang, H. Monitoring snow cover using Chinese meteorological satellite data over China. Remote Sens. Environ. 2014, 143, 192–203. [Google Scholar] [CrossRef]
  11. Simon, G.; Zacharie, B.D.; César, D.; Florence, M.; Germain, S.; Ignacio, L.J.; Jesús, R.; Timothée, M.; Paul, S.; Olivier, H. Estimating Fractional Snow Cover in Open Terrain from Sentinel-2 Using the Normalized Difference Snow Index. Remote Sens. 2020, 12, 2904. [Google Scholar]
  12. Muhuri, A.; Gascoin, S.; Menzel, L.; Kostadinov, T.S.; Harpold, A.A.; Sanmiguel-Vallelado, A.; Lopez-Moreno, J.I. Performance Assessment of Optical Satellite-Based Operational Snow Cover Monitoring Algorithms in Forested Landscapes. IEEE J. Sel. Top. Appl. Earth Obs. Remote Sens. 2021, 14, 7159–7178. [Google Scholar] [CrossRef]
  13. Huang, Y.; Song, Z.; Yang, H.; Yu, B.; Liu, H.; Che, T.; Chen, J.; Wu, J.; Shu, S.; Peng, X.; et al. Snow cover detection in mid-latitude mountainous and polar regions using nighttime light data. Remote Sens. Environ. 2022, 268, 112766. [Google Scholar] [CrossRef]
  14. She, J.; Zhang, Y.; Li, X.; Feng, X. Spatial and Temporal Characteristics of Snow Cover in the Tizinafu Watershed of the Western Kunlun Mountains. Remote Sens. 2015, 7, 3426–3445. [Google Scholar] [CrossRef] [Green Version]
  15. Tang, Z.; Wang, X.; Wang, J.; Wang, X.; Li, H.; Jiang, Z. Spatiotemporal Variation of Snow Cover in Tianshan Mountains, Central Asia, Based on Cloud-Free MODIS Fractional Snow Cover Product, 2001–2015. Remote Sens. 2017, 9, 1045. [Google Scholar] [CrossRef] [Green Version]
  16. Coll, J.; Li, X. Comprehensive accuracy assessment of MODIS daily snow cover products and gap filling methods. ISPRS J. Photogramm. Remote Sens. 2018, 144, 435–452. [Google Scholar] [CrossRef]
  17. Han, P.; Long, D.; Han, Z.; Du, M.; Dai, L.; Hao, X. Improved understanding of snowmelt runoff from the headwaters of China’s Yangtze River using remotely sensed snow products and hydrological modeling. Remote Sens. Environ. 2020, 224, 44–59. [Google Scholar] [CrossRef]
  18. Zheng, W.; Du, J.; Zhou, X.; Song, M.; Bian, G.; Xie, S.; Feng, X. Vertical distribution of snow cover and its relation to temperature over the Manasi River Basin of Tianshan Mountains, Northwest China. J. Geogr. Sci. 2017, 27, 403–419. [Google Scholar] [CrossRef] [Green Version]
  19. Notarnicola, C. Hotspots of snow cover changes in global mountain regions over 2000–2018. Remote Sens. Environ. 2020, 243, 111781. [Google Scholar] [CrossRef]
  20. Anjum, M.N.; Ding, Y.J.; Shangguan, D.H.; Liu, J.G.; Ahmad, I.; Ijaz, M.W.; Khan, M.I. Quantification of spatial temporal variability of snow cover and hydro-climatic variables based on multi-source remote sensing data in the Swat watershed, Hindukush Mountains, Pakistan. Meteorol. Atmos. Phys. 2019, 131, 467–486. [Google Scholar] [CrossRef]
  21. Luo, Y.; Qin, N.; Wang, C.; Pang, Y.; Wang, S.; Li, J.; Jia, L.; Liu, X. Characteristics of Summer Runoff in the Source Regions of the Yangtze River and the Relationship with Plateau Summer Monsoon and South Asian Summer Monsoon. Resour. Environ. Yangtze Basin 2020, 29, 2209–2218. [Google Scholar]
  22. Jun, Y.; Zhe, Y.; Ting, L. The Spatial-Temporal Variation Characteristics of Natural Vegetation Drought in the Yangtze River Source Region, China. Int. J. Environ. Res. Public Health 2021, 18, 1613. [Google Scholar]
  23. Du, J.; Cai, Y.; Wang, G. Attribution Analysis of Runoff in the Source Region of the Yangtze River. J. China Hydrol. 2021, 41, 73–78. [Google Scholar]
  24. Xiong, F.; Lu, Y.; Liu, H.; Cheng, L.; Wu, X.; Chen, Y.; Wang, D. Review of Aquatic Ecosystem Health Studies in the Headwater Region of the Yangtze River. Environ. Monit. China 2022, 38, 14–26. [Google Scholar]
  25. Hao, X. MODIS Daily Cloud-Free Snow Cover Area Product for Sanjiangyuan from 2000 to 2019; TPDC: Beijing, China, 2019. [Google Scholar] [CrossRef]
  26. Gao, Y.; Hao, X.; He, D.; Huang, G.; Wang, J.; Zhao, H.; Wei, Y.; Shao, D.; Wang, W. Snow cover mapping algorithm in the Tibetan Plateau based on NDSI threshold optimization of different land cover types. J. Glaciol. Geocryol. 2019, 41, 1162–1172. [Google Scholar]
  27. Hao, X.; Luo, S.; Che, T.; Wang, J.; Li, H.; Dai, L.; Huang, X.; Feng, Q. Accuracy assessment of four cloud-free snow cover products over the Qinghai-Tibetan Plateau. Int. J. Digit. Earth 2019, 12, 375–393. [Google Scholar] [CrossRef]
  28. Peng, S. 1-km Monthly Precipitation Dataset for China (1901–2020); TPDC: Beijing, China, 2020. [Google Scholar] [CrossRef]
  29. Peng, S.; Ding, Y.; Wen, Z.; Chen, Y.; Cao, Y.; Ren, J. Spatiotemporal change and trend analysis of potential evapotranspiration over the Loess Plateau of China during 2011–2100. Agric. For. Meteorol 2017, 233, 183–194. [Google Scholar] [CrossRef] [Green Version]
  30. Peng, S.; Gang, C.; Cao, Y.; Chen, Y. Assessment of climate change trends over the Loess Plateau in China from 1901 to 2100. Int. J. Climatol. 2018, 38, 2250–2264. [Google Scholar] [CrossRef]
  31. Peng, S.; Ding, Y.; Liu, W.; Li, Z. 1 km monthly temperature and precipitation dataset for China from 1901 to 2017. Earth Syst. Sci. Data 2019, 11, 1931–1946. [Google Scholar] [CrossRef] [Green Version]
  32. Ding, Y.; Peng, S. Spatiotemporal Trends and Attribution of Drought across China from 1901–2100. Sustainability 2020, 12, 477. [Google Scholar] [CrossRef] [Green Version]
  33. Mao, K. A Combined Terra and Aqua MODIS Land Surface Temperature and Meteorological Station Data Product for China (2003–2017); TPDC: Beijing, China, 2017. [Google Scholar] [CrossRef]
  34. Zhao, B.; Kebiao, M.; Cai, Y.; Shi, J.; Li, Z.; Qin, Z.; Meng, X.; Shen, X.; Guo, Z. A combined Terra and Aqua MODIS land surface temperature and meteorological station data product for China from 2003 to 2017. Earth Syst. Sci. Data 2020, 12, 2555–2577. [Google Scholar] [CrossRef]
  35. Tang, Z.; Deng, G.; Hu, G.; Wang, X.; Jiang, Z.; Sang, G. Spatiotemporal dynamics of snow phenology in the High Mountain Asia and its response to climate change. J. Glaciol. Geocryol. 2021, 43, 1400–1411. [Google Scholar]
  36. Chu, D. Spatiotemporal variability of snow cover on Tibet, China using MODIS remote-sensing data. Int. J. Remote Sens. 2018, 39, 6784–6804. [Google Scholar] [CrossRef]
  37. Wang, N.; Liu, S.; Wu, Q.; Zhao, L.; Li, Z.; Huang, F.; Kang, S.; Zhao, J.; Zhou, J.; Luo, S.; et al. Recent progress in the study of the change of cryosphere in the northern hemisphere and its impacts on climate and environment. China Basic Sci. 2015, 17, 9–14. [Google Scholar]
  38. Bi, Y.; Xie, H.; Huang, C.; Ke, C. Snow Cover Variations and Controlling Factors at Upper Heihe River Basin, Northwestern China. Remote Sens. 2015, 7, 6741–6762. [Google Scholar] [CrossRef] [Green Version]
  39. Jiang, Y.; Du, W.; Chen, J.; Sun, W. Spatiotemporal Variations in Snow Cover and Hydrological Effects in the Upstream Region of the Shule River Catchment, Northwestern China. Remote Sens. 2021, 13, 3212. [Google Scholar] [CrossRef]
  40. You, Q.; Wu, T.; Shen, L.; Pepin, N.; Zhang, L.; Jiang, Z.; Wu, Z.; Kang, S.; AghaKouchak, A. Review of snow cover variation over the Tibetan Plateau and its influence on the broad climate system. Earth Sci. Rev. 2019, 201, 103043. [Google Scholar] [CrossRef]
  41. Huang, X.; Deng, J.; Wang, W.; Feng, Q.; Liang, T. Impact of climate and elevation on snow cover using integrated remote sensing snow products in Tibetan Plateau. Remote Sens. Environ. 2017, 190, 274–288. [Google Scholar] [CrossRef]
  42. Zhang, C.; Mou, N.; Niu, J.; Zhang, L.; Liu, F. Spatio-Temporal Variation Characteristics of Snow Depth and Snow Cover Days over the Tibetan Plateau. Water 2021, 13, 307. [Google Scholar] [CrossRef]
  43. Sahu, R.; Gupta, R.D. Snow cover area analysis and its relation with climate variability in Chandra basin, Western Himalaya, during 2001–2017 using MODIS and ERA5 data. Environ. Monit. Assess. 2020, 192, 489. [Google Scholar] [CrossRef]
  44. Wu, S.; Zhang, X.; Du, J.; Zhou, X.; Tuo, Y.; Li, R.; Duan, Z. The vertical influence of temperature and precipitation on snow cover variability in the Central Tianshan Mountains, Northwest China. Hydrol. Process. 2019, 33, 1686–1697. [Google Scholar] [CrossRef] [Green Version]
  45. Tang, Z.; Wang, J.; Li, H.; Yan, L. Spatiotemporal changes of snow cover over the Tibetan plateau based on cloud-removed moderate resolution imaging spectroradiometer fractional snow cover product from 2001 to 2011. J. Appl. Remote Sens. 2013, 7, 073582. [Google Scholar] [CrossRef]
  46. Li, H.; Wang, J.; Hao, X. Role of blowing snow in snow processes in Qilian Mountainous region. Sci. Cold Arid. Reg. 2014, 6, 124–130. [Google Scholar]
  47. Saydi, M.; Ding, J. Impacts of topographic factors on regional snow cover characteristics. Water Sci. Eng. 2020, 13, 171–180. [Google Scholar] [CrossRef]
Figure 1. Geographical location of the SRYR.
Atmosphere 13 01161 g001
Figure 2. The land cover type map of SRYR.
Atmosphere 13 01161 g002
Figure 3. Vertical distribution of monthly average SCA from 2000–2019.
Atmosphere 13 01161 g003
Figure 4. Intra-annual trends of 19-year mean SCA (2000–2019) in different elevation zones.
Atmosphere 13 01161 g004
Figure 5. Spatial distribution of snow cover phenology: ((a): SCD; (b): SOD; (c): SED; (d): SDD).
Atmosphere 13 01161 g005
Figure 6. Snow phenology variation trend and significance distribution of SRYR.
Atmosphere 13 01161 g006aAtmosphere 13 01161 g006b
Figure 7. Average temperature of SRYR (a) and correlation coefficient between SCD and temperature (b).
Atmosphere 13 01161 g007
Figure 8. Average precipitation of SRYR (a) and correlation coefficient between SCD and precipitation (b).
Atmosphere 13 01161 g008
Figure 9. Correlation between DEM and SCD.
Atmosphere 13 01161 g009
Figure 10. Distribution of temperature (a) and precipitation (b) at different elevation.
Atmosphere 13 01161 g010
Table 1. Land cover types under stable snow cover.
Land Cover TypeThe Percentage of Land Cover Types under Stable Snow Cover AreasThe Area of Land Cover Type under Stable Snow Cover Area (km2)
Grass land43.06%4363.71
Water4.90%490.64
Bare land36.34%3683.19
Glaciers or permanent snow14.81%1504.16
Other0.89%90.12
Publisher’s Note: MDPI stays neutral with regard to jurisdictional claims in published maps and institutional affiliations.

