Article

Study of Absorbing CO2 from Emissions Using a Spray Tower

Merchant Marine College, Shanghai Maritime University, Shanghai 201306, China
*
Author to whom correspondence should be addressed.
Atmosphere 2022, 13(8), 1315; https://doi.org/10.3390/atmos13081315
Submission received: 24 June 2022 / Revised: 16 August 2022 / Accepted: 17 August 2022 / Published: 18 August 2022
(This article belongs to the Special Issue Advances of Materials and Processes in CO2 Capture and Utilization)

Abstract

:
In order to reduce the environmental impact caused by CO2 emissions from ships and achieve the goal of green shipping, a spray tower using NaOH solution for the absorption of CO2 has been established in this paper. Using the characteristics of a 6135G128ZCa marine diesel engine, the CO2 absorption system was designed and mathematical models of CO2 absorption efficiency were developed. The effects of the variation in engine exhaust gas temperature, the concentration of NaOH solution, the exhaust gas velocity, different load conditions, and different nozzle types on the absorption efficiency of CO2 were thoroughly investigated experimentally. Moreover, the mechanism of CO2 absorption was analyzed. The developed model was verified by comparing the test results with the simulation results. The results of the study proved that using NaOH solution to absorb CO2 from ship exhausts could reduce the level of CO2 emissions from ships by more than 20%, which indicates that this technology could be used in the future to reduce the level of CO2 emissions from ships.

1. Introduction

Global interest in the greenhouse effect is continuing to rise [1]. As CO2 is one of the main greenhouse gases, reducing its emissions has become an important goal worldwide. The shipping industry has a significant impact on the environment [2]. Increased attention is being paid to reducing shipping emissions [3,4]. According to statistics, ships have become the second-largest greenhouse gas emission source in the transportation industry [5,6]. According to data from the International Maritime Organization (IMO) research report, the global shipping carbon dioxide emissions reached 833 million tons at the end of 2021, which was a year-on-year increase of 4.9% compared with 794 million tons in 2020. IMO has implemented various emission restrictions on ships that are equipped with washing devices. Regulations MEPC.2529 (68) stipulate that the pH value of washing wastewater excreted by the ship at 4 m out of the water outlet must not be less than 6.5.
In order to reduce CO2 emissions and control global warming, at its 62nd meeting in July 2011, the IMO Marine Environment Protection Committee (MEPC) approved the Energy Efficiency Design (EEDI), the Ship Energy Efficiency Management Plan (SEEMP), and other ship energy efficiency standards. The convention was amended and enforced in 2015, and strict restrictions have been imposed on CO2 emissions caused by ships [7]. These regulations outlined that by 2020, CO2 emissions from ships should be reduced by 20% from the existing levels and by 50% by 2050. Contrary to the Energy Efficiency Design Index (EEDI), which is solely used for new ships, the energy efficiency existing ship index (EEXI) addresses the energy efficiency of existing ships and is set to become formally applicable in 2023. In order to comply with the new IMO environmental regulations, ships may be forced to slow down to reduce carbon emissions. When speed is decreased by 10%, the amount of fuel can be reduced by nearly 30% [8]. Therefore, scholars worldwide are working hard to develop technologies for carbon emissions abatement.
The treatment methods of CO2 emissions are mainly recovery methods, which include the physical method, the chemical method, and the physicochemical method [9,10,11]. The physical separation of CO2 refers to the adsorption of CO2 with absorbent alone, and no changes to the physical properties of CO2 are made [12,13]. The chemical absorption method is the most common and mature capturing method. Compared with the physical absorption method, the most important aspect of the chemical absorption method is that the chemical reaction between CO2 and the absorbent can occur rapidly [14,15,16]. The physical and chemical complementary method is a hybrid CO2 treatment method that makes use of the advantages of the physical method and the chemical method. The most representative method of this type is the membrane absorption method, which uses the osmotic principle of the microporous membrane and mainly depends on the selective absorption of the absorption liquid on the other side of the membrane to realize the separation of CO2 gas. The membrane only enables the isolation of the gas and liquid and does not participate in the chemical reaction [17,18,19].
Lin et al. [20] studied the use of a high-gravity rotating packed bed to absorb CO2, using centrifugal force to increase the contact area of the gas–liquid and enhance its mass transfer. However, it was shown that the stability of the rotating packed bed needs to be improved. Many researchers have studied the use of membrane absorption technology to remove CO2 emissions [21,22,23]. However, because the organic solution is soaked for a long time, the membrane material is wetted, which reduces the absorption efficiency. Therefore, the properties and the chemical stability of the membrane materials need to be further improved [24,25]. The absorption of CO2 using a molecular sieve has been investigated by many scholars [26,27]. In this method, some amine-based substances are adsorbed with a molecular sieve to absorb CO2. The use of the grafted amino group in mesoporous molecular sieves has become a new line of research for the removal of CO2, but most of these studies are still in the initial stages. Buvik et al. [28] analyzed the advantages and disadvantages of different MEA solutions for CO2 absorption, and the technical route for onboard application was studied. Jayakumar et al. [29] used K2CO3 to absorb CO2, and some problems such as a slower reaction speed were reported.
Elto et al. [30] studied the loading of K2CO3 on porous alumina as an adsorbent, which was shown to reduce maritime CO2 emissions by 30%. Wang et al. [31] researched the use of a NaOH solution to absorb CO2 from ships. It is known from the literature that the ship CO2 emission reduction technology is not mature, and the efficiency of this technology is low. In this paper, we mainly studied the use of a NaOH solution to absorb CO2 from ships’ exhaust gas; it was shown that this method, which can reduce the levels of CO2 in ships’ exhaust gas by more than 20%, meets the SEEMP emission index and lays a solid foundation for green sea transportation.
Flagiello et al. [32] experimentally studied the use of a pilot-scale seawater scrubber to treat the SOx emissions from a 4-stroke marine diesel engine and reported that the addition of NaOH reached a water-saving range of 25–33% compared to the use of pure seawater in a De-SOx scrubber.
In this paper and in order to reduce the environmental impact caused by CO2 emissions, a CO2 absorption system was designed based on a 6135G128ZCa marine diesel engine. The mathematical models of CO2 absorption efficiency were developed. Moreover, the effects of the variation in engine exhaust gas temperature, the concentration of NaOH solution, the exhaust gas velocity, different load conditions, and different nozzle types on the absorption efficiency of CO2 were thoroughly investigated experimentally.

2. Mechanism of Decarbonization by Alkali Method

2.1. Mechanism of CO2 Absorption

According to Henry’s law, electrochemical equation, and equilibrium equation before and after CO2 absorption via the NaOH solution, the mechanism of CO2 absorption is mainly the neutralization reaction of NaOH and CO2. During the process of CO2 absorption from ships using a NaOH solution, flue gas containing CO2 enters a decarbonization tower from the bottom and is mixed with NaOH solution from top to bottom. Once the gas is dissolved into the NaOH solution, the electrolysis reaction occurs. During the process of using NaOH solution to absorb the CO2 in the emissions of the ship and when the NaOH solution exchanges energy with CO2, the ionization balance in the solution shall be satisfied in addition to the dynamic mass transfer balance between gas and liquid phases.
CO 2 ( g ) + H 2 O ( l ) H 2 CO 3
H 2 CO 3 H + + HCO 3
HCO 3 H + + CO 3 2
H 2 O H + + OH
The main reaction of CO 2 in an aqueous solution containing OH ions can be expressed as shown in Equations (5) and (6):
CO 2 ( aq ) + OH HCO 3 .  
HCO 3 + OH CO 3 2 + H 2 O .  
The reacted CO2 electrolyzed products and dissolved products rapidly transfer mass to the liquid phase. During this process, the electrolytic products and the dissolved products continuously electrochemically react with the active components in the NaOH solution. The H+ is electrolyzed in the NaOH solution and then neutralized with the NaOH solution. Therefore, the reaction equations of CO2 are shown below:
CO 2 ( aq ) + H 2 O + HCO 3 = HCO 3 + H 2 CO 3 .  
H 2 CO 3 ( aq ) + CO 3 2 HCO 3 + HCO 3
H 2 CO 3 + CO 3 2 CO 3 2 + HCO 3
2 CO 2 ( aq ) + 2 H 2 O + CO 3 2 - = 2 HCO 3 + H 2 CO 3
From the reaction above, it can be seen that Equations (1)–(10) are the results of the reaction between ions in the liquid film, and the reaction is completed instantaneously and is irreversible. The CO2 absorption reaction is shown in Equation (11).
2 NaOH ( l ) + CO 2 ( g ) = Na 2 CO 3 ( l ) + H 2 O ( l )

2.2. The Mathematical Model of CO2 Absorptivity

The absorptivity of CO2 is defined as the ratio of the amount of CO2 absorbed by the spray tower to the amount of CO2 present before the spray tower is utilized. In this study, the absorptivity of the CO2 from the ship was taken as an average value. The CO2 in the ship’s exhaust gas was assumed to be an ideal gas. Based on the thermodynamic theory, the models can be expressed as shown below:
PV = nRT
where P is the gas pressure inside the absorption tower, Pa; V is the volume of gas, m3; R is the ideal gas constant,   R = 8.314 Pa·m3/(mol·K); T is the gas temperature, K; n is the molar number of the exhaust gas:
n = m / M
where m is the mass of the gas, kg and M is the molecular mass, kg/kmol. As a result, the mass of CO2 can be expressed by Equation (14).
m CO 2 = nM CO 2 = PV RT M CO 2

3. Engine CO2 Absorption Test

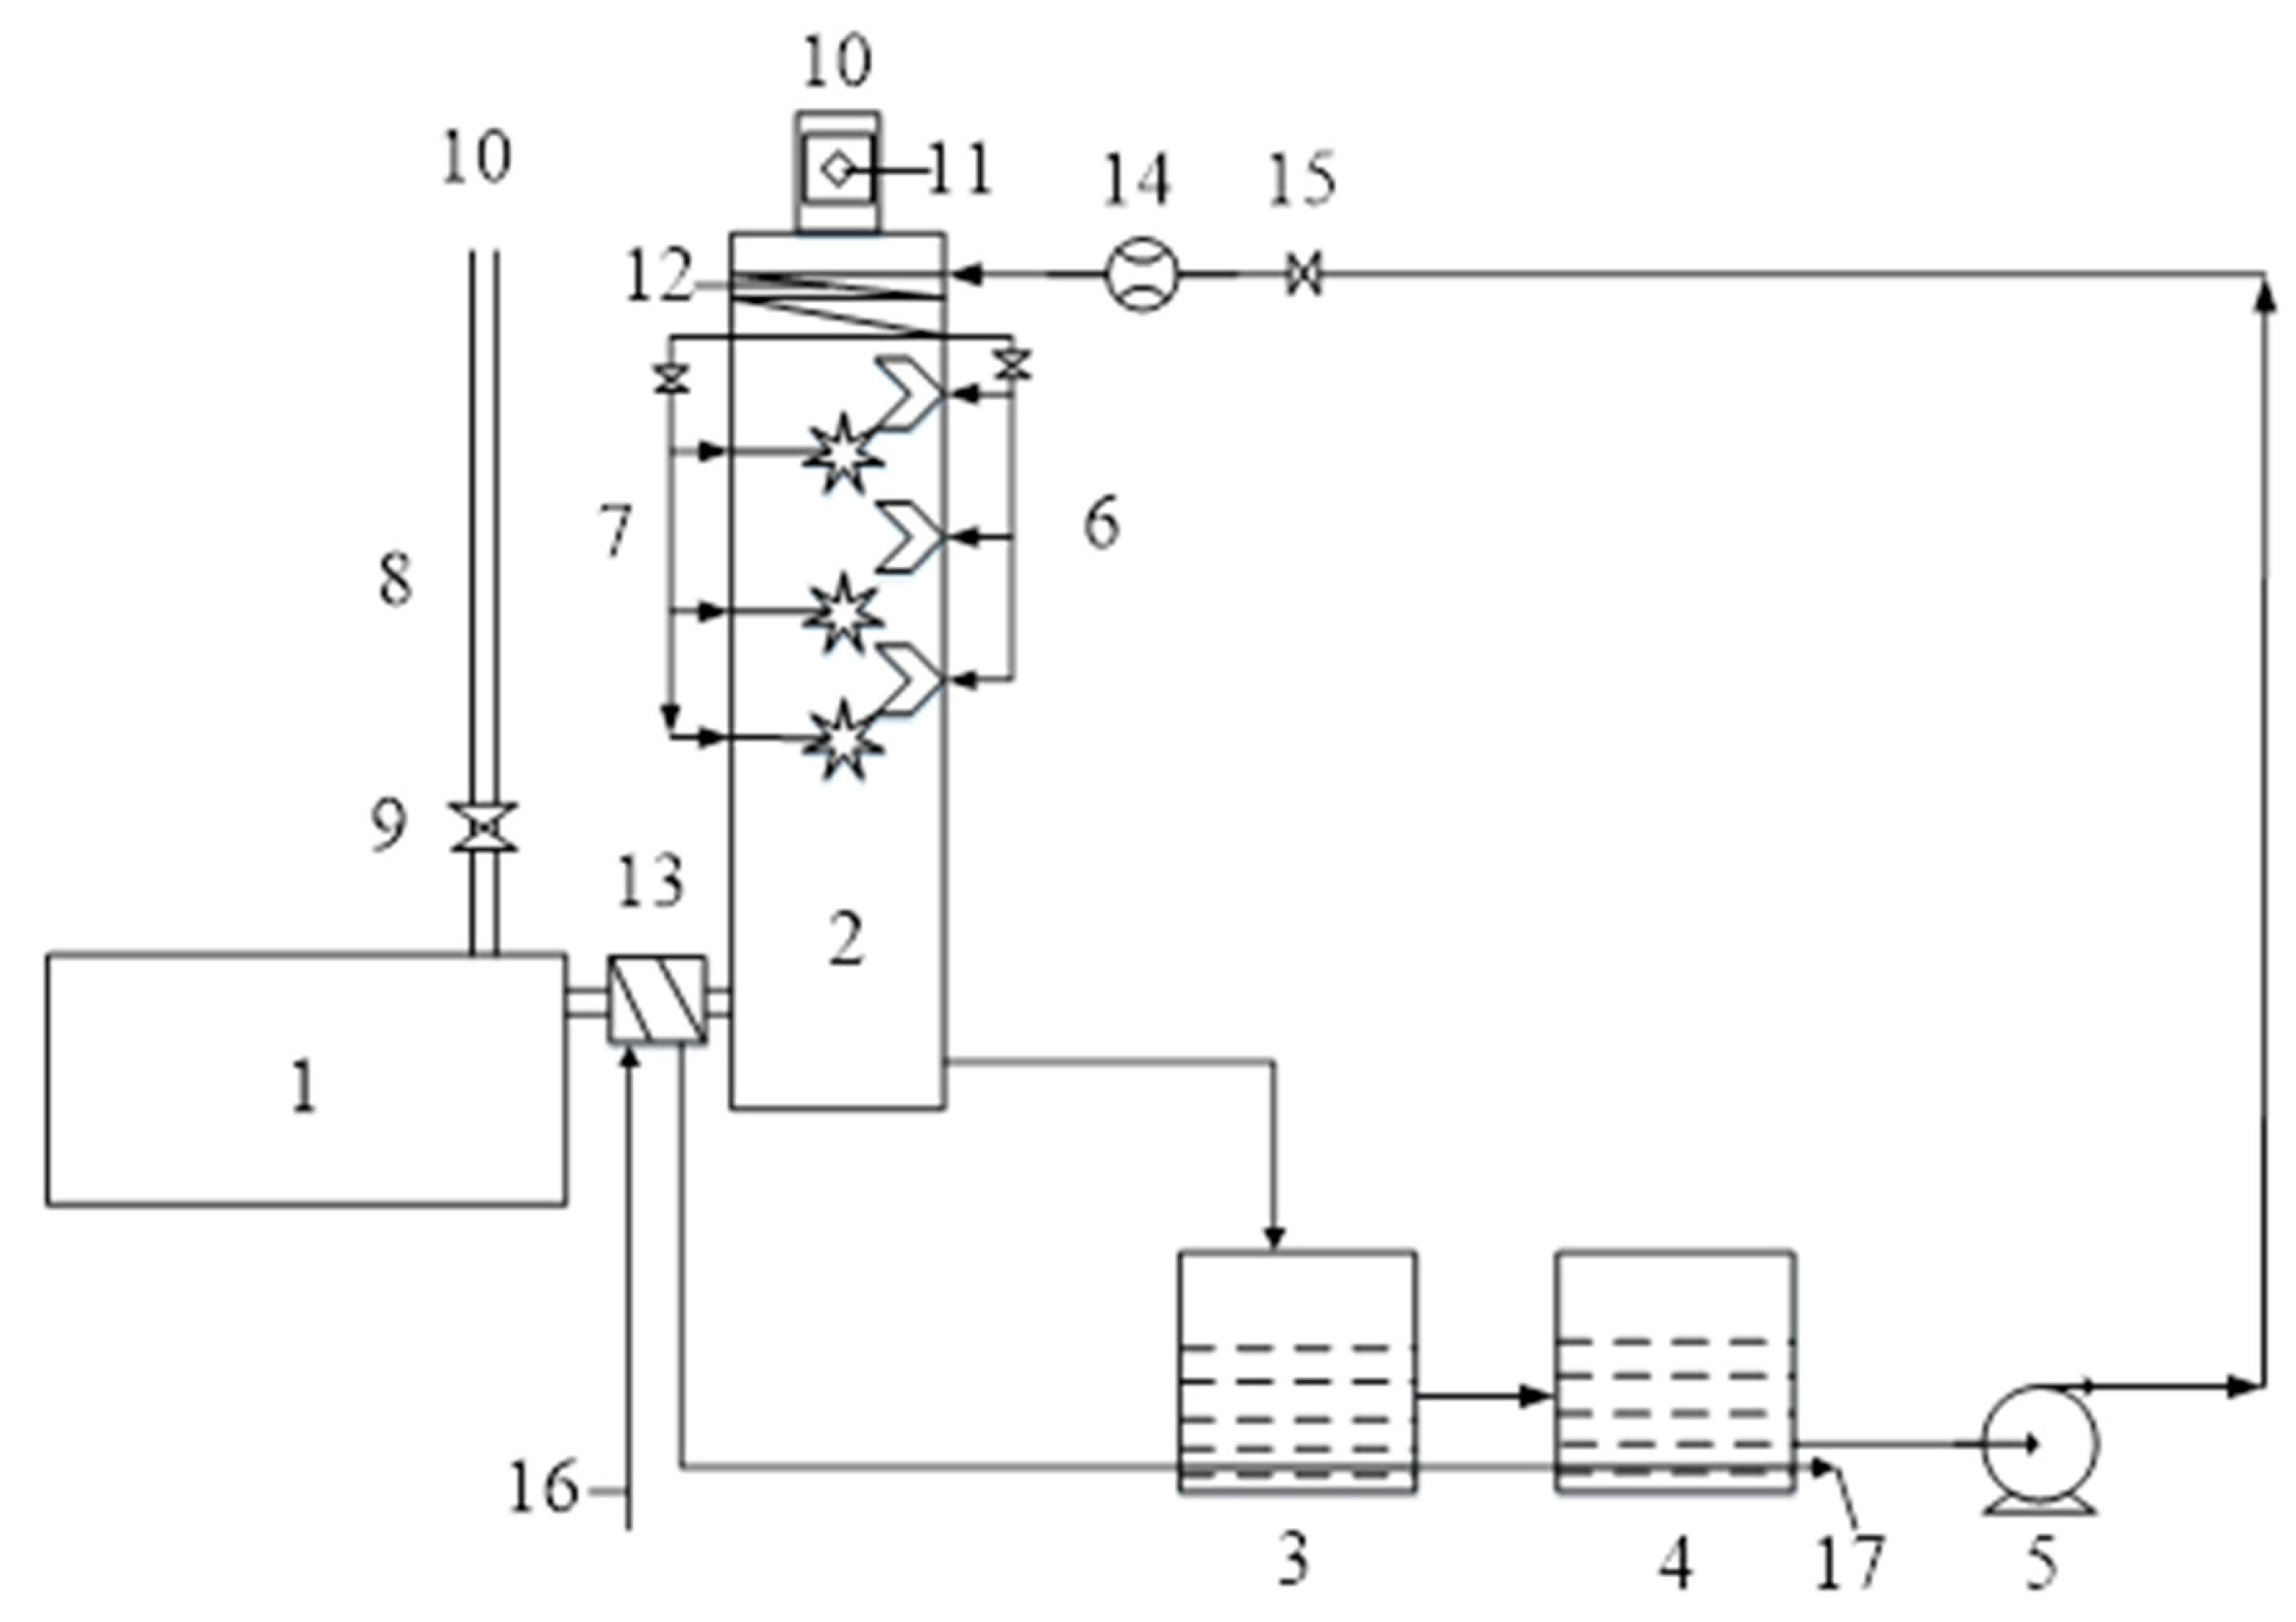
3.1. CO2 absorption Cycle System

In order to investigate the CO2 absorption mechanism, using the characteristics of a 6135G128ZCa engine, an engine CO2 recovery system was designed as shown in Figure 1.
The marine diesel engine (1) operates in accordance with the load characteristic conditions, and the engine exhaust gas enters the exhaust pipe (8) and the spray tower (2). The exhaust pipe (8) is connected directly to the atmosphere. A freshwater cooler (13) is installed in front of the spray tower to cool down the exhaust gas temperature of the diesel engine. The exhaust gas temperature can be adjusted in the range of 25~400 °C. A bypass valve (9) is installed on the exhaust pipe to adjust the backpressure of the diesel engine and to prevent an excessive increase in the back pressure, which would affect the combustion performance. A concentrated NaOH solution is stored in the dosing tank (4) and pumped into the nozzle system (6 or 7) through the pump (5). The NaOH solution enters the demister (12) first to cool and condense the water vapor formed during the decarbonization process before entering the direct nozzles (6) or the spiral nozzle system (7), therefore reducing the volatilization of the NaOH solution. The NaOH solution circulates and flows back to the mixing cabinet (3) along the closed circulation system. The exhaust gas is sampled at point 11 on the exhaust pipe, which is 5 m from the spray tower. The spray tower is made of 316 stainless steels. Three spiral nozzles are installed in upper, middle, and lower positions in the tower center.

3.2. Experiment Equipment and Chemicals

3.2.1. Marine Diesel Engine

The 6135G128ZCa marine diesel engine is often used as the main engine or as the prime mover of the generator on ships. Its parameters are shown in Table 1. The power output was measured using a hydraulic dynamometer with a maximum power capacity of 440 kW, a maximum rotational speed of 5000 rpm, and a maximum torque of 1800 Nm.

3.2.2. Model 6135 Spray Tower

The model 6135 spray tower used in the test was designed and manufactured using the exhaust parameters of the 6135G128ZCa marine diesel engine as shown in Figure 2.
The height and the inner diameter of the 6135-type spray tower are 3000 mm and 400 mm, respectively. The exhaust gas outlet height and the inner diameter of the decarbonizing tower are 100 mm and 125 mm, respectively. The tower body is composed of three sections, the height of each section is 1000 mm, and the exhaust gas is redistributed with wire mesh between each section. The nozzles are distributed into three layers, and the height of each of these layers from the bottom of the decarbonizing tower is 2500 mm, 2000 mm, and 1500 mm. Moreover, the height of the inlet duct is 620 mm and its inner diameter is 125 mm. The liquid outlet is located at the bottom of the tower with an inner diameter of 70 mm. The top of the spray tower is equipped with a demister, which traps water vapor and NaOH. There are three liquid storage tanks with 0.5 m3 volumes for each. These tanks are connected in series and placed at different heights to meet the dosing and circulation requirements.

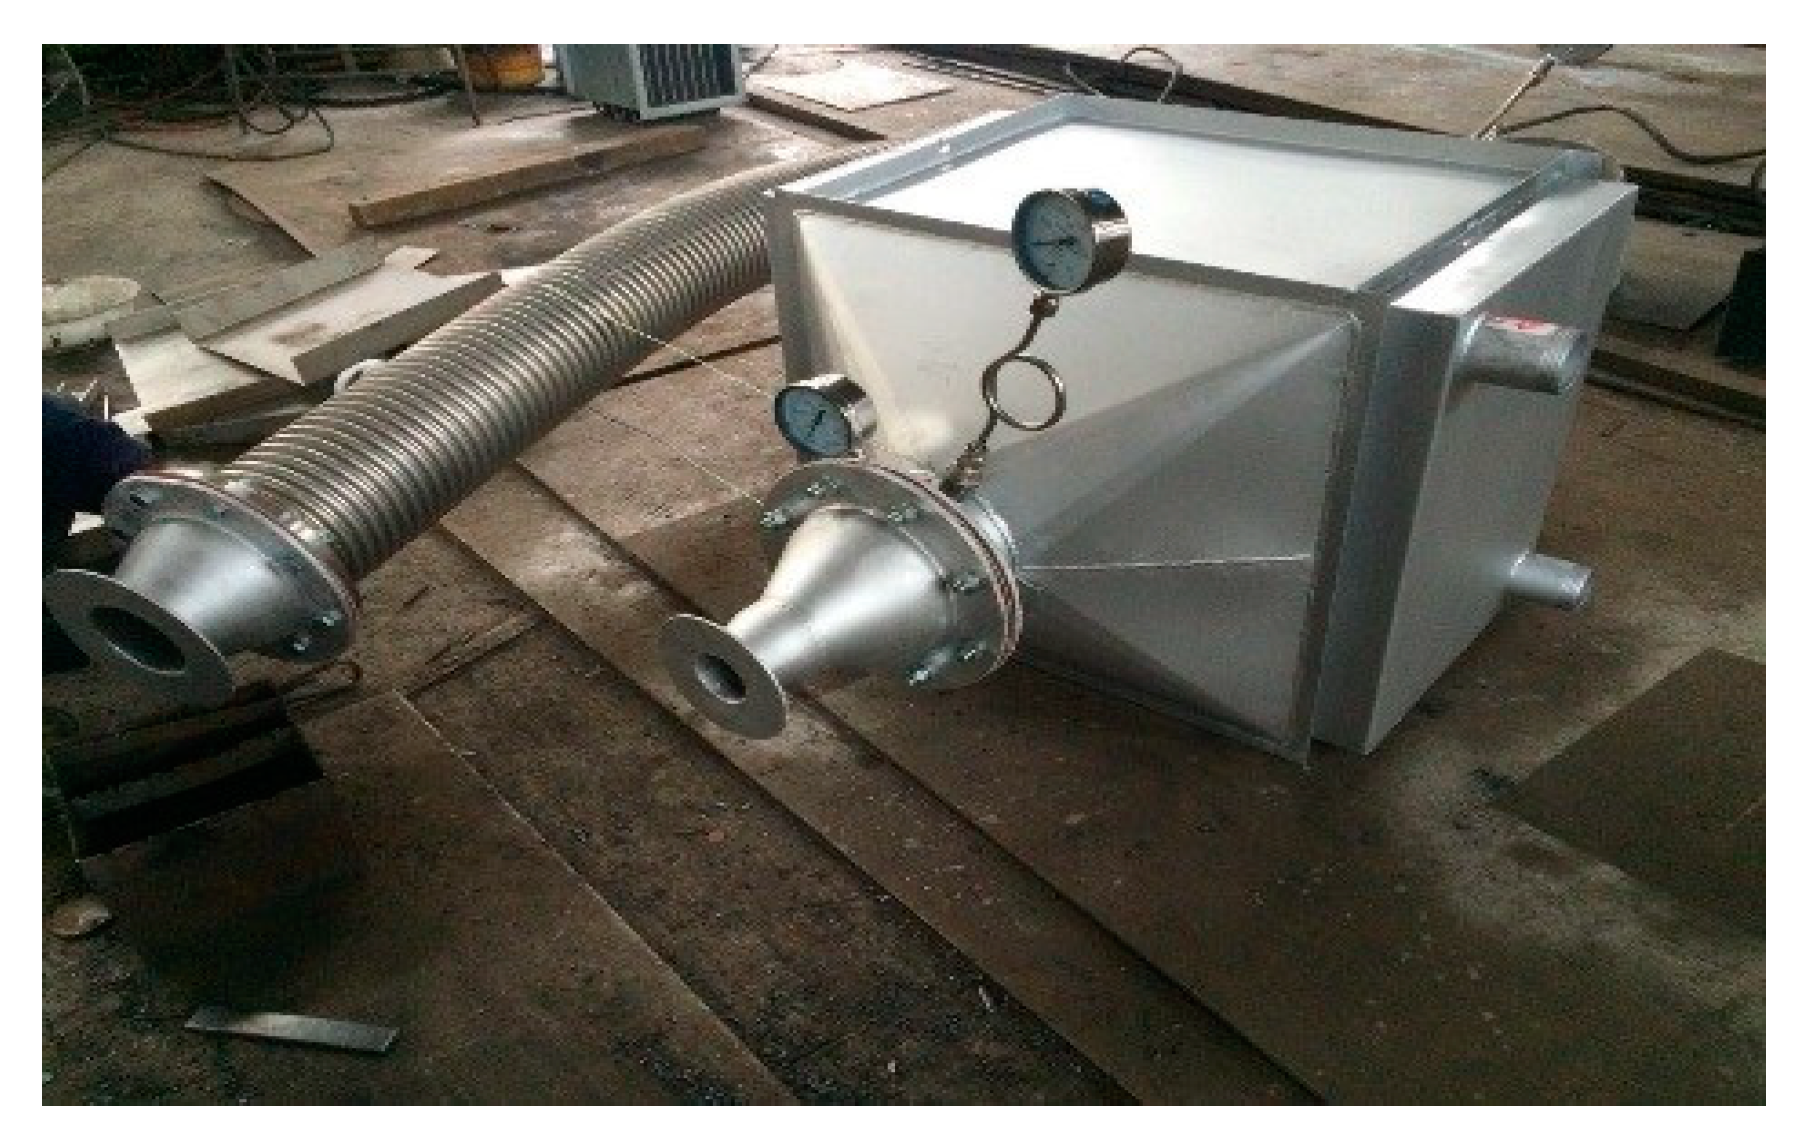
3.2.3. Exhaust Gas Cooler

In order to study the effect of exhaust gas temperature on CO2 absorption efficiency, a freshwater cooler was installed on the engine exhaust pipe as shown in Figure 3.
The exhaust gas cooler was designed in-house and manufactured by an external heat exchanger manufacturer. The cooler is made of carbon steel and aluminum and can control the exhaust gas temperature between 25 °C and 400 °C. Table 2 shows the operational parameters of the exhaust gas cooler.

3.2.4. Engine Fuel Oil and Chemicals Used

Marine gas oil provided by a local fuel supplier was used during the experiment. Its physical and chemical properties are shown in Table 3.
In order to reduce the chemical (NaOH) cost, industrial NaOH was used as a decarburizer during the laboratory experiment. Its physical and chemical properties are shown in Table 4.

3.2.5. Test Equipment

An enhanced Testo 350 analyzer was used for the analysis of the diesel engine exhaust gas. The measuring accuracy is shown in Table 5.

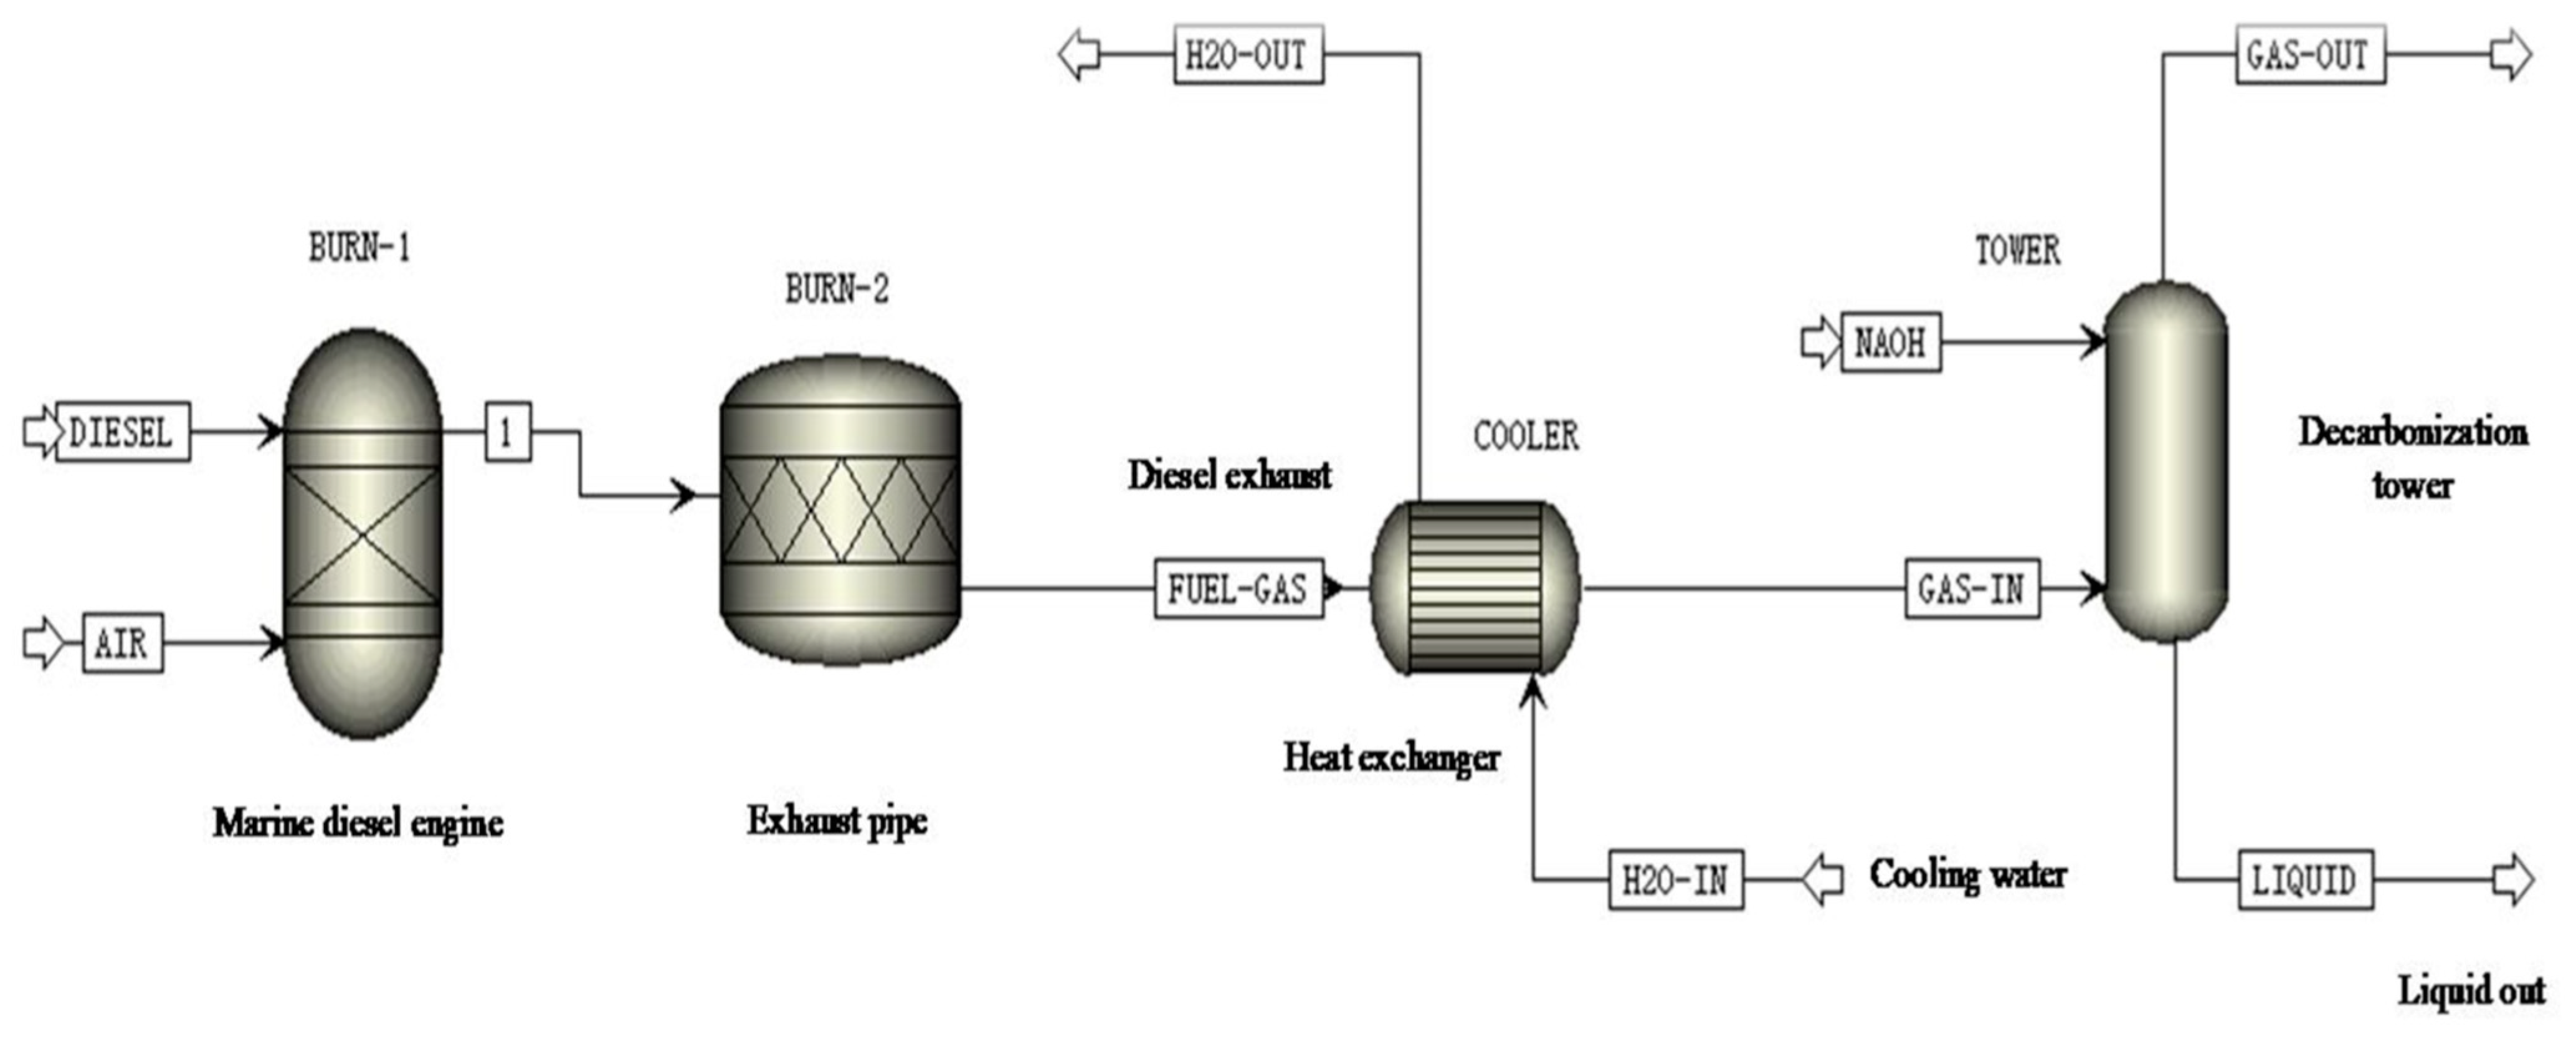
4. Numerical Simulation of Decarburization Process

The absorption of CO2 was carried out by using the NaOH solution to wash the engine exhaust gas. First, the exhaust gas produced by the diesel engine passed through the cooler and then entered the spray tower from the bottom. The exhaust gas mixed and reacted with the NaOH solution in the spray tower and then discharged to the atmosphere through the top of the spray tower. The NaOH solution was discharged from the bottom of the spray tower and entered the tank to cool. After that, CaO was added to the alkaline decarburization solution. Ca(OH)2 was generated immediately after the solid CaO particles reacted with water. NaOH can be regenerated, and therefore the NaOH solution was recycled, while CaCO3 was simultaneously precipitated. After entering the sedimentation tank and the rehydration tank, the NaOH solution was circulated by the pump to the spray tower to be sprayed again. Aspen plus software was used to simulate the process, and the simulation flow chart is shown in Figure 4.
The composition and content of the gas in the simulation were taken from the marine 6135G128ZCa diesel engine exhaust gas. In addition, the exhaust gas flow rate and temperature were selected as the theoretical data of the 100% load of the diesel engine under the propulsion characteristic condition. The exhaust gas composition mainly included N2, O2, NO, NO2, CO, CO2, and SO2. The concentration of the absorbent NaOH solution was 2 mol/L, with a temperature of 25 °C. The parameters of the flue gas and NaOH solution entering the spray tower were set as shown in Table 6.
Figure 5 shows the absorption efficiency of CO2 obtained from the numerical simulation. The absorption efficiency is 20.63%, 21.67%, 23.94%, and 29.15% at 100% load, 75% load, 50% load, and 25% load, respectively. The absorption efficiency of CO2 increases gradually with the decrease of the engine load. This may be because the gas flow velocity is reduced as the engine load decreases. The gas–liquid contact time increases when the diesel engine load is reduced, which increases the mass transfer time and thus improves the absorption efficiency. Furthermore, the exhaust gas temperature decreases with the decrease of the engine load. The decarbonization reaction is a typical acid–base neutralization reaction and exothermic reaction. The low temperature of the exhaust gas aids the absorption reaction in the positive direction. Therefore, the absorption efficiency increases with the decrease in engine load.

5. Test Results and Analysis

The test engine operated according to the load characteristics, the engine operating points, and the theoretical exhaust gas quantity as shown in Table 7.
In the analysis of the decarburization efficiency, it was necessary to carry out a theoretical calculation of the quantity of NaOH needed in the test process. Table 8 displays the quality of NaOH required when the test engine ran at 100%, 75%, 50%, and 25% loads. The quantity of the NaOH used in the test was set according to this calculation.

5.1. Effect of Exhaust Temperature on the CO2 Absorption Rate

The effect of the initial reaction temperature on the absorptivity of pure CO2 [31] was determined in a chemical laboratory. On this basis, a 2 mol/L NaOH solution was used in the experiment. The temperature of the solution was 25 °C and the flow rate of the pump was 4 m3/h. The diesel engine was operated according to the constant speed load condition. Table 9 presents the test data and the absorptivity rate of CO2.
In Table 9, CO2/% is the percentage of CO2 in the exhaust gas; CO2(g/min) is the content of CO2 per unit time in the exhaust gas flow.
Table 9 shows that the absorption rate of CO2 is 13.05% when the exhaust gas temperature of the marine diesel engine is 90.8 °C at 25% engine load. This becomes 12.94% when the exhaust gas temperature is 99.8 °C at 75% engine load. In addition, the absorption rate decreases exponentially to 6.88% at 100% engine load when the gas temperature rises to 114.2 °C. This is because when the temperature is over 100 °C, part of the liquid is vaporized in the spray tower, which decreases the absorption reaction.
In order to investigate the effect of gas temperature on the absorptivity of CO2 when the engine ran at the idle speed, the exhaust gas cooled down to 25 °C, 45 °C, and 65 °C before entering the spray tower. Figure 6 shows the effect of exhaust gas temperature on the CO2 absorption rate.
From Figure 6, the absorptivity of CO2 is at its maximum of 23.92% when the reaction temperature is 25 °C. With the increase in the reaction temperature, the absorptivity rate of CO2 decreases to reach 16.89% at 65 °C. This is because the high temperature is not conducive to the CO2 absorption reaction.

5.2. Effect of the Concentration of NaOH Solution on CO2 Absorptivity

The test was carried out with different concentrations of the NaOH solution, namely 1 mol/L, 2 mol/L, and 8 mol/L. The other conditions remained unchanged and the reaction temperature was controlled at 25 °C. Moreover, the engine operated at the idle speed. The results are shown in Figure 7.
Figure 7 shows that the absorptivity reaches 23.92%, 24.35%, and 21.87% when the concentration of the NaOH solution is 1 mol/L, 2 mol/L, and 8 mol/L, respectively. With the increase of NaOH concentration, the absorption rate of CO2 increases first and then decreases. When the concentration of the NaOH solution increases from 1 mol/L to 2 mol/L, the absorptivity rate increases by 0.43%. In addition, the absorptivity decreases by 2.48% when the concentration of the NaOH solution increases from 2 mol/L to 8 mol/L. The results also shows that when the concentration of the NaOH solution is 2 mol/L, the absorptivity rate is the highest. The main reason for the drop in absorption rate at 8 mol/L is that the viscosity coefficient of the solution at a high concentration is large, which is not conducive to the gas–liquid mixing reaction.

5.3. Effect of Exhaust Gas Velocity on CO2 Absorptivity

The effect of engine exhaust gas velocity on the absorptivity of CO2 is essentially determined by the contact time and the relative concentration between the exhaust gas and the NaOH solution. The results discussed in Section 5.2 show that the absorptivity of CO2 was the highest under the idle speed condition when the concentration of the NaOH solution was 2 mol/L. Therefore, the 2 mol/L concentration of the NaOH solution was used in the experiment with the spiral nozzle. Furthermore, other conditions remained unchanged. Table 10 presents the results.
In Table 10, CO2/% is the percentage of CO2 in the exhaust gas; CO2(g/min) is the content of CO2 per unit time in the exhaust gas flow.
It can be seen from the results in Table 10 that when the diesel engine operates from a high load to a low load according to the constant speed characteristic condition, the flow rate of the exhaust gas decreases continuously from 18.9 m/s at 100% load to 13.8 m/s at 25% load. Under each condition, the exhaust gas velocity before and after the CO2 absorption tower also changes. Specifically, the velocity of the gas after absorption is lower than that before absorption, while the change in the gas pressure difference before and after the absorption is very small, which remains at 0.001 m of water height. This shows that the NaOH solution brought resistance to the gas flow. The resistance is increased by 0.01 kpa and the absorptivity of CO2 increases from 20.84 to 22.48%. When the concentration of the NaOH solution was 2 mol/L, the circulating flow rate of the pump was 4 m3/h for all the loads, which meant the lower the flow rate of the exhaust gas, the higher was the liquid-to-gas ratio and the higher was the absorption rate of CO2. At idle speed, the absorption rate could reach 24.35%.

5.4. CO2 Absorptivity under Engine Different Load Conditions

During this experiment, the 2 mol/L NaOH solution was selected for use in the full engine load testing, and the engine exhaust temperature inside the spray tower was controlled at 25 °C through the cooler. The test results are shown in Figure 8.
Figure 8 shows that the average absorptivity of CO2 could reach 21.74% with the 2 mol/L NaOH solution and an initial temperature of 25 °C under the full load condition. The absorptivity of CO2 is higher when the diesel engine runs at low loads. As the exhaust gas temperature could not be controlled accurately in the experiment, it has little influence on the test results, but the general trend is consistent.

5.5. Comparison of Results Obtained between Experiment and Numerical Simulation

It can be seen from Figure 8 that when the engine ran according to its load characteristics, the CO2 absorptivity of the 6135-type spray tower reached 20.84%, 21.16%, 22.47%, and 22.48% at 100% load, 75% load, 50% load, and 25% load, respectively. In addition, Figure 5 shows that the absorption efficiency of CO2 in the performance simulation was 20.63%, 21.67%, 23.94%, and 29.15% when the load of the diesel engine was 100% load, 75% load, 50% load, and 25% load, respectively. The CO2 absorption efficiency of the 6135G128ZCa diesel engine under different loads was compared with the CO2 absorption efficiency calculated in the performance simulation as shown in Figure 9.
The 6135G128ZCa diesel engine was designed according to standard working conditions; most of these engines run under 100% loads. The input of exhaust gas during the simulation was based on the CO2 generated during the operation of a 6135G128ZCa diesel engine at 100% load. Therefore, at 25% load, there is a certain discrepancy between the experimental results and the simulation results as shown in Figure 9. This is because the 6135G128ZCa diesel engine is driven by a pressure camshaft injector. When running at a low 25% load, the fuel combustion is not sufficient and the CO2 content in the tail gas will be reduced. However, the overall variation trend of the experimental results is consistent with that of the simulation results. The CO2 absorption efficiency in other load ranges shows good consistency and accuracy, which means that the mathematical model established in this paper is accurate.

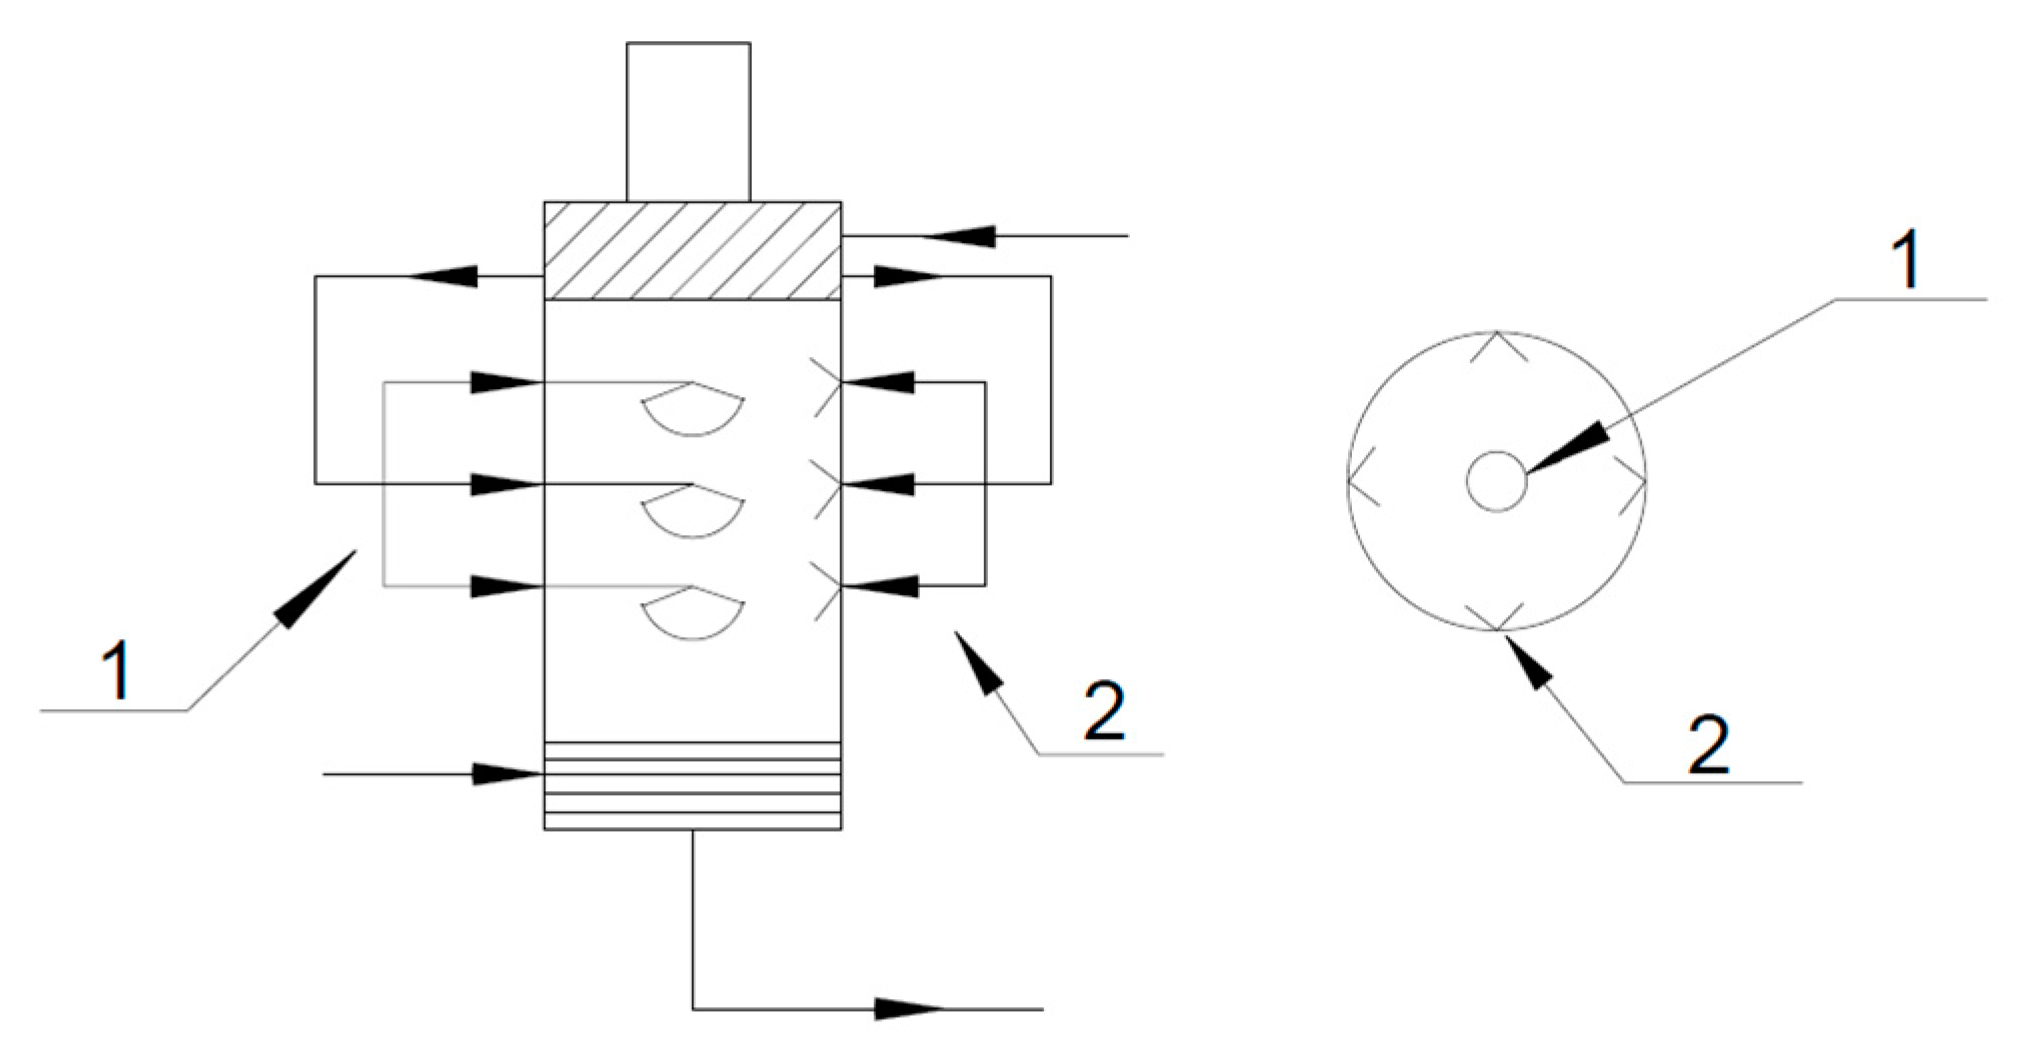
5.6. Effect of Different Nozzle Types on CO2 Absorptivity

The distance between the nozzle layers was set at 500 mm. In order to compare the effects of different nozzle types on CO2 absorption efficiency, two types of nozzles were selected. One is a spiral nozzle with an external thread connection made of 316L stainless steel with an injection angle of 150° and working pressure of 4000 kpa. The other is a direct injection nozzle with an external thread connection made of 316L stainless steel with an injection angle of 90° and working pressure of 4000 kpa. Figure 10 shows the nozzle types and their atomization effect.
The nozzles were installed in three layers inside the spray tower. The spiral nozzles were installed in the center of the spray tower at the upper, middle, and lower parts of it. In addition, four direct injection nozzles were installed on the wall of the tower, as shown in Figure 11.
Additionally, a 2 mol/L NaOH solution concentration was selected for the experiment with the direct nozzle while the other conditions remained unchanged. Table 11 presents the results.
Figure 12 shows the CO2 absorption rate with different types of nozzles. The changing trend in CO2 absorptivity is the same for both types of the nozzle as it decreases slightly with the increased engine load. Moreover, the direct injection nozzle distribution covers a large area, which provides a large gas–liquid contact area. Therefore, a higher CO2 absorption rate is observed when using the direct injection nozzle.

6. Conclusions

In this paper, an alkaline NaOH solution was used to absorb CO2 in a diesel engine exhaust gas system. A novel spray tower and system was established and the Mathematical models were developed. In addition, the experiment was carried out using an engine’s constant speed characteristics, and a numerical simulation was performed based on the test engine’s operational parameters. The experiment and numerical simulation results showed that it is feasible to use a NaOH solution to absorb CO2 from marine engine exhaust gas in order to meet the EEDI stipulated by IMO. The main conclusions are as follows:
(1)
The temperature of the engine exhaust gas is a key factor that affects the absorption efficiency of CO2. With the increase in engine exhaust gas temperature, the absorption rate of CO2 decreased gradually, and the reaction temperature should be controlled at 25 °C using a cooling system.
(2)
The concentration of the NaOH solution affected the absorption efficiency of CO2. The results proved that the most suitable concentration of NaOH solution was 2 mol/L, which is capable of meeting the requirement of reducing the emissions of CO2 by 20%.
(3)
Although the concentration of the NaOH solution had a certain effect on the absorption efficiency of CO2, the absorption efficiency was not directly proportional to the concentration of the NaOH solution. The effect of the concentration of the NaOH solution on the CO2 absorption rate mainly depends on the intrinsic phase equilibrium reaction constant of the NaOH chemical and CO2 itself. Further studies are needed to determine how the reaction coefficients can be increased and how the absorption efficiency can be improved.
(4)
Direct injection nozzles had a better atomization effect on liquid solutions, which provided a large contact area between the gas and the liquid. In addition, the large contact area enhanced the mass transfer between the gas and the liquid.
(5)
The experimental results showed good agreement with those of the numerical simulation. This demonstrates that the theoretically developed models are accurate, which provides a strong theoretical basis for the design of spray towers for engine exhaust gas in the future.
(6)
The newly developed system proved that using NaOH solution to absorb CO2 from ship exhausts could reduce the level of CO2 emissions from ships by more than 20%, which makes it a suitable technology to reduce the level of CO2 emissions from ships in the future. Moreover, by combining the work of this paper with that of Flagiello et al. [32], a simultaneous scrubbing system of SO2 and CO2 can be obtained through dosing the NaOH reagent appropriately following the dosages found in both papers.

Author Contributions

Data curation, X.L. and K.L.; Formal analysis, K.L.; Funding acquisition, Z.W.; Investigation, X.L.; Resources, Z.W.; Software, X.L.; Writing—original draft, X.L.; Writing—review & editing, Z.W. All authors have read and agreed to the published version of the manuscript.

Funding

This research was funded by the Science & Technology Commission of Shanghai Municipality and Shanghai Engineering Research Center of Ship Intelligent Maintenance and Energy Efficiency grant number 20DZ2252300.

Institutional Review Board Statement

Not applicable.

Informed Consent Statement

Not applicable.

Data Availability Statement

Not applicable.

Conflicts of Interest

The authors declare no conflict of interest.

References

  1. Endres, S.; Maes, F.; Hopkins, F.; Houghton, K.; Mårtensson, E.M.; Oeffner, J.; Quack, B.; Singh, P.; Turner, D. A New Perspective at the Ship-Air-Sea-Interface: The Environmental Impacts of Exhaust Gas Scrubber Discharge. Front. Mar. Sci. 2018, 5, 135. [Google Scholar] [CrossRef]
  2. Ros, J.A.; Skylogianni, E.; Doedée, V.; Akker, J.T.V.D.; Vredeveldt, A.W.; Linders, M.J.; Goetheer, E.L.; Monteiro, J.G.M.-S. Advancements in ship-based carbon capture technology on board of LNG-fuelled ships. Int. J. Greenh. Gas Control 2022, 114, 103575. [Google Scholar] [CrossRef]
  3. Turner, D.R.; Hassellöv, I.-M.; Ytreberg, E.; Rutgersson, A. Shipping and the environment: Smokestack emissions, scrubbers and unregulated oceanic consequences. Elem. Sci. Anthr. 2017, 5, 45. [Google Scholar] [CrossRef]
  4. Ytreberg, E.; Åström, S.; Fridell, E. Valuating environmental impacts from ship emissions—The marine perspective. J. Environ. Manag. 2021, 282, 111958. [Google Scholar] [CrossRef]
  5. Flagiello, D.; Di Natale, F.; Lancia, A.; Salo, K. Effect of Seawater Alkalinity on the Performances of a Marine Diesel Engine Desulphurization Scrubber. Chem. Eng. Trans. 2021, 86, 505–510. [Google Scholar]
  6. Ytreberg, E.; Hassellöv, I.M.; Nylund, A.T.; Hedblom, M.; Al-Handal, A.Y.; Wulff, A. Effects of scrubber washwater discharge on microplankton in the Baltic Sea. Mar. Pollut. Bull. 2019, 145, 316–324. [Google Scholar] [CrossRef]
  7. Hassellöv, I.M.; Turner, D.R.; Axel, L. Shipping contributes to ocean acidification. Geophys. Res. Lett. 2013, 40, 2731–2736. [Google Scholar] [CrossRef]
  8. Kalajdžić, M.; Vasilev, M.; Momčilović, N. Power Reduction Considerations for Bulk Carriers with Respect to Novel Energy Efficiency Regulations. Brodogradnja 2022, 73, 279–292. [Google Scholar] [CrossRef]
  9. Rao, A.B.; Rubin, E.S. A technical, economic, and environmental assessment of amine-based CO2 capture technology for power plant greenhouse gas control. Environ. Sci. Technol. 2002, 36, 4467. [Google Scholar] [CrossRef]
  10. Kenarsari, S.D.; Yang, D.; Jiang, G.; Zhang, S.; Wang, J.; Russell, A.G.; Wei, Q.; Fan, M. Review of recent advances in carbon dioxide separation and capture. RSC Adv. 2013, 3, 22739–22773. [Google Scholar] [CrossRef]
  11. Baena-Moreno, F.M.; Rodríguez-Galán, M.; Vega, F.; Alonso-Fariñas, B.; Vilches Arenas, L.F.; Navarrete, B. Carbon capture and utilization technologies: A literature review and recent advances. Energy Sources Part A-Recovery Util. Environ. Eff. 2019, 41, 1403–1433. [Google Scholar] [CrossRef]
  12. Kirli, M.S.; Fahrioglu, M. Sustainable development of Turkey: Deployment of geothermal resources for carbon capture, utilization, and storage. Energy Sources Part A-Recovery Util. Environ. Eff. 2019, 41, 1739–1751. [Google Scholar] [CrossRef]
  13. Zhang, Z.; Feng, X. Optimizaticm of CO2 transmission processes. J. Xi’an Jiaotong Univ. 2005, 39, 274–277. [Google Scholar]
  14. Zhu, X.C.; Chen, C.P.; Wang, Q. Roles for K2CO3 doping on elevated temperature CO2 adsorption of potassium promoted layered double oxides. Chem. Eng. J. 2019, 366, 181–191. [Google Scholar] [CrossRef]
  15. Karadas, F.; Atilhan, M.; Aparicio, S. Review on the Use of Ionic Liquids (ILs) as Alternative Fluids for CO2 Capture and Natural Gas Sweetening. Energy Fuels 2010, 24, 5817–5828. [Google Scholar] [CrossRef]
  16. Wang, Q. Research on CO2 Trapping Technology Based on Ionic Liquid; Beijing University of Chemical Technology: Beijing, China, 2017. [Google Scholar]
  17. He, X.; Hägg, M.B. Hollow fiber carbon membranes: Investigations for CO2 capture. J. Membr. Sci. 2011, 378, 1–9. [Google Scholar] [CrossRef]
  18. Kreulen, H.; Smolders, C.A.; Versteeg, G.F.; van Swaaij, W.P.M. Microporous hollow fiber membrane modules as gas-liquid contactors. Part 1: Physical mass transfer processes. a specific application: Mass transfer in highly viscous liquids. J. Membr. Sci. 1993, 78, 197–216. [Google Scholar] [CrossRef]
  19. Comite, A.; Costa, C.; Demartini, M.; Di Felice, R.; Rotondi, M. Rate of CO2 transfer to loaded MEA solutions using a membrane contactor device. Int. J. Greenh. Gas Control 2016, 52, 378–386. [Google Scholar] [CrossRef]
  20. Lin, C.C.; Chen, B.C. Carbon dioxide absorption in a cross-flow rotating packed bed. Chem. Eng. Res. Des. 2013, 89, 1722–1729. [Google Scholar] [CrossRef]
  21. Dai, Z.; Deng, L. Membrane absorption using the ionic liquid for pre-combustion CO2 capture at elevated pressure and temperature. Int. J. Greenh. Gas Control 2016, 54, 59–69. [Google Scholar] [CrossRef]
  22. Zhang, L.; Qu, R.; Sha, Y.; Wang, X.; Yang, L. Membrane gas absorption for CO2 from flue gas containing fine particles and gaseous contaminants. Int. J. Greenh. Gas Control 2015, 33, 10–17. [Google Scholar] [CrossRef]
  23. Freeman, B.; Hao, P.; Baker, R.; Kniep, J.; Chen, E.; Ding, J.; Zhang, Y.; Rochelle, G.T. Hybrid membrane absorption CO2 capture process. Energy Procedia 2014, 63, 605–613. [Google Scholar] [CrossRef]
  24. Zhang, X.; Liu, X. Preparation and performance of modified molecular sieve for carbon dioxide capture. Chin. J. Environ. Eng. 2015, 9, 4995–4999. (In Chinese) [Google Scholar]
  25. Zhang, X. Preparation of Amine Functional Porous Materials and Adsorption Properties for CO2; Qingdao University of Science & Technology: Qingdao, China, 2015; pp. 51–55. [Google Scholar]
  26. Irani, M.; Gasem, K.; Dutcher, B.; Fan, M. CO2 capture using nanoporous TiO(OH)2/tetraethylenepentamine. Fuel 2016, 183, 601–608. [Google Scholar] [CrossRef]
  27. Cecilia, J.A.; Vilarrasa-García, E.; García-Sancho, C.; Saboya, R.M.A.; Azevedo, D.C.S.; Cavalcante, C.L., Jr.; Rodríguez-Castellón, E. Functionalization of hollow silica microspheres by impregnation or grafted of amine groups for the CO2 capture. Int. J. Greenh. Gas Control 2016, 52, 344–356. [Google Scholar] [CrossRef]
  28. Buvik, V.; Høisæter, K.K.; Vevelstad, S.J.; Knuutila, H.K. A review of degradation and emissions in post-combustion CO2 capture pilot plants. Int. J. Greenh. Gas Control 2021, 106, 103246. [Google Scholar] [CrossRef]
  29. Jayakumar, A.; Gomez, A.; Mahinpey, N. Post-combustion CO2 capture using solid K2CO3: Discovering the carbonation reaction mechanism. Appl. Energy 2016, 179, 531–543. [Google Scholar] [CrossRef]
  30. Erto, A.; Balsamo, M.; Paduano, L.P.; Lancia, A.; Di Natale, F. Utilization of alumina-supported K2CO3 as CO2-selective sorbent: A promising strategy to mitigate the carbon footprint of the maritime sector. J. CO2 Util. 2018, 3, 139–148. [Google Scholar] [CrossRef]
  31. Wang, Z.C.; Zhou, P.L.; Xu, L.P. Experimental study of CO2 absorption by NaOH solution. J. Saf. Environ. 2015, 15, 293–296. [Google Scholar]
  32. Flagiello, D.; Esposito, M.; Di Natale, F.; Salo, K. A Novel Approach to Reduce the Environmental Footprint of Maritime Shipping. J. Mar. Sci. Appl. 2021, 20, 229–247. [Google Scholar] [CrossRef]
Figure 1. System for the recovery of ship’s CO2. 1—6135G128ZCa marine diesel engine; 2—spray tower; 3—mixing tank; 4—dosing tank; 5—dosing pump; 6—direct injection nozzle; 7—spiral nozzle system; 8—exhaust pipe; 9—bypass valve; 10—diesel exhaust out; 11—measurement pointing position; 12—demister; 13—cooler; 14—liquid flow meter; 15—shut-off valve; 16—cooling water inlet; 17—cooling water outlet.
Atmosphere 13 01315 g001
Figure 2. The 6135-type spray tower.
Atmosphere 13 01315 g002
Figure 3. Exhaust gas cooler.
Atmosphere 13 01315 g003
Figure 4. Simulation flow chart of decarburization process.
Atmosphere 13 01315 g004
Figure 5. CO2 absorption rate of the simulation.
Atmosphere 13 01315 g005
Figure 6. Reaction temperature effect on the CO2 absorption rate.
Atmosphere 13 01315 g006
Figure 7. Effect of concentration of NaOH solution on the CO2 absorption rate.
Atmosphere 13 01315 g007
Figure 8. Experimental results at different load conditions.
Atmosphere 13 01315 g008
Figure 9. The CO2 absorption rate of the experiment compared with the simulation.
Atmosphere 13 01315 g009
Figure 10. Types and atomization effect of nozzles. (A)—Spiral nozzle. (B)—Direct nozzle.
Atmosphere 13 01315 g010
Figure 11. Nozzle installation layout. 1—Spiral nozzle system. 2—Direct injection nozzle.
Atmosphere 13 01315 g011
Figure 12. CO2 absorption rate with different types of nozzles.
Atmosphere 13 01315 g012
Table 1. 6135G128ZCa diesel engine parameters.
TermValueTermValue
Cylinder bore/mm135Internal diameter of flange connection of exhaust pipe/mm80/83
Piston stroke/mm140Temperature at 25% rated engine speed/°C327
Compression ratio/number16Temperature at 50% rated engine speed/°C390
Piston swept volume/L12.9Temperature at 75% rated engine speed/°C450
Continuous power/kW
Rotational speed/rpm
146
1500
Temperature at 100% rated engine speed/°C
12-h power Lub. oil consumption rate/g·(kW·h)−1
535
1.65
Exhaust temperature/°C<580
Lubricating oil temperature/°C9512-h power fuel consumption rate/g·(kW·h)−1225.8
Cooling water temperature/°C60/95Starting modeElectric-start
Firing sequence1-5-3-6-2-4Cooling methodWater-cooling
Size/mm1530 × 844 × 1630Weight/kg1300
Table 2. Operation parameters of exhaust gas cooler.
TermValue
Medium NameGas on Shell SideLiquid Inside Tube
Design pressure/Mpa0.22.0
Work pressure/Mpa0.120.5
Design temperature/°C500150
Inlet temperature/°C45030
Outlet temperature/°C4036
Flow rate/(kg/h)19112947
Pressure loss/kPa0.03759.7
Heat exchanged/kW205
Size/mm1500 × 1220 × 740
Weight/kg480
Table 3. Properties of engine fuel oil.
TermQuality IndexMeasured ValueTest Method
Kinematic viscosity (40 °C)/mm2·s−12.0~6.02.962GB/T 265-88(2004)
Density (20 °C)/kg·m−3≤860.0840.3SH/T 0604-2000
Colority/number≤3.0<1.5GB/T5540-86(2004)
Close flash point/°C≥6077.0GB/T 261-2008
Cetane index/number≥4251GB/T1139-89
Mass fraction of sulfur/%≤0.150.00970GB/T1140-2008
Pour point/°C≤0−9GB/T3535-2006
Acidity (mgKOH/100 mL)/mg≤73.65GB/T261-1997(2004)
Oxidation stability (in terms of total insoluble matter)/number≤2.50.5SH/T 0175-2004
Ash (mass fraction)/%≤0.010.002GB/T 508-85(2004)
Moisture (volume fraction)/%≤MarkTransparent, no suspended or deposited moistureVisual observation
Mechanical impuritiesNoneNoneVisual observation
Carbon residue on 10% residual (mass fraction)/%≤0.3<0.10GB/T17144-1997
Abrasion diameter (60 °C)/µm≤460376SH/0765-2005
Note: implementation standard is Q/SH PRD0573-2014.
Table 4. Properties of NaOH.
NaOH Solid (Flake)
Clarity TestQualifiedAL/%≦0.002
Total nitrogen (N)/%≦0.001K/%≦0.05
Chloride (Cl)/%≦0.005Ca/%≦0.01
Sulfate (SOX)/%≦0.005Fe/%≦0.001
Phosphate (POX)/%≦0.001Carbonate (calculated by Na2CO3)/%≦1.5
Heavy metal (calculated by Pb)/%≦0.003Content (NaOH)/%≦96
Table 5. Testo 350 gas analyzer.
TermT/°CO2/%CO/10−6CO2/%NO/10−6NO2/10−6SO2/10−6
Accuracy±1±0.8±5% (200~2000)
±10% (>2000)
10 (≤199)
±0.3 (≤25)
±0.5 (>25)
±5% (≥100)
±5 (<99)
±5% (≥100)
±5 (<99.9)
±5% (≥100)
±5 (<99)
Resolution0.10.0110.01 (≤25)
0.1 (>25)
10.11
Table 6. Parameters of flue gas and NaOH solution entering the spray tower.
FLUE GASNaOH-IN
T/°C53525
P/kPa104.3500
Flow rate3414.574/(m3/h)4/(m3/h)
Component mole%NaOH 3.536
H2O 96.464
N281.9958
O210.6
NO0.0964
NO22.97
CO0.0066
CO24.3
SO20.0312
Table 7. Diesel engine load characteristics of 6135G128ZCa.
Operating PointSpeed
n = 1500/(r/min)
Fuel Consumption Rate/(g/(kW·h))Power/kWTorque/(N·m)
1100% load225.8162.01031.40
275% load227.0121.5773.55
350% load236.081.0515.70
425% load252.040.5257.85
Table 8. Quantity of NaOH required in the experiment.
Load/n = 1500 (r/min)Theoretical Exhaust/(m3/h)CO2/(kg/h)NaOH/(kg/h)
100%3414.57100.29182.41
75%2814.0583.93152.65
50%1950.4558.19105.84
25%1040.7331.0256.42
Table 9. Experimental data at n = 1500 rpm.
LoadLocationFlue Gas Flow Rate/(m/s)Flue Gas Temperature/°CCO2 Content/(g/min)The Amount of CO2 Absorbed/(g/min)Absorptivity/%
100%Before 18.9114.22105.89144.806.88
After 16.160.01961.09
75%Before 18.699.81796.08232.4212.94
After 16.053.31563.67
50%Before 16.5129.21163.9286.417.42
After 14.053.31077.51
25%Before 13.890.8687.0589.6513.05
After12.050.0597.40
Table 10. Effect of exhaust gas velocity on CO2 absorption rate (spiral nozzle).
LoadPositionv/(m/s)CO2/%vΔ (m/s)CO2 (g/min)Absorptivity/%
100%Before18.97.192.82008.0320.84
After16.16.561589.61
75%Before18.66.022.61659.4621.16
After16.05.441308.28
50%Before16.54.582.51124.7722.47
After14.04.13871.98
25%Before13.82.851.8586.1522.48
After12.02.52454.38
Table 11. Effect of exhaust gas velocity on CO2 absorption rate (direct nozzle).
LoadPositionv/(m/s)CO2/%vΔ (m/s)CO2 (g/min)Absorptivity/%
100%Before18.97.192.82008.0323.68
After16.16.331532.56
75%Before18.66.022.61659.46 26.39
After16.05.441221.58
50%Before16.54.582.51124.7726.61
After14.04.13825.45
25%Before13.82.851.8586.1527.09
After12.02.52427.33
Publisher’s Note: MDPI stays neutral with regard to jurisdictional claims in published maps and institutional affiliations.

