Article

Revealing the Effects of Water Imbibition on Gas Production in a Coalbed Matrix Using Affected Pore Pressure and Permeability

1
School of Petroleum Engineering, China University of Petroleum, Qingdao 266580, China
2
Guizhou Panjiang Coalbed Methane Development and Utilization Company Limited, Guiyang 550081, China
3
College of Resources and Environmental Engineering, Guizhou University, Guiyang 550025, China
4
State Key Laboratory of Public Big Data, Guizhou University, Guiyang 550025, China
*
Authors to whom correspondence should be addressed.
Atmosphere 2022, 13(8), 1314; https://doi.org/10.3390/atmos13081314
Submission received: 6 July 2022 / Revised: 7 August 2022 / Accepted: 12 August 2022 / Published: 18 August 2022
(This article belongs to the Special Issue CO2 Sequestration, Capture and Utilization)

Abstract

:
The effect of water imbibition on characteristics of coalbed methane reservoirs, such as permeability, gas occurrence state, and gas production, is controversial. According to the mechanism of imbibition, gas and water distribution in blind pores is reconfigured during the fracturing process. Therefore, a new comprehensive model of pore pressure and permeability, based on the perfect gas equation and the weighted superposition of viscous flow and Knudsen diffusion, was established for micro- and nanoscale blind pores during water drainage. Using the numerical simulation module in the Harmony software, the effects of imbibition on coal pore pressure, permeability, and gas production were analyzed. The results showed that (1) water imbibition can increase pore pressure and reduce permeability, and (2) water imbibition is not always deleterious to gas production and estimated ultimate reserve (EUR), when the imbibition is constant, the thicker water film is deleterious to coalbed methane wells; when the thickness of water film is constant, more imbibition is beneficial to gas production and EUR. This research is beneficial to optimize the operation of well shut-ins after fracturing and provides methods for optimizing key parameters of gas reservoirs and insights into understanding the production mechanism of coalbed methane wells.

1. Introduction

The production and ultimate reserve of coalbed methane wells are affected by the imbibed fracturing fluid during the fracturing process [1], particularly the gas outflow from micro- and nanoscale pores in the coal matrix. The reason for this phenomenon is because micro- and nanoscale pores are dominant in coal [2,3]; they are an essential storage space to maintain gas production in the middle and later periods [4], and the affected space to generate high capillary pressure when encountering water.
The detailed process of the effect of fracturing fluid on coalbed methane production can be expressed by the interaction of gas and water. During the fracturing process, a portion of fracturing fluid can be imbibed into numerous micro- and nanoscale pores during the crack propagation [5]; thus, the wellbore, fractures, and pore entrances connected to the fractures are filled with fracturing fluid [6,7], and the adsorbed gas in the affected area will be promoted to desorb into free gas, owing to the stronger adsorption capacity between water and coal minerals [8]. Finally, free gas in through pores might be displaced out of the pores [9], and free gas in blind pores may be compressed gradually due to the high imbibition pressure [6]. During the drainage process, imbibed water in through pores cannot be discharged only by formation compression [10]; imbibed water blocking the entrances of blind pores hinders gas output, which can be discharged by rock compression and elastic expansion of gas [10,11]. However, water cannot be completely drained. A film of water attaches to the inner surface of the rock and restricts the efficiency of the gas flow [12,13]. Additionally, the production arrangement of imbibed water and inner gas in micro- and nanoscale pores affects the flow efficiency in wellbores and fractures. If the gas production rate is too low, the water retained in the wellbore cannot be removed effectively, which results in liquid loading [14,15]. However, if the gas production rate is too high, the conductivity of artificial fractures decreases rapidly and then generates several stress-sensitive damaged areas where gas production efficiency will be prematurely limited [16]. However, the effect of fracturing fluid on coalbed methane reservoirs is controversial because fracturing fluid imbibition has positive and negative effects on coalbed methane reservoirs [17].
Negative effects of water imbibition on coal rock, such as the reduction of permeability, fracture conductivity, and hardness, occur due to micro-cosmic physical and chemical reactions between rock and water. Firstly, matrix permeability is reduced owing to water blocks and clay swelling. Water in small pores cannot be discharged due to capillary pressure and ion osmotic pressure [5], while swelling and movement of clay can reduce the effective seepage area in micro- and nanoscale pores [18]. Bazin et al. [19] conducted experiments in which water sensitivity was responsible for the large permeability reductions in tight gas reservoirs. Chakraborty et al. [20] reported that in experiments, the effective permeability of core plugs decreased by up to 99.5% of the initial permeability, owing to water blocks and clay swelling. Zhang et al. [21] compared the detrimental effects of working fluids during the drilling process on permeability. Tian et al. [22] analyzed the effect of water phase trapping on gas flow in micro media through a visualized micromodel and found that snap-off and circumfluous flow are the two major mechanisms that interrupt the bulk gas flow and generate trapped gas. Secondly, fracture permeability and conductivity are also reduced by water imbibition because fluid can reduce rock hardness [23]; therefore, proppants are easily embedded into the coal matrix, resulting in the reduction of the fracture width and causing permeability damage [24]. Zhou et al. [7] showed that water imbibition reduces the hardness and causes fracture conductivity damage in various shale formation samples because hydration weakens the jointing strength between mineral particles and further destroys the original shale structure. Scholars [25,26] have found that the degrees of reduction in the hardness levels are related to factors such as mineral composition [27], temperature, fluid type, and water saturation. Imbibition is intensified by the creeping behaviors of micro-fractures caused by clay swelling [2]; however, there is uncertainty regarding whether intensified imbibition further decreases fracture conductivity. Moreover, a water film is retained on the organic and inorganic pore walls [13] after water drainage, because of the adsorption forces between coal minerals and water molecules, including van der Waals forces, electrostatic forces, hydrogen bonds, and structural forces [28,29,30,31]. The water film retained on the pore walls decreases the seepage area for gas flow [13], thereby reducing gas phase permeability. Third, moisture in the porous system increases after water imbibition, which can affect gas diffusion and bulk flow; in other words, a single-phase gas flow with a low moisture degree is transformed into a two-phase flow, which is detrimental to gas production [32].
However, water imbibition sometimes benefits unconventional methane production. Statistics show that in some coalbed methane fields, water retention in reservoirs is proportional to gas production [33,34], which illustrates that water imbibition can be both detrimental or beneficial to reservoir performance. Firstly, methane occurrence is influenced by water imbibition in the affected area [35]. Previous findings for the competitive adsorption of water and methane molecules have verified that the adsorption capacity of a coal surface is stronger for water than for methane [8,36,37]. Hu et al. [9] studied the competitive adsorption of water and methane to analyze the law of imbibition effect on the shale methane occurrence state and confirmed that water can promote the desorption of adsorbed gas. Furthermore, the original free gas and increased free desorption gas are compressed by deep-going imbibition water in several blind pores, owing to the high imbibition pressures [5,6,10]. Secondly, clay swelling can either block the seepage channels (as aforementioned) or induce microfractures to improve the physical properties of coal, such as pore volume and permeability, by allowing greater interaction between imbibition water and coal and causing further dissipation of water blockage in some cases [38,39,40]. Gupta et al. [34] conducted laboratory tests and found that the imbibition of water induces massive stress (as high as 17 psi), and increases the porosity of studied samples by up to 0.94 percent. Xu et al. [17] found that in a sample from the Horn River Basin, water imbibition enhanced pore volume by up to 0.8 vol.% of the initial bulk volume. Bai et al. [23] found that immersing shale in fracturing fluid decreased the elasticity modulus and Poisson’s ratio by 85% and 54%, respectively; thus, many microcracks were induced within the shale.
In general, studies have mainly conducted qualitative analyses of the effect of imbibition on either coal permeability or porosity or the occurrence of adsorbed gas, while ignoring the comprehensive effect of imbibition on pore pressure and coalbed methane production, owing to the complex mechanism of imbibition impaction. This study focuses on micro- and nanoscale blind pores and establishes pore gas pressure and permeability models for imbibed water drainage. Using a numerical simulation module in the Harmony software, the effects of imbibition on coal pore pressure, permeability, and coalbed methane well production were analyzed. Overall, this research provides insight into the production mechanism of coalbed methane wells.

2. Effect of Fracturing Fluid on Pore System in Reservoir Matrix

2.1. Blind Pores Are Dominant in the Coal Matrix

The cursory ratio of through pores and blind pores in coal can be estimated by low field nuclear magnetic resonance (LF-NMR). The experimental device is shown in Figure 1, it consists of six parts: ① liquid injection system; ② LF-NMR; ③ manual pump of confining pressure; ④ computer; ⑤ and ⑥: imaging and sample processing system. The procedures are: (1) The dried coal sample is saturated with water (pH = 7, the experimental liquid was fluid with a 2 wt. % of KCl), and then it is tested with LF-NMR; (2) the saturated sample is displaced by gas driving with constant confining pressure and increased driving pressures, and then the displaced sample is tested with LF-NMR; (3) the displaced sample is then rotated with HC-3018R centrifuge to strip the movable water, to obtain the sample with residual water, the rotation speed is 8000 rpm, the duration is 3 h, and then the displaced sample is tested with LF-NMR. The principles of the method are: (1) the porosity of the through pore can be obtained through the T2 spectrum comparison of the saturated sample and the displaced sample, the reason is that both the through pore and blind pore can suck water into the sample test of water saturation, and only water in through pores can be displaced during the gas driving test, the higher the displacing pressure, the more through pores; (2) the effective porosity can be obtained through the T2 spectrum comparison of the saturated sample and the sample with residual water, the difference between the effective porosity and the porosity of the through pore is the porosity of the blind pore, the reason is that the stripped water by centrifuge comes from the effective through and blind pores. The experimental results are shown in Table 1.
The coal samples belong to bituminous coal with medium and high metamorphic degrees, the vitrinite reflectance is 0.75%, the average value of fixed carbon is wt. 61%, and the average value of ash property is wt. 19%. The porosities of through pores under the displacing pressure of 4 MPa can be obtained in Table 1; they are, respectively, 48.34 vol.%, 40.43 vol.%, 49.97 vol.%. Although the water in through pores cannot be displaced completely by the displacing pressure of 4 MPa, it shows that blind pores are dominant in the coal matrix.

2.2. Effect of Fracturing Fluid on Pores System
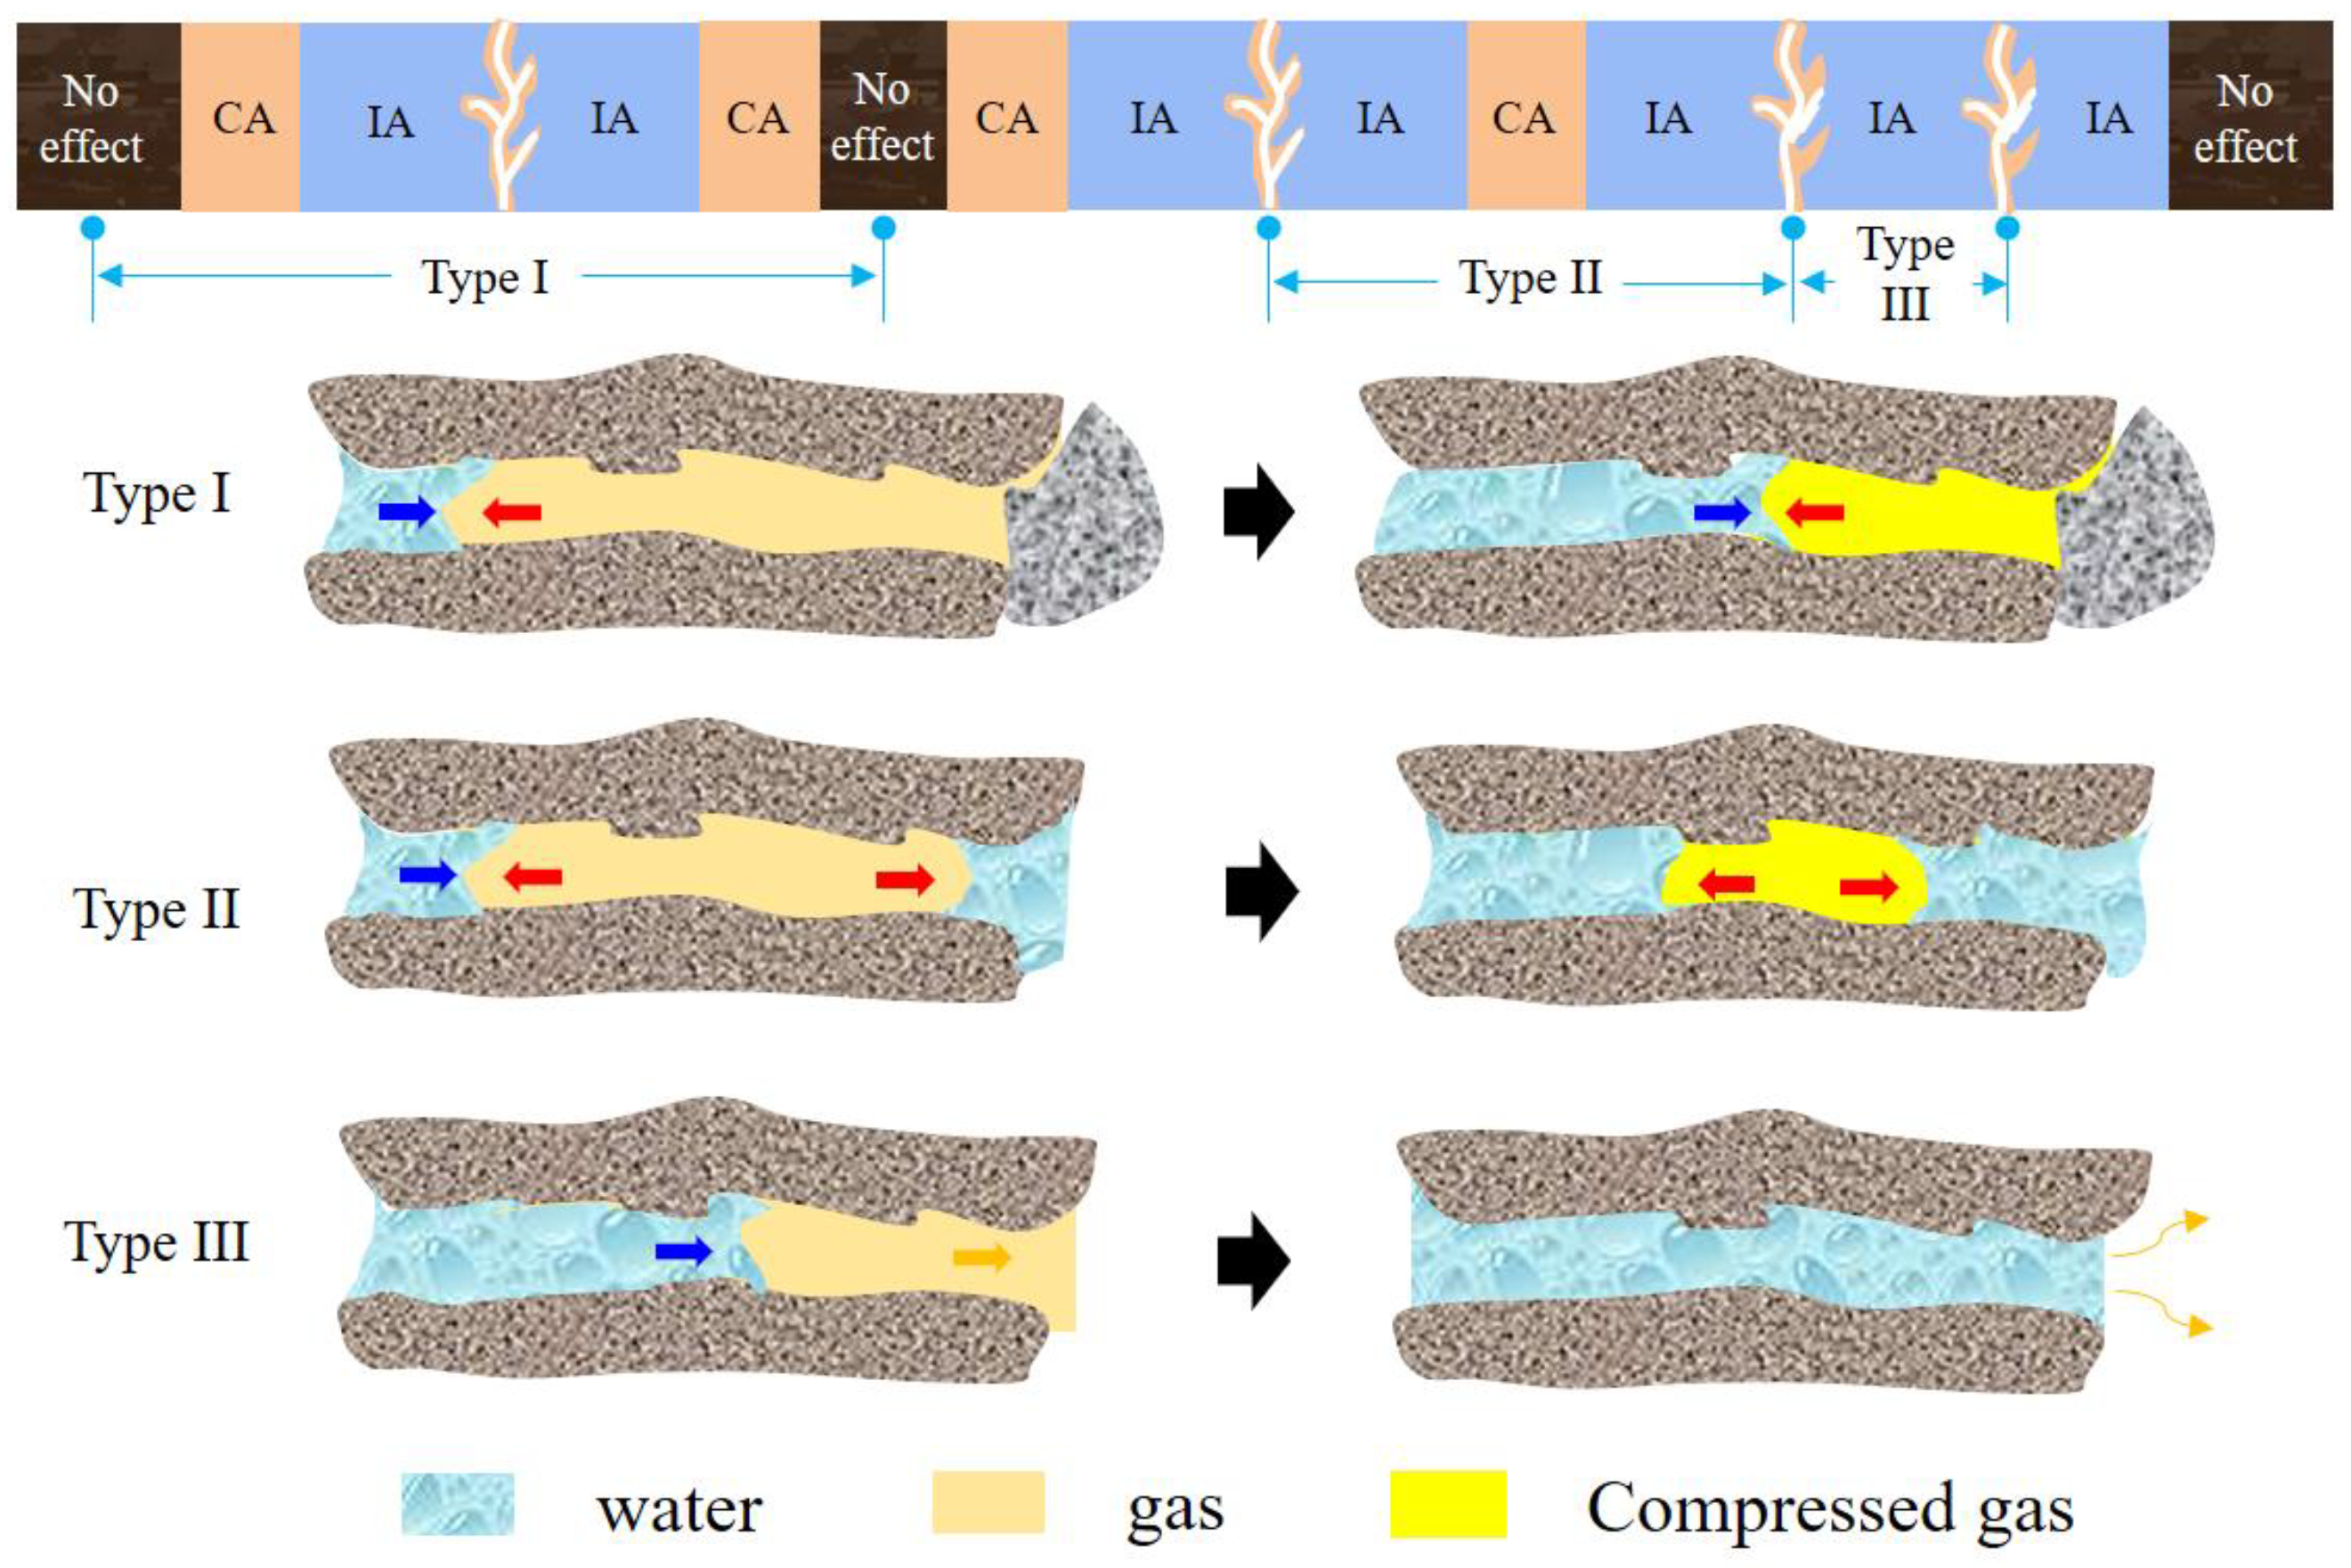
Pumping pressure during the fracturing operation is bigger than fracturing pressure; it can promote the fracturing water into these matrix pores and further influence the gas occurrence. Pores affected by water imbibition in coal are classified into through pores and blind pores (Figure 2). A through pore is defined as having two or more entrances that connect cracks, and a blind pore is defined as having one entrance connected to a crack.
1.
Influence of imbibition on blind pores.
One of the main reasons for the low permeability of coal is the presence of many blind pores. When liquid invades the pore space from the opening of blind pores, the gas stored in the pores is gradually compressed because of the increasing water saturation, which increases the gas pressure in the blind pores (Type I in Figure 2). This theory can be verified by one of the most commonly observed experimental phenomena: a coal core cannot be saturated with all pores full of water.
2.
Influence of imbibition on through pores.
Some gas is stored in hydraulic fractures as gas diffusion occurs within natural fractures and discharged gas is displaced as the fracturing fluid is imbibed by the through pores. The distribution of gas and water in the through pores is shown in Figure 2 and can be classified into two types: Types II and III. Type II represents gas trapping and Type III represents gas discharge. When the imbibition pressures at each end of a through pore are not significantly different, the gas in the pore is blocked by the imbibed fracturing fluid at both ends; when imbibition pressures at each end of a through pore differ substantially, the gas in the pore is displaced out of the pores from the end with higher imbibition pressures.
According to this analysis, the gas–water distribution shows that some of the gas in hydraulic fractures is from through pores, which can increase gas production in the early period of the coalbed methane well. Gas stored in blind pores is one of the main sources that maintain production during the middle and later periods of a coalbed methane well. The ratio of blind pores to through pores in coal is related to the degree of reservoir hydraulic stimulation and natural fracture amount: the higher the fracture density, the larger the proportion of through pores; by contrast, the smaller the fracture density, the larger the proportion of blind pores. A large proportion of through pores benefits the early production of coalbed methane wells.

3. Model Description and Construction

The main differences between the imbibition and drained states in blind pores are as follows: (1) during the imbibition process, adsorbed gas in the affected area is desorbed into free gas (Figure 3a); (2) during the drainage process, a uniform water film is retained on the inner surfaces of the pores in the affected area (Figure 3b). The changes in pore size and water film thickness during the imbibition and drainage processes were ignored in the construction of the model.

3.1. Effect of Imbibition on the Gas Pressure of Micro-Nano Blind Pores in Coal

During the drainage process, the only way to disturb the balance of the gas–water pressure is to discharge the fracturing fluid out of the fractures. With the extraction of water from fractures, gas in blind pores connected to the fractures expands to overcome the drainage resistance that mainly occurs due to capillary pressure [41]; this gradually displaces the imbibed water out of the pores [10], as shown in Figure 3b.
The amount of desorption of adsorbed gas due to imbibition in the affected area is [10],
V a = 2 π r x τ n a
The pore gas pressure, at the time when the fracturing fluid is drained and the gas is about to be produced, is referred to as the maximum pore pressure observed immediately after drainage (Figure 4).
P cg = P g 0 r 2 L + 2 Z R T n a r x ( r h ) 2 x + r 2 ( L x )  

3.2. Effect of Imbibition on Coalbed Permeability

1.
Effect of water imbibition on the pore diameter and Knudsen number.
Accounting for the thickness of the water film, the effective diameter d * of a circular pore is:
d * = 2 ( r h )
Accounting for the water film, the Knudsen number Kn* in a circular pore [42] is:
K n * = λ g d * = λ g 2 ( r h )
Accounting for the influence of imbibition on permeability, the mean free path of the ideal gas, λ g * , can be expressed as [43]:
λ g * = μ g P cg π Z R T 2 M
2.
Effect of water imbibition on the weighting coefficient.
For circular pores, the frequency of the intermolecular collision ω c - m * and the frequency of the molecular-wall collision ω c - w * [44] (allowing for the effect of the water film) are:
ω c - m * = c ¯ λ g * ρ N π ( r h ) 2 d L
ω c - w * = 2 π ( r h ) c ¯ ρ N d L
where the value of is related to the number of space dimensions (that is, 2, 4, and 6 for one-dimensional, two-dimensional, and three-dimensional spaces, respectively). The value of in this study was 4 [44].
Therefore, the weighting coefficient for viscous flow dominated by intermolecular collisions (fc-v) and the weighting coefficient for Knudsen diffusion dominated by molecule-wall collisions (fc-Kn) through a circular pore are [45]:
f c - v * = 1 1 + K n *
f c - Kn * = K n * 1 + K n *
3.
Effect of water imbibition on total gas mass flux.
The viscous flow mass flux for gas in a circular pore can be expressed as [44]:
J c - vs * = ( d * ) 2 32 P cg M μ g Z R T ( 1 + α * K n * ) ( 1 + 4 K n * 1 b K n * ) d P d L
When the boundary condition is the first-order slip flow, b = 0; when the boundary condition is the second-order slip flow, b = 1. Rahmanian et al. [46] advised b = −1 after molecular simulation. α* is expressed as:
α * = α 0 2 π t a n 1 ( α 1 ( K n * ) χ )
According to Beskok et al. [47], the relevant parameters in Equation (11) are α0 = 1.19, α1 = 4, and χ = 0.4.
The Knudsen diffusion mass flux for gas in a circular pore can be expressed as [44]:
J c - Kn * = C g d * 3 8 Z M π R T P cg Z d P d L
Thus, the integrated mass flux in a circular pore is:
J c - T * = J c - vs * f c - v * + J c - K n * f c - K n * = [ ( d * ) 2 32 P cg M μ g Z R T 1 + α * K n * 1 + K n * ( 1 + 4 K n * 1 b K n * ) + d * 3 K n * 1 + K n * C g P cg Z 8 Z M π R T ] d P d L
Combining the influence of porosity, water saturation, and pore tortuosity, the gas permeability of coal with circular pores [48] can be obtained while considering the interaction of viscous flow and Knudsen diffusions:
K cg * = ϕ ( 1 S cw ) τ [ ( d * ) 2 32 1 + α * K n * 1 + K n * ( 1 + 4 K n * 1 b K n * ) + K n * 1 + K n * C g μ g d * 3 8 Z R T π M ]
Considering the retained water film, the original water saturation is calculated as:
S cw = x L [ 1 ( 1 h r ) 2 ] + S wi

4. Results and discussion

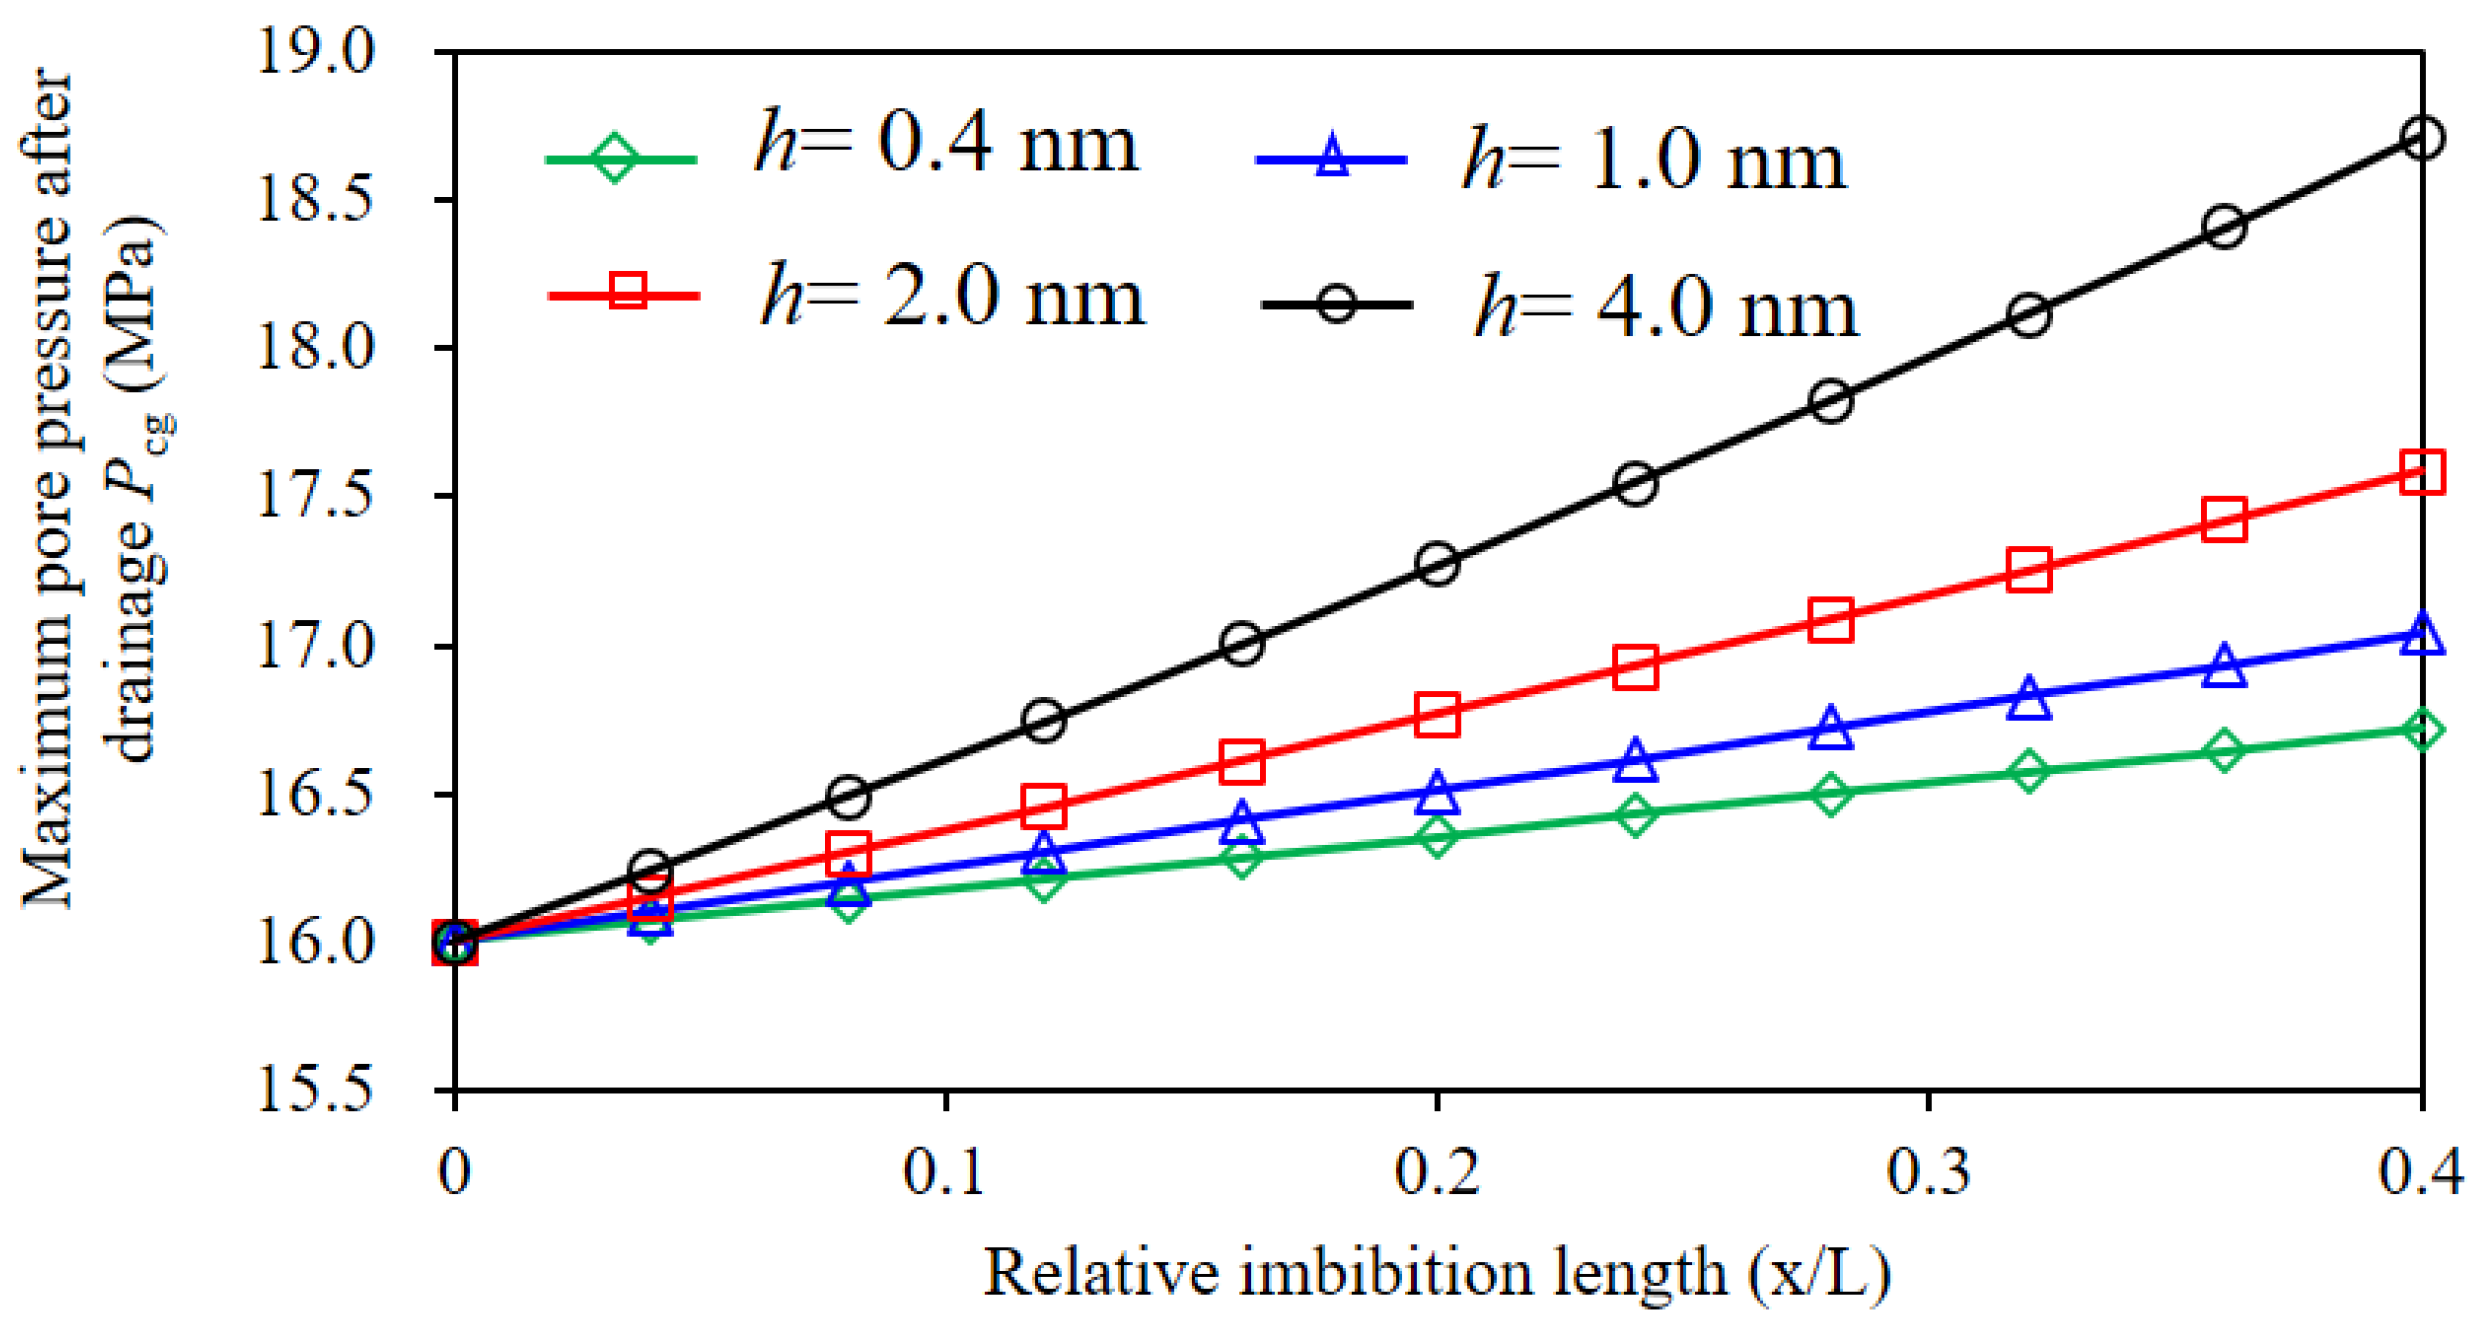
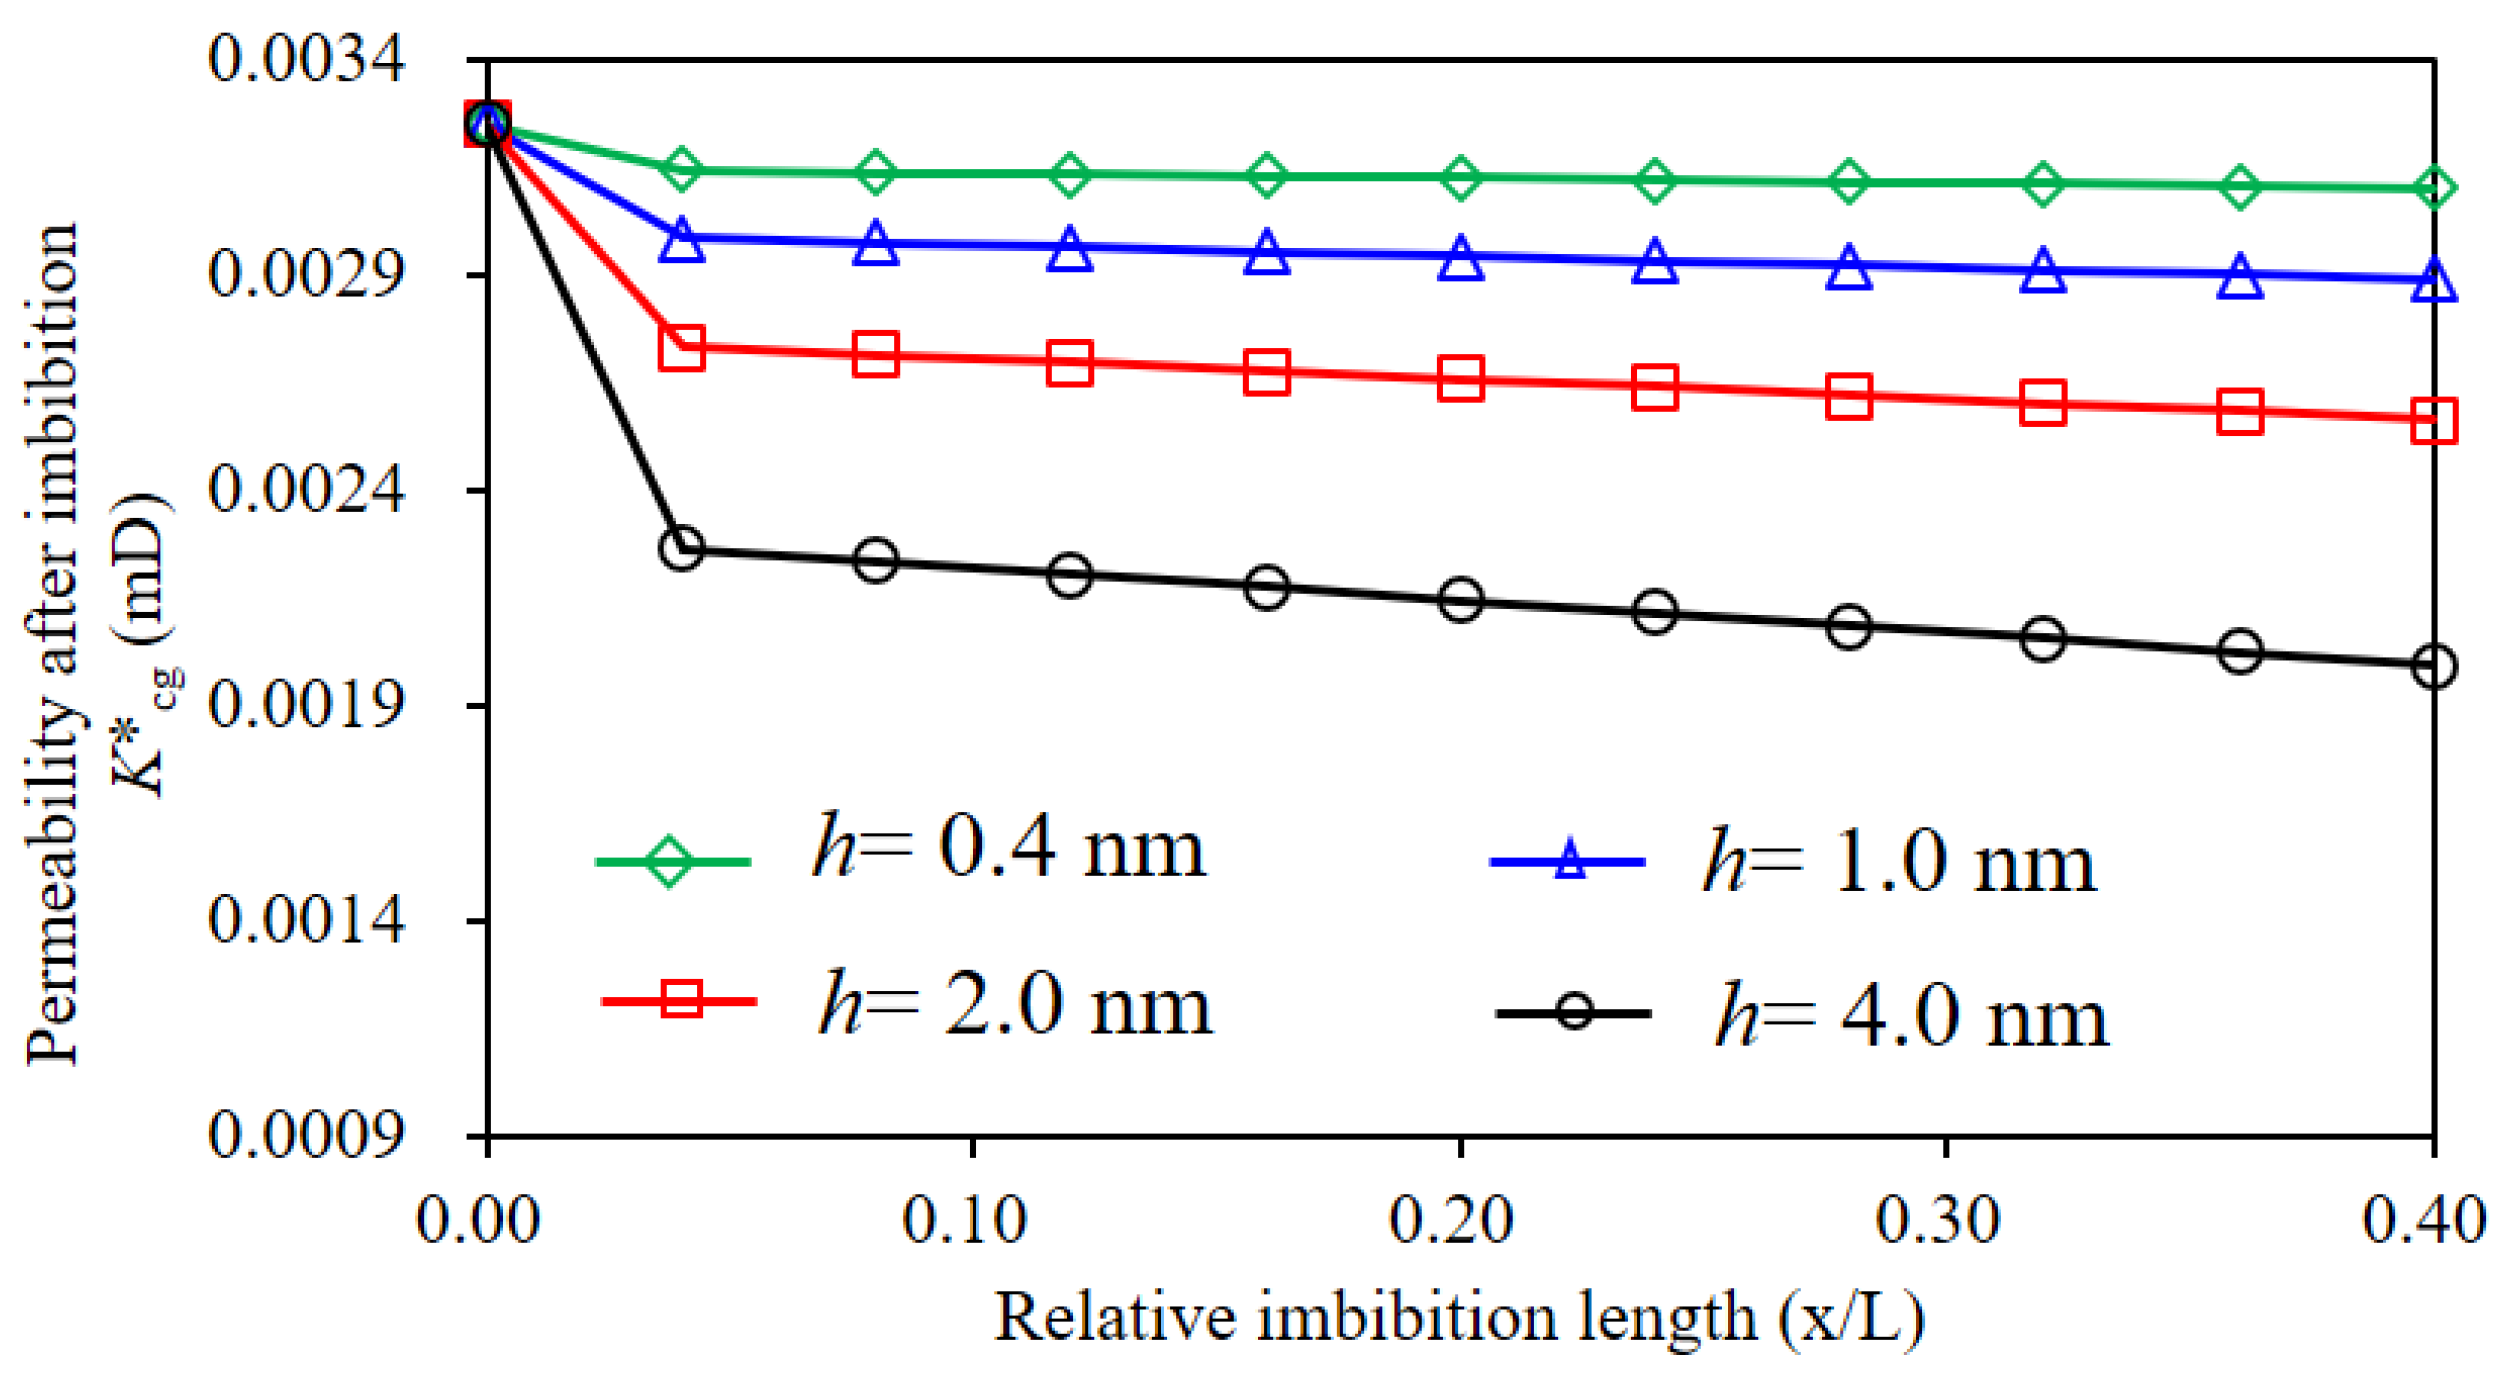
4.1. Effect of Imbibition on Water Saturation, Maximum Pore Pressure after Drainage, and Permeability

An assumption of the results and discussion section is that the bulk water in the affected blind pores is discharged. The relevant reservoir parameters are shown in Table 2.
The effect of imbibition on water saturation in pores of different sizes can be analyzed using Equation (15), and the results are presented in Figure 5. The longer the imbibition length in blind pores, the higher the water saturation; additionally, the thicker the water film, the greater the water saturation.
The effect of imbibition on the maximum pore pressure observed immediately after drainage in pores of different sizes can be analyzed based on Equation (2), and the results are presented in Figure 6. The longer the imbibition length in blind pores, the greater the maximum pore pressure immediately after drainage; this is mainly because a longer imbibition length results in greater desorption of adsorbed gas. Additionally, the greater the thickness of the water film, the greater the maximum pore pressure immediately after drainage; this is because a thicker water film results in a smaller storage space for gas, and a greater pore gas pressure.
The effect of imbibition on the permeability of pores of different sizes can be analyzed based on Equation (14), and the results are presented in Figure 7. A longer imbibition period will have a more negative effect on permeability, mainly because it significantly increases water saturation in the pores and reduces the effective seepage area. Additionally, a thicker water film will cause imbibition to have a more negative effect on permeability.

4.2. Effect of Imbibition on Gas Production

1.
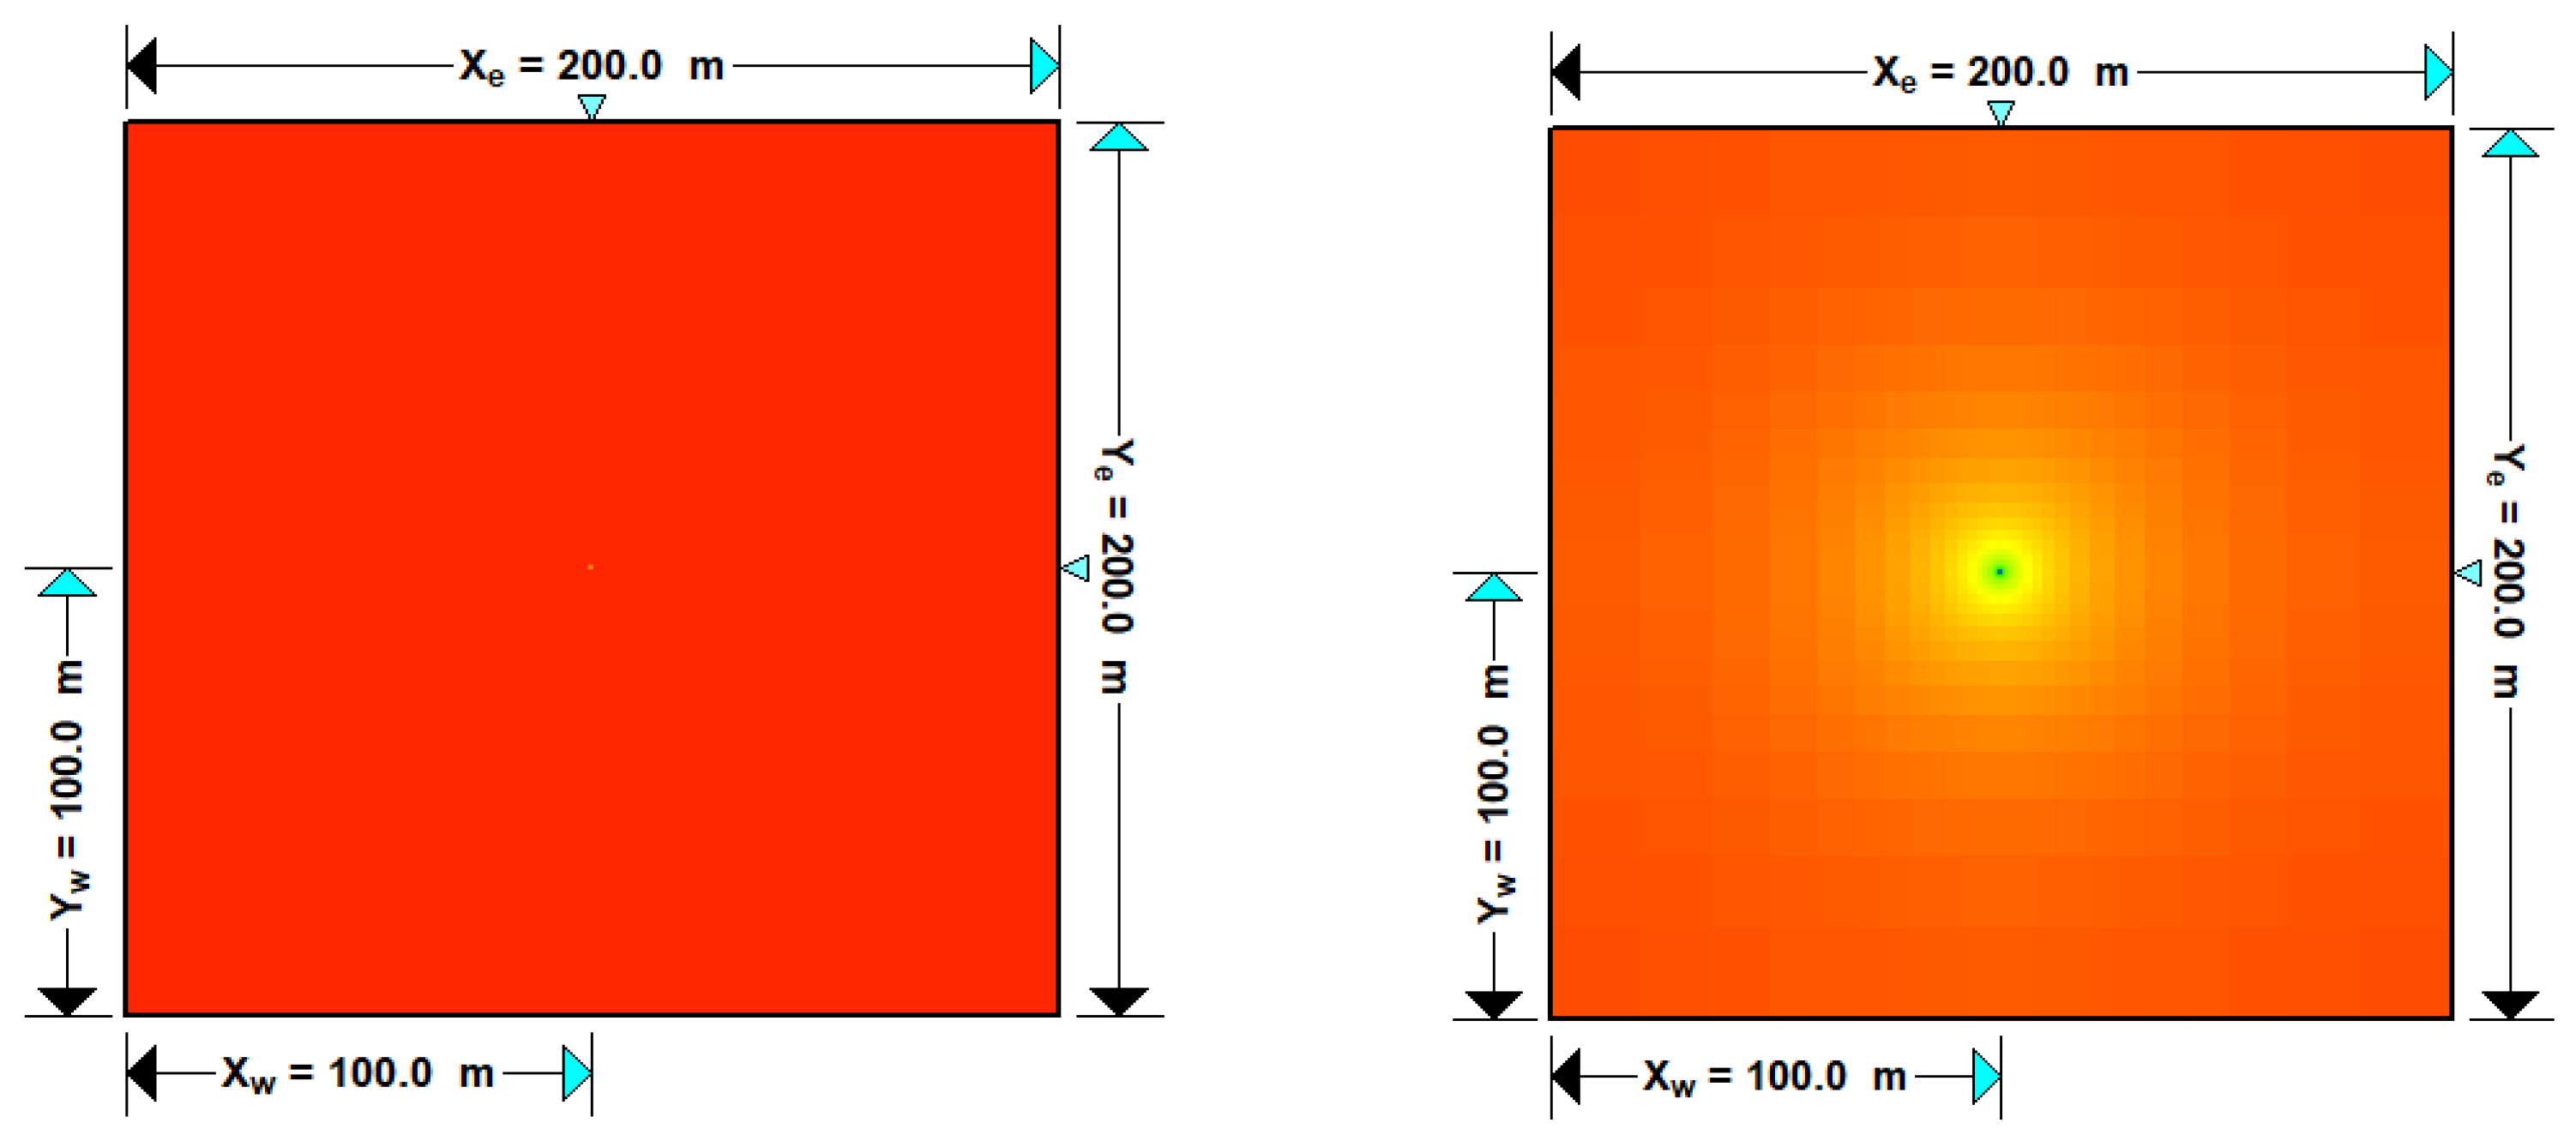
Permeability and pore pressure before and after imbibition.
According to the three proposed equations, namely Equations (2), (14), and (15), seven examples demonstrating the influences of different imbibition degrees on water saturation, maximum pore pressure immediately after drainage, and permeability were conducted, as shown in Table 3. Case 1, which does not account for the influence of fracturing imbibition, is widely applied in unconventional methane development [49,50]. The maximum pore pressure immediately after drainage was set as the reservoir pressure for the model of wet coal—numerical vertical in harmony-CBM (Figure 8). Only reservoir pressure, water saturation, and matrix permeability were changed, and all other parameters were the same.
2.
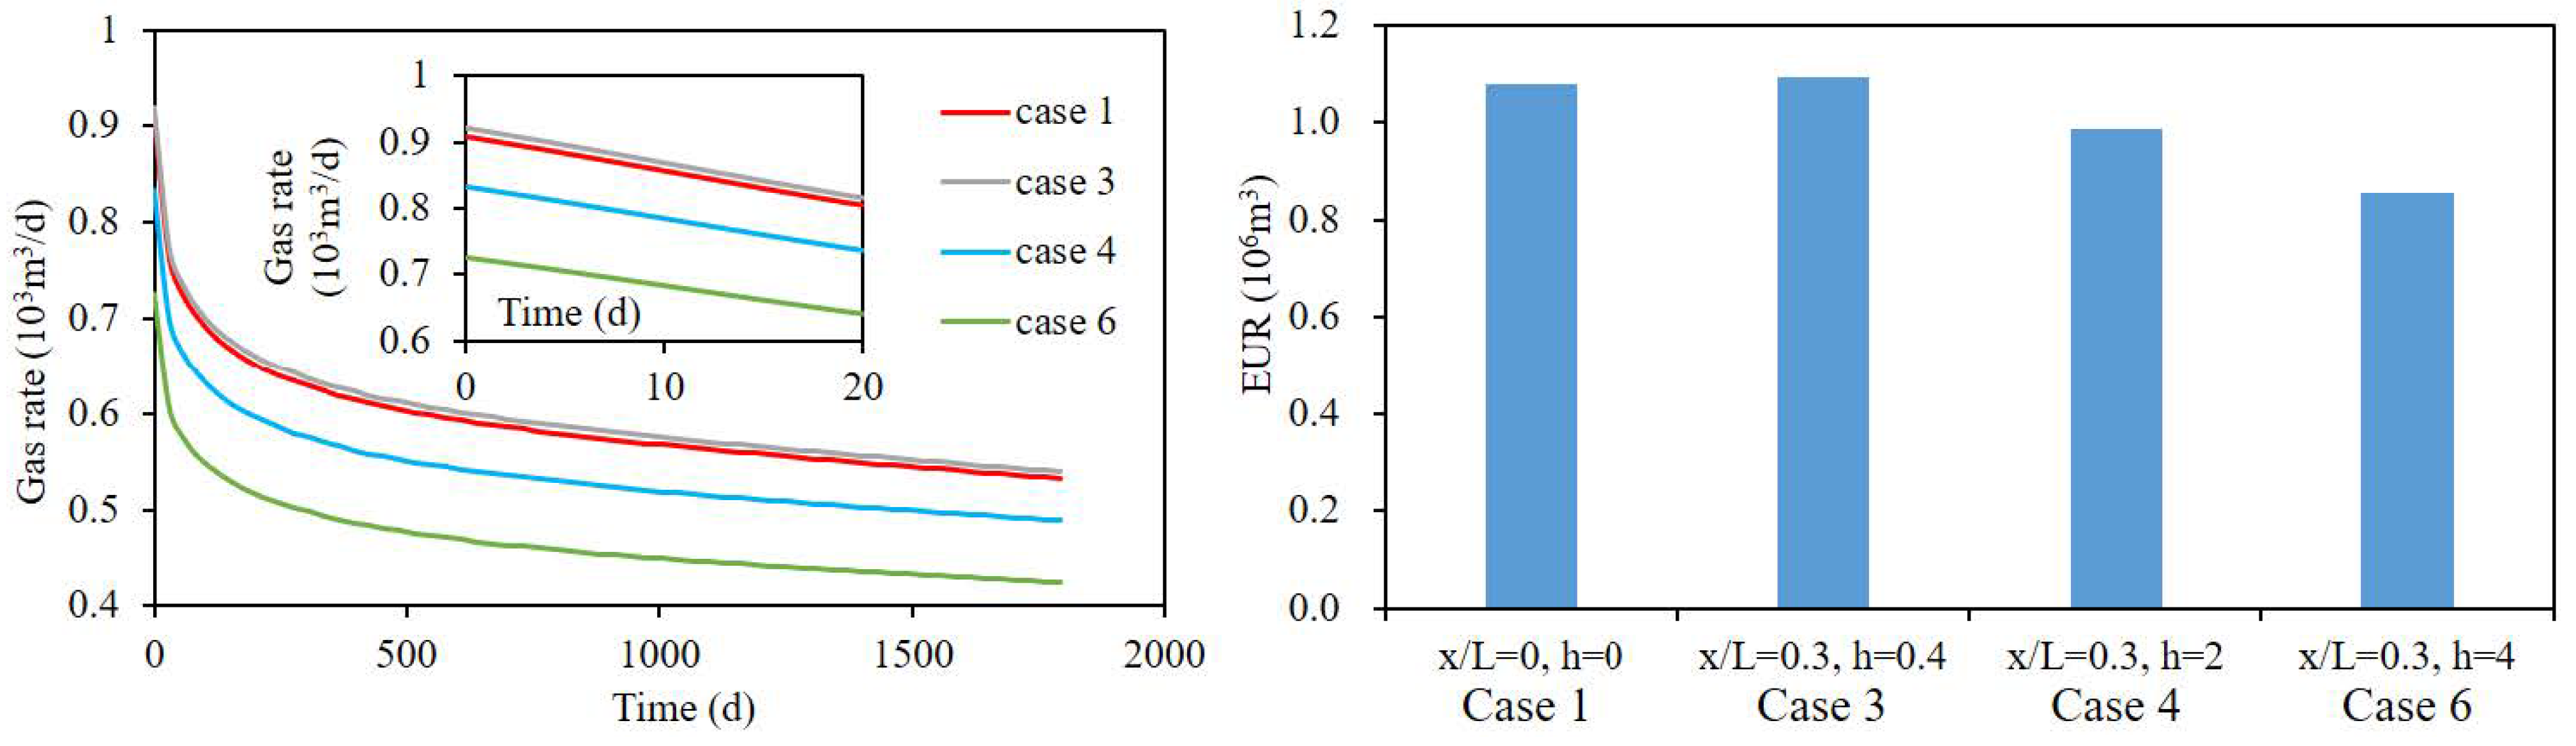
Comparison of gas well productivity before and after imbibition.
In the physical model of a vertical well (shown in Figure 8), a reservoir length of 200 m, a width of 200 m, net pay of 20 m, total porosity of 0.06, and temperature of 309 K were assumed. The damaged skin on the fracture face was zero, the permeability ratio in the x direction and y directions, and the x and z directions were both one; the coal Langmuir volume was 19 cm3/g, Langmuir pressure was 9 MPa, the specific surface ratio was 100 m2/g, the wellbore radius was 0.1 m, the constant flow pressure was 1000 KPa, and the production duration was 60 months; the other parameters are shown in Table 2.
The effects of imbibition on gas production are shown in Figure 9. Cases 2, 4, and 6 show that water imbibition had a negative effect on gas production. On the contrary, cases 3, 5, and 7 show that water imbibition had a positive effect on gas production, in which the retained water films were thicker than those in the other two cases, namely cases 4 and 6. This phenomenon occurs because a decrease in permeability has a larger negative effect on gas production than the positive effect of increased pore pressure on gas production. To further analyze the effects of imbibition length and water film thickness on coalbed methane production, more comparisons were analyzed, shown as follows.
Comparison 1: The thickness of the retained water film was 0.4 nm, and the relative imbibition lengths were 0.12, 0.3, 0.5, and 0.9, respectively. The simulation results are shown in Figure 10. When the thickness of the retained water film is constant, a short imbibition length has a negative effect on gas production; however, a longer relative imbibition length results in imbibition having a greater positive effect on gas production (Figure 10A) and EUR (Figure 10B). The reason is that the entrance of the pore is adsorbed with a water film, no matter how long the imbibition length is, it dominates the permeability of the pore. For example, the pore openings connected with fractures are the entrances of water imbibition and gas flow, as shown in Figure 10, although cases 2, 3, 5, and 7 have different imbibition lengths, the thickness of water film and pore radius are the same, which means that the pore entrances have an equal cross-sectional area for gas flow; the other factor to affect permeability is the gas pressure. As for case 2, increases in water saturation and decreases in effective permeability will more noticeably increase the energy consumed by water movement, although this increases pore gas pressure due to the increased desorption of adsorbed gas. As for cases 3, 5, and 7, increases in pore gas pressure are much more noticeable, which can increase gas production and offset the negative effect of permeability reduction on gas production.
Comparison 2: The relative imbibition length is 0.3, and the thicknesses of the retained water film are 0.4, 2, and 4 nm, respectively; the simulation results are shown in Figure 11. As for case 3, the beneficial effects of increased pore pressure on gas production are much greater than the negative effects of increased water saturation and decreased permeability on gas production. As for cases 4 and 6, the negative effects of increased water saturation and decreased permeability on gas production rose with the increasing water film. The main reason for this phenomenon is as follows: the amount of desorbed gas remained constant when the imbibition length was constant, but an increase in pore gas pressure was observed due to a decrease in gas storage space according to Equation (2), a thicker water film resulted in a greater pore gas pressure immediately after drainage. However, a thicker water film also led to a greater increase in water saturation and a decrease in permeability, and the negative effects of the increased water saturation and decreased permeability on gas production were much greater than the beneficial effects of increased pore pressure on gas production.

5. Conclusions

The assumption used in this study is that the bulk water in affected blind pores is discharged. By analyzing the influence of fracturing fluid imbibition on blind pores in the reservoir coal matrix, the following conclusions were obtained through numerical simulations:
  • Water imbibition can increase the pore gas pressure in blind pores in two ways. Firstly, imbibed fracturing fluid promotes the desorption of adsorbed gas in the affected area, increasing the content of free gas; secondly, the water film retained on the inner wall of pores reduces the space for gas storage. The combined actions of these two aspects increase the pore gas pressure immediately after water drainage in blind pores.
  • Water imbibition can reduce the effective gas permeability in blind pores in two ways. Firstly, the water film retained on the inner wall of pores reduces the effective area for gas seepage; secondly, the increase in water saturation reduces the efficiency of the gas flow. The combined actions of these two aspects reduce the effective permeability of gas in blind pores.
  • Water imbibition is not always deleterious to coalbed methane production and EUR. When the relative imbibition length is constant, a thicker water film results in a more obvious decrease in gas production and EUR; when the thickness of water film is constant, more imbibition results in a more obvious increase in gas production and EUR.
Some deficiencies in the proposed model need to be devoted to future research: (1) there is no direct method to obtain the imbibition depth, because imbibition depth is related to pore length, gas pressure, mineral type, and so on. (2) A theory analysis was mainly conducted in this paper; however, an experiment for the imbibition effect on the coalbed methane well is more effective but difficult to implement under current experimental conditions; (3) the effect of imbibition on the coal structure cannot currently be quantitatively analyzed, and the effects of the pore structure, pore wall, and mineral types on imbibition are still unknown, but the image description by deep learning and numerical simulation can make up for the deficiencies.

Author Contributions

Conceptualization, Y.L. and Y.S.; methodology, K.W.; software, K.W.; validation, K.W., P.X. and W.W.; formal analysis, W.X.; investigation, L.S.; resources, Y.L.; data curation, F.Y.; writing—original draft preparation, K.W.; writing—review and editing, W.W.; visualization, Y.L.; supervision, Y.S.; project administration, Y.L.; funding acquisition, Y.L. All authors have read and agreed to the published version of the manuscript.

Funding

This research was funded by Special Post Talent Plan of Guizhou University (grant number: 702825), and the Science and Technology Programs of Guizhou Province (Qian Science Foundation-ZK (2022) General 106, Qian science cooperation project of prospecting strategy (2022) ZD001).

Institutional Review Board Statement

Not applicable.

Informed Consent Statement

Not applicable.

Data Availability Statement

Not applicable.

Acknowledgments

The authors would like to acknowledge the funds provided by Guizhou University (number: 702825), the Science and Technology Programs of Guizhou Province (Qian Science Foundation-ZK (2022) General 106, Qian science cooperation project of prospecting strategy (2022) ZD001).

Conflicts of Interest

The authors have no competing interest to declare.

Nomenclature

raverage pore radius, mbgas slip constant, dimensionless
d*diameter of circular pore considering water film, mCggas compressibility, 1/MPa
τpore tortuosity, dimensionlessα*rarefaction coefficient of ideal gas, dimensionless
ximbibition length, mα0rarefaction coefficient when Knudsen number tends to infinity, dimensionless
c ¯ average gas thermal kinematic velocity, m/s
Lpore length, mα1fitting constant, dimensionless
ϕcoal porosity, %χfitting constant, dimensionless
Zgas compressibility factor, dimensionless J c - K n * Knudsen diffusion mass flux through circular pores, kg/(m2·s)
Rgas constant, 8.314 J/(K∙mol)
Treservoir temperature, K J c - v s * viscous flow mass flux through circular pores, kg/(m2·s)
hthickness of water film on pore walls, m J c T * integrated mass flux through circular pores, kg/(m2·s)
λ g * mean free path of gas considering water film, m K c g * gas permeability for circular pores considering the influence of imbibition, mD
μggas viscosity, mPa·s
Mthe molar mass of methane molecule, g/mol K n * Knudsen number in circular pores considering water film, dimensionless
Pgas pressure, MPa
Pg0original gas pressure, MPaSwioriginal water saturation, %
Pcgmaximum pore pressure after drainage, MPaScwwater saturation considering the influence of imbibition, %
ρNmolar density of gas molecules, mol/m3Vadesorption amount of adsorbed gas in affected area, mol
collision direction of gas molecules and wall.namolar content of adsorbed gas per unit pore area, mol/m2
qggas rate, 103 m3/d Gpcumulative production, 106 m3
ω c - * mfrequency of intermolecular collision considering water film, mol/s ω c - * wfrequency of molecular-wall collision considering water film, mol/s
fc-vweighting coefficient for viscous flow that is dominated by molecule-wall collisions, dimensionlessfc-Knweighting coefficients for Knudsen diffusion that are dominated by intermolecular collisions, dimensionless

References

  1. Peng, X.L.; Wang, X.Z.; Zhou, X.; Lin, Z.Y.; Zeng, F.H.; Huang, X.L. Lab-on-a-chip systems in imbibition processes: A review and applications/issues for studying tight formations. Fuel 2021, 306, 121603. [Google Scholar] [CrossRef]
  2. Meng, M.M.; Ge, H.K.; Ji, W.M.; Wang, X.Q. Research on the auto-removal mechanism of shale aqueous phase trapping using low field nuclear magnetic resonance technique. J. Pet. Sci. Eng. 2016, 137, 63–73. [Google Scholar] [CrossRef]
  3. Xia, P.; Hao, F.; Tian, J.Q.; Zhou, W.X.; Fu, Y.; Guo, C.; Yang, Z.; Li, K.J.; Wang, K. Depositional Environment and Organic Matter Enrichment of Early Cambrian Niutitang Black Shales in the Upper Yangtze Region, China. Energies 2022, 15, 4551. [Google Scholar] [CrossRef]
  4. Abbasi, M.A.; Ezulike, D.O.; Dehghanpour, H.; Hawkes, R.V. A comparative study of flowback rate and pressure transient behavior in multifractured horizontal wells completed in tight gas and oil reservoirs. J. Nat. Gas Sci. Eng. 2014, 17, 82–93. [Google Scholar] [CrossRef]
  5. Wang, K.; Jiang, B.B.; Li, H.T.; Ye, K.R.; Tan, Y.S. Spontaneous imbibition model for micro–nano–scale pores in shale gas reservoirs considering gas–water interaction. J. Pet. Sci. Eng. 2022, 209, 109893. [Google Scholar] [CrossRef]
  6. Wang, J.J.; Rahman, S.S. Investigation of water leak-off considering the component variation and gas entrapment in shale during hydraulic-fracturing stimulation. SPE Reserv. Eval. Eng. 2016, 19, 511–519. [Google Scholar] [CrossRef]
  7. Zhou, Z.; Abass, H.; Li, X.; Bearinger, D.; Frank, W. Mechanisms of imbibition during hydraulic fracturing in shale formations. J. Pet. Sci. Eng. 2016, 141, 125–132. [Google Scholar] [CrossRef]
  8. Xiong, J.; Liu, X.J.; Liang, L.X.; Zeng, Q. Investigation of methane adsorption on chlorite by grand canonical Monte Carlo simulations. Pet. Sci. 2017, 14, 37–49. [Google Scholar] [CrossRef]
  9. Hu, Z.M.; Mu, Y.; Gu, Z.B.; Duan, X.G.; Li, Y.L. Law of imbibition effect on shale gas occurrence state. Nat. Gas Ind. B 2020, 7, 624–630. [Google Scholar] [CrossRef]
  10. Wang, K.; Ye, K.R.; Jiang, B.B.; Li, H.T.; Tan, Y.S. The mechanism of gas-water extraction in micro- and nanoscale pores in shale gas reservoirs: Based on gas-water interactions. Chem. Eng. Sci. 2022, 248, 117259. [Google Scholar] [CrossRef]
  11. Lin, H.; Yang, B.; Song, X.X.; Sun, X.Y.; Dong, L.F. Fracturing fluid retention in shale gas reservoir from the perspective of pore size based on nuclear magnetic resonance. J. Hydro. 2021, 601, 126590. [Google Scholar]
  12. Sun, Z.; Shi, J.T.; Wu, K.L.; Xu, B.X.; Zhang, T.; Chang, Y.C.; Li, X.F. Transport capacity of gas confined in nanoporous ultra-tight gas reservoirs with real gas effect and water storage mechanisms coupling. Int. J. Heat Mass Transf. 2018, 126, 1007–1018. [Google Scholar] [CrossRef]
  13. He, M.X.; Zhou, Y.F.; Wu, K.L.; Hu, Y.L.; Feng, D.; Zhang, T.; Liu, Q.; Li, X.F. Pore network modeling of thin water film and its influence on relative permeability curves in tight formations. Fuel 2021, 289, 119828. [Google Scholar] [CrossRef]
  14. Zhou, D.S.; Yuan, H. A new model for predicting gas-well liquid loading. SPE Prod. Oper. 2010, 25, 172–181. [Google Scholar] [CrossRef]
  15. Sun, B.J.; Pan, S.W.; Zhang, J.B.; Zhao, X.X.; Zhao, Y.; Wang, Z.Y. A dynamic model for predicting the geometry of bubble entrapped in yield stress fluid. Chem. Eng. J. 2020, 391, 123569. [Google Scholar]
  16. Wilson, K. Analysis of drawdown sensitivity in shale reservoirs using coupled-geomechanics models. In Proceedings of the SPE Annual Technical Conference and Exhibition, Houston, TX, USA, 28–30 September 2015. SPE-175029-MS. [Google Scholar]
  17. Xu, M.; Gupta, A.; Dehghanpour, H. How significant are strain and stress induced by water imbibition in dry gas shales? J. Pet. Sci. Eng. 2019, 176, 428–443. [Google Scholar] [CrossRef]
  18. Yan, Q.; Lemanski, C.; Karpyn, Z.T.; Ayala, L.F. Experimental investigation of shale gas production impairment due to fracturing fluid migration during shut-in time. J. Nat. Gas Sci. Eng. 2015, 24, 99–105. [Google Scholar] [CrossRef]
  19. Bazin, B.; Bekri, S.; Vizika, O.; Herzhaft, B.; Aubry, E. Fracturing in tight gas reservoirs: Application of special-core-analysis methods to investigate formation damage mechanisms. SPE J. 2010, 15, 969–976. [Google Scholar] [CrossRef]
  20. Chakraborty, N.; Karpyn, Z.T.; Liu, S.; Yoon, H. Permeability evolution of shale during spontaneous imbibition. J. Nat. Gas Sci. Eng. 2017, 38, 590–596. [Google Scholar] [CrossRef]
  21. Zhang, D.J.; Kang, Y.L.; Selvadurai, A.P.S.; You, L.J.; Tian, J. The role of phase trapping on permeability reduction in an ultra-deep tight sandstone gas reservoirs. J. Pet. Sci. Eng. 2019, 178, 311–323. [Google Scholar] [CrossRef]
  22. Tian, J.; Kang, Y.L.; You, L.J.; Jia, N.; Xi, Z.Y.; Luo, P.Y. Investigation on water phase trapping mechanisms in tight gas reservoirs: Pore-scale visualization observation and core-scale flooding analysis. J. Pet. Sci. Eng. 2021, 198, 108185. [Google Scholar] [CrossRef]
  23. Bai, J.J.; Kang, Y.L.; Chen, Z.X.; You, L.J.; Chen, M.J.; Li, X.C. Changes in retained fracturing fluid properties and their effect on shale mechanical properties. J. Nat. Gas Sci. Eng. 2020, 75, 103163. [Google Scholar] [CrossRef]
  24. Zhang, J.J.; Kamenov, A.; Zhu, D.; Hill, A.D. Development of new testing procedures to measure propped fracture conductivity considering water damage in clay-rich shale reservoirs: An example of the Barnett Shale. J. Pet. Sci. Eng. 2015, 135, 352–359. [Google Scholar] [CrossRef]
  25. Lin, S.; Lai, B. Experimental investigation of water saturation effects on Barnett shale’s geomechanical behaviors. In Proceedings of the SPE Annual Technical Conference and Exhibition, New Orleans, LA, USA, 30 September–2 October 2013. SPE 166234. [Google Scholar]
  26. Liu, D.; Wang, Z.; Zhang, X.; Wang, Y.; Zhang, X.; Li, D. Experimental investigation on the mechanical and acoustic emission characteristics of shale softened by water absorption. J. Nat. Gas Sci. Eng. 2018, 50, 301–308. [Google Scholar] [CrossRef]
  27. Xia, P.; Fu, Y.; Guo, C.; Yang, Z.; Huang, J.Q.; Mou, Y.L. Shale Gas Reservoir Evaluation by Geophysical Measurements: A Case Study of the Upper Ordovician–Lower Silurian in the Fenggang Block, Northern Guizhou Province. Acta Geol. Sin. 2021, 95, 1310–1321. [Google Scholar] [CrossRef]
  28. Hu, Y.N.; Devegowda, D.; Striolo, A.; Civan, F.; Sigal, R. Microscopic dynamics of water and hydrocarbon in shale-kerogen pores of potentially mixed-wettability. SPE J. 2015, 20, 112–124. [Google Scholar] [CrossRef]
  29. De Leeuw, N.H.; Higgins, F.M.; Parker, S.C. Modeling the surface structure and stability of α-quartz. J. Phys. Chem. B 1999, 103, 1270–1277. [Google Scholar] [CrossRef]
  30. Zhan, S.Y.; Su, Y.L.; Jin, Z.H.; Wang, W.D.; Li, L. Effect of water film on oil flow in quartz nanopores from molecular perspectives. Fuel 2020, 262, 116560. [Google Scholar] [CrossRef]
  31. Wolthers, M.; Tommaso, D.D.; Du, Z.; Leeuw, N.H. Calcite surface structure and reactivity: Molecular dynamics simulations and macroscopic surface modelling of the calcite–water interface. Phys. Chem. Chem. Phys. 2012, 14, 15145–15157. [Google Scholar] [CrossRef]
  32. Cao, P.; Liu, J.; Leong, Y.K. A multiscale-multiphase simulation model for the evaluation of shale gas recovery coupled the effect of water flowback. Fuel 2017, 199, 191–205. [Google Scholar] [CrossRef]
  33. Ghanbari, E.; Dehghanpour, H. The fate of fracturing water: A field and simulation study. Fuel 2016, 163, 282–294. [Google Scholar] [CrossRef]
  34. Gupta, A.; Xu, M.; Dehghanpour, H.; Bearinger, D. Experimental investigation for microscale stimulation of shales by water imbibition during the shut-in periods. In Proceedings of the SPE Unconventional Resources Conference, Calgary, AB, Canada, 15–16 February 2017. SPE-185058-MS. [Google Scholar]
  35. Lin, H.; Song, X.X.; Sun, X.Y.; Hu, S.L.; Luo, C.; Qu, H.; Yang, B. Dynamic displacement of adsorbed methane by fracturing fluid during soaking in a shale gas reservoir based on low-field nuclear magnetic resonance. J. Pet. Sci. Eng. 2022, 208, 109582. [Google Scholar] [CrossRef]
  36. Zhang, T.; Ellis, G.S.; Ruppel, S.C.; Milliken, K.; Yang, R. Effect of organic-matter type and thermal maturity on methane adsorption in shale-gas systems. Org. Geochem. 2012, 47, 120–131. [Google Scholar] [CrossRef]
  37. Qin, C.; Jiang, Y.D.; Zhou, J.P.; Zuo, S.Y.; Chen, S.W.; Liu, Z.J.; Yin, H.; Li, Y. Influence of supercritical CO2 exposure on water wettability of shale: Implications for CO2 sequestration and shale gas recovery. Energy 2021, 242, 122551. [Google Scholar] [CrossRef]
  38. Bostrom, N.; Chertov, M.; Pagels, M.; Willberg, D.; Chertova, A.; Davis, M.; Zagorski, W. The time-dependent permeability damage caused by fracture fluid. In Proceedings of the SPE International Symposium and Exhibition on Formation Damage Control, Lafayette, LA, USA, 26–28 February 2014. SPE-168140-MS. [Google Scholar]
  39. Yang, L.; Ge, H.K.; Shen, Y.H.; Ren, K.; Sheng, M.; Gao, Z.Y.; Qin, X.L.; Su, S. Experimental research on the shale imbibition characteristics and its relationship with microstructure and rock mineralogy. In Proceedings of the SPE Asia Pacific Unconventional Resources Conference and Exhibition, Brisbane, Australia, 9–11 November 2015. SPE 176882. [Google Scholar]
  40. Meng, M.M.; Ge, H.K.; Shen, Y.H.; Li, L.L.; Tian, T.H.; Chao, J. The effect of clay-swelling induced cracks on shale permeability during liquid imbibition and diffusion. J. Nat. Gas Sci. Eng. 2020, 83, 103514. [Google Scholar] [CrossRef]
  41. Faisal, U.R.A.; Muhammad, A.; Stefan, I.; Alireza, K. Coal fines migration: A holistic review of influencing factors. Adv. Colloid Interface Sci. 2022, 301, 102595. [Google Scholar]
  42. Javadpour, F.; Fisher, D.; Unsworth, M. Nanoscale gas flow in shale sediments. J. Can. Petrol. Technol. 2007, 46, 55–61. [Google Scholar] [CrossRef]
  43. Civan, F.; Rai, C.S.; Sondergeld, C.H. Shale-gas permeability and diffusivity inferred by improved formulation of relevant retention and transport mechanisms. Transp. Porous Media 2011, 86, 925–944. [Google Scholar] [CrossRef]
  44. Wu, K.L.; Chen, Z.X.; Li, X.F. Real gas transport through nanopores of varying cross-section type and shape in shale gas reservoirs. Chem. Eng. J. 2015, 281, 813–825. [Google Scholar] [CrossRef]
  45. Wu, K.L.; Chen, Z.X. Real gas transport through complex nanopores of shale gas reservoirs. In Proceedings of the SPE Europec featured at 78th EAGE Conference and Exhibition, Vienna, Austria, 30 May–2 June 2016. SPE-180086-MS. [Google Scholar]
  46. Rahmanian, M.; Aguilera, R.; Kantzas, A. A new unified diffusion viscous flow model based on pore-level studies of tight gas formations. SPE J. 2013, 18, 38–49. [Google Scholar] [CrossRef]
  47. Beskok, A.; Karniadakis, G.E. Report: A model for flows in channels, pipes, and ducts at micro and nano scales. Nanoscale Microscale Thermophys. Eng. 1999, 3, 43–77. [Google Scholar]
  48. Wu, K.L.; Li, X.F.; Guo, C.H.; Wang, C.C.; Chen, Z.X. A unified model for gas transfer in nanopores of shale-gas reservoirs: Coupling pore diffusion and surface diffusion. SPE J. 2016, 21, 1583–1611. [Google Scholar] [CrossRef]
  49. Lei, T.; Yin, X.Y.; Zong, Z.Y. Pore pressure prediction in orthotropic medium based on rock physics modeling of shale gas. J. Nat. Gas Sci. Eng. 2020, 74, 103091. [Google Scholar] [CrossRef]
  50. Zhao, C.J.; Li, J.; Jin, Y.X.; Zaman, M.; Miao, Y.N. Investigation of dynamic pore pressure in shale gas reservoir during the multi-fracturing and its influence on fault slip. J. Nat. Gas Sci. Eng. 2021, 95, 104190. [Google Scholar] [CrossRef]
Figure 1. High temperature and high-pressure NMR visualization experimental platform (MacroMR12-150H-l).
Atmosphere 13 01314 g001
Figure 2. The influence of fracturing fluid imbibition on different types of pores (CA: compressed area, IA: imbibition area).
Atmosphere 13 01314 g002
Figure 3. Change in the gas–water state in blind pores during the process of imbibition and drainage (according to Wang et al., [10]). (a) Change in the gas–water state in blind pores during the imbibition process. (b) Change in the gas–water state in blind pores during the drainage process.
Atmosphere 13 01314 g003
Figure 4. Schematic of water drainage (according to Wang et al., [10]).
Atmosphere 13 01314 g004
Figure 5. Effect of imbibition on water saturation.
Atmosphere 13 01314 g005
Figure 6. Effect of imbibition on the maximum pore pressure after drainage.
Atmosphere 13 01314 g006
Figure 7. Effect of imbibition on permeability.
Atmosphere 13 01314 g007
Figure 8. Model of wet coal—numerical vertical in harmony-CBM. (x-y) Pressure, iteration no. 9 to 347.
Atmosphere 13 01314 g008
Figure 9. Simulation results of coalbed methane well production after the impaction of different imbibition degrees, (A) is the magnification of the intersection with the ordinate, (B) is the magnification of the cumulative production between 1800 d and 1820 d.
Atmosphere 13 01314 g009
Figure 10. Effect of imbibition length on gas well production when the thickness of the retained water film is constant, the subfigure is the magnification of the intersection with the ordinate.
Atmosphere 13 01314 g010
Figure 11. Effect of water film thickness on gas well production, the subfigure is the magnification of the intersection with the ordinate.
Atmosphere 13 01314 g011
Table 1. Statistics of various water saturations by the LF-NMR test for coal samples from Dahe block, Guizhou (confining pressure is 8 MPa, outlet pressure is 0.1 MPa).
Coal SampleTested by Saturated SamplesTested by Displaced Samples (1 MPa)Tested by Displaced Samples (2 MPa)Tested by Displaced Samples (4 MPa)Tested by the Samples with Residual Water
D-110088.5285.2883.9166.72
D-210097.5385.4076.1140.90
D-310081.3776.9471.3242.60
Table 2. Relevant parameters used for each model calculation.
ParametersValueReferenceParametersValueReference
Average pore radius r (nm)25NMR testReservoir temperature T (K)309Well logging
Original water saturation Swi0.1Well loggingPorosity ϕ0.06NMR test
Original pore pressure Pg0 (MPa)16Well loggingPore tortuosity τ1.3Micro CT
Pore length L (m)0.1HypothesisGas compressibility Cg (1/Pa)0.00609Industry-standard chart
Gas compressibility factor Z0.771Industry-standard chartGas viscosity μg (Pa·s)0.000018Industry-standard chart
Gas constant R (J/(K·mol))8.314Industry-standard chartMole content of adsorbed gas per unit area na (mol/m2)0.000008Isothermal adsorption experiment
Table 3. Maximum pore pressure immediately after drainage, matrix permeability, and water saturation within different imbibition degrees (qg is daily gas production, Gp is cumulative gas production).
Examplesx/L, h (m)Pcg, MPa K c g * , mDScwqg, Gp
Case 1x/L = 0, h = 0160.0032530.1qg, Gp
Case 2x/L = 0.12, h = 0.416.2140.0031360.1038qg1, Gp1
Case 3x/L = 0.3, h = 0.416.5380.0031160.10952qg2, Gp2
Case 4x/L = 0.3 m, h = 217.1720.0026120.14608qg3, Gp3
Case 5x/L = 0.5, h = 0.416.9020.0030940.11587qg4, Gp4
Case 6x/L = 0.3 m, h = 417.9670.0020700.18832qg5, Gp5
Case 7x/L = 0.9 m, h = 0.417.6450.0030500.12857qg6, Gp6
Publisher’s Note: MDPI stays neutral with regard to jurisdictional claims in published maps and institutional affiliations.

