Article

Assessment and Impacts of Air Pollution from Brick Kilns on Public Health in Northern Pakistan

1
Department of Environmental Sciences, Abdul Wali Khan University, Mardan 23200, Pakistan
2
Department of Civil Engineering, COMSATS University Islamabad (CUI), Abbottabad Campus, Abbottabad 22060, Pakistan
3
Department of Botany, University of Malakand, Chakdara 18800, Pakistan
4
Department of Environmental Sciences, COMSATS University Islamabad, Abbottabad Campus, Tobe Camp University Road, Abbottabad 22060, Pakistan
5
Department of Civil and Environmental Engineering, King Fahd University of Petroleum & Minerals, Dhahran 31261, Saudi Arabia
6
Interdisciplinary Research Center for Construction and Building Materials, King Fahd, University of Petroleum and Minerals, Dhahran 31261, Saudi Arabia
7
Research Centre, Future University in Egypt, New Cairo 11835, Egypt
8
Department of Earth and Environmental Sciences, Hazara University, Mansehra 21120, Pakistan
*
Authors to whom correspondence should be addressed.
Atmosphere 2022, 13(8), 1231; https://doi.org/10.3390/atmos13081231
Submission received: 6 June 2022 / Revised: 18 July 2022 / Accepted: 19 July 2022 / Published: 3 August 2022
(This article belongs to the Special Issue Air Quality in the Rural Areas)

Abstract

:
Brick kilns add enormous quantities of organic pollutants to the air that can cause serious health issues, especially in developing countries; poor air quality is associated with community health problems, yet receives no attention in Northern Pakistan. The present study, therefore, assessed the chemical composition and investigated the impacts of air pollution from brick kilns on public health. A field-based investigation of air pollutants, i.e., PM1, PM2.5 and PM10, CO2, CO, NO, NO2, H2S, and NH3 using mobile scientific instruments was conducted in selected study area locations. Social surveys were conducted to investigate the impacts of air pollution on community health. The results reveal the highest concentrations of PM1, PM2.5, and PM10, i.e., 3377, 2305, and 3567.67 µg/m3, respectively, in specific locations. Particulate matter concentrations in sampling points exceeded the permissible limits of the Pakistan National Environmental Quality Standard and, therefore, may risk the local population’s health. The highest mean value of CO2 was 529 mg/L, and other parameters, such as CO, NO, NO2, H2S, and NH3 were within the normal range. The social survey’s findings reveal that particulate matter was directly associated with respiratory diseases such as asthma, which was reported in all age groups selected for sampling. The study concluded by implementing air pollution reduction measures in brick kiln industries to protect the environment and community health. In addition, the region’s environmental protection agency needs to play an active role in proper checking and integrated management to improve air quality and protect the community from air hazards.

1. Introduction

Numerous sources of air pollutants are present indoors and outdoors, creating public health-related issues and receiving worldwide attention from researchers and policymakers in recent years [1,2]. Both anthropogenic activities and natural processes contribute to air pollution [3]. One of the primary anthropogenic sources of outdoor air pollutants is fossil fuel consumption. Globally, fossil fuels’ energy requirement is primarily satisfied, and the demand is expected to increase dramatically in the coming years due to population growth [4]. Air pollution-related health problems are comparatively higher in developing countries than in developed countries [5].
Brick kilns are one of the expected beneficiaries of fossil fuels, as their energy needs are met with the simultaneous emission of outdoor air pollution [6]. Usually, the brick kilns are built in rural or suburban areas where they use clay and topsoil as raw materials to produce bricks. Brick kilns play an important role in socio-economic uplift by meeting the rising demands of construction for the rapidly growing population of a country [7]. One of the concerns related to brick kiln processing is the emission of different types of organic and inorganic compounds into the environment that may result in ecosystem dysfunction [8]. For instance, in some of these chemical compounds, the particulate matter released by kilns in black dust is considered a risk to human health [9]. Over 1.1 billion people lived in areas where particulate matter (PM) concentration exceeded 35 µg from 2006 to 2012 [10]. Therefore, the increasing number of brick kilns can further exacerbate the environmental quality by adversely affecting the air quality.
Most of the brick kilns in Asia belong to poor people, and produce 140 million bricks per year [11]. These brick kilns mostly burn coal as a fuel source, resulting in SO2 and particulate matter (PM) emissions, causing poor air quality and associated health problems. For example, in Chinese villages, the smoke produced by coal burning in various daily activities, including brick kilns, is the leading cause of cancer [12]. In Kathmandu Valley, over 31% of PM was released by brick kilns in 1993 [13]. In India, the air pollution problem exists more in populated areas, and PM concentrations are more significant than normal [14]. Air pollution accounts for an estimated 9% of deaths due to lung cancer, 17% due to chronic obstructive pulmonary disease, more than 30% due to ischemic heart disease and stroke, and 9% due to respiratory infections [15]. The recent global pandemic, i.e., COVID-19, primarily a respiratory disease [16], may be intensified in people exposed to air pollutants from brick kilns. The viruses may enter the air passage through air inhalation of polluted air by the sneezing or coughing of the infected person [17]. The number of deaths due to these respiratory diseases may increase many-fold due to inhaling such polluted air [18]. Based on these consequences, special protective measures are necessary to protect community health [16].
In Pakistan, the primary source of PM is burning fossil fuels through small- and large-scale industrial operations, such as brick kilns, power plants, and transportation. The ambient air in most cities of Pakistan was found to have various air pollutants in higher concentrations than the level recommended by the WHO [19]. Air pollution in Pakistan accounted for 22,600 deaths in 2005, with over 9000 due to PM2.5µ [20]. In Pakistan, 70 million people, including 40% of children, suffer from respiratory diseases due to air pollution [18,21].
The population of Pakistan is increasing at a growth rate of 2.08%, and in order to meet the needs of the enormous population, brick kilns are working day and night all over the country. Presently, 2400 brick kilns are working in Pakistan, and the number is increasing every day [19]. Brick kilns in Pakistan use coal and wood for baking bricks and other raw materials, such as dried animal waste, rubber tires, plastic bags, and used footwear [22]. These brick kilns are a source of massive emissions of greenhouse gases [23].
The Union Council Jalala, in District Mardan (northern Pakistan), is famous for brick production and decade-old brick kilns in Khyber Pakhtunkhwa (KPK). Smoke due to coal combustion in brick kilns causes air pollution in the neighbouring areas, posing a threat to public health. Previously, no intensive research study was conducted to assess air pollution and its associated health risks. The current study measured air pollution (i.e., NO2, CO2, CO, NO, NH3, and H2S, PM1, PM2.5µ, and PM10µ) from brick kilns using relevant scientific assessment techniques and social surveys to assess the local health profile.

2. Materials and Methods

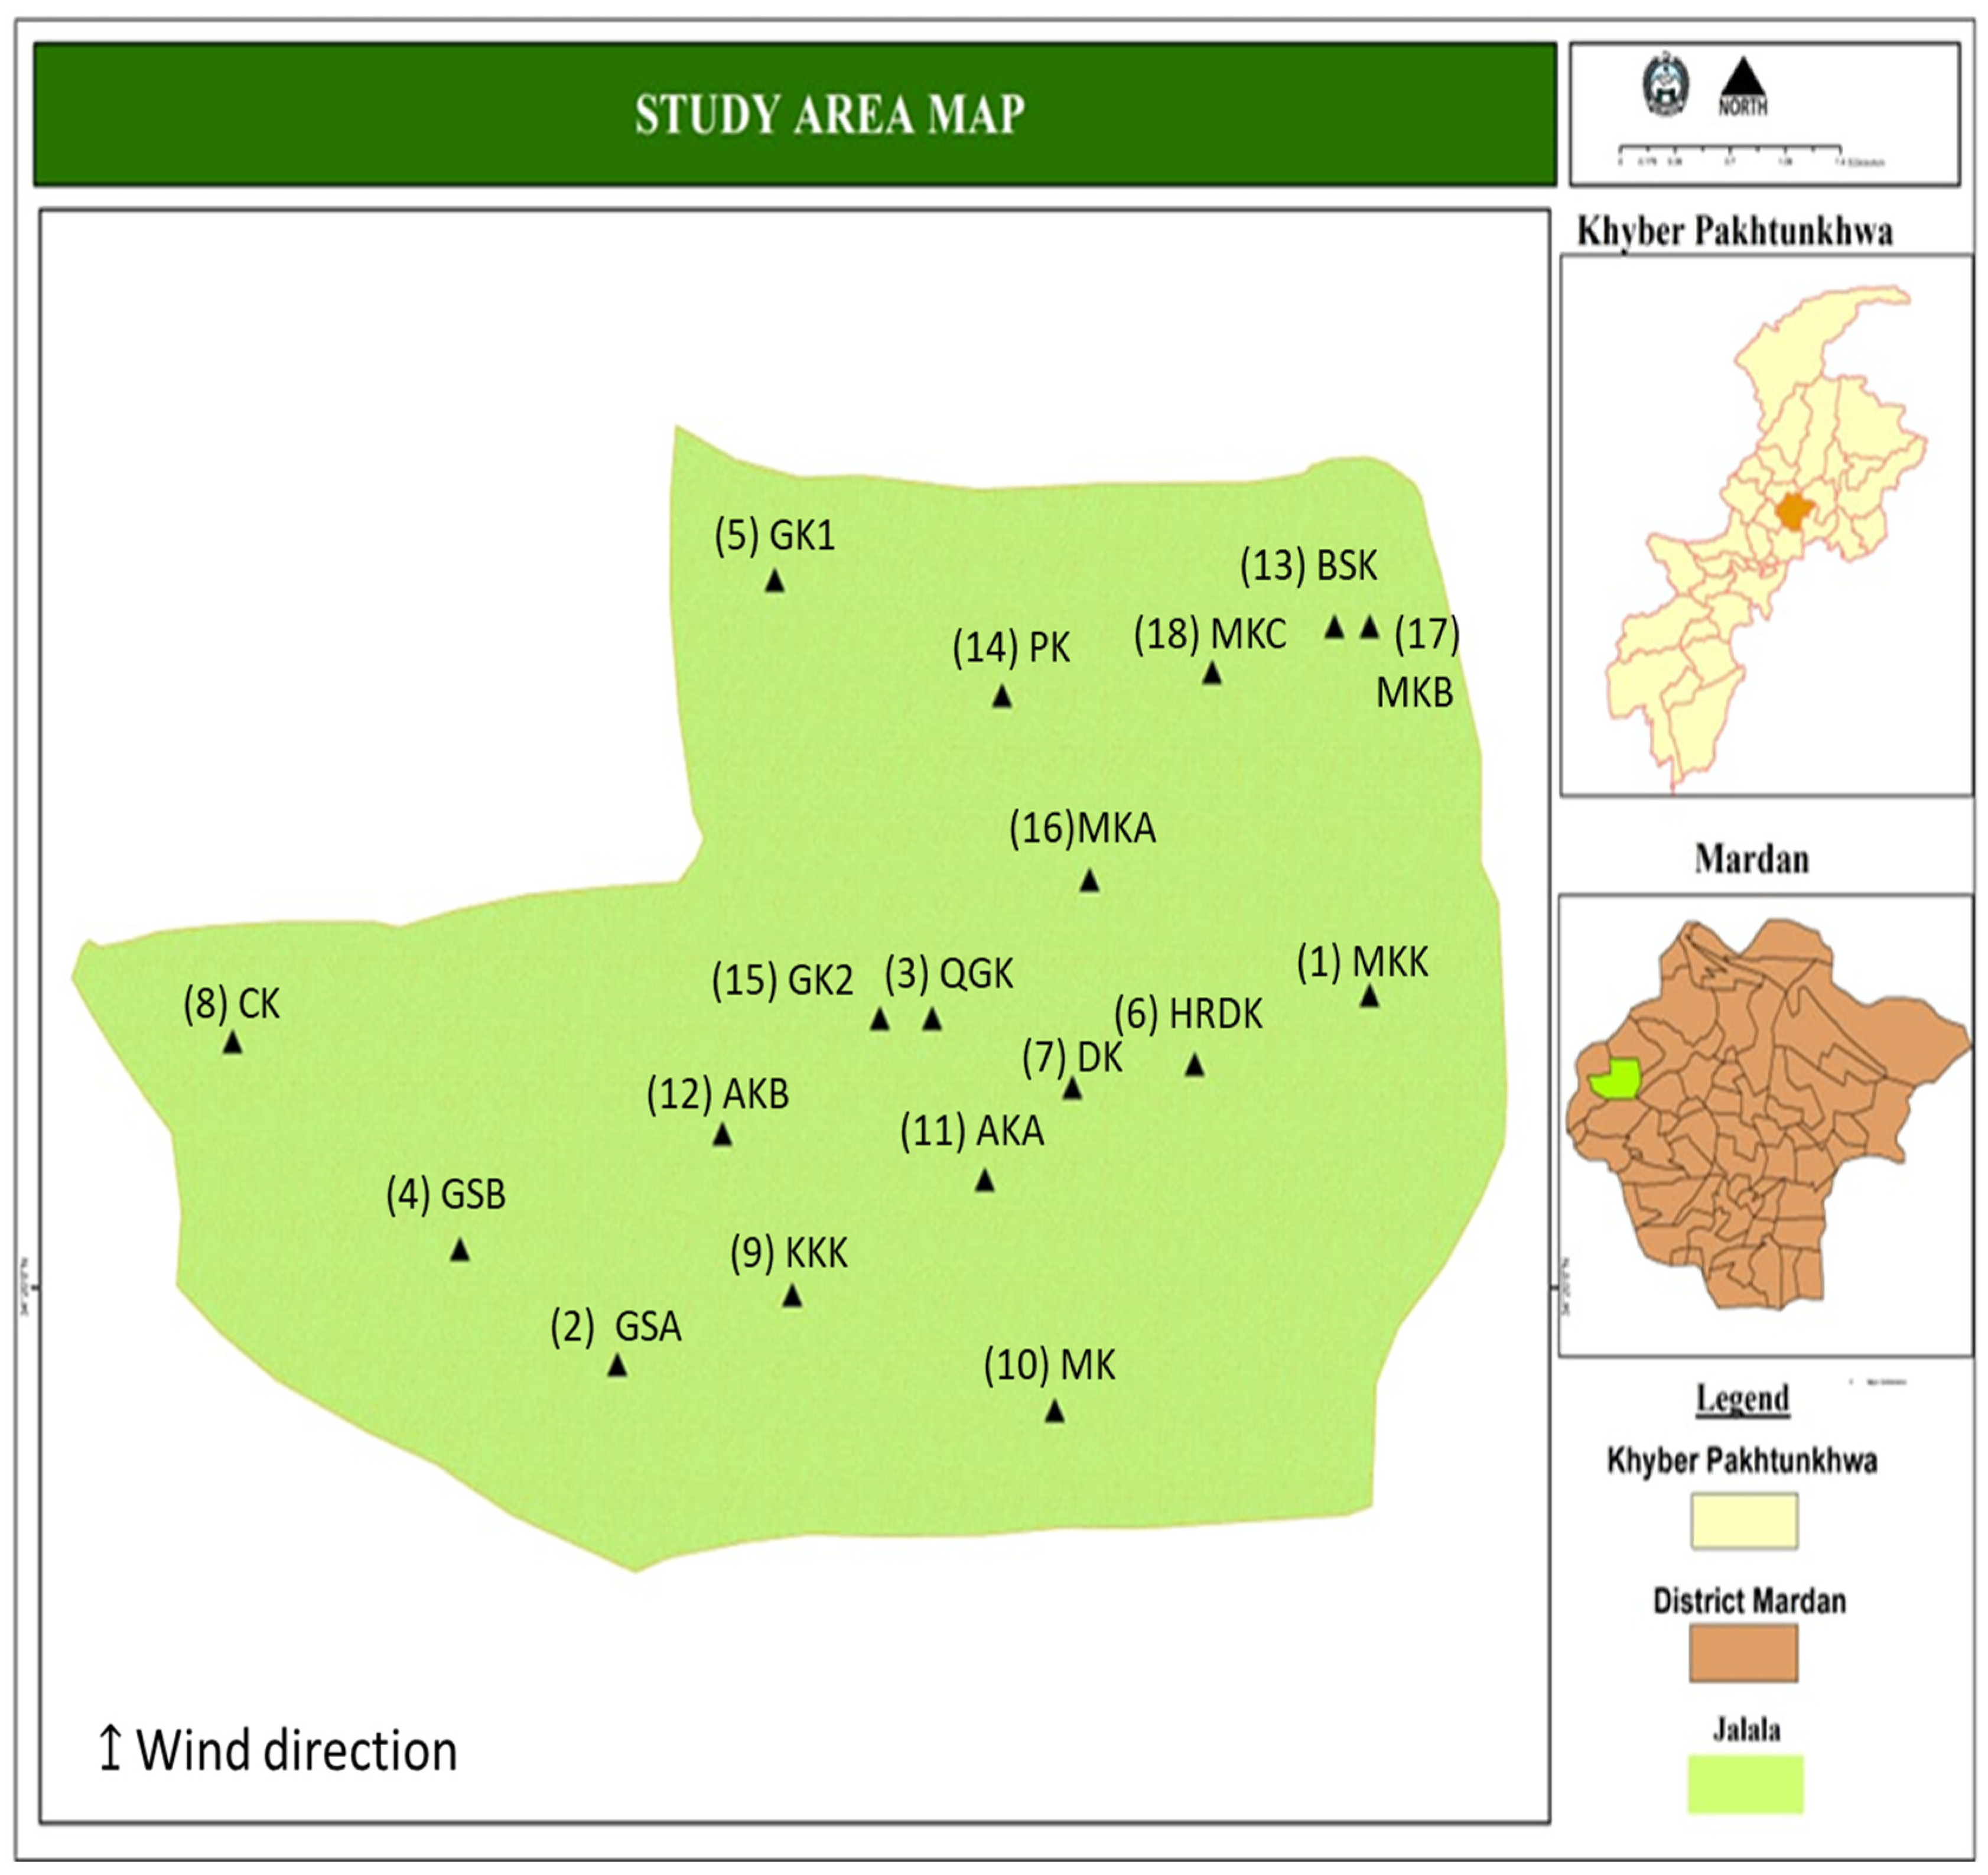
2.1. Study Area and Sampling Design

The study area is located in the Mardan District of Khyber Pakhtunkhwa (northern Pakistan). It lies at 34.330057 N 71.90812 E and has an altitude of 339 m from sea level, as shown in Figure 1, and is situated about 20 Km north of Mardan. The Malakand road leads through the village, linking the Swat Valley to Mardan and Peshawar. During biomass burning, air pollution is produced. In the study area, the brick kilns are increasing, further polluting air quality and causing different types of diseases in the local community.
Several field visits were arranged to observe the movement of air, number of operational brick kilns, hours of operation, and wind direction. Residents’ opinions were also considered to get the overall picture of the study area and select the most affected sites therein. A total of six quadrates were selected based on the field observation for air quality monitoring. In each quadrate, three sampling sites were selected for air quality monitoring based on the location of brick kilns.
The composite sampling method was used for collecting air samples from selected locations. Samples were collected from three points from the same air direction in the study area. The time of sample collection was twenty-four hours. A continuous sampling method was used for sample collection, depending on the location weather prediction from the Meteorological Department. The sampling time of around 12 o’clock was chosen because the weather in the study location is normally clear and sunny, and the breeze is quiet.

2.2. Particulate Matter and Air Pollutants Analysis

Different parameters, including NO2, CO2, CO, NO, NH3, H2S, PM1, PM2.5, and PM10, were monitored using field-based mobile instruments shown in Table 1, which presents the selected sampling sites and their distances from brick kilns. The air quality field sampling was carried out on the 27th and 28th of December 2018. The reason for choosing December for air sampling was the prevalence of the dry season in the study area and the maximum operation of kiln units due to the demand for bricks for construction in the winter. Moreover, households consume more fuel for heating during the winter. So, the selected time was considered the most polluted month in the study area, which was also reflected in the health profile of the study area.
The bricks kilns’ PM was measured using HAZ dust particulate air monitoring equipment (EPAM-5000, USA). EPAM-5000 is a portable instrument used to scatter light and measure particulate matter (PM). Air was continuously monitored for 24 h by the PM analyzer to obtain a maximum and minimum PM value. The measured PM ranged from PM1, PM2.5, and PM10. A specific filter was used to determine the particulate matter for each sample. The EPAM-500 stored particles automatically in the given. time. The average data are considered at the end of each test [24]. The analysis were carried out in Pakistan Council of Scientific and Industrial Research (PCSIR), Peshawar, Khyber Pakhtunkhwa, Pakistan.
Analyses of NO2, CO2, CO, NO, NH3, and H2S were performed in this study and measured with the help of an ambient air monitoring analyzer (NOVA Model 600-2-3-4-5-7-10, Canada) as shown in Table 2. The portable multi-gas Nova 600 Series, which monitors up to six gases from samples of ambient breathable air, is easy and portable with ambient air analyzers. The sample gas is drawn in by an integrated pump and examined by various sensors. We obtained the multiple readings of different gases such as NO2, CO2, CO, NO, NH3, and H2S. The device was placed on a stand to maintain ground clearance and sucked the air with the help of a 2 m long pipe. The data were recorded in mg/L.

2.3. Qualitative Data Collection and Analysis

Different techniques were used for qualitative data collection, including focus group discussions (FGD), to identify the possible outdoor air quality related to residents’ health issues. In addition, FGD helped educate the local community about the relationship between fuel burning practices and their effects on air quality. Approximately 50 questionnaires were distributed, which asked different questions about the brick kiln’s health impact on the study area’s local people. Questionnaires were randomly distributed in the selected study area containing both open- and close-ended questions to collect information about the health risks associated with air pollution. Personal interviews were also conducted to obtain detailed information about the local health issues related to air quality. Different NGOs were also approached to get relevant information about their interventions in the study area. The data were presented using bar graphs in graph pad version 8.0, while maps were designed using Arc-GIS version 10.5.

3. Results

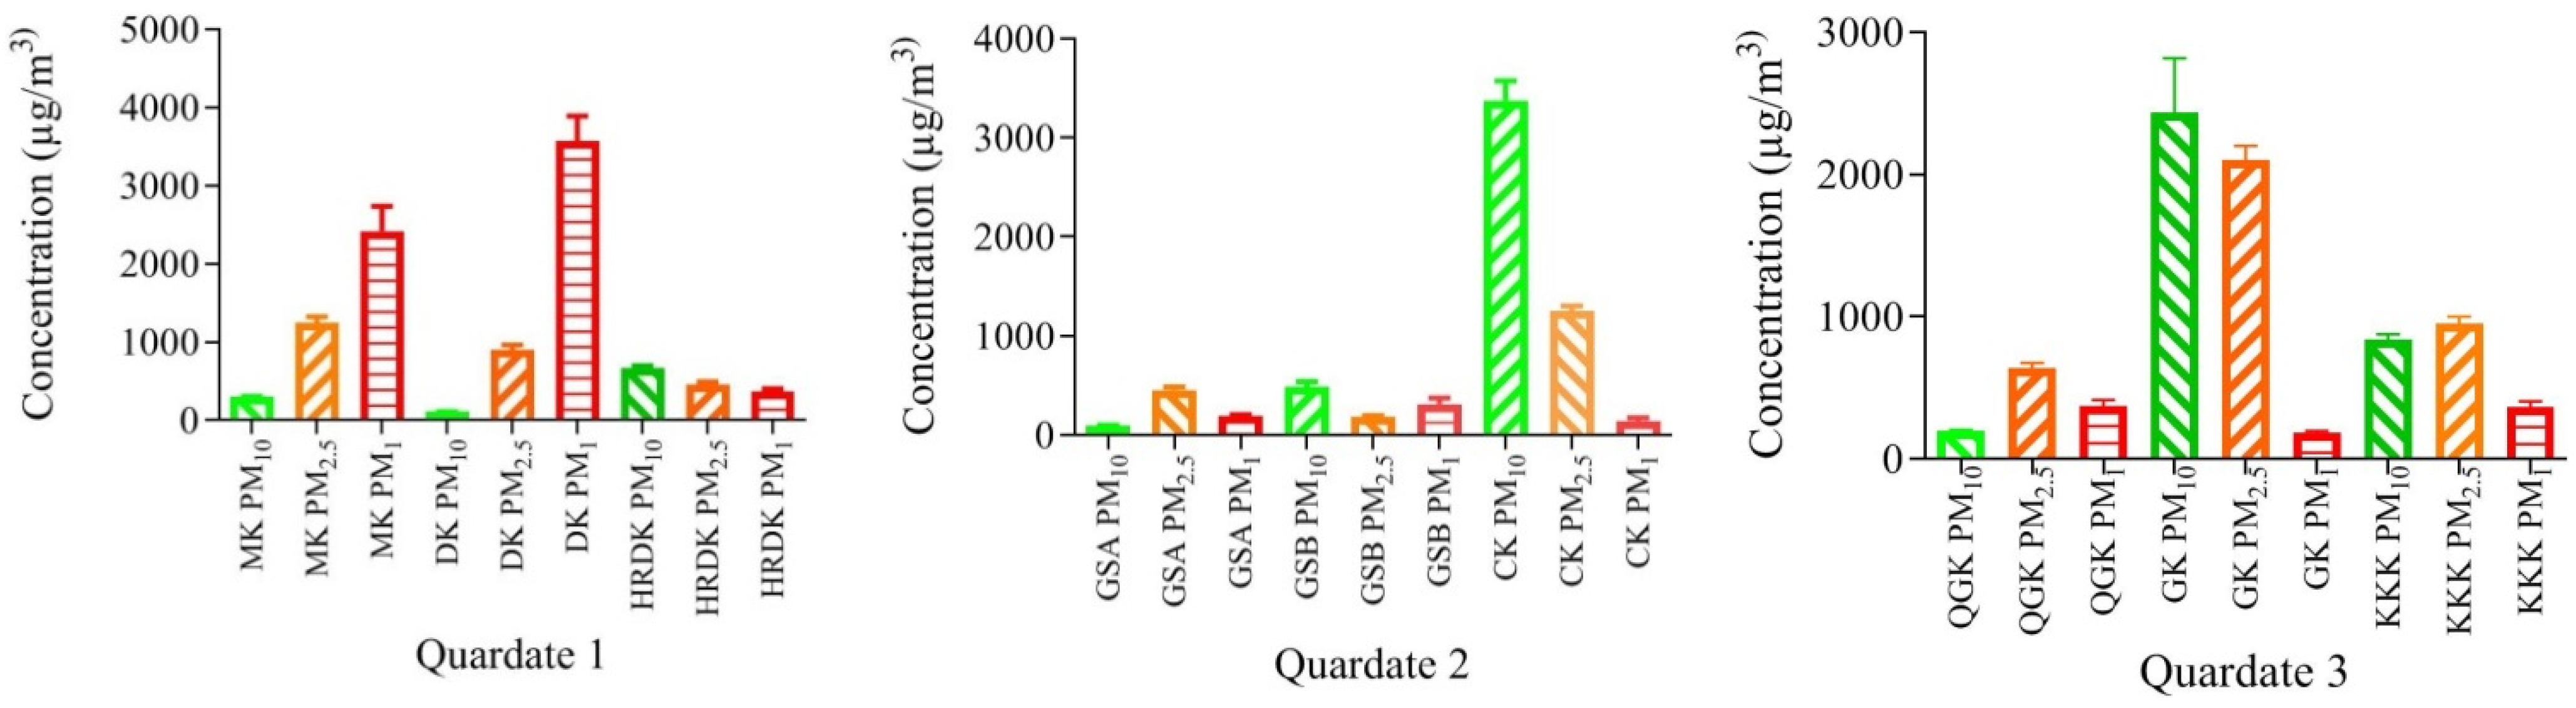
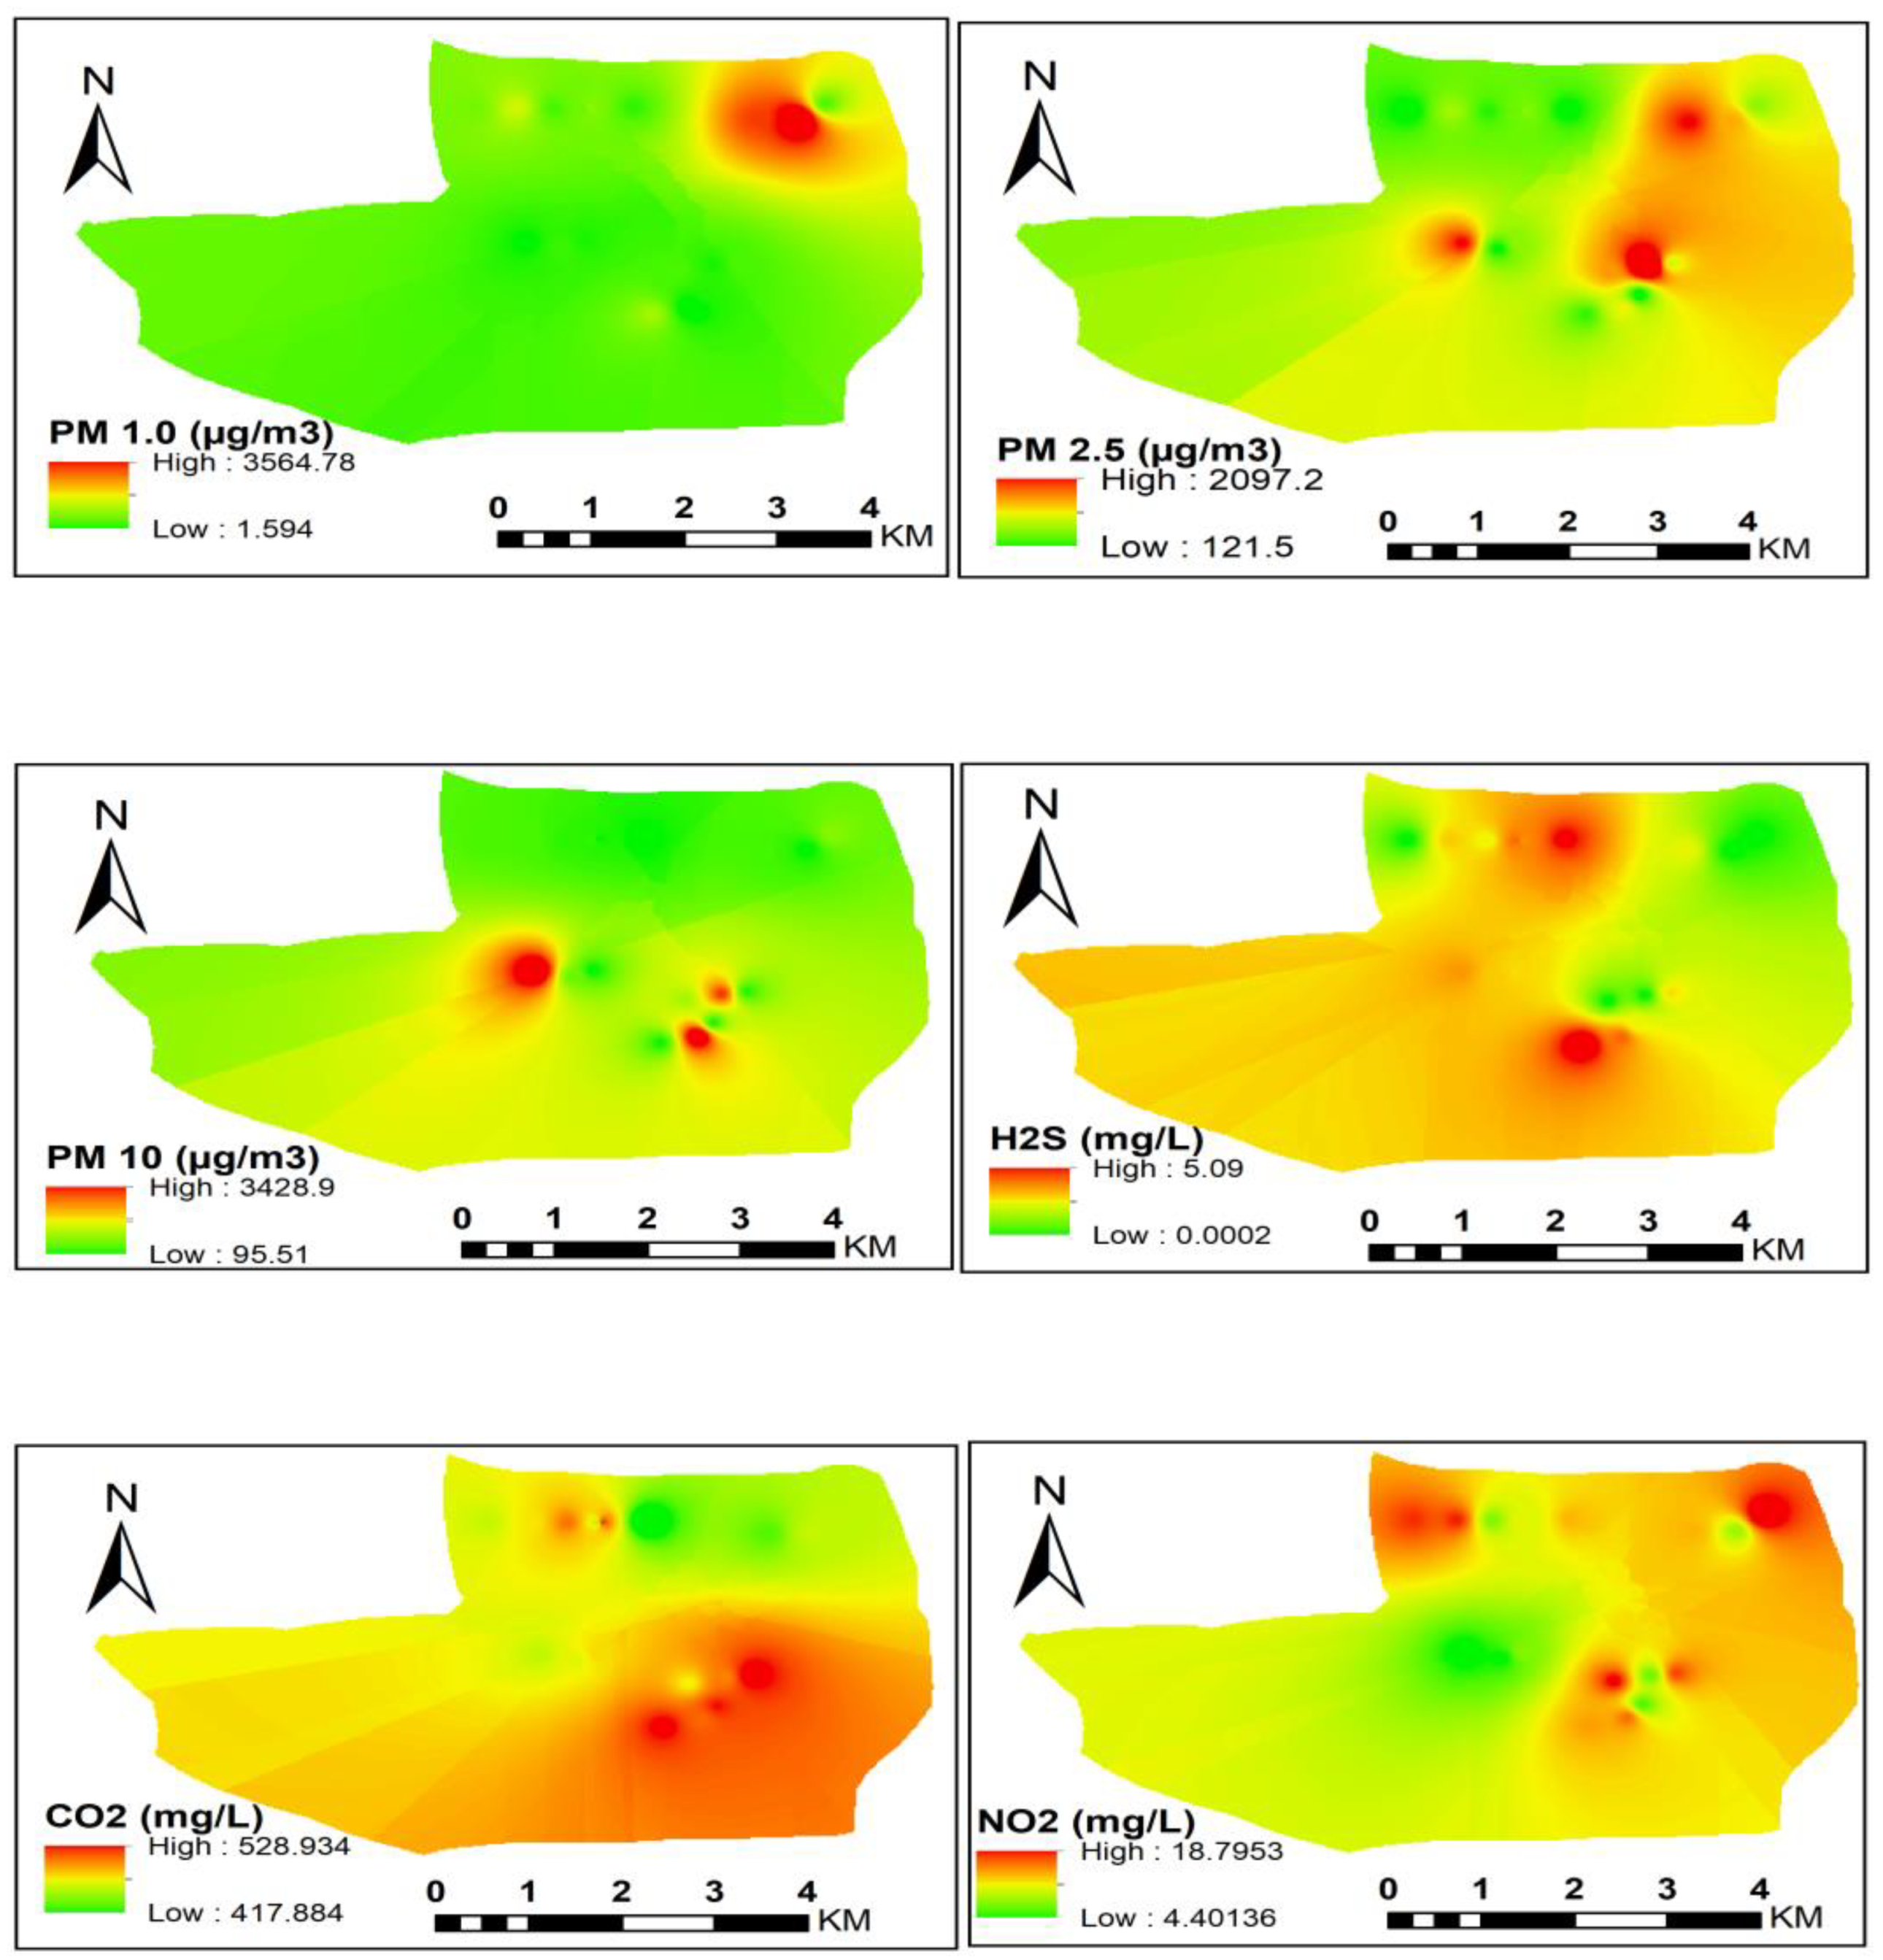
3.1. Concentrations of Particulate Matter

Figure 2 presents PM (PM10, PM2.5, and PM1) concentrations in three selected sampling quadrates. Table 3 presents the detailed information of the selected quadrates and the sampling points with codes. In the first quadrate, three points were selected for data collection. The first sampling site was (MMK), the second sampling site (HRDK), and the third sampling site (DK). According to the details, the concentrations of PM10, PM2.5, and PM1 were 301, 1246, and 2419.33 µg/m3, respectively. Similarly, in the second point, PM10, PM2.5, and PM1 were 105.66, 905.33 and 3567.67 µg/m3, respectively, in HRDK. Lower concentrations of PM10, PM2.5, and PM1, were 663.33, 451, and 367.66 µg/m3, respectively, recorded on the assessment day at DK.
In the second quadrate, the concentrations of different parameters of PM were measured in three different places within the study area. The mean values of PM10, PM2.5, and PM1 were 94.6, 455.33, and 196 µg/m3, respectively, in GSA on the assessment day. PM10, PM2.5, and PM1, were 486, 190, and 313 µg/m3, respectively, in GSB. The concentrations of PM10, PM2.5, and PM1, were 3377, 1250.67, and 139.33 µg/m3, respectively, in CK.
The mean values of different parameters were measured in three different places of the third quadrate. PM10, PM2.5, and PM1 were 199.66, 637, and 371.33 µg/m3, respectively, in QGK. Similarly, in GK on the assessment day, PM10, PM2.5, and PM1 values were 2434.33, 2101.33, and 186.33 µg/m3. The concentrations of PM10, PM2.5, and PM1, were 840, 951.33, and 366 µg/m3, respectively, in KKK.
In the 4th quadrate, three points were selected for data collection. The 4th sampling site was (MK), the second sampling site (AKA), and the third sampling site (AKB), according to the details given in Table 2. PM10, PM2.5, and PM1 were 140.6, 262.2, and 849.96 µg/m3, respectively. Similarly, in the second point, PM10, PM2.5, and PM1 were 1175, 710.26, and 743.33 µg/m3, respectively, in AKA. Similarly, PM10, PM2.5, and PM1 were 152.2, 118.83, and 2180.43 µg/m3, respectively, recorded on the assessment day at AKB.
The mean values of different parameters were measured in three places of the 5th quadrate. PM10, PM2.5, and PM1 were 123.8, 445.46, and 751.43 µg/m3, respectively, in BSK. Similarly, PM10, PM2.5, and PM1 values were 329.4, 501.5, and 1140.1 µg/m3, respectively, in PK on the assessment day. PM10, PM2.5, and PM1 concentrations were 335.13, 172.3, and 575.46 µg/m3, respectively, in GK.
In the 6th quadrate, the concentrations of different parameters of PM were measured in three different places in the study area. The mean values of PM10, PM2.5, and PM1 were 117.13, 174.33, and 258 µg/m3, respectively, in MKA on the assessment day. The concentrations of PM10, PM2.5, and PM1, were 277.3, 348.83, and 486.33 µg/m3, respectively, in MK (point B). The concentrations of PM10, PM2.5, and PM1 were 284, 1250, 242.8, and 340.9 µg/m3, respectively, in MK. Figure 2 shows the concentration of particulate matter PM1, PM2, and PM10 in the study area.

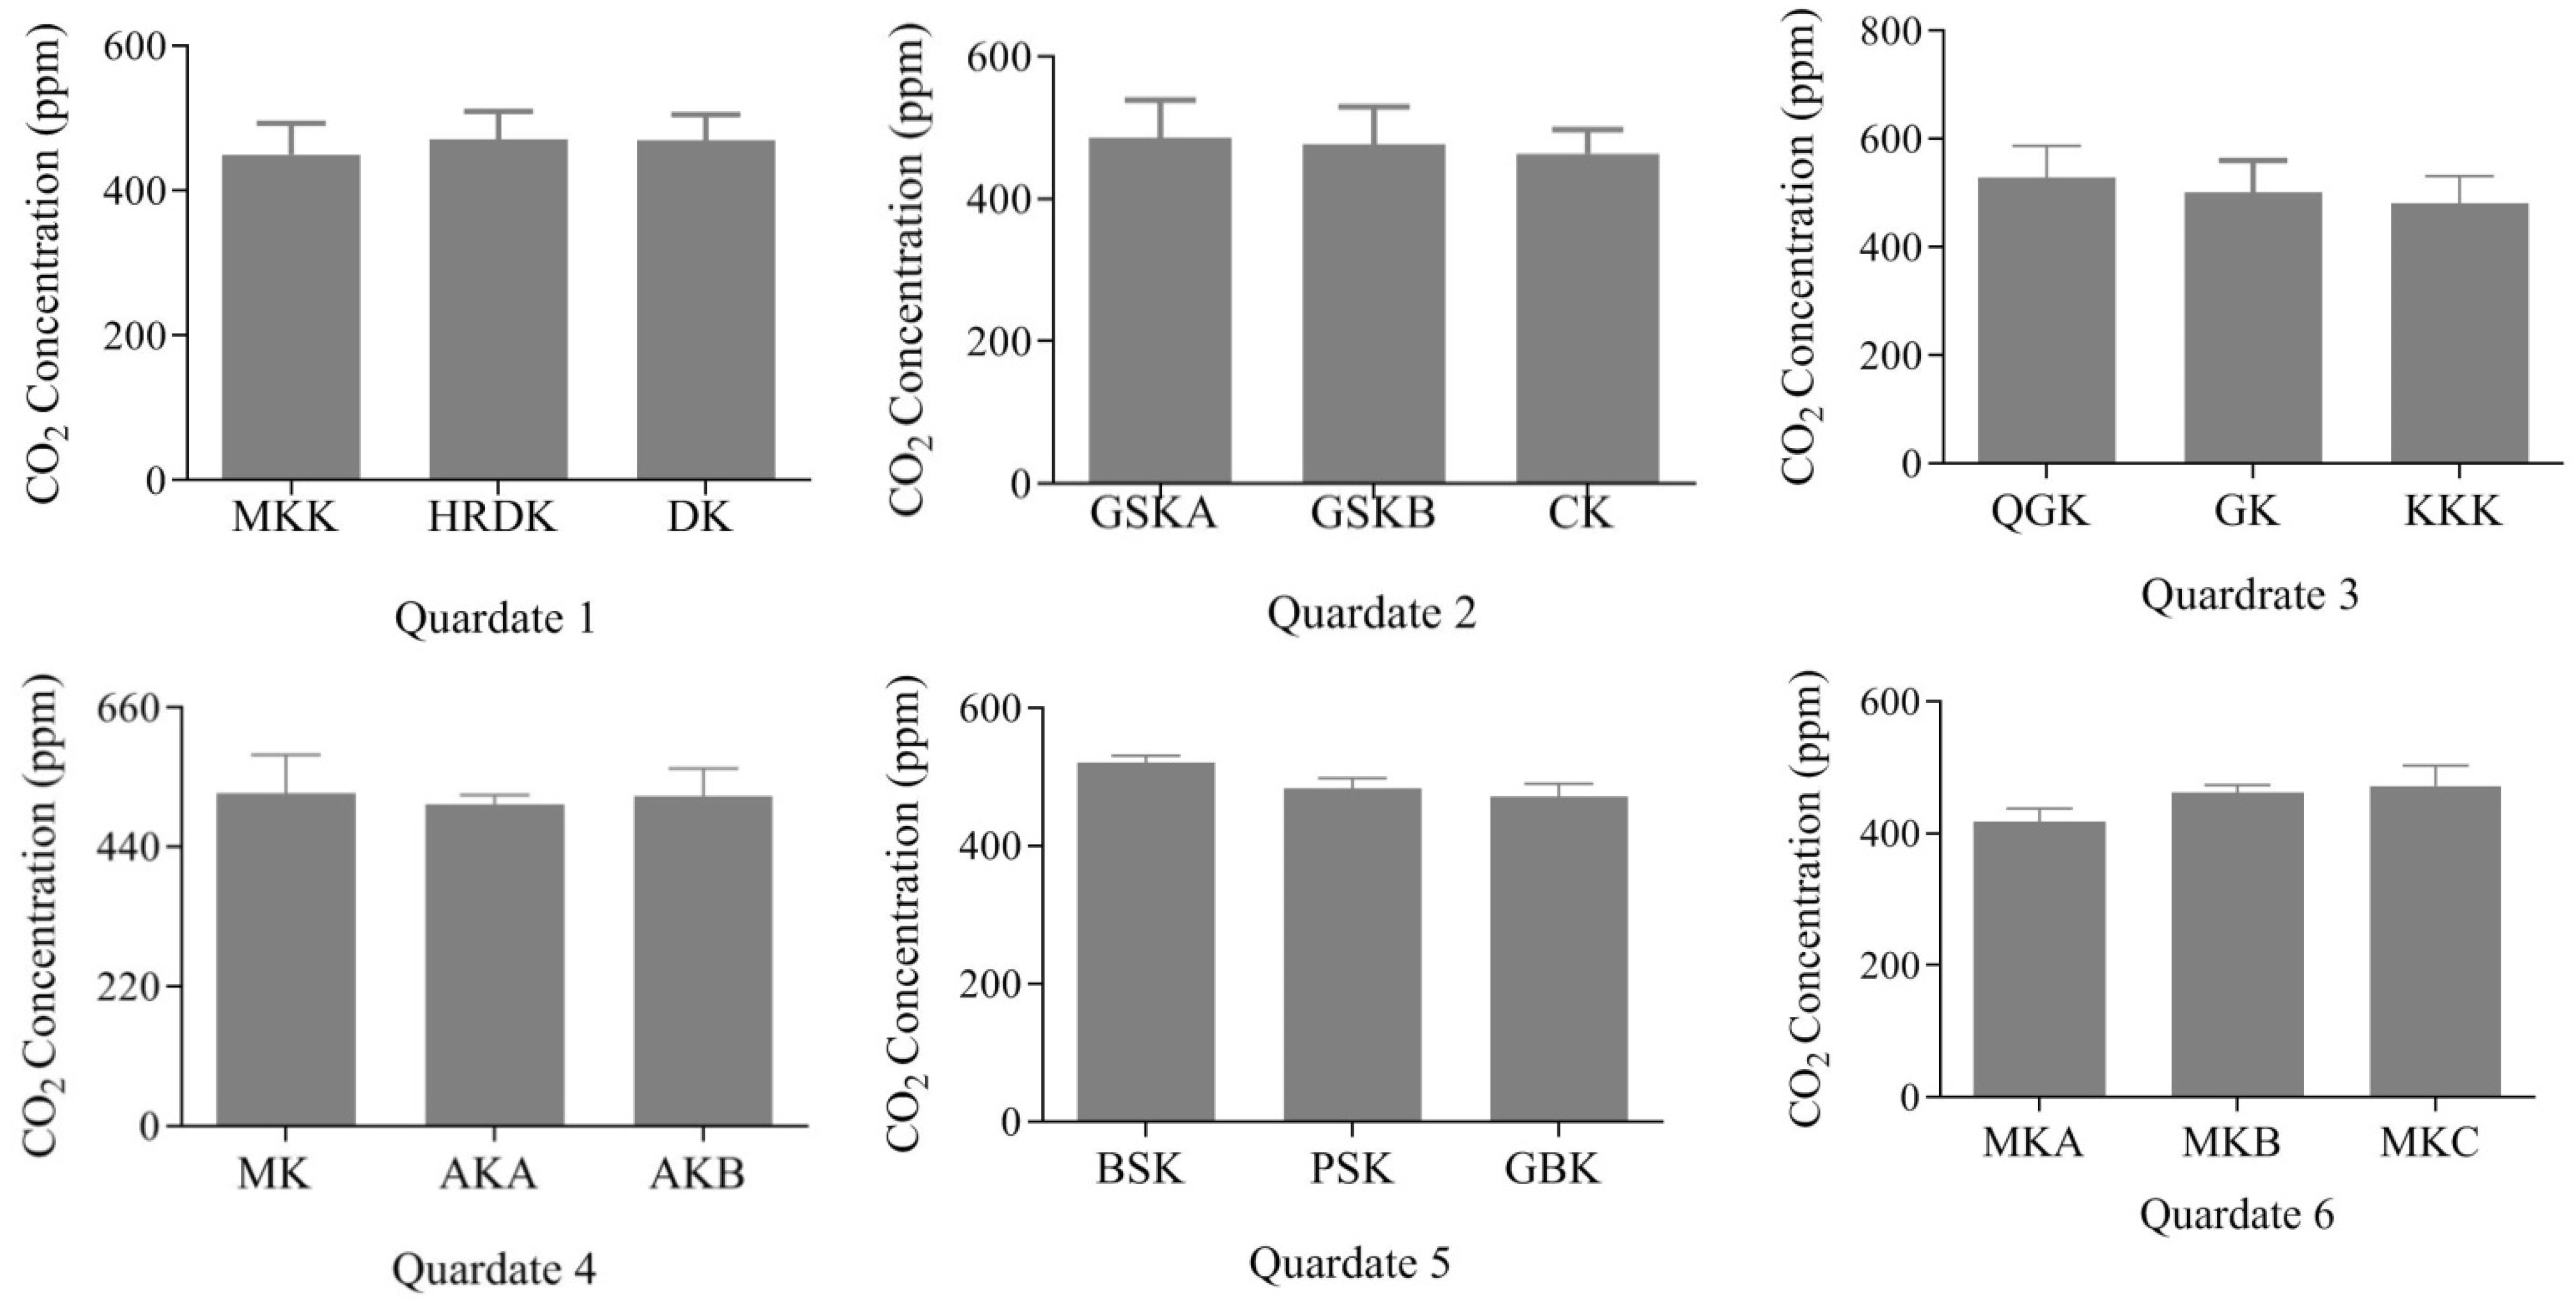
3.2. Concentrations of CO2

Figure 3 present CO2 concentrations in three selected sampling quadrates. The mean values of CO2 in all quadrates are shown in the following figure. Table 2 presents the detailed information of the selected quadrates and the sampling points with codes. In the first quadrates, the concentration of CO2 in MKK, HRDK, and DK were 450.1, 470.8, and 469.2 mg/L, respectively. The mean values in the second quadrant in GSKA, GSKB, and CK were 486, 477, and 469.9 mg/L, respectively, in the study area, as shown in Figure 3. The concentrations of CO2 were 529, 501.76, and 480.33 mg/L, respectively, and were recorded on the assessment day in QGK, GK, and KKK, respectively. In the 4th quadrant, the concentration of CO2 in (MK), the second sampling site (AKA), and the third sampling site (AKB) were 523.6, 506.8, and 519 mg/L, respectively. The mean values in the 5th quadrant in BSK, GK, and CK were 520, 483.1, and 470.9 mg/L, respectively, in the study area, as shown in Figure 3. The concentrations of CO2 were 417.8, 461.6, and 505.1 mg/L, respectively, and were recorded on the assessment day in MKA, MKB, and MKC, respectively.

3.3. Concentrations of Other Parameters

The mean values of CO, H2S, NO, NO2, and NH3 in different places are given in Table 3. In the first quadrate, the concentrations of different parameters, such as H2S and NO2, were 2 and 12.4 mg/L, respectively, in MKK. In HRDK, the concentration of NO2 was 8.1 mg/L; similarly, the concentration of NO2 was 18.1 in DK during the assessment day. The concentrations of NO2 and H2S were 7.5 and 2.36 mg/L, respectively, in GSKA, while the concentrations of NO2 and H2S were 5 and 2.5 mg/L, respectively, in GSKB. The mean value of NO2 was 4.4 mg/L in CK. In the 3rd quadrate, NO2 and H2S were 15.3 and 2.3 mg/L, respectively, in QGK. The mean value of NO2 was 6.9 mg/L in GK, while the concentration of NO2 was 16.8 mg/L in KKK. In the 4th quadrate, the concentrations of different parameters, such as H2S and NO2, were 5.1 and 13 mg/L, respectively, in MK. In AMA, the concentrations of NO2 and H2S were 14.3 and 3.5 mg/L. Similarly, the concentrations of NO2 and H2S were 6.1 and 2 in AKB during the assessment day.
In the 5th quadrate, NO2 and H2S were 9.9 and 3 mg/L, respectively, in BSK, while NO2 and H2S were 16 and 2.5 mg/L, respectively, in PK. The mean value of NO2 was 15.7 mg/L in GK. In the 6th quadrate, NO2 and H2S were 12.4 and 4.3 mg/L, respectively, in MKA. The mean value of NO2 and H2S were 10.3 and 3.5 mg/L in MKB, while the concentration of NO2 and H2S were 7.4 and 2 mg/L in MKC. Table 3 shows the concentration of CO2, NO2, and H2S in the study.
Figure 4 presents disease prevalence in the study area. Overall, the results show that all age groups were affected by the high concentrations of PM and CO2. The health implication of particulate matter released from brick kilns was assessed using a questionnaire survey. Fifty questionnaires were distributed randomly in the study area during the social survey. The survey findings indicate that brick kiln pollution affected children, women, and old people 40%, 8%, 18% and 34%, respectively, in the study area. All of the respondents positively related the health issues with the presence and operation of brick kilns in the study area.
Different diseases in the study area were reported earlier, and the most common diseases included eye irritation, respiratory diseases, headache, and skin diseases with the percentages of 10%, 62%, 18%, and 10%, respectively.

4. Discussion

Brick kilns are essential to the country’s economy and are more prevalent in Pakistan due to the availability of coal for fuel purposes [25]. These Kilns add various types of air pollutants that cause disturbance of air quality, as well as pose a health risk to the human population [26]. In the present study, the concentrations of PMs were higher than the normal range in the study area District Mardan. Twelve brick kilns were under operation during the assessment day in the study area. In Pakistan, brick kilns are the source of massive emissions of greenhouse gases, such as SOx, Cox, and NOx, and various types of PM [24]. The results reveal that the highest concentrations of PM1, PM2.5, and PM10 were 3377, 2305, and 3567.67 µg/m3, respectively, recorded in the study area. Many studies show that brick kiln operation in an area may greatly increase the PM above the normal range [15,26]. According to the NEQS, 80% of PM samples exceeded the normal range in Pakistan [25]. PM concentrations in two sampling points were found below the normal range, whereas the remaining points exceeded the permissible limits set by NEQS. In addition, [26] it is stated that any activity in the environment where the PM exceeds 500 µg/m3 concentration should be banned from operation. However, in developing countries, especially in Pakistan, the situation is quite worse, and the implementation level of related policies is being neglected.
PM10 concentration depends on the density of PM, the height of the chimney from where it is released, and the region’s geography. [27] demonstrated that the PM can cover more than 100 km distance, and its concentration depends on geography. Similarly, wind direction plays an important role in increasing or decreasing PM levels. Our results show that PM10, PM2.5, and PM1 are affected by geographical locations and wind directions, as shown in Figure 5. Wind speed plays an essential role in the dispersion of smoke and reducing the concentration of PM. During low wind, the smoke was not appropriately dispersed. For instance, the ambient air quality of Islamabad (Pakistan) reveals that the annual average mass concentration of PM2.5 from 45 to 95 μg/m3 and NO from 41 to 120 μg/m3 exceeds Pakistan’s NEQS [28,29] recently reported that the air pollutants are causing different diseases such as eye, skin, and heart diseases. The problem of the respiratory system is mostly associated with PM if it contains toxic substances [30]. Thus, the mentioned PM’s presence is negatively associated to the health issues in the study area.
The concentrations of different parameters, such as NO, NH3, CO, NO2, and H2S, were also measured. The mean values of CO2 were high because sugarcane cottage industries were under operation during the assessment day. The highest mean value of CO2 was 529 mg/L, and other parameters such as CO, NO, NO2, H2S, and NH3 were within the normal range. The highest mean value of CO2 was 529 ppm, and other parameters such as CO, NO, NO2, H2S, and NH3 were within the normal range. PM and CO2 concentrations were higher than the normal range in the study area. Similarly, an evaluation determined the PM level in Niazi and Daewoo bus stations in Lahore and revealed that the average concentration of PM2.5 was 460 g/m3. In comparison, the concentration of PM10 was 602 g/m3 and is more significant than what is prescribed by the WHO. Some researchers, e.g., [31], studied that the ambient air pollution of Faisalabad (Pakistan) and found the average level of CO (7 mg/L), SO2 (62 µg/L), NO2 (66 µg/L), and PM was 305 to 534 μg/m3 for 24 h. Likewise, in the city of Peshawar, the average PM2.5 value was 286 µg/m3, and the average PM10 value was 638 µg/m3 [32]. Block industries should replace these brick kiln industries because it produces less pollution than the brick kiln industry.
Thus, the mentioned PM’s presence is negatively associated to health issues, such as eye irritation, respiratory diseases, headaches, and skin diseases in the study area. In Kathmandu, the average value of PM was 0.50 g/m3 during brick kiln operations, whereas 50% of the respondents have respiratory health-related issues [33]. PM increased the death rate and was linked to several disorders, including respiratory and cardiovascular conditions [34]. Some people have trouble breathing, while others experience skin irritability. Air quality significantly impacts people’s daily activities because air pollution produces a variety of severe health risks due to the release of harmful chemicals, and its effects vary from person to person. According to the survey, 4.15 percent of the respondents thought they had a respiratory disease, 28.5 percent thought they had skin conditions, and 18.9 percent were depressed. However, they have eyes, nose, and throat irritation from too much kiln dust and smoke [35].
The social survey revealed that PMs were directly associated with respiratory diseases, such as asthma, with similar effects in all age groups. Children are more susceptible to air pollution than adults [35]. In Karachi, over 70 million people suffer from different disorders, including 40% from respiratory diseases due to air pollution [18]. Studies show that over 70 million people in Karachi, including 40%, suffer from respiratory diseases due to air pollution. About 10% of people have a primary education in the study area, and no one uses protection, such as masks, against air pollution. Different diseases (sometimes resulting in deaths) are associated with particulate matter. Studies reported that death rates were higher in children due to respiratory infection [27]. Studies by [36], found that death rates were mostly higher in children due to respiratory infection. Findings from the present study suggest implementing strong control measures against air pollution by brick kilns. In case of noncompliance, these kilns should be fined or barred from operation to protect the local health, particularly of the women and children. A study reported a significant occurrence of 31.8% chronic cough, 24% chest tightness, and 26.2% chronic phlegm in brick kiln employees [37,38,39]. In the present study, air quality monitoring was limited to areas where work was in progress; to overcome this limitation, future studies will need to focus on more functional sites and also extend to the workers in the kilns.

5. Conclusions

The present study conducted the concentration of different air pollutants and their impacts on the local community in Jalala (Mardan). Results show that the concentrations of PM1, PM2.5, and PM10 were higher than the normal range prescribed by Pakistan’s NEQS. While the concentrations of CO, NO, NO2, H2S, and NH3 were within the normal range. The highest mean value of CO2 was 529 mg/L, and other parameters, such as CO, NO, NO2, H2S, and NH3 were within the normal range. The social survey’s findings revealed that PMs were directly associated with respiratory diseases, such as asthma and skin diseases, in all age groups within the study area. Thus, the present study’s findings provide insights into the concurrent air quality situation in the study area, which can be useful for planners and policymakers. Moreover, the best course of action is not only to limit and shut down outdated brick kilns, but also to surround them with greenery as a practical strategy to purify the air. Additionally, technical capacity development initiatives must be started to help brickmakers reap the benefits of clean technology.

Author Contributions

M.S. collected that initial data for the study. S.U. supervised the research study M.F.J. provide insight into data analysis. R.U. provide support in manuscript writing and data visualization. T.A.A. edit the manuscript and visualized the results and its interpretation. W.U. helps in writing the initial draft and data analysis. S.A.B. provides the research designed and experimental data acquisition. M.A. help in editing and provide the background information’s. A.M. edit the manuscript and provide the funds for publication. R.U.S. provide support in analysis in software. All authors have read and agreed to the published version of the manuscript.

Funding

The research has not funded by any national or international funding agency.

Institutional Review Board Statement

Not Applicable.

Informed Consent Statement

Not Applicable.

Data Availability Statement

All the data presented in the manuscript.

Acknowledgments

The authors are thankful to Inayat Rahman and Ilyas PCSIR, Peshawar, who helped in conducting field-scale tests.

Conflicts of Interest

The authors declare conflict of interest regarding the processing and possible publication of the manuscript.

References

  1. WHO. Household Air Pollution and Health. Fact Sheet 292. Available online: https://www.WHO.int/mediacentre/,2012.factsheets/fs292/en/ (accessed on 15 February 2017).
  2. Ladrigan, P.J.; Fuller, R.; Acostta, N.I.R.; Adayi, O.; Arnold, R.; Basu, N.; Baldé, A.B.; Bertollini, R.; Bose-O’Reilly, S.; Boufford, J.I.; et al. The lancet commission on pollution and health. Lancet 2018, .391, 462–512. [Google Scholar] [CrossRef] [Green Version]
  3. Fereidoun, H.; Nourddin, M.S.; Rreza, N.A.; Mohsen, A.; Ahmad, R.; Pouria, H. The effect of long-term exposure to particulate pollution on the lung function of Teheranian and Zanjanian students. Pak. J. Physiol. 2007, 3, 1–5. [Google Scholar]
  4. Coyle, E.D.; Simmons, R. DA Understanding the Global Energy Crisis; Purdue University Press E-Books: West Lafayette, IN, USA, 2014. [Google Scholar]
  5. Ismail, M.; Muhammad, D.; Khan, F.U.; Munsif, F.; Ahmad, T.; Ali, S.; Khalid, M.; Haq, N.U.; Ahmad, M. Effect of brick kilns emissions on heavy metal (Cd and Cr) content of contiguous soil and plants. Sarhad J. Agric. 2012, 28, 165–170. [Google Scholar]
  6. WHO. Air Pollution. World Health Organization. Available online: https://www.who.int/topics/airpollution/en:2013 (accessed on 23 April 2018).
  7. Singh, A.L.; Asgher, M.S. Impact of brick kilns on land use/land cover changes around Aligarh city, India. Habitat Int. 2005, 29, 591–602. [Google Scholar] [CrossRef]
  8. WHO. Guidelines for Air Quality.; World Health Organization: Geneva, Switzerland, 2000. Available online: http://www.rshm.saglik.gov.tr/hki/pdf/Guidelines-for-Air-Quality.pdf (accessed on 20 March 2021).
  9. NRDC. Tar Sands Crude Oil: Health Effects of a Dirty and Destructive Fuel. Natural Resources Defense Council (NRDC). Issue brief IB:14-02-B. 2014. Available online: http://www.nrdc.org/energy/files/tar-sands-health-effectsIB.pdf (accessed on 18 February 2016).
  10. Geng, G.; Zhang, Q.; Martin, R.V.; Van Donkelaar, A.; Huo, H.; Che, H.; Lin, J.; He, K. Estimating long-term PM2.5 concentrations in China using satellite-based aerosol optical depth and a chemical transport model. Remote Sens Environ. 2015, 166, 262–270. [Google Scholar] [CrossRef]
  11. Baum, E. Black Carbon from Brick Kilns; Clean Air Task Force: Boston, MA, USA, 2010; Available online: http://goo.gl/nJupe (accessed on 2 January 2014).
  12. Naeher, L.P.; Brauer, M.; Lipstt, M.; Zelikoff, J.T.; Simpson, C.D.; Koening, J.Q.; Smith, K.R. Wood smoke health effect: A review. Inhal. Toxicol. 2007, 19, 67–106. [Google Scholar] [CrossRef]
  13. WB. Nepal-Country Environmental Analysis: Strengthening Institutions and Management Systems for Enhanced Environmental Governance. Nepal J. Environ. Public Health 2007. Available online: https://openknowledge.worldbank.org/handle/10986/7996 (accessed on 2 May 2021).
  14. Kumar, R.; Barth, M.C.; Pfster, G.G.; Nair, V.S.; Ghude, S.D.; Ojha, N. What controls the seasonal cycle of black carbon aerosols in India? J. Geophys. Res. Atmos. 2015, 120, 7788–7812. [Google Scholar] [CrossRef] [Green Version]
  15. WHO. Burden of Diseases. World Health Organization. 2014. Available online: http://www.who.int/gho/phe/outdoor-air-pollution/burden-text/en/ (accessed on 15 February 2016).
  16. Coccia, M. The impact of first and second wave of the COVID-19 pandemic in society: Comparative analysis to support control measures to cope with negative effects of future infectious diseases. Environ. Res. 2021, 197, 111099. [Google Scholar] [CrossRef]
  17. Núñez-Delgado, A.; Bontempi, E.; Coccia, M.; Kumar, M.; Domingo, J.L. SARS-CoV-2 and other pathogenic microorganisms in the environment. Environ. Res. 2021, 201, 111606. [Google Scholar] [CrossRef]
  18. Coccia, M. High health expenditures and low exposure of population to air pollution as critical factors that can reduce fatality rate in COVID-19 pandemic crisis: A global analysis. Environ. Res. 2021, 199, 111339. [Google Scholar] [CrossRef]
  19. Colbeck, I.; Nasir, Z.A.; Ali, Z. The state of ambient air quality in Pakistan—A review. Environ. Sci. Pollut. Res. 2010, 17, 49–63. [Google Scholar] [CrossRef] [PubMed] [Green Version]
  20. Sanchez-Triana, E.; Enriquez, S.; Afzal, J.; Nakagawa, A.; Khan, A.S. Cleaning Pakistan’s Air. In Policy Options to Address the Cost of Outdoor Air Pollution; World Bank Publications: Washington, DC, USA, 2014. [Google Scholar]
  21. Ilyass, Z. Environmental Simulation in Quetta, Pakistan; Unpublished. Ph.D. Thesis, University of Baluchistan, Quetta, Pakistan, 2005. [Google Scholar]
  22. Khan, K.; Aslam, M.; Orfi, S.D.; Khan, H.M. Norm and associated radiation hazards in bricks fabricated in various localities of the North-West Frontier Province (Pakistan). J. Environ. Radioact. 2002, 58, 59–66. [Google Scholar] [CrossRef]
  23. Ishaq, M.; Murad, A.K.; Akbar, J.; Ahmad, I. Heavy metals in brick kiln located area using atomic absorption spectrosphotometer: A case study from the city of Peshawar, Pakistan. Environ. Monit. Assess. 2010, 166, 409–420. [Google Scholar] [CrossRef]
  24. Adrees, M.; Ibrahim, M.; Mehmood, A.; Abbas, F.; Saleem, F.; Rizwan, M.; Hina, S.; Jabeen, F.; Ali, S. Gaseous pollutants from brick kilns industry decreased the growth, photosynthesis, and yield of wheat. Environ. Monit. Assess. 2016, 188, 267. [Google Scholar] [CrossRef]
  25. Ahmad, W.; Nisa, S.; Mohammad, N.; Hussain, R. Assessment of PM10 & PM2.5 and associated health problems in different areas of cement industry, Hattar, Haripur. J. Sci. Technol. 2013, 37, 7–15. [Google Scholar]
  26. Pervaiz, S.; Akram, M.A.N.; Khan, F.Z.; Javid, K.; Zahid, Y. Brick Sector and Air Quality: An Integrated Assessment towards 2020 Challenge of Environment Development. Environ. Nat. Resour. J. 2021, 19, 153–164. [Google Scholar] [CrossRef]
  27. Liu, T.; Tian, L.; Yang, L.; Yan, D.; Huang, Q.; Lu, G.; Huang, Z. Emissions of BTEXs, NMHC, PAHs, and PCDD/Fs from Co-processing of Oil-based Drilling Cuttings in Brick Kilns. J. Environ. Manag. 2022, 304, 114170. [Google Scholar] [CrossRef] [PubMed]
  28. Groneberg, D.A.; Nowak, D.; Wussow, A.; Fischer, A. Chronic cough due to occupational factors. J. Occup. Med. Toxicol. 2006, 1, 3. [Google Scholar] [CrossRef] [Green Version]
  29. US EPA; Anonymous. “Particulate Matter|Air & Radiation|US EPA, 2011”. 6 July. Available online: http://www.epa.gov/pm/ (accessed on 22 July 2011).
  30. Valavanidis, A.; Fiotakis, K.; Vlachogianni, T. Airborne particulate matter and human health: Toxicological assessment and importance of size and composition of particles for oxidative damage and carcinogenic mechanisms. J. Environ. Health Counc. Environ. Carcinog. Ecotoxicol. Rev. 2008, 26, 339–362. [Google Scholar] [CrossRef]
  31. Rasheed, A.; Aneja, V.P.; Aiyyer, A.; Rafique, U. Measurements and analysis of air quality in Islamabad, Pakistan. Earth Future 2014, 2, 303–314. [Google Scholar] [CrossRef]
  32. Cacciotolo, M.; Wang, X.; DriscolL, I.; Woodward, N.; Safari, A.; Reyes, J.; Serre, M.L.; Vizuete, W.; Sioutas, C.; Morgan, T.E.; et al. Particulate air pollutants, APOE alleles and their contribution to cognitive impairment in older women and in a oogenesis in experimental model. Transl. Psychiatry 2017, 7, 1022. [Google Scholar] [CrossRef]
  33. Qian, Z.; He, Q.; Kong, L.; Xu, F.; Wei, F.; Champman, R.S.; Chen, W.; Edwards, R.D.; Bascom, R. Respiratory to diverse indoor combustion air pollution sources. Indoor Air 2007, 17, 135–142. [Google Scholar] [CrossRef] [PubMed]
  34. Lim, S.S.; Vos, T.; Flaxman, D.; Danaei, G.; Shibuya, K.; Adair-Rohani, H.; Amann, M.; Anderson, H.R.; Andrews, K.G.; Aryee, M.; et al. A comparative risk assessment of burden diseases and injury attributable to 67 risk factors and risk factor clusters in 21 regions, 1990–2010: A systematic system for the Global Burden of Diseases Study of 2010. Lancet 2012, 380, 2224–2260. [Google Scholar] [CrossRef] [Green Version]
  35. Saud, B.; Paudel, G. The Threat of Ambient Air Pollution in Kathmandu, Nepal. J. Environ. Public Health 2018, 2018, 1504591. [Google Scholar] [CrossRef] [Green Version]
  36. Bharwana, S.A.; Ali, S.; Farid, M.; Jamshaid, M.; Azeem, M.; Shakoor, M.B.; Ahmad, R.; Hannan, F. Noise and ambient air pollution monitoring and its effects on local community in Faisalabad, Pakistan. J. Environ. Sci. 2014, 2, 015–028. [Google Scholar]
  37. Khan, A.; Ahmad, S.S. Application of GAINS model for assessing selected air pollutants in Khyber Pakhtunkhwa and Baluchistan, Pakistan. Arab. J. Geosci. 2018, 11, 217. [Google Scholar] [CrossRef]
  38. Gent, J.F.; Triche, E.W.; Holford, T.R.; Belanger, K.; Bracken, M.B.; Beckett, W.S. Association of low-level ozone and fine particles with respiratory symptoms in children with asthma. JAMA 2003, 290, 1859–1867. [Google Scholar] [CrossRef] [Green Version]
  39. Pruss-Ustun, A.; Bonjour, S.; Corvalan, C. The impact of the environment on health by country: A meta-synthesis. J. Environ. Health 2008, 7, 7. [Google Scholar] [CrossRef] [Green Version]
Figure 1. The present study area is Jalala, located in Mardan District in Khyber Pakhtunkhwa (northern Pakistan).
Atmosphere 13 01231 g001
Figure 2. The sampling sites PM10, PM2.5, and PM1. Note: red color (PM10); orange color (PM2.5); red color (PM1).
Atmosphere 13 01231 g002aAtmosphere 13 01231 g002b
Figure 3. The concentration of CO2 in the sampling sites.
Atmosphere 13 01231 g003
Figure 4. Affected people and disease prevalence from smoke near the brick kiln in the study area.
Atmosphere 13 01231 g004
Figure 5. The concentration of particulate matter, H2S, CO2 and NO2 in the study area. Note: (A) PM1.0; (B) PM2.5; (C) H2S; (D) PM10; (E) CO2; (F) NO2.
Atmosphere 13 01231 g005
Table 1. Location of sampling points and distances from brick kilns.
S. NoSampling LocationCodeCoordinatesWind Speed Km/hDistance from a Brick Kiln in Meter
1Mummen Khan KalyMKK34.2139 N/71.5452 E3.5140 m
2Ghano Shah AGSA34.2046 N/71.5353 E3.5230 m
3Qamer Ghai KalyQGK34.2036 N/71.5447 E3.6295 m
4Ghano Shah BGSB34.2043 N/71.5345 E3.5400 m
5Ghulfur KalyGK34.2034 N/71.5437 E3.4515 m
6Haji Rahman Din KalyHRDK34.2139 N/71.5508 E3.6520 m
7Dheri KalyDK34.2146 N/71.58516 E3.4790 m
8Camp KalyCK34.2045 N/71.5333 E3.5790 m
9Khader Khel KalyKKK34.2032 N/71.5425 E3.5840 m
10Madeena KalyMK34.2013 N/71.5416 E3.466 m
11Aman Kaly AAMA34..2016 N/71.5429 E3.1320 m
12Aman Kaly BAKB34.2022 N/71.5435 E3.4231 m
13Baree Shah KalyBSK34.2144 N/71.5354 E3.4243 m
14Presado KalyPK34.2139 N/71.5329 E3.6647 m
15Gadbano KalyGK34.2146 N/71.5314 E3.11046 m
16Meeraman Kaly AMKA34.1954 N/71.5409 E3.3596 m
17Meeraman Kaly BMKB34.22017 N/71.535 E3.5680 m
18Meeraman Kaly CMKC 34.2032 N/71.5342 E3.6688 m
Table 2. Show different parameters and instruments for its measurement.
S. NoParameterInstrument
1.PM1HAZ dust particulate air monitoring equipment model: EPAM-5000 USA
2.PM2.5HAZ dust particulate air monitoring equipment model: EPAM-5000 USA
3.PM10HAZ dust particulate air monitoring equipment model: EPAM-5000 USA
4.CO2ambient air monitoring analyzer NOVA model 600-2-3-4-5-7-10 Canada
5.COambient air monitoring analyzer NOVA model 600-2-3-4-5-7-10 Canada
6.NOambient air monitoring analyzer NOVA model 600-2-3-4-5-7-10 Canada
7.NO2ambient air monitoring analyzer NOVA model 600-2-3-4-5-7-10 Canada
8.H2Sambient air monitoring analyzer NOVA model 600-2-3-4-5-7-10 Canada
9.NH3ambient air monitoring analyzer NOVA model 600-2-3-4-5-7-10 Canada
Table 3. The concentrations of CO, NO, NO2, NH3, and H2S in the sampling sites. Quadrates sampling site. Concentration of other parameters (mg/L).
CONONO2NH3H2S
1stMK0012.402
HRDK008.100
DK0018.800
2ndGSKA007.502.3
GSKB00502.5
CK004.403
3rdQGK0015.302.3
GK006.900
KKK0016.800
4thMK005.105.1
AMA0014.303.5
AMA0014.303.5
5thBSK009.903
PK001602.5
GK0015.700
6thMKA0012.404.3
MKB0010.303.5
MKC007.402
Note: Sites codes are the same as that mentioned in Table 1.
Publisher’s Note: MDPI stays neutral with regard to jurisdictional claims in published maps and institutional affiliations.

