Article

An Improved Air Quality Index Machine Learning-Based Forecasting with Multivariate Data Imputation Approach

1
Department of Chemical Engineering, University of Waterloo, 200 University Avenue West, Waterloo, ON N2L 3G1, Canada
2
Environmental Pollution and Climate Program, Environment & Life Sciences Research Center, Kuwait Institute for Scientific Research, P.O. Box 24885, Safat 13109, Kuwait
*
Author to whom correspondence should be addressed.
Atmosphere 2022, 13(7), 1144; https://doi.org/10.3390/atmos13071144
Submission received: 29 April 2022 / Revised: 30 June 2022 / Accepted: 10 July 2022 / Published: 18 July 2022
(This article belongs to the Special Issue Sand and Dust Storms: Impact and Mitigation Methods)

Abstract

:
Accurate, timely air quality index (AQI) forecasting helps industries in selecting the most suitable air pollution control measures and the public in reducing harmful exposure to pollution. This article proposes a comprehensive method to forecast AQIs. Initially, the work focused on predicting hourly ambient concentrations of PM2.5 and PM10 using artificial neural networks. Once the method was developed, the work was extended to the prediction of other criteria pollutants, i.e., O3, SO2, NO2, and CO, which fed into the process of estimating AQI. The prediction of the AQI not only requires the selection of a robust forecasting model, it also heavily relies on a sequence of pre-processing steps to select predictors and handle different issues in data, including gaps. The presented method dealt with this by imputing missing entries using missForest, a machine learning-based imputation technique which employed the random forest (RF) algorithm. Unlike the usual practice of using RF at the final forecasting stage, we utilized RF at the data pre-processing stage, i.e., missing data imputation and feature selection, and we obtained promising results. The effectiveness of this imputation method was examined against a linear imputation method for the six criteria pollutants and the AQI. The proposed approach was validated against ambient air quality observations for Al-Jahra, a major city in Kuwait. Results obtained showed that models trained using missForest-imputed data could generalize AQI forecasting and with a prediction accuracy of 92.41% when tested on new unseen data, which is better than earlier findings.

Graphical Abstract

1. Introduction

1.1. Background and Motivation

Vast areas in the Gulf Cooperation Council (GCC) region are categorized as arid and semi-arid, which, when the right wind conditions exist, provide a source of suspended dust and saltated sand that feed dust and sandstorms. In addition to the direct impact of dust and sandstorms on particulate matter (PM) concentrations, which are known to have health impacts [1], they result in wind erosion, sand encroachment on vital infrastructure, loss of visibility, crop damage, soil fertility loss, topsoil removal, and eventually land degradation [2]. In addition, the formation of thinly crusted mud and/or carbonate coatings on photovoltaic cells reduce their energy-capture efficiency. Land degradation represented by vegetation degradation and the loss of fauna and flora biodiversity is of great concern for the desert ecosystem in the GCC as it has a damaging effect on natural resources. For example, the amount of deposited dust in Kuwait has increased from 109.4 t/km2 during 1974–1980 to 392 t/km2 during 2011–2017, an increase of 2.78 times [3]. The mean total annual dusty days in Kuwait is 255 days, with more dusty days in the northern Arabian Gulf, including Kuwait, in comparison to the southern portion [4,5,6,7].
A relatively recent study employing different approaches, i.e., concentration rose plots, the positive matrix factorization model, and backward trajectory profiles, has shown that much of the PM in Kuwait comes either from neighboring countries or continents [8]. The same study reported the annual average PM10 (i.e., particles with aerodynamic diameter less than 10 µm) and PM2.5 (i.e., particles with aerodynamic diameter less than 2.5 µm) levels in Kuwait as 130 μg/m3 and 53 μg/m3, respectively, with the PM2.5 sources in Kuwait associated with sand dust (54%), oil combustion/power plants (18%), petrochemical industry (12%), traffic (11%), and transboundary sources (5%). The same study reported that more than 50% of the sampled PM2.5 was linked to sources outside Kuwait. A more recent study showed that electricity generation and water desalination activities were responsible for 23% and 14% of the anthropogenic PM2.5 and PM10 emissions, respectively [1]. Figure 1 shows the urban and rural annual mean concentrations for PM2.5 in Kuwait during 2011–2016. The annual mean PM2.5 concentrations, whether urban or rural, are continuously above the WHO 2021 guideline value of 35 µg/m3 [9]. Another interesting observation is that the difference between the annual mean urban concentrations and the annual mean rural concentrations was nearly fixed at about 8 μg/m3.
There is a strong correlation between the number of visits to emergency rooms due to severe asthma attacks and exposure to PM2.5 [10]. Also, exposure to PM2.5 has been strongly associated with increased morbidity and mortality rates, with such connection being stronger than for PM10–2.5 or PM10; [11,12,13,14]. Another study associated unhealthy air quality levels with high PM10 and PM2.5 aerosol masses for 24% of the whole sampling period [15]. Gauging PM2.5 and PM10 annual mean concentrations against the WHO 2021 initial interim target for outdoor air quality (35 μg/m3 for PM2.5 and 70 μg/m3 for PM10) is a cause of concern [9]. Trials to exclude samples taken during extreme sandstorm conditions did not result in the removal of these exceedances [16], which weakens the argument that regions affected by frequent sand/dust storms should not consider WHO 2021 guidelines [9]. Another study not far from Kuwait reported that removing the desert dust and sea salt contribution in Bahrain (thus leaving the anthropogenic component), did not improve the situation either [17].
In addition to natural air pollution sources, poor air quality has been strongly linked to burning fossil fuels for power production and other industrial activities [18]. The US Environmental Protection Agency (EPA) has defined six compounds that dangerously affect the respiratory system of humans as criteria air pollutants (CAPs) [19]: sulfur dioxide (SO2), nitrogen dioxide (NO2), ground-level ozone (O3), carbon monoxide (CO), particulate matter (PM), and lead (Pb). The US-EPA has developed specific guidelines and standards for acceptable levels of CAPs [20]. The air quality index (AQI) is used to quantify the scale of air pollution based on CAPs, and categorizes it into six different categories based on the associated health concerns. Accordingly, AQI quantifies the healthiness and harmfulness of the ambient air and reports the health effects associated with these concentrations. The AQI standard ranges developed by the US-EPA are listed in Table 1 [20]. The AQI of each criteria pollutant is calculated. The pollutant with the highest AQI is identified as the critical pollutant, and based on its AQI value, the categorical quality of air is reported. Forecasting AQI helps the public avoid harmful exposure. It also helps emitters plan future operating conditions and/or cut off certain processes at predicted peak hours. Thus, developing accurate AQI forecasting models could provide reliable pollution alerts, protect the population’s health, and improve the ambient air quality.
Looking at the top ten causes of death in Kuwait, air pollution in general (including PM2.5 and PM10), ambient or indoor, cannot be ignored. The WHO 2021 database shows ischemic heart disease was the number one cause of death in Kuwait in 2019, with the percentage increase of deaths linked to it over the last ten years being 39.90% [9]. Also, lower respiratory infections and lung cancer are the 3rd and 10th causes of death in Kuwait, with the percentage increase of deaths linked to them being 60.10% and 56.60%, respectively, over the last decade [9]. The above shows how important it is to predict AQI.

1.2. Related Work

AQI forecasting can be categorized into two main approaches: statistical- and machine learning(ML)-based.
Statistical forecasting methods build data-driven mathematical models to map the relationship between the time-series historical data and target data. With simple mathematical formulation, these methods can provide timely and accurate predictions. Auto-regressive integrated moving average (ARIMA) is a well-known statistical forecasting approach that is usually employed for short-term forecasting. For example, ARIMA and auto-regressive fractionally integrated moving average (ARFIMA) statistical methods were employed to forecast the monthly values of AQI in Malaysia [21]. The models were able to predict the AQI with 95% confidence. For shorter-term forecasting, ARIMA coupled with the Holt exponential smoothing model was utilized to forecast daily AQI values [22]. More recent work proposed a survey comparing classical statistical models for AQI forecasting and concluded that ARIMA models were superior in mapping trends and producing predictions with the lowest root mean square error (RMSE) compared to other statistical models [23]. Nevertheless, the majority of statistical-based models consider only previously recorded data to forecast the following ones without accounting for the effect of atmospheric variables and conditions. Moreover, unlike ML models, the statistical models require computationally expensive data pre-processing, especially in the case of discontinuity in historical data [24].
On the other hand, ML algorithms, with their proven superiority and effectiveness in various forecasting problems, can be very attractive to researchers once integrated with environmental applications. For example, Wang et al. [25] applied a radial basis neural network (NN) to forecast SO2 levels and concluded that the achieved results could be promising for forecasting the AQI in future research [25]. Similarly, [26] showed that a feedforward NN was superior to multilinear regression in predicting different pollutant concentrations. The work proposed in [27] utilized another robust ML algorithm known as support vector machine (SVM) for predicting the pollutant concentrations required to estimate the hourly AQI in California. The models categorized the predicted air quality with 94.1% classification accuracy. An alternative approach was proposed in [28] to forecast the AQI directly through ensemble learning, with the predicted AQI outputs from five different ML and regression models being further processed and then fed to ensemble models to increase forecasting accuracy.
Considering the abovementioned approaches, in this article we present a ML approach for forecasting the concentrations of CAPs, including PM2.5 and PM10, as well as the AQI.

1.3. Our Contribution

The presented approach tackles the missing data problem using the missForest imputation technique, a multivariate ML-based imputation technique to substitute missing/nonexistent observations in ambient air quality and meteorological datasets. The effectiveness of the employed multivariate imputation was examined by using the imputed data for training ML models to forecast the PM2.5 and PM10 levels first. Later, it was expanded to predict other CAP levels and AQIs. Pre-processing of data and feature selection was comprehensively conducted before building the models using different benchmarking methodologies. Further analysis was performed to compare models built using the proposed imputation technique with models trained using linear imputation. In order to conduct a fair comparison between the two imputation approaches (i.e., missForest and linear) and test their performance, the testing set of data—which is unseen by the fitted models—was selected to be complete, with no missing data. This selection made the actual data of the testing set similar for both models. By this, the generalization of the constructed models from differently imputed datasets could be fairly compared and analyzed.
The main contributions of this paper can be summarized as follows:
  • Proposing a reliable and tested solution for the enduring issue of missing meteorological and air quality observations.
  • Employing the random forest (RF) model during the data pre-processing stage, i.e., missing data imputation and feature selection. The literature shows that the RF model has been primarily used as the final forecasting model and it has promising results. In the current work, the robustness of the RF model is tested when employed as an intermediate model rather than the final forecasting model.
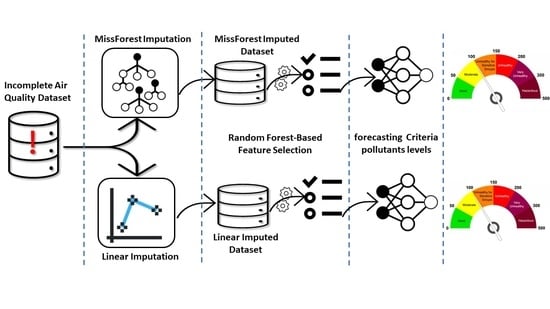
  • Fairly and comprehensively testing the effect of the data imputation approach on data used to build the final forecasting models. In our paper, the comparison between the two imputation techniques was performed on 6 CAP forecasting models, i.e., a total of 12; 6 for each imputation technique. This approach helped thoroughly investigate the superiority of one imputation technique over the other. Also, as a final step, the AQI values of the corresponding critical pollutant(s) were also estimated to test the impact of the imputation approach.

1.4. Paper Structure

The construction of the rest of the article is designed as follows: Section 2 provides an overview of the main concepts applied in this paper, with subsections to cover the raw data used, the feature engineering, and preposing steps in detail. Section 3 presents and discusses the simulation results. Finally, in Section 4, the overall conclusions about the suggested method and simulation results are stated.

2. Materials and Methods

The accurate forecasting of an AQI relies on forecasting ambient concentrations of CAPs. One significant issue associated with predicting pollutant concentrations is gaps in the ambient air quality and meteorological data. As a result of temporal dependencies between the two datasets, discarding observations with missing variables for training or building prediction models is generally impractical and affects the model’s ability to accurately capture the time relation among data. Furthermore, imputing missing observations with mean or median values or any other single imputation approach could fail to map extreme or abnormal behaviors in the data. Therefore, assigning values to these missing incidents with the consideration of other factors is essential, especially for the case of AQI predictions where the extreme and high values actually require attention and precautionary actions.

2.1. Theory: MissForest

As mentioned before, missing recorded measurements is a common issue when dealing with real-life data. This is usually dealt with using one of two techniques: single imputation or multiple imputations. The single imputation approach is a faster approach. The missing entry for a specific variable is simply assigned to that variable’s mean or median value without considering other variables or even other related non-missing observations of the same variable. Conversely, missing values in the multiple imputation techniques are estimated with lower biases and uncertainties using data analysis and regression tools [29]. In these approaches, models are built on the non-missing data to estimate the missing ones. In the proposed approach, the missForest imputation technique was employed.
The missForest imputation method employs the random forest (RF) algorithm for estimating missing data. This method can be summarized in four steps:
  • Initialization: In this step, all missing observations of a specific variable are substituted by the mean value of this variable; a mean single imputation is performed as an initial step.
  • Imputation: The imputation of missing data is performed in sequential order of missing entries for each variable. The variable with the missing entries being imputed is treated as a target variable (dependent variable) for training the RF model [30]. Other variables are used as predictors for this target variable. The complete non-missing entries of the target variable are used for training the RF model, whereas the missing ones are replaced by the estimated values using the trained model [29].
  • Repetition: Step 2 is repeated for all variables with missing entries by assigning other variables to be the predictors to build the RF model.
  • End: When the RF models for all the variables with missing entries are trained, the first imputation iteration is achieved. Then, steps 2 and 3 are repeated until the stopping criteria are reached. The stopping criteria are based on the mean square error (MSE) of the trained RF models. When the MSE of iteration (i) is higher than the MSE of the previous iterations, i.e., (i-1), the imputation process stops, and the final results are those determined from the previous iteration [29,31].
Artificial neural networks (ANNs) are one of the most robust ML methods. They are known for their superior ability to capture and map complex nonlinear relations among data [32,33]. The simplest type is the one-layer feedforward NN. As shown in Figure 2, in this network, the input predictors (X) flow sequentially from the input layer to an intermediate, i.e., hidden, layer and finally to an output layer to estimate the final forecasted target ( y ^ ). Each layer in the ANN consists of multiple units or nodes. The number of nodes in an input layer is simply equal to the number of predictors. Similarly, the number of output layer nodes is similar to the number of targets. The number of nodes in a hidden layer is a hyperparameter that requires proper tuning and selection to avoid overfitting or underfitting the built models [34].
The feedforward equations for sample i in the ANN, which is represented in Figure 2, are defined as follows:
h 1 m × 1 = F 1 W 1 m × n x i n × 1 + b 1 m × 1
y ^ i = F 2 w 2 1 × m h 1 m × 1 + b 2
where x i is the n features vector of sample i being fed to the neural network;
W 1 is the weight matrix of the dimensions [m number of hidden neurons in the first hidden layer × n size of input features] connecting the input layer to the first hidden layer with m neurons;
F 1 is the activation function in the hidden layer. In Figure 2, sigmoid function is used as an activation function. The symbol s i g represents the sigmoid of the weighted sum;
b 1 is the bias vector of the first hidden layer of the size [m number of hidden neurons in the first hidden layer × 1];
h 1 is the hidden layer output vector that is then fed as an input to the second layer,
F 2 is the activation function in the output layer, a linear function in the case of regression problems;
w 2 is the weight vector of dimensions [1 × m] connecting the first hidden layer to the second layer (output layer with one neuron in our case);
y ^ i is the predicted output value that will be compared to y i , the actual output of sample i; and
b 2 is the output bias.
To update the network’s parameters ( W 1 , b 1 , w 2 , b 2 and train the network, the backpropagation algorithm is used to minimize the regression cost function E in each iteration k . The mean squared error is the regression cost function that was employed in our network. As seen Equation (3) below, the cost function depends on the predicted output y ^ i that is a function of, i.e., depends on, all the network’s parameters ( W 1 , b 1 , w 2 , b 2 ).
E k = 1 N 1 N ( y i ( k ) y ^ i ( k ) ) 2
N is the sample size.
The general backpropagation equation is given by:
φ k = φ k 1 α E k 1 φ k 1 + β Δ φ k 1
where φ symbolizes the network’s parameters, e.g., W 1 , b 1 , w 2 , b 2 , that are being adjusted during the training process. For example, in Figure 2, W 1 and w 2 are adjusted during the training process using Equation (4) by substituting φ with W 1 and w 2 respectively. E k 1 φ k 1 is the negative derivative of error function with respect to the network parameter(s), Δ φ k 1 is the previous parameter increment in the previous iteration ( α E k 2 φ k 2 + β Δ φ k 2 );
β is a momentum factor [0, 1]; and
α is the learning rate [0, 1].
Δ W 1 and Δ w 2 in Figure 2 are the weight updates at iteration k−1 and symbolize the second and third terms of Equation (4), i.e., E k 1 w k 1 + β Δ W 1 k 1 and E k 1 w k 1 + β Δ w 2 k 1 , respectively.
In our approach, the gradient descent with momentum algorithm was used because training a network which accounts for the history of the parameter’s updates eases the training process. The momentum hyperparameter directly accelerates the training process and smooths out the noisy oscillations [35].

2.2. Data Description and Feature Engineering

2.2.1. Raw Data Sources and Pre-Analysis

The air quality-monitoring data which were used to train and test the proposed model were obtained from the Kuwait Environment Public Authority (KEPA) for Al-Jahra City. This dataset included two types of hourly observations:
  • Concentrations of different gaseous and particulate pollutants.
  • Meteorological conditions, e.g., ambient temperature and pressure, wind speed, wind direction, relative humidity, etc.
Five-minute data from the Air Quality Monitoring Station (AQMS) at Al-Jahra underwent QA/QC checks to reduce noise and bias data before calculating the hourly concentrations which were used in the present work. The QA/QC steps included:
(1)
removing zero/span values;
(2)
removing readings that were below or above analyzer’s limit;
(3)
removing zero readings if zero was not considered a reading; and
(4)
removing some potential outliers that were obvious, such as spikes in concentrations, repeated values, i.e., data remaining the same for hours, or a sudden drop in concentration but still in the normal range of observed data.
The data covered the duration of 24 February 2013 to 23 February 2015. Out of 38 parameters in the dataset, those listed in Table 2 were selected.

2.2.2. Data Splitting

The dataset was divided into three subsets: training, validation, and testing, distributed as 80%, 10%, and 10%, respectively. The training set was used to train the forecasting model, the validation set was used to test the learned parameters at each iteration during the training process, and the testing set was used to test the fitted parameters after the learning had completed. Since the validation set was not introduced to the network during the training process and was not used to adjust its parameters, it was employed to test the network’s generalization during the training process. When the accuracy over the training dataset starts increasing while the accuracy over the validation dataset remains the same or starts decreasing, the model starts to overfit and fails to generalize with unseen data. Therefore, the validation accuracy was tracked throughout the training process to truncate the learning process to ensure the model’s generalization and avoid overfitting [36].

2.2.3. Missing Data Imputation

The missing observations in the dataset were randomly scattered in the training and validation sets. High missing rates, i.e., >6%, were observed in pollutant concentrations, while for the meteorological data the missing rates were lower; refer to Table 3.
As mentioned earlier, the missing entries in the training and validation subsets were imputed using two imputation approaches: missForest imputation and linear interpolation. Using different imputation techniques results in assigning missing data differently, and the resulting two datasets are then used to train ANN models to forecast the pollutant levels and the AQI. Because different methods imputed the missing entries, the imputed forecasting targets for the two datasets were different. Comparing the obtained results to decide on the superiority of one approach over the other is far from ideal. Accordingly, to achieve a fair comparison between the models, the testing dataset had to be complete (no missing data), which meant the targets of the two models would be the same. Hence, the model which results in better predictions can be considered superior, with a better generalization when tested on the unseen data.

2.2.4. Feature Engineering (Extraction)

In this section, the time features, including month, day, and hour, were encoded to become cyclic using sine and cosine functions. The encoding improved the models’ ability to capture the cyclic temporal and seasonal relations between predictors and targets, ultimately increasing the model accuracy [37]. Equations (5) and (6) were used to transform the temporal feature X into a cyclic feature,
X s i n = sin 2 π X max X
X c o s = cos 2 π X max X
where max X was set to 12, 31, and 24 for the month, day, and hour features, respectively.
After this feature-engineering step, a total number of 17 features, i.e., concentrations of 6 pollutants, temperature, wind speed, wind direction, relative humidity, sine (month, day, hour), cosine (month, day, hour), and year, were used as inputs for the ANN.

2.2.5. Data Scaling

Scaling data to the same range [0, 1] is essential, as predictors’ ranges are different. High variations between data can slow the training process of the ML engines and cause the issue of falling into the minimal local values, which results in unreliable, poor forecasting models [38]. For the reported study, the predictors were scaled to the [0, 1] range using max-min normalization.

2.3. Feature Selection

2.3.1. Feature Filtering and Selection

Proper selection of predictors is essential because high dimensions of irrelevant features can delay the training process and necessitate the need for expensive and time-consuming computation machines [39]. This step is vital due to its significant impact on the results, and it can also give insights on feature-related applications and studies. In this study, the famous Boruta algorithm was utilized to analyze the importance of the selected predictors and filter the irrelevant ones. The Boruta algorithm was used to check the significance of the feature by testing its effect on an RF model through multiple iterations [40]. First, a copy of the predictor was created and randomly shuffled across the observations in each iteration to create a shadow variable. The shadow variable erased the actual relation between the predictor and the target. Next, the RF model was trained using the doubled dataset, i.e., the real predictors and their shadows. When the training was completed, a statistical Z-test was conducted to disclose the significance of the predictor and compare it to the importance of the shadow variable. To declare the feature as an important one, its relevance had to be higher than the maximum significance of all shadow variables, i.e., Z-scoreactual > max. Z-scoreshadow. After filtering out insignificant variables and their shadow, the previous steps were repeated until a filter/keep decision for all features was made [40]. Boruta RStudio® Package was utilized to determine the important features for forecasting each pollutant. Table 4 lists the final selected predictors for each forecasting target. As illustrated, almost all the features nominated in the previous section were declared to be necessary. Although sine hour was rejected for PM10 and PM2.5, a decision to keep it was made since it was accepted for all other targets. A similar conclusion was made for the wind direction for predicting the level of CO.

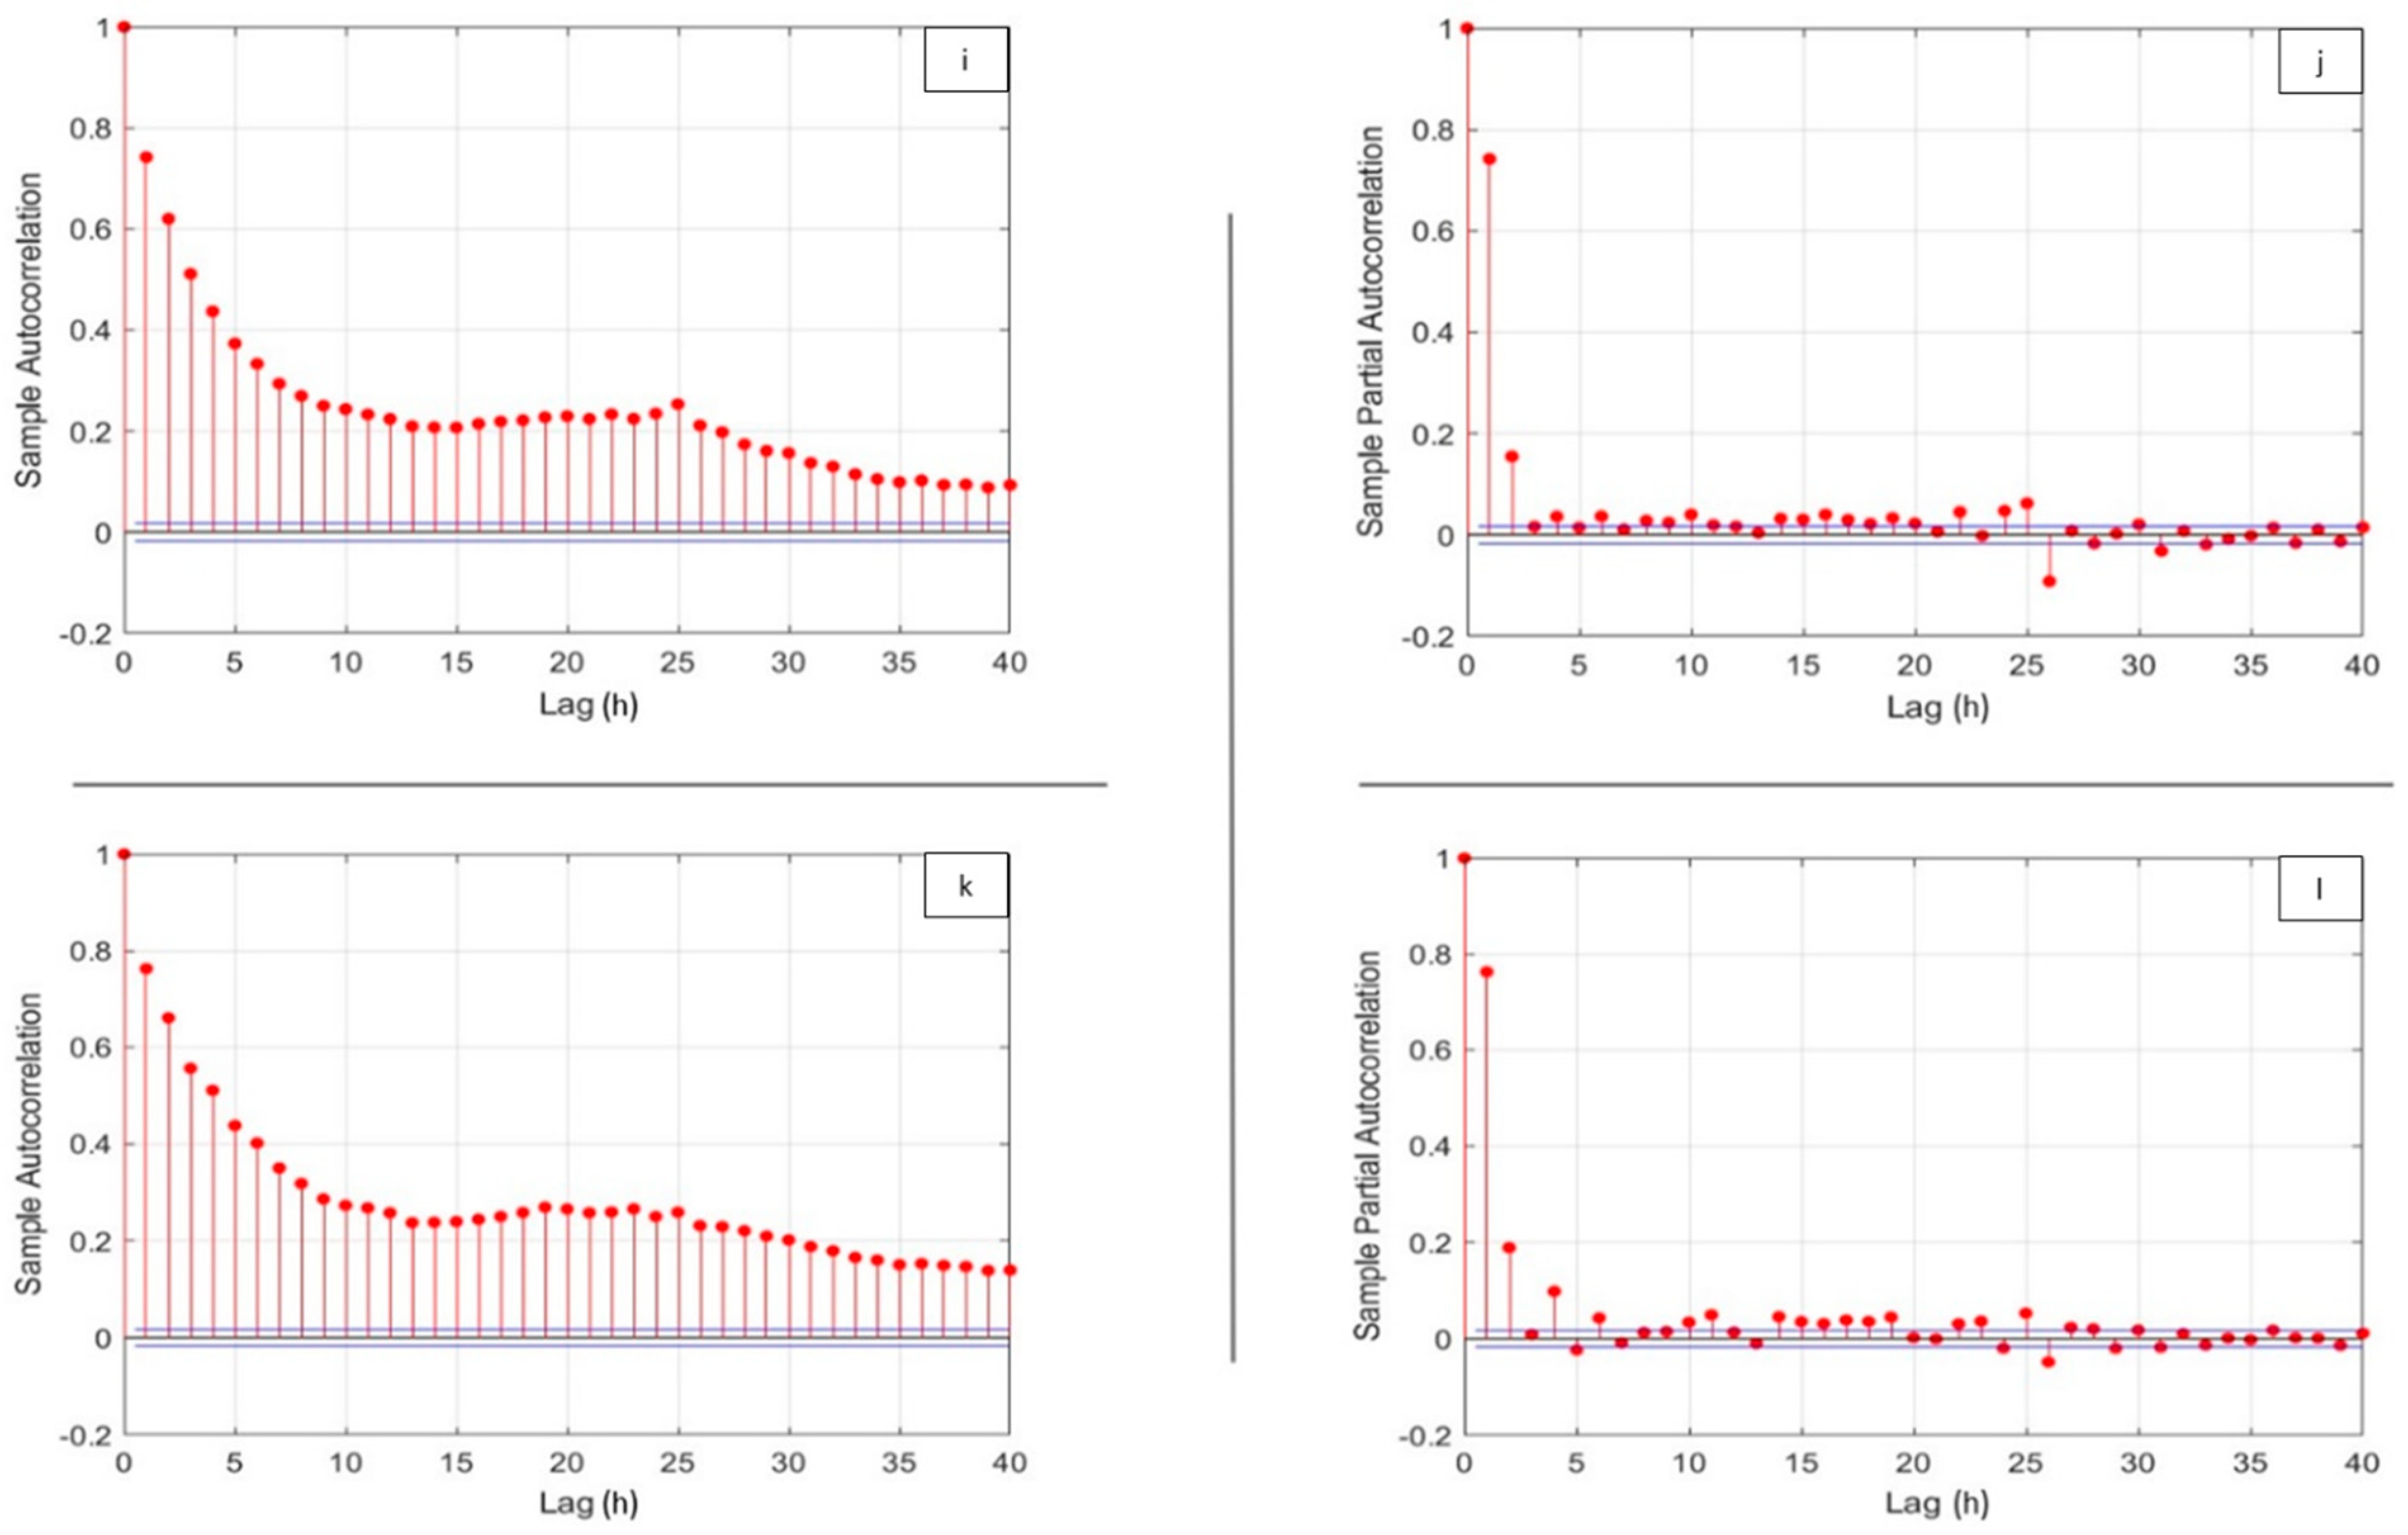
2.3.2. Lag Feature Selection

The final feature selection step is concerned with selecting the lag feature of the dependent variable, i.e., the pollutant levels. As with any other time-series data, the pollutant levels in ambient air have significant dependencies on their observations at previous time steps. Therefore, autocorrelation function (ACF) and partial autocorrelation function (PACF) were used to select the appropriate lag features. ACF and PACF are plotted in Figure 3a–l for PM10, PM2.5, NO2, CO, O3, and SO2. The ACF plots O3, NO2, SO2, and CO reveal a pattern which is repeated every 24 h. This pattern is not applicable for other pollutants. Nevertheless, when removing internal relations between lags and replotting the PACF, lags ranging between 1 and 4 h are considered significant for these pollutants. Although in the case of CO, only the zero-lag (the observation with itself) and 1 lag are considerable, in this study, the lag feature of all targets (pollutant levels) was selected to be 4. This was done as the lags <4 observed in ACF plots were high and neglecting them would not be sensible. By this, the final size of the input feature becomes 20.

2.4. Forecasting Targets

Reporting the AQI of O3 at a specific hour requires the midpoint 8 h average ozone concentration [20]. Therefore, to forecast the AQI at time t + 1, concentrations in the time interval of [t − 3, t + 4] are needed (time step is 1 h). Accordingly, at time t, the forecasting model should predict the hourly average O3 concentrations of the next 4 h [t + 1, t + 4]. Then the midpoint 8 h average concentration was calculated as the average of the mean concentration of the previous, i.e., actual, 4 h and the mean concentration of the following, i.e., forecasted, 4 h.
A similar approach was followed to forecast the 4 h average of CO concentration and calculate its midpoint 4 h average. For PM10 and PM2.5, the hourly 24 h average concentration is required; thus, the prediction model was designed to predict the 12 h average concentration of the following hours. The midpoint 12 h concentration was calculated as the average of the mean concentration of the previous, i.e., actual, 12 h and the mean concentration of the following, i.e., forecast, 12 h. For NO2 and SO2, the 1 h concentrations of the next hour were forecast.
ANN was utilized to build the forecasting models for the six pollutants. As mentioned before, training the ANN with insufficient nodes generates unreliable under-fitted models, whereas selecting a large number of hidden neurons when training the ANN provides an overfitted model lacking generalization, with poor performance when used with unseen datasets [41]. Therefore, determining the most appropriate number of nodes when training an ANN is crucial [42]. Also, excessive training by setting the iterations of training to a large number results in a biased fit toward the training set and causes overfitting. Therefore, the grid search optimization was accompanied by a time-series division of the data to address the overfitting issue and find the optimal number of nodes. The network was trained multiple times with different sizes of neurons between 2 and 20, i.e., the number of input layer nodes. The number of neurons with the lowest validation error was selected to be the optimum.
The training procedure of the ANN is presented by pseudo-code in Table 5. The ANN for all the pollutants was trained using mini-batch gradient descent with a momentum algorithm with a batch size of 32, a learning rate = 0.0001, and a momentum = 0.9. The optimal number of nodes determined for the models of the six pollutants is presented in Table 6.

3. Results and Discussion
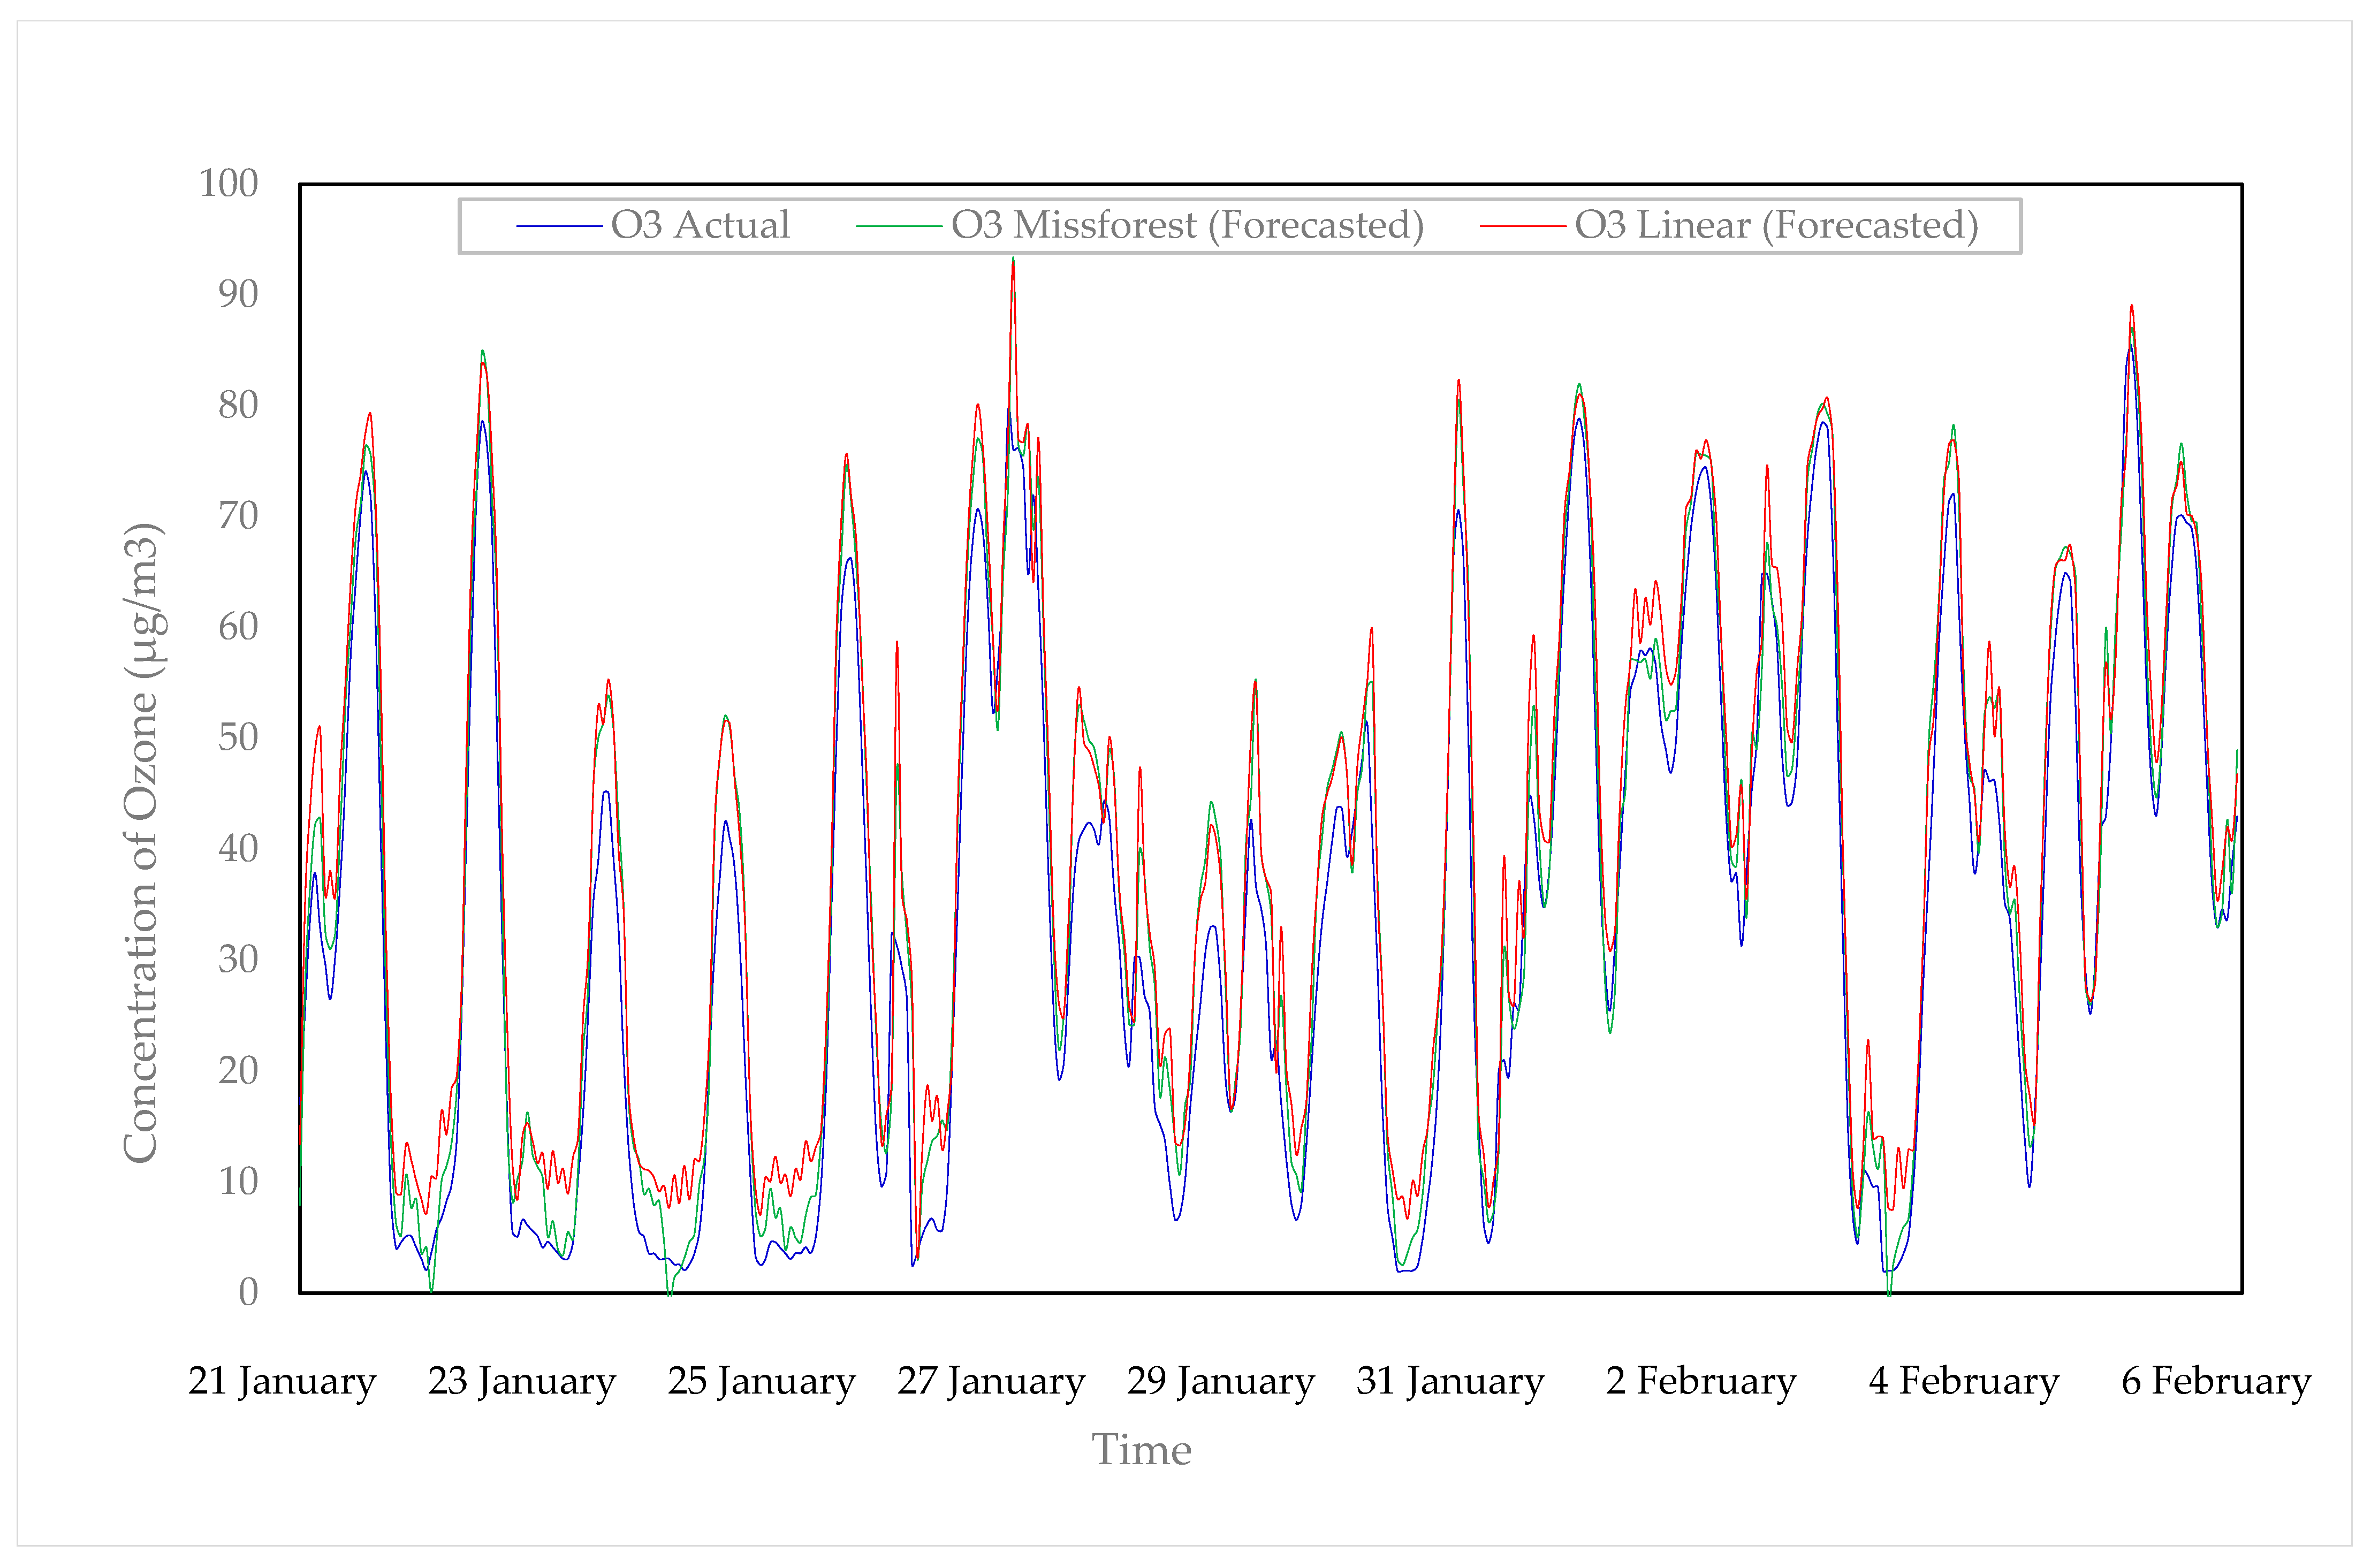
As stated earlier, the prediction models were built using two datasets. In this section, the forecasting results obtained from the two imputed datasets are reported and compared for the six pollutants as well as the AQI. The error criteria for the two forecasting models are shown in Table 7.

3.1. Ozone (O3)

As Table 7 shows, the missForest-trained imputed dataset generated a model with lower error metrics for both the training and testing datasets. Since the actual testing dataset is complete, with no missing data, it can be seen that MSE, RMSE, and mean absolute error (MAE) are lower for the model of the missForest-imputed data, indicating a better generalization of the missForest-built model when tested on the unseen data.
Figure 4 shows the testing prediction results of O3 levels for both models. It represents detailed forecast levels in a fifteen-day block, which was randomly selected from the testing dataset. It is obvious that the linear model overestimated O3 levels at peaks and troughs, while the missForest model overestimated the peaks all the time and had mixed, i.e., overestimation/underestimation, behavior at the troughs.
For the reported work, the missForest-imputed dataset with the tuned ANN could forecast the target with an MAE value of 4.033 µg/m3, which is about 53% and 5% of the MAE values, i.e., 7.5 µg/m3 and 83 µg/m3, reported for the predicted O3 hourly concentrations by the trained 8 hidden-unit ANN [26] and the SVM model trained by a 2nd order polynomial-imputed training dataset [27]. In another article, the hourly O3 concentrations were forecast with 0.919 R2 using an ANN [43].

3.2. Nitrogen Dioxide (NO2)

Upon careful inspection, the model trained by the linear interpolation-imputed dataset performed slightly better with respect to the error criteria for both the training and testing datasets (Table 7). The MAE values for the testing dataset are similar for the two models, i.e., differences less than 1%. The forecasts of 15 days from the testing set are illustrated in Figure 5. Both models overestimated NO2 levels at troughs, while at peaks the linear model generally overpredicted, unlike the missForest model, which showed mixed behavior. One other observation is what seems to be a lag in the response of the linear model, with the predicted peaks often following the actual ones.
Nevertheless, the ANN with both imputation techniques showed lower error metrics than the SVM with the 2nd order polynomial imputation in [27], where the MAE and RMSE were reported as 106 and 150 µg/m3, respectively, for hourly predictions of NO2. In [26], a 26 hidden-unit ANN model predicted the concentrations of NO2 with a 0.89 R2. This ANN was able to surpass a multilinear regression model (R2 = 0.81), which then validated the authors’ hypothesis about the robustness of the ANN in mapping nonlinear complex relations, such as the ones in NO2 levels.

3.3. Sulfur Dioxide (SO2)

Based on the results reported in Table 7, both models did not predict the SO2 levels with high accuracy. However, comparing the two methods, missForest provided outputs with higher accuracy and a better generalization where the metrics of the testing set are close to the training set.
Figure 6 compares the results of the two models, and it clearly shows that both models’ performance worsens at high SO2 concentrations, i.e., peak concentrations are generally underestimated.
The SVM model with the 2nd order polynomial-imputed dataset, which was reported in [27], has surpassed our proposed model and forecast SO2 hourly concentrations with an R2 value of 0.787. In this study and that of [27], almost similar dependent variables were used for building the SVM model, i.e., meteorological conditions and CAP concentrations. One important observation which is applicable to the two studies is that the forecast SO2 concentrations had the lowest prediction accuracies among the other pollutants. Such a phenomenon for two methods with different forecasting models necessitates further consideration of selected dependent features.

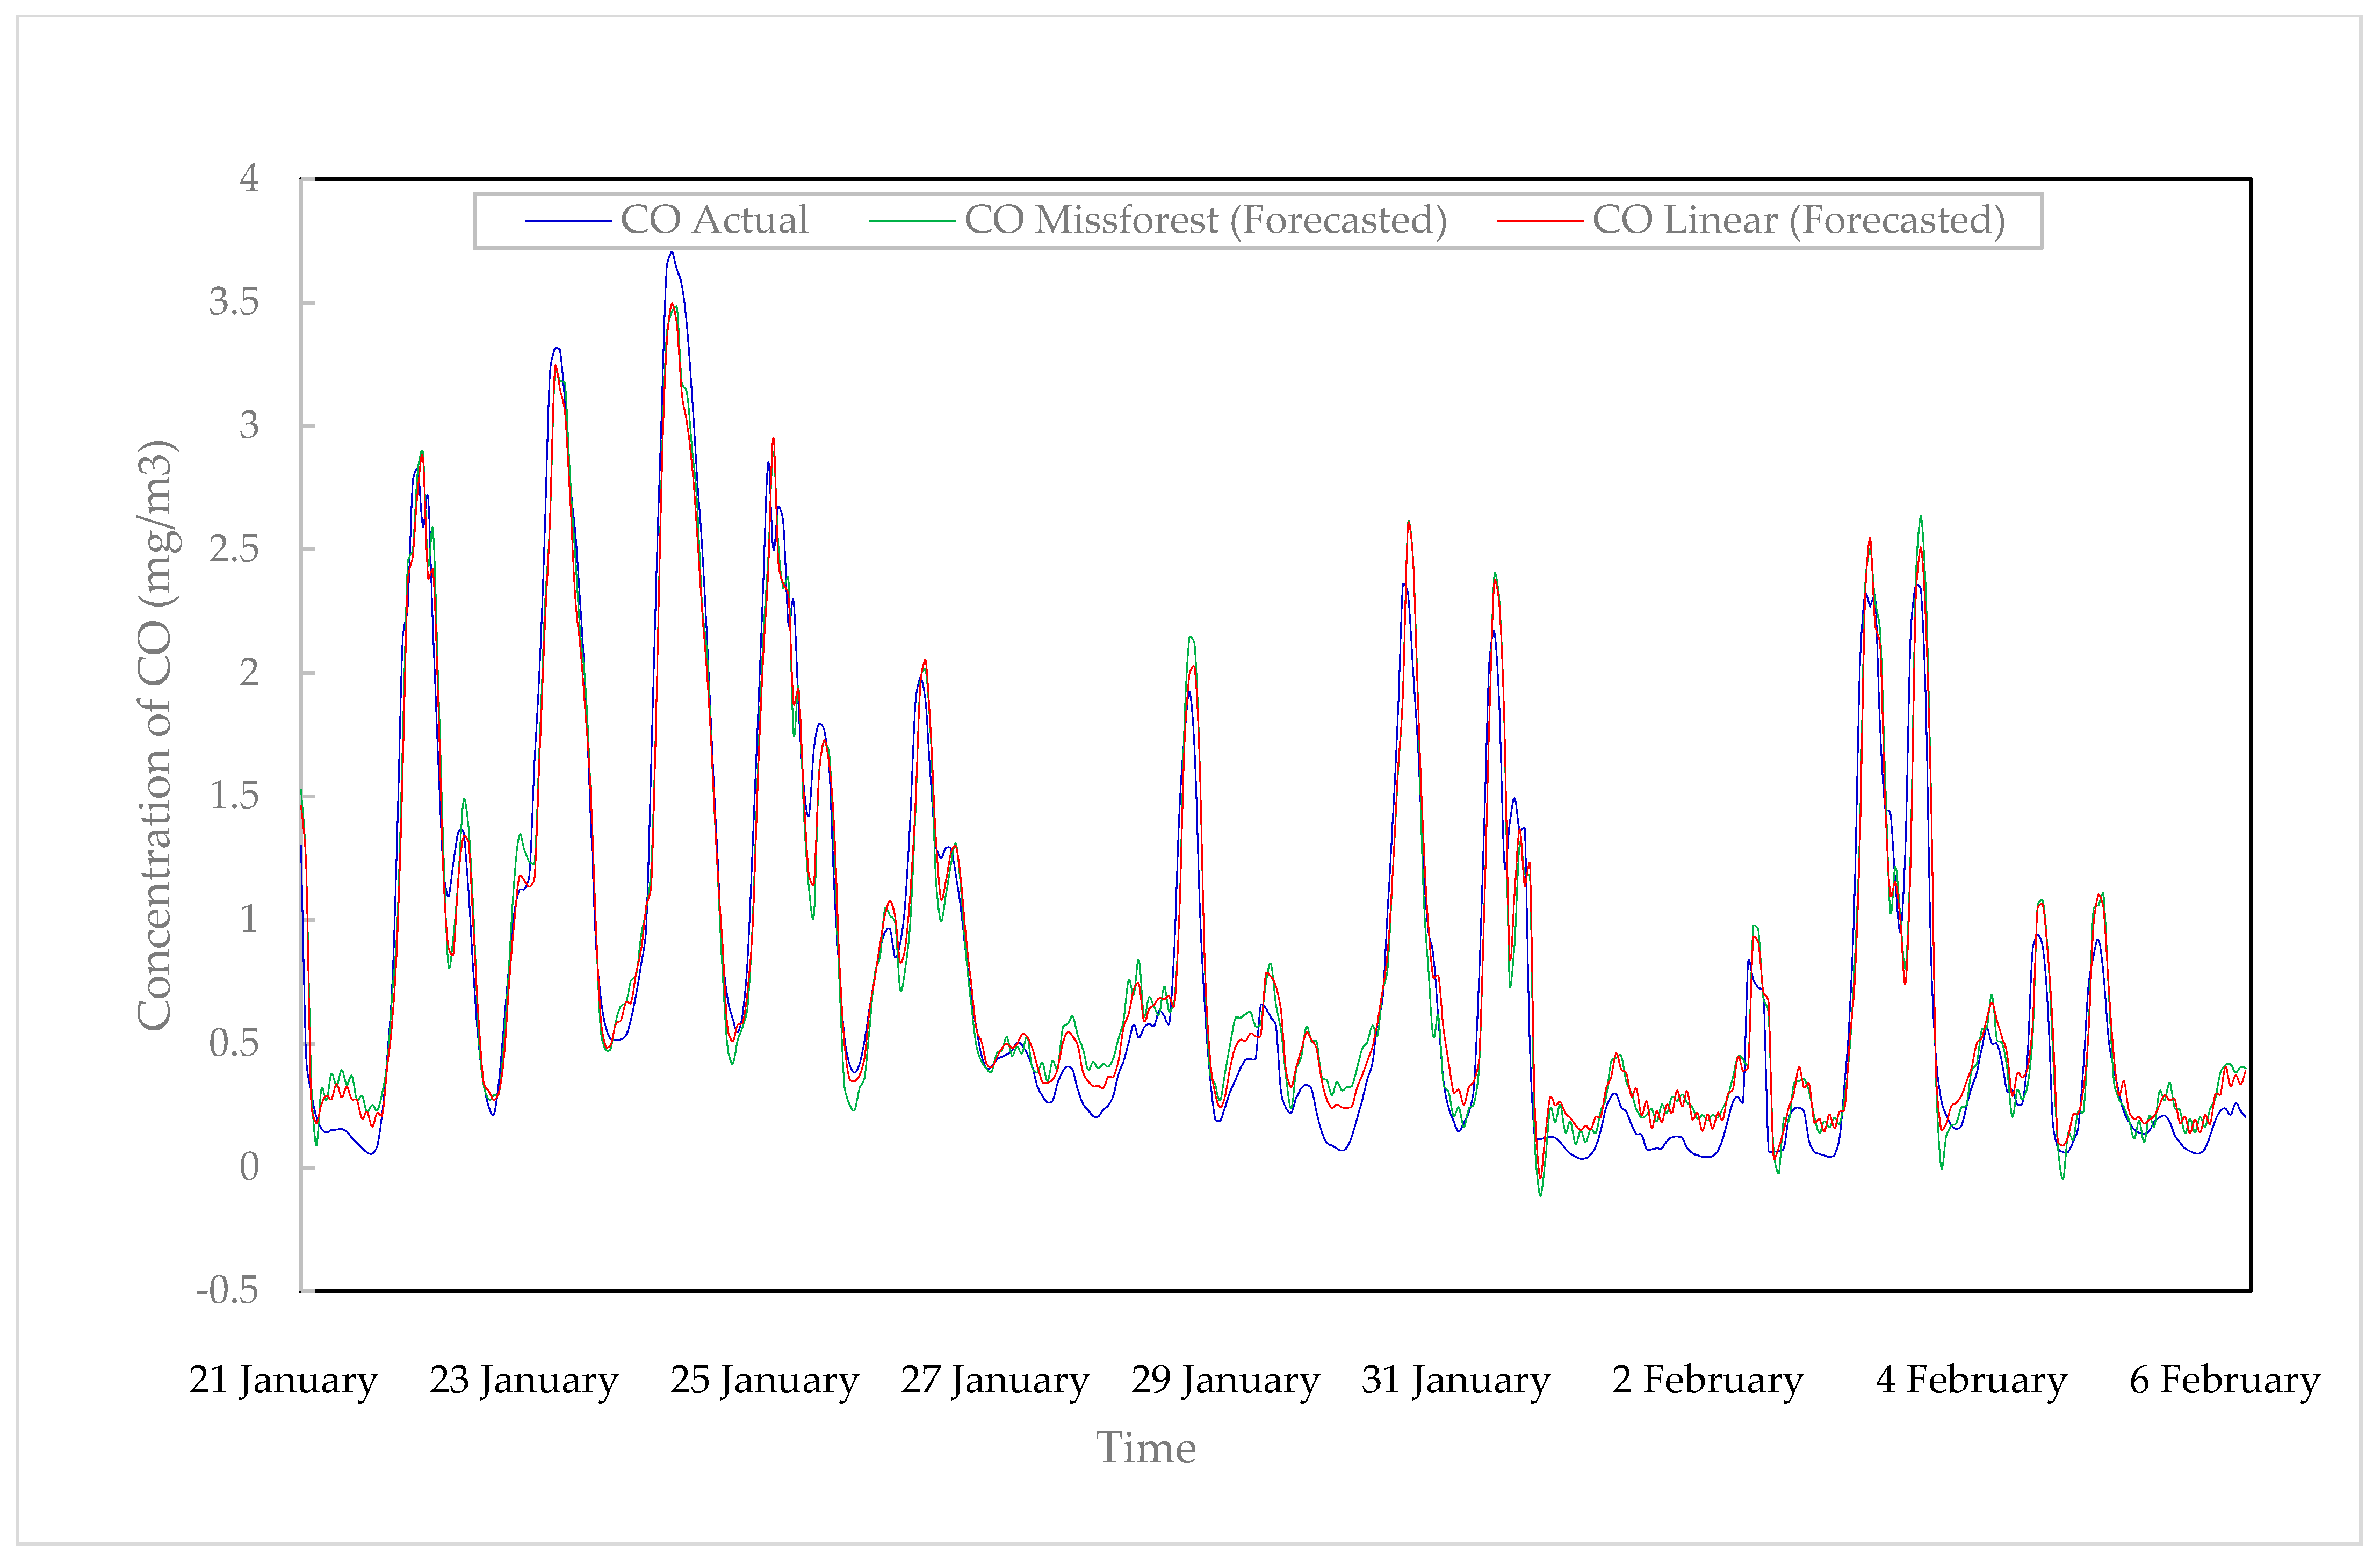
3.4. Carbon Monoxide (CO)

As demonstrated in Table 7, forecasted CO levels are more accurate for the linear imputed model; nevertheless, both models could be considered accurate and reliable. Figure 7 compares the predictions of the two considered models for the same 15-day period. Both models seem to usually overestimate CO levels at troughs. An 8 hidden-unit model in [26] forecast the hourly concentration with 152.1 µg/m3, which is about 96% of the values reported here. On the other hand, the SVM with the 2nd order polynomial-imputation, reported by [27], had MAE values of 119.0 µg/m3 and 311.0 µg/m3 for the training and testing sets, respectively.

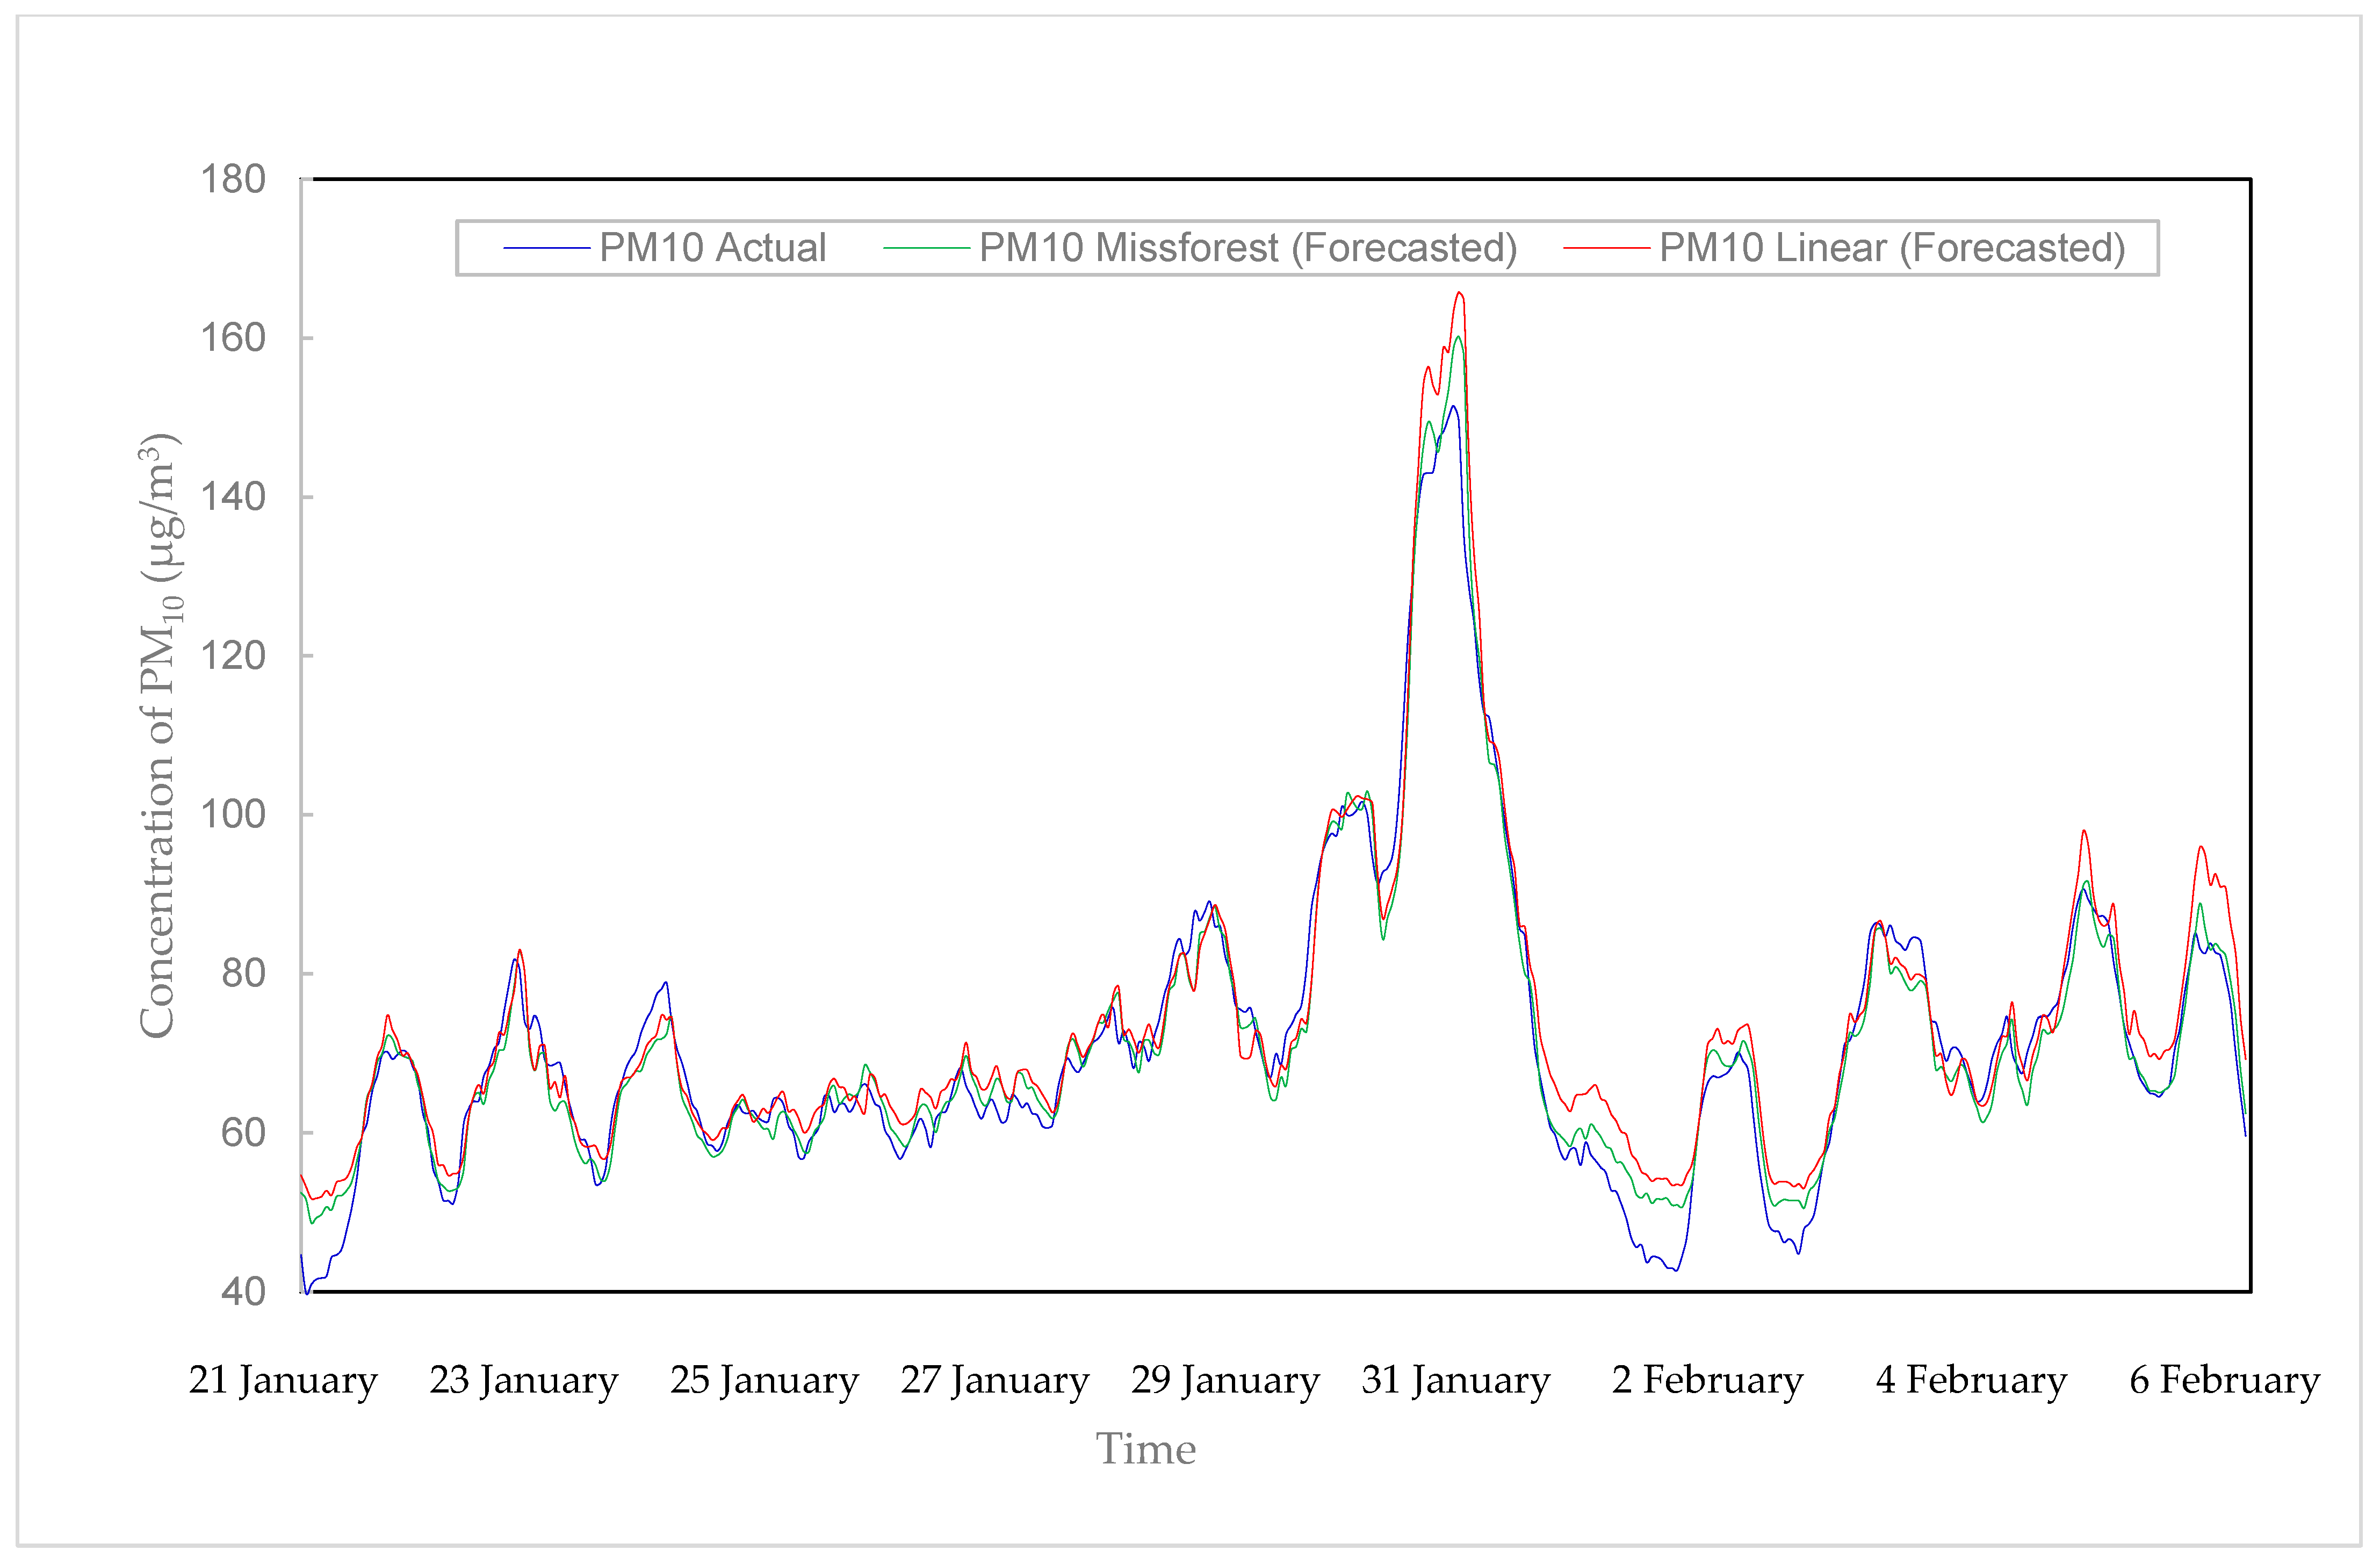
3.5. Particulate Matter-10 (PM10)

When comparing the results reported in Table 7, the MSE of the linear-imputed testing dataset is lower than the one achieved by the missForest-imputed model. On the other hand, lower MAE is achieved by the missForest-imputed model. Figure 8 compares the predicted concentrations for the same 15-day period. Except for some occasions, both models overestimated PM10 levels.
The assessment study performed by [44] compared the performance of the ANN to another statistical model for forecasting the hourly PM10 in urban cities. The testing experiments carried out in this study showed superior performance of a hybrid ARIMA model over the ANN where the determined MAE metrics were 8.80 µg/m3 and 28.57 µg/m3 for the hybrid ARIMA and ANN, respectively. On the other hand, the ANN model in [26] forecast the hourly PM10 with and MAE value of 15.5 µg/m3.

3.6. Particulate Matter-2.5 (PM2.5)

Similar to the case of PM10, both models are considered reliable for forecasting PM2.5, with missForest being slightly superior when it comes to MAE (Table 7). Figure 9 shows that both the minimum and maximum values are overestimated in some cases by both models. Also, both models seem to lag in response when compared to the actual data.
The SVM with the 2nd order polynomial-imputation technique, reported by [27], had an RMSE value of 184 µg/m3. Another multivariate imputation technique using the k-nearest neighbors (K-NN) algorithm was used in the comparative study in [45] before forecasting the PM2.5 levels using different effective and robust deep learning (DL) methodologies. In that study, different missing rates were tested to confirm the reliability of K-NN imputation for further validation. The reported RMSE value for the PM2.5 forecasting had an average of 24 μg/m3.

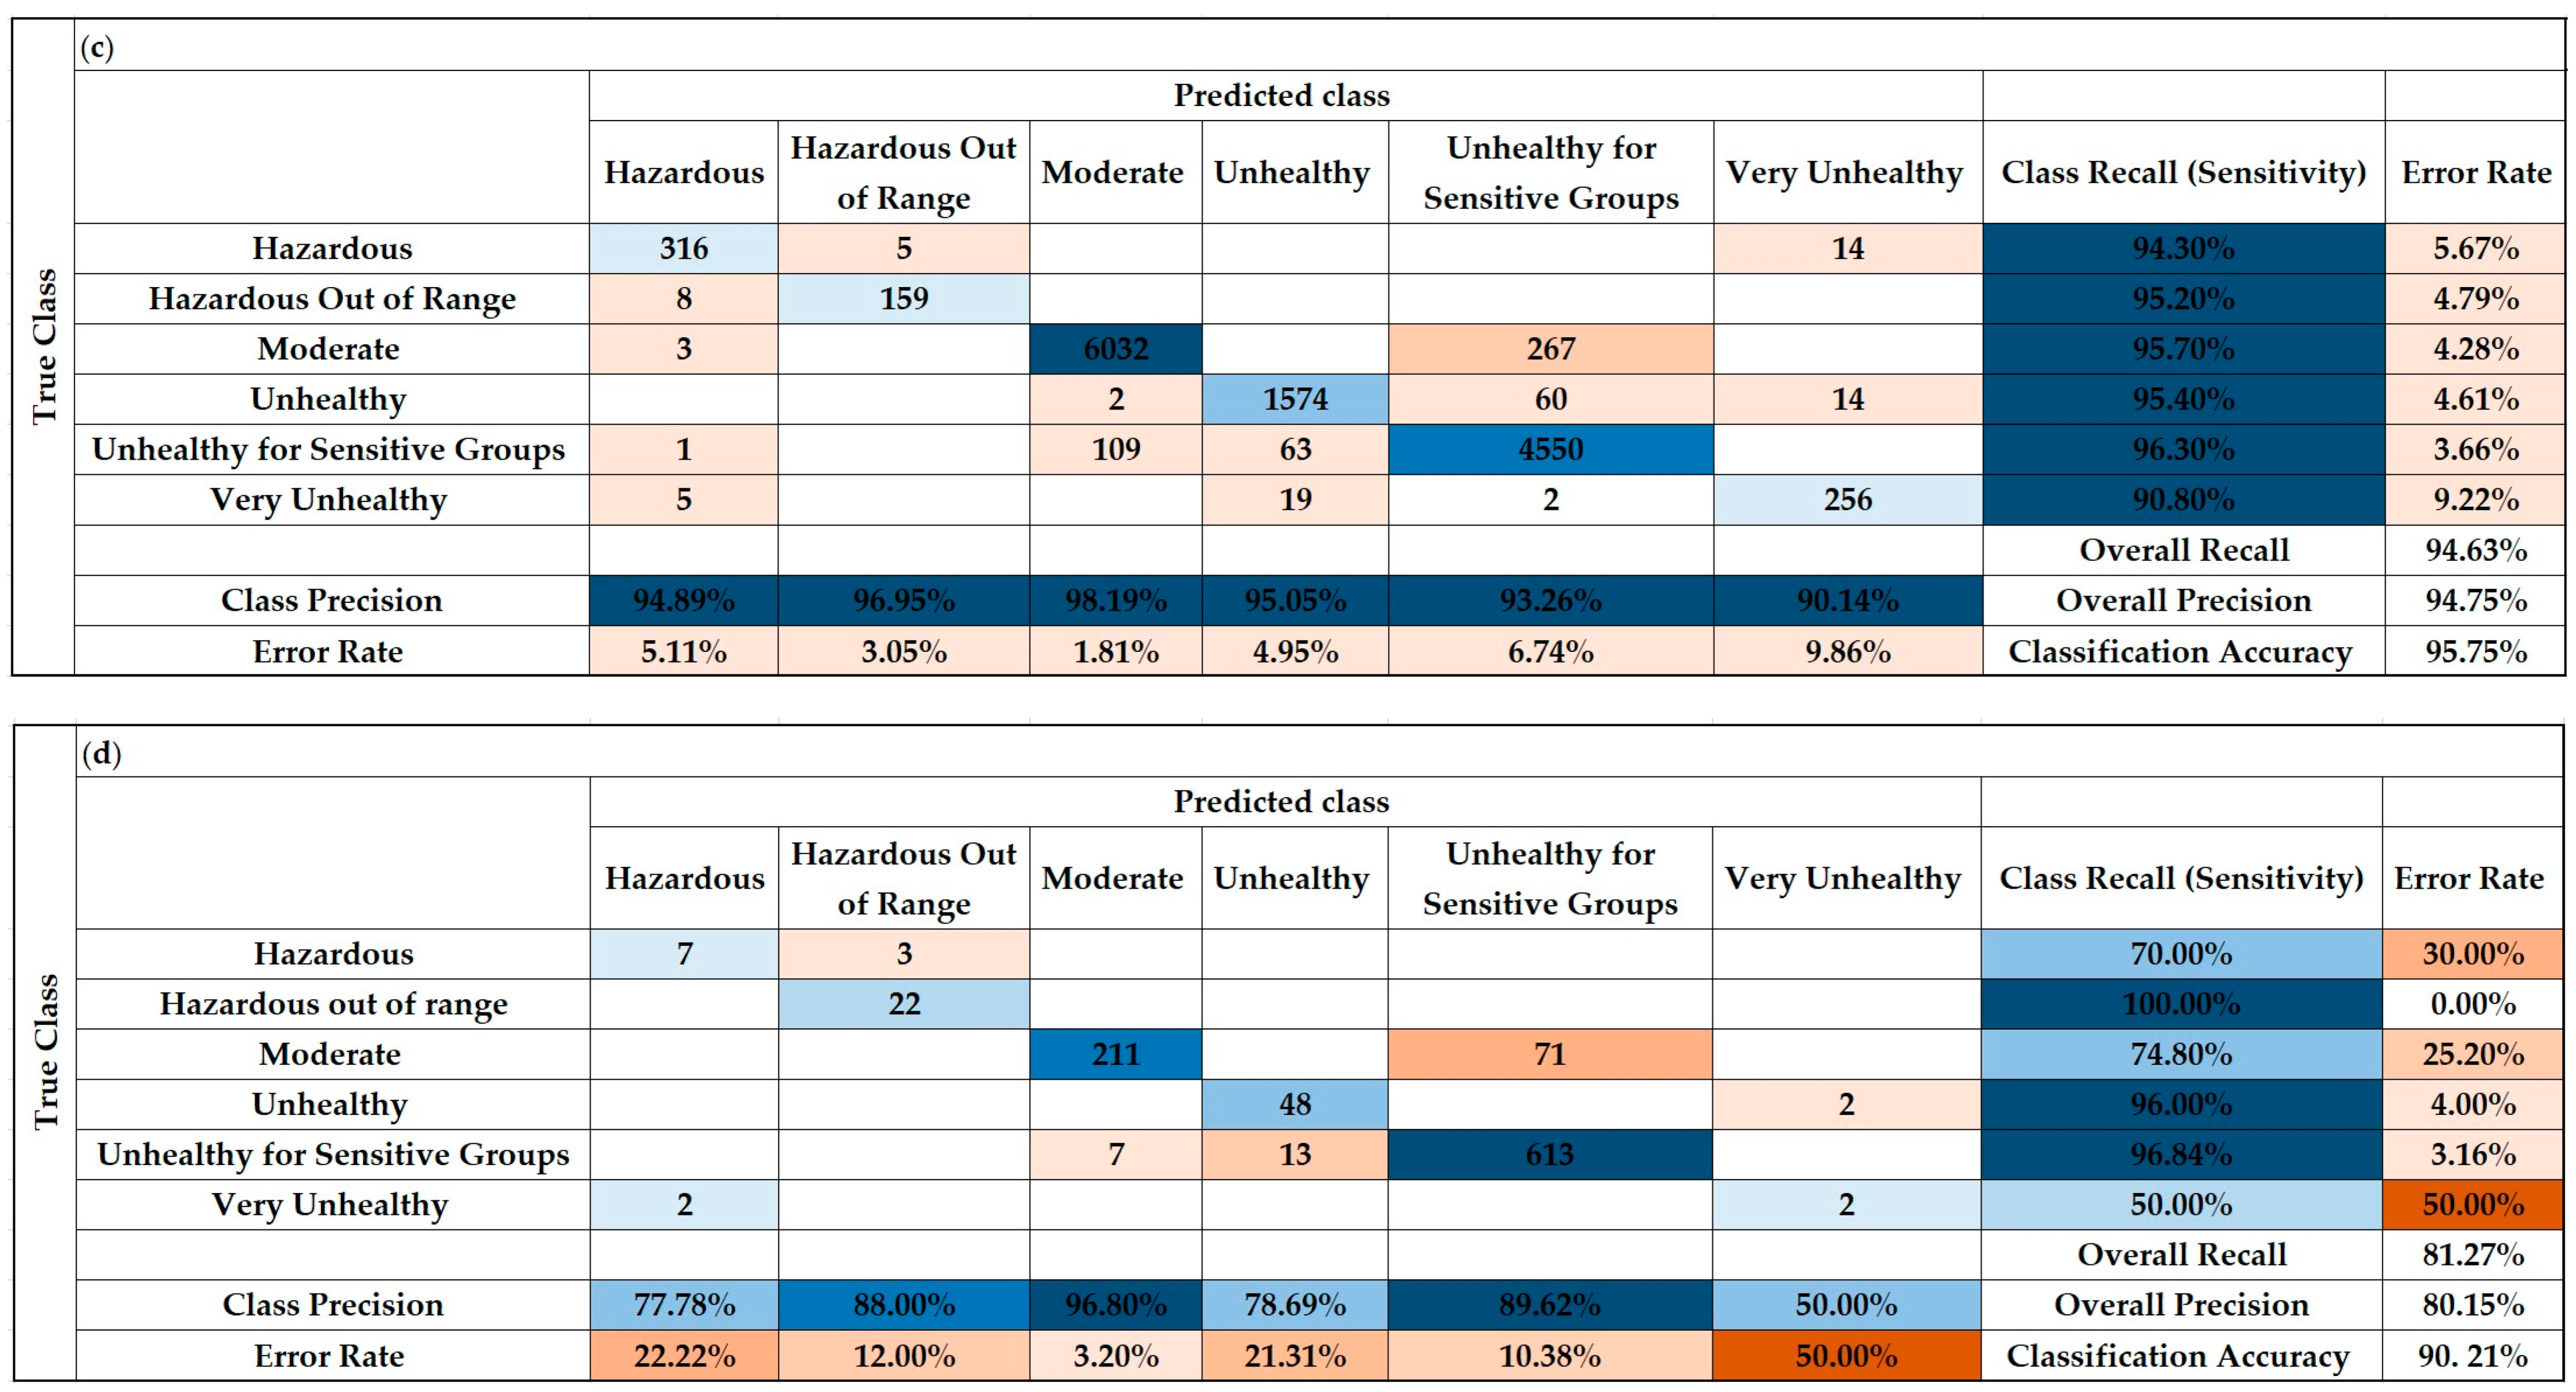
3.7. Hourly Forecast of Air Quality Index (AQI)

The AQI calculated from the actual and forecasted data is analyzed and compared in this section. Figure 10 shows that both models were able to predict AQI peaks on some occasions. In some instances, both models predicted peaks which did not match the actual AQI value.
Table 8 summarizes the error metrics of forecasting the AQI values, while Figure 11a–d represents a detailed confusion matrix chart comparing the actual and forecasted results of both models’ training and testing sets. Upon inspection, one observes that the missForest imputation technique outperforms the linear one in forecasting generalization, e.g., the missForest MAE value was 3.27 compared to 4.69 for the linear imputed data. The linear imputed datasets achieved an overall classification accuracy of 95.75% on the training set and 90.31% on the testing data set, whereas the missForest-imputed dataset performed better and achieved a classification accuracy of 95.65% and 92.48% for training and testing sets, respectively. These results confirm that coupling ANN with missForest-imputed data leads to higher-accuracy forecasting and better generalization when tested on unseen data. Conversely, the gap between the testing and training accuracies of the linear-imputed model is considerable and reflects the weakness of this model to perform with moderately consistent accuracy when validated with unseen data.
In addition to the importance of forecasting the AQI and accurately classifying its category, it is also essential to report the corresponding critical pollutant with the highest AQI value. Reliable reporting of this pollutant can contribute to investigating the sources of pollution to take prior precautionary actions. Table 9 shows a precise count of the true and false defined categories and critical pollutants for both training and testing sets of the two models. From that table, similar superiority of the missForest model can be observed, where both the air quality category and the corresponding pollutant were correctly classified in 95.64% of overall cases of the training set and 92.41% for the testing set.
Table 10 lists a selection of AQI forecasting efforts using different imputation and prediction methodologies. For example, authors in [46] tested different forecasting models, i.e., support vector regression (SVR), nonlinear auto-regressive (NAR), and cloud model granulation (CMG), with mean imputed data. The highest obtained accuracy of forecasting the AQI was 71.43% (CMG). Comparing this accuracy to the 92.4% achieved accuracy in our study emphasizes the importance of not only the forecasting model but also the imputation technique. To illustrate this point further, the reader’s attention is drawn to the difference in accuracies when the same forecasting method, i.e., SVR, is used but with different imputation methods (study [46] reported 57.14% accuracy with mean value imputation while study [27] reported 94.2% accuracy with the multivariate 2nd order polynomial method). The ANN’s superiority and the impact of the proposed imputation approach can be further illustrated when comparing the present results with those reported in [47], where a 7.57 MAE value was achieved with expectation-maximization (EM)-imputed data with a linear regression model, while for the presented work the MAE results calculated for our model ranged between 3.27–4.69.

4. Conclusions and Future Work

Forecasting AQI is a task which requires attention to multiple factors, including the missing observations in raw training data, the high inconsistency in data, the proper selection of predictors and lags, and the high temporal correlations between the concentrations of pollutants. Also of significant importance are the good choice of a forecasting model and its accurate hyperparameter tuning. This paper proposed an approach considering all of these factors.
Two different imputation methodologies were tested by training an optimized ANN for forecasting the six criteria pollutant levels, and classifying the hourly AQI and identifying the pollutant corresponding to the highest AQI. Although both trained models performed adequately, more generalized forecasting was observed by the models trained using the missForest-imputed dataset. While modeling the pollutant’s level with the selected features was adequate for almost all the pollutants, further analysis and testing should be taken for forecasting SO2 levels, since its predictions were the least accurate.
The presented work strengthens the argument that traditional mean and median imputation methods are not satisfactory for environmental and meteorological data due to their temporal dependencies and high correlations, necessitating the implication of the multivariate imputation methods. Incorporating strong prediction methods with these multivariate imputation techniques is expected to improve forecasting accuracy.
Multivariate imputation can reliably deal with the issue of gaps in datasets, which is generally common for environmental observations. Nevertheless, it is essential to mention that the forecasting horizon, forecasting models, hyperparameter tuning of these models, and selected features of forecasting are all factors that can also affect the overall prediction accuracy.
Future work will focus on investigating the additional features that can improve the accuracy of SO2 forecasting, as it would enhance overall AQI forecasting. Also, the employment of other robust ML forecasting methods such as support vector machines, which is expected to improve modeling and reliability, will be explored. Finally, conducting a comprehensive study, considering all the different factors, and comparing different combinations and scenarios with the aim set to improve forecasting accuracy will also be considered in future work.

Author Contributions

Conceptualization, A.R. and A.E.; methodology, A.R. and H.A.; software, H.A.; validation, A.R.; formal analysis, H.A.; investigation, A.E.; resources, A.E. and Q.Z..; data curation, H.A.; writing—original draft preparation, H.A.; writing—review and editing, A.R., A.E. and Q.Z.; visualization, H.A. and A.R.; supervision, A.E. and Q.Z.; project administration, A.E. and Q.Z.; funding acquisition, A.E. and Q.Z. All authors have read and agreed to the published version of the manuscript.

Funding

This research was funded by Natural Sciences and Engineering Research Council, grant number 50503-10770-500.

Institutional Review Board Statement

Not applicable.

Informed Consent Statement

Not applicable.

Data Availability Statement

Data set available on request to corresponding authors.

Acknowledgments

We acknowledge the financial support provided by the Natural Sciences and Engineering Research Council of Canada (NSERC) to carry out the research work presented in this article.

Conflicts of Interest

The authors declare no conflict of interest. The funders had no role in the design of the study; in the collection, analyses, or interpretation of data; in the writing of the manuscript, or in the decision to publish the results.

References

  1. Ramadan, A. Detailed analysis of power generation and water desalination sector emissions-part 1: Criteria pollutants and BTEX. Int. J. Environ. Sci. Technol. 2022, 19, 763–774. [Google Scholar] [CrossRef]
  2. Thomas, R.J.; Turkelboom, F. An Integrated Livelihoods-Based Approach to Combat Desertification in Marginal Drylands. In The Future of Drylands; Springer: Dordrecht, The Netherlands, 2008; pp. 631–646. [Google Scholar]
  3. Nanney, R.D.; Fryrear, D.W.; Zobeck, T.M. Wind Erosion Prediction and Control. Water Sci. Technol. 1993, 28, 519–527. [Google Scholar] [CrossRef]
  4. Al-Dousari, A.; Ramadan, A.; Al-Qattan, A.; Al-Ateeqi, S.; Dashti, H.; Ahmed, M.; Al-Dousari, N.; Al-Hashash, N.; Othman, A. Cost and Effect of Native Vegetation Change on Aeolian Sand, Dust, Microclimate and Sustainable Energy in Kuwait. J. Taibah Univ. Sci. 2020, 14, 628–639. [Google Scholar] [CrossRef]
  5. Al-Kulaib, A. Weather and Climate of Kuwait; Al-Qabas Press: Kuwait City, Kuwait, 1992. [Google Scholar]
  6. Al-Dousari, A.; Doronzo, D.; Ahmed, M. Types, Indications and Impact Evaluation of Sand and Dust Storms Trajectories in the Arabian Gulf. Sustainability 2017, 9, 1526. [Google Scholar] [CrossRef] [Green Version]
  7. Blott, S.; Al-Dousari, A.M.; Pye, K.; Saye, E.S. Three-Dimensional Characterization of Sand Grain Shape and Surface Texture Using a Nitrogen Gas Adsorption Technique. J. Sediment. Res. 2004, 74, 156. [Google Scholar] [CrossRef]
  8. Al-Dousari, A.; Al-Enezi, A.; Al-Awadhi, J. Textural Variations within Different Representative Types of Dune Sediments in Kuwait. Arab. J. Geosci. 2008, 1, 17–31. [Google Scholar] [CrossRef]
  9. World Health Organization. Particulate matter (PM2.5 and PM10), ozone, nitrogen dioxide, sulfur dioxide and carbon monoxide. In WHO Global Air Quality Guidelines; World Health Organization: Geneva, Switzerland, 2021; Licence: CC BY-NC-SA 3.0 IGO. [Google Scholar]
  10. Anenberg, S.C.; Henze, D.K.; Tinney, V.; Kinney, P.L.; Raich, W.; Fann, N.; Malley, C.S.; Roman, H.; Lamsal, L.; Duncan, B.; et al. Estimates of the Global Burden of Ambient PM2.5, Ozone, and NO2 on Asthma Incidence and Emergency Room Visits. Environ. Health Perspect. 2018, 126, 1289. [Google Scholar] [CrossRef] [Green Version]
  11. Balluz, L.; Wen, X.; Town, M.; Shire, J.; Qualter, J.; Mokdad, A. Ischemic Heart Disease and Ambient Air Pollution of Particulate Matter 2.5 in 51 Counties in the U.S. Public Health Rep. 2007, 122, 626–633. [Google Scholar] [CrossRef]
  12. Brunekreef, B.; Forsberg, B. Epidemiological Evidence of Effects of Coarse Airborne Particles on Health. Eur. Respir. J. 2005, 26, 309–318. [Google Scholar] [CrossRef]
  13. Laden, F.; Schwartz, J.; Speizer, F.; Dockery, D. Reduction in Fine Particulate Air Pollution and Mortality—Extended Follow-up of the Harvard Six Cities Study. Am. J. Respir. Crit. Care Med. 2006, 173, 667–672. [Google Scholar] [CrossRef] [Green Version]
  14. Schwartz, J.; Dockery, D.; Neas, L. Is Daily Mortality Associated Specifically with Fine Particles? J. Air Waste Manag. Assoc. 1996, 46, 927–939. [Google Scholar] [CrossRef] [PubMed]
  15. Kaku, K.C.; Reid, J.S.; Reid, E.A.; Ross-Langerman, K.; Piketh, S.; Cliff, S.; Al Mandoos, A.; Broccardo, S.; Zhao, Y.; Zhang, J.; et al. Investigation of the Relative Fine and Coarse Mode Aerosol Loadings and Properties in the Southern Arabian Gulf Region. Atmos. Res. 2016, 169, 171–182. [Google Scholar] [CrossRef] [Green Version]
  16. Alolayan, M.A.; Brown, K.W.; Evans, J.S.; Bouhamra, W.S.; Koutrakis, P. Source Apportionment of Fine Particles in Kuwait City. Sci. Total Environ. 2013, 448, 14–25. [Google Scholar] [CrossRef]
  17. National Air Quality Strategy; Kingdom of Bahrain Supreme Council for Environment (SCE): Seef, Bahrain, 2020.
  18. Ramanathan, V. Climate Change, Air Pollution, and Health: Common Sources, Similar Impacts, and Common Solutions. In Health of People, Health of Planet and Our Responsibility; Springer International Publishing: Cham, Switzerland, 2020; pp. 49–59. [Google Scholar] [CrossRef]
  19. Connell, D.W. Basic Concepts of Environmental Chemistry; CRC Press: Boca Raton, FL, USA, 2005. [Google Scholar] [CrossRef]
  20. USEPA. Technical Assistance Document for the Reporting of Daily Air Quality—The Air Quality Index (AQI); United States Environmental Protection Agency: Durham, NC, USA, 2013; pp. 1–28.
  21. Lim, S.Y.; Chin, L.Y.; Mah, P.; Wee, J. Arima and Integrated Arfima Models for Forecasting Air Pollution Index in Shah Alam, Selangor. Malays. J. Anal. Sci. 2008, 12, 257–263. [Google Scholar]
  22. Zhu, J. Comparison of ARIMA Model and Exponential Smoothing Model on 2014 Air Quality Index in Yanqing County, Beijing, China. Appl. Comput. Math. 2015, 4, 456. [Google Scholar] [CrossRef] [Green Version]
  23. Karthikeyani, S.; Rathi, S. A Survey On Air Quality Prediction Using Traditional Statistics Method. Int. J. Sci. Res. Comput. Sci. Eng. Inf. Technol. 2020, 6, 942–946. [Google Scholar] [CrossRef]
  24. Zhang, P.G. Time Series Forecasting Using a Hybrid ARIMA and Neural Network Model. Neurocomputing 2003, 50, 159–175. [Google Scholar] [CrossRef]
  25. Wang, C.Y.; Zhang, W.Y.; Wang, J.J.; Zhao, W.F. The Prediction of SO2 Pollutant Concentration Using a RBF Neural Network. Appl. Mech. Mater. 2011, 55–57, 1392–1396. [Google Scholar] [CrossRef]
  26. Cai, M.; Yin, Y.; Xie, M. Prediction of Hourly Air Pollutant Concentrations near Urban Arterials Using Artificial Neural Network Approach. Transp. Res. Part D Transp. Environ. 2009, 14, 32–41. [Google Scholar] [CrossRef]
  27. Castelli, M.; Clemente, F.M.; Popovič, A.; Silva, S.; Vanneschi, L. A Machine Learning Approach to Predict Air Quality in California. Complexity 2020, 2020, 8049504. [Google Scholar] [CrossRef]
  28. Sankar Ganesh, S.; Arulmozhivarman, P.; Tatavarti, R. Forecasting Air Quality Index Using an Ensemble of Artificial Neural Networks and Regression Models. J. Intell. Syst. 2017, 28, 893–903. [Google Scholar] [CrossRef]
  29. Liaw, A.; Wiener, M. Classification and Regression by RandomForest. R News 2002, 2, 18–22. [Google Scholar]
  30. Sun, S.; Cao, Z.; Zhu, H.; Zhao, J. A Survey of Optimization Methods from a Machine Learning Perspective. arXiv 2019, arXiv:1906.06821. [Google Scholar] [CrossRef] [PubMed] [Green Version]
  31. Hong, S.; Lynn, H.S. Accuracy of Random-Forest-Based Imputation of Missing Data in the Presence of Non-Normality, Non-Linearity, and Interaction. BMC Med. Res. Methodol. 2020, 20, 199. [Google Scholar] [CrossRef]
  32. Athiyarath, S.; Paul, M.; Krishnaswamy, S. A Comparative Study and Analysis of Time Series Forecasting Techniques. SN Comput. Sci. 2020, 1, 175. [Google Scholar] [CrossRef]
  33. Tealab, A. Time Series Forecasting Using Artificial Neural Networks Methodologies: A Systematic Review. Futur. Comput. Inform. J. 2018, 3, 334–340. [Google Scholar] [CrossRef]
  34. Wu, B. An Introduction to Neural Networks and Their Applications in Manufacturing. J. Intell. Manuf. 1992, 3, 391–403. [Google Scholar] [CrossRef]
  35. Sarigül, M.; Avci, M. Performance Comparison of Different Momentum Techniques on Deep Reinforcement Learning. J. Inf. Telecommun. 2018, 2, 205–216. [Google Scholar] [CrossRef] [Green Version]
  36. Lever, J.; Krzywinski, M.; Altman, N. Points of Significance: Model Selection and Overfitting. Nat. Methods 2016, 13, 703–704. [Google Scholar] [CrossRef]
  37. Arhami, M.; Kamali, N.; Rajabi, M.M. Predicting Hourly Air Pollutant Levels Using Artificial Neural Networks Coupled with Uncertainty Analysis by Monte Carlo Simulations. Environ. Sci. Pollut. Res. 2013, 20, 4777–4789. [Google Scholar] [CrossRef]
  38. Nawi, N.M.; Atomi, W.H.; Rehman, M.Z. The Effect of Data Pre-Processing on Optimized Training of Artificial Neural Networks. Procedia Technol. 2013, 11, 32–39. [Google Scholar] [CrossRef] [Green Version]
  39. Brick, T.R.; Koffer, R.E.; Gerstorf, D.; Ram, N. Feature Selection Methods for Optimal Design of Studies for Developmental Inquiry. J. Gerontol. Ser. B 2018, 73, 113–123. [Google Scholar] [CrossRef] [PubMed] [Green Version]
  40. Degenhardt, F.; Seifert, S.; Szymczak, S. Evaluation of Variable Selection Methods for Random Forests and Omics Data Sets. Brief. Bioinform. 2019, 20, 492–503. [Google Scholar] [CrossRef] [PubMed] [Green Version]
  41. Gnana Sheela, K.; Deepa, S.N. An Intelligent Computing Model for Wind Speed Prediction in Renewable Energy Systems. Procedia Eng. 2012, 30, 380–385. [Google Scholar] [CrossRef] [Green Version]
  42. Gressling, T. 84 Automated Machine Learning; De Gruyter: Berlin, Germany, 2020. [Google Scholar] [CrossRef]
  43. Ettouney, R.S.; Mjalli, F.S.; Zaki, J.G.; El-Rifai, M.A.; Ettouney, H.M. Forecasting of Ozone Pollution Using Artificial Neural Networks. Manag. Environ. Qual. An Int. J. 2009, 20, 668–683. [Google Scholar] [CrossRef]
  44. Díaz-Robles, L.A.; Ortega, J.C.; Fu, J.S.; Reed, G.D.; Chow, J.C.; Watson, J.G.; Moncada-Herrera, J.A. A Hybrid ARIMA and Artificial Neural Networks Model to Forecast Particulate Matter in Urban Areas: The Case of Temuco, Chile. Atmos. Environ. 2008, 42, 8331–8340. [Google Scholar] [CrossRef] [Green Version]
  45. Samal, K.K.R.; Panda, A.K.; Babu, K.S.; Das, S.K. An Improved Pollution Forecasting Model with Meteorological Impact Using Multiple Imputation and Fine-Tuning Approach. Sustain. Cities Soc. 2021, 70, 102923. [Google Scholar] [CrossRef]
  46. Lin, Y.; Zhao, L.; Li, H.; Sun, Y. Air Quality Forecasting Based on Cloud Model Granulation. Eurasip J. Wirel. Commun. Netw. 2018, 2018, 106. [Google Scholar] [CrossRef] [Green Version]
  47. Kumar, R.; Kumar, P.; Kumar, Y. Time Series Data Prediction Using IoT and Machine Learning Technique. Procedia Comput. Sci. 2020, 167, 373–381. [Google Scholar] [CrossRef]
  48. Yu, R.; Yang, Y.; Yang, L.; Han, G.; Move, O. RAQ–A Random Forest Approach for Predicting Air Quality in Urban Sensing Systems. Sensors 2016, 16, 86. [Google Scholar] [CrossRef] [Green Version]
  49. Belavadi, S.V.; Rajagopal, S.; Ranjani, R.; Mohan, R. Air Quality Forecasting Using LSTM RNN and Wireless Sensor Networks. Procedia Comput. Sci. 2020, 170, 241–248. [Google Scholar] [CrossRef]
  50. Arora, H.; Solanki, A. Prediction of Air Quality Index in Metro Cities Using Time Series Forecasting Models Page No: 3052. J. Xi’an Univ. Archit. Technol. 2020, XII, 3052–3067. [Google Scholar]
  51. Singh, A. Air Pollution Forecasting and Performance Using Advanced Time Series and Deep Learning Approach for Gurgaon. Ph.D. Thesis, National College of Ireland, Dublin, Ireland, 2019. [Google Scholar]
Figure 1. The urban and rural PM2.5 annual mean concentrations in Kuwait (Source: WHO SDG Indicators 2020).
Atmosphere 13 01144 g001
Figure 2. Proposed Structure for ANN.
Atmosphere 13 01144 g002
Figure 3. The ACF and PACF for O3 (a,b), SO2 (c,d), NO2 (e,f), CO (g,h), PM10 (i,j), and PM2.5 (k,l).
Atmosphere 13 01144 g003aAtmosphere 13 01144 g003b
Figure 4. O3 prediction results for 21 January 2015 to 5 February 2015.
Atmosphere 13 01144 g004
Figure 5. NO2 prediction results for 21 January 2015 to 5 February 2015.
Atmosphere 13 01144 g005
Figure 6. SO2 prediction results for 21 January 2015 to 5 February 2015.
Atmosphere 13 01144 g006
Figure 7. CO prediction results for 12 January 2015 to 8 February 2015.
Atmosphere 13 01144 g007
Figure 8. PM10 prediction results for 12 January 2015 to 8 February 2015.
Atmosphere 13 01144 g008
Figure 9. PM2.5 prediction results for 21 January 2015 to 5 February 2015.
Atmosphere 13 01144 g009
Figure 10. AQI prediction results for 21 January 2015 to 5 February 2015.
Atmosphere 13 01144 g010
Figure 11. Confusion matrix for the AQI categories determined with the missForest-imputed model for (a) training set, (b) testing set and the AQI categories determined with the linear-imputed model for (c) training set, (d) testing set.
Atmosphere 13 01144 g011aAtmosphere 13 01144 g011b
Table 1. US-EPA definition of the six AQI categories.
Index ValueLevel of Health Concern Description
0–50GoodAir quality is satisfactory.
51–100Moderate Air quality is acceptable; however, there may be moderate health concerns for groups with unusual sensitivity to air pollution for some pollutants.
101–150Unhealthy for sensitive groupsOnly sensitive groups may experience health effects.
151–200UnhealthyAll individuals may start to experience health effects.
Sensitive groups may experience more severe effects.
201–300Very unhealthyHealth alert: everyone may experience serious health effects.
301–500HazardousHealth warning for emergency conditions.
Table 2. Summary of selected parameters.
TypeVariableMeasurement Unit
MeteorologicalTemperature°C
Wind speed m/s
Wind directiondeg
Relative humidity %
Criteria gases levelCO mg/m3
NO2 µg/m3
O3 µg/m3
PM10 µg/m3
PM2.5µg/m3
SO2 µg/m3
Table 3. Proportion of missing observations.
VariableMissing Rate (%)
NO210.96%
PM2.510.36%
O310.30%
SO28.01%
PM107.89%
CO6.70%
Temperature4.59%
Relative humidity1.89%
Wind speed1.16%
Wind direction1.16%
Time (year, month, day, hour)0%
Table 4. Summary of selected features per target. *, yes.
Target
O3 Conc.SO2 Conc.NO2 Conc.CO Conc.PM10 ConcPM2.5 Conc
Variable
Year******
sine month ******
cosine month ******
sine day ******
cosine day ******
sine hour ****RejectedRejected
cosine hour ******
O3 Conc. *****
SO2 Conc.* ****
NO2 Conc.** **
CO Conc.*** **
PM10 Conc.**** *
PM2.5 Conc.*****
Wind Speed******
Wind direction***Tentative**
Temperature******
Relative Humidity******
Table 5. The training procedure of the ANN is presented by pseudo-code.
Atmosphere 13 01144 i001
Table 6. Optimal number of nodes.
PollutantOptimal No. of Nodes (MissForest-Imputed Dataset)Optimal No. of Nodes (Linear-Imputed Dataset)
PM102012
PM2.51816
O31212
NO21012
SO21618
CO1416
Table 7. Forecasting models’ error metrics in the training and testing sets.
MissForest-Imputed DatasetLinear-Imputed Dataset
R2MSERMSE [µg/m3]MAE [µg/m3]R2MSERMSE [µg/m3]MAE [µg/m3]
O3Training0.971526.7955.1764.0330.97228.4515.3344.223
Testing0.92931.1125.5784.5540.87455.2347.4326.561
NO2Training0.839166.62112.9089.1640.865142.79811.957.864
Testing0.778160.36512.6649.9850.764144.79712.0339.948
SO2Training0.529297.39517.2456.6110.486455.12821.3347.199
Testing0.511191.01513.8216.010.334261.05216.1579.745
CO *Training0.9190.0250.1580.0970.9270.0230.1530.088
Testing0.9170.0450.2110.1690.9210.0410.2010.158
PM10Training0.978252.38615.8876.140.974371.86319.2847.577
Testing0.969482.34521.9627.9790.978347.35918.6389.403
PM2.5Training0.97727.9575.2872.4620.97926.2085.1192.356
Testing0.97114.1093.7562.7840.97412.7513.5712.889
* For CO, RMSE and MAE are expressed in mg/m3.
Table 8. Forecasting models’ error metrics for AQI in the training and testing sets.
MissForest-Imputed Dataset Linear-Imputed Dataset
Training Testing Training Testing
R20.810.930.780.98
MSE131.2595.18178.56297.05
RMSE11.469.7613.3617.24
MAE3.003.273.344.69
Table 9. Count of true and false forecasted AQI categories and critical pollutants.
ConditionTraining MissForest-ImputedTesting MissForest-Imputed
Category = True and Critical pollutant = True 12597924
Category = False and Critical pollutant = True55176
Category = True and Critical pollutant = False2761
Category = False and Critical pollutant = False350
ConditionTraining Linear-ImputedTesting Linear-Imputed
Category = True and Critical pollutant = True 12636901
Category = False and Critical pollutant = True53698
Category = True and Critical pollutant = False2512
Category = False and Critical pollutant = False360
Table 10. Comparison between a selection of different forecasting methods.
Forecasting MethodImputation MethodForecasting Target(s)Evaluation MetricsRef.
ANNMissForest + linear imputationCAPs + AQI (1 h)Accuracy: 92.48% (missForest)/90.31% (Linear)
RMSE: 9.76 (missForest)/17.24 (Linear)
Current work
Random forestN/AAQI (1 h)81.6% classification accuracy[48]
LSTM -RNNValues of the previous week at the same time were used to fill gaps. If that last week’s values were also missing, mean imputation was usedCAP levels in two regions in India, using two data sources (1–5 h)RMSE: 30–40 ppm (source 1)/0–5 ppm (source 2)[49]
SVM2nd order polynomial to impute missing observations in pollutants levels and meteorological dataCAPs + AQI (1 h)Accuracy: 94.1% (on unseen validation data)[27]
RBF NNN/ASO2 (24 h)MAPE: 9.91%[25]
SVR, NAR, CMGMean value imputationCAPs + AQI (24 h)Accuracy (on AQI):
CMG: 71.43%
SVR: 57.14%
NAR: 28.57%
[46]
Linear regressionExpectation-Maximization algorithmAQI (24 h)MAE: 7.57[47]
Compared different statistical, ML, and DL methods for forecastingK-NN for missing data imputation with varying missingness ratesPM2.5 (96 h multi-step-ahead forecasting) with different combinations of meteorological features to investigate their importance and effect on forecasting accuracyMultiple error metrics were compared for all the forecasting methods; the Convolutional-LSTM–SDAE model surpassed other models with RMSE = 24 μg/m3[45]
SARIMAMean and median imputationNO2 (24 h)
SO2 (24 h)
MAPE: 3% (NO2)/7% (SO2)[50]
Compared different forecasting methodsSeasonal adjustment coupled with linear interpolationAQI (8 h)The additive regression PROPHET model outperformed other forecasting models with RMSE = 9.00 (AQI)[51]
SDAE = Stacked Denoising Autoencoder is an unsupervised pre-training algorithm. LSTM: Long Short-Term Memory. SVR: Support Vector Regression. SVM: Support Vector Machine. SARIMA: Seasonal Autoregressive Integrated Moving Average. MAPE: Mean Absolute Percentage Error. RNN: Recurrent Neural Network. RBF: Radial Basis Function. NAR: Nonlinear Auto-Regressive. CMG: Cloud Model Granulation.
Publisher’s Note: MDPI stays neutral with regard to jurisdictional claims in published maps and institutional affiliations.

