Article

Characteristics and Sources of Volatile Organic Compounds in the Nanjing Industrial Area

1
Key Laboratory for Aerosol-Cloud-Precipitation of China Meteorological Administration, Nanjing University of Information Science and Technology, Nanjing 210044, China
2
State Key Laboratory of Atmospheric Boundary Layer Physics and Atmospheric Chemistry (LAPC), Institute of Atmospheric Physics, Chinese Academy of Sciences, Beijing 100029, China
3
Weather Modification Office of Qinghai Province, Xining 810000, China
4
Hohhot Meteorological Bureau, Hohhot 010020, China
5
Nanjing Star-Jelly Environmental Consultants Co., Ltd., Nanjing 210003, China
*
Author to whom correspondence should be addressed.
Atmosphere 2022, 13(7), 1136; https://doi.org/10.3390/atmos13071136
Submission received: 26 May 2022 / Revised: 11 July 2022 / Accepted: 14 July 2022 / Published: 18 July 2022

Abstract

:
In this study, 56 volatile organic compounds species (VOCs) and other pollutants (NO, NO2, SO2, O3, CO and PM2.5) were measured in the northern suburbs of Nanjing from September 2014 to August 2015. The total volatile organic compound (TVOC) concentrations were higher in the autumn (40.6 ± 23.8 ppbv) and winter (41.1 ± 21.7 ppbv) and alkanes were the most abundant species among the VOCs (18.4 ± 10.0 ppbv). According to the positive matrix factorization (PMF) model, the VOCs were found to be from seven sources in the northern suburbs of Nanjing, including liquefied petroleum gas (LPG) sources, gasoline vehicle emissions, iron and steel industry sources, industrial refining coke sources, solvent sources and petrochemical industry sources. One of the sources was influenced by seasonal variations: it was a diesel vehicle emission source in the spring, while it was a coal combustion source in the winter. According to the conditional probability function (CPF) method, it was found that the main contribution areas of each source were located in the easterly direction (mainly residential areas, industrial areas, major traffic routes, etc.). There were also seasonal differences in concentration, ozone formation potential (OFP), OH radical loss rate (LOH) and secondary organic aerosols potential (SOAP) for each source due to the high volatility of the summer and autumn temperatures, while combustion increases in the winter. Finally, the time series of O3 and OFP was compared to that PM2.5 and SOAP and then they were combined with the wind rose figure. It was found that O3 corresponded poorly to the OFP, while PM2.5 corresponded well to the SOAP. The reason for this was that the O3 generation was influenced by several factors (NOx concentration, solar radiation and non-local transport), among which the influence of non-local transport could not be ignored.

1. Introduction

As gaseous pollutants, there are hundreds of species of volatile organic compounds (VOCs) and their sources are also very complex, including vehicle exhausts, fuel evaporation, industrial processes, household products and solvent usage [1,2,3,4]. Many VOCs can have adverse effects on public health. For example, BTEX, which comprises the persistent environmental pollutants of benzene, toluene, ethylbenzene and xylenes in the air [5], poses significant health risks from long-term exposure, including the irritation of the mucous membranes, eyes and throat [6]. According to the World Health Organization (WHO), a lifetime exposure to a benzene concentration of 1.7 μg·m−3 can lead to a 1 in 100,000 chance of developing leukemia among the urban population [7]. Similarly, toluene, xylene and ethylbenzene pose teratogenic and mutagenic hazards [8].
VOCs are also important precursors for secondary organic aerosols (SOAs) and ozone (O3) [9,10]. With our accelerated urbanization and increased levels of car ownership, increasing O3 pollution is becoming a major pollution feature in various developed regions [11,12,13,14]. As a major source of photochemical pollution, ozone not only directly affects human and ecological health but also global atmospheric warming because it is a greenhouse gas [15,16,17]. Additionally, due to the increase in atmospheric oxidation that is caused by increased O3 pollution, a combination of O3 and PM2.5 pollution frequently occurs. Therefore, reducing VOC emissions is crucial for air pollution control in China [18].
The northern suburbs of Nanjing, which make up one of the important industrial areas in Nanjing, contains many heavy industries. The production, storage and transportation processes of the local heavy industries, such as petrochemical companies, are the main sources of atmospheric VOCs [19]. At the same time, the proximity of the industrial area to major traffic routes and residential areas makes the sources of VOC more complex to determine. Therefore, to clarify the characteristics and sources of local VOC changes, reasonable VOC emission reduction measures need to be formulated as a reduction in VOCs could also have a positive effect on the control of O3 and PM2.5 due to the highly reactive VOCs with high O3 formation potential (OFP) and secondary organic aerosols potential (SOAP). Previous studies in Nanjing have mostly focused on the detection and source analysis of VOCs within a single season with less of a focus on the detection of VOCs throughout a whole year, which cannot reflect the changing characteristics of VOCs and their sources in different seasons [20,21,22]. Therefore, it has not been possible to develop reasonable measures for the different seasons because unreasonable emission reduction measures can lead to both a decline in industrial production and the potential aggravation of air pollution.
To figure out the effects of seasonal changes in VOC emissions on the VOC sources, continuous atmospheric VOC observation data from September 2014 to August 2015 were collected in this study to provide a basis and reference for the control of atmospheric VOC emissions in Nanjing. September to November 2014, December 2014 to February 2015, April to May 2015 and June to August 2015 represented the autumn, winter, spring and summer seasons, respectively.
In previous studies, four main receptor models have been used to determine the sources of VOCs: the chemical mass balance (CMB) [23,24], positive matrix factorization (PMF) [25,26], principal component analysis (PCA) [27,28] and UNMIX models [29,30]. Recently, the PMF model has been widely used to determine VOC sources in urban or rural areas, which only needs the input of concentration and uncertainty data [31,32,33]. In this study, the VOC concentrations, VOC components and the percentages of different hydrocarbons were analyzed. The source analysis and identification of the VOCs in different seasons were performed using the PMF source resolution model and the CPF conditional probability function. Finally, the contribution of the local VOCs to O3 and PM2.5 generation in Nanjing was discussed using the OFP and SOAP metrics.

2. Methodology

2.1. Sampling Site and Data Description

The observation site was located on the meteorology building (32.2° N; 118.7° E) of the Nanjing University of Information Science and Technology, which is surrounded by no tall buildings that block the site. The observation site was adjacent to the Nanjing High-Tech Industrial Development Zone and the Nanjing Chemical Industrial Park (5~15 km apart). Heavy industries are located in the industrial park, mainly including petrochemical, fine chemical, iron, steel and electric power companies. The wind directions around the observation site in the different seasons are shown in Figure 1.
The 56 VOC species were monitored using a GC5000 automatic online gas chromatography–flame ionization detector (GC-FID) from AMA Instruments GmbH (AMA, Germany). The GC5000 is a chromatograph that combines automatic sampling, enrichment and analysis functions, including GC5000-VOC (dual-stage enrichment) and GC5000-BTX (single-stage enrichment), which are two sets of independent analytical chromatographs that measure the low boiling point VOC species of C2~C6 (VOCs of 2~6 carbon atoms) and the high boiling point VOC species of C4~C12, respectively. The sampling time resolution of the observation system was once per hour. To ensure the validity and reliability of the data, mixed standard gases, which are recognized by the US Environmental Protection Agency (EPA), were used for equipment calibration every three weeks. This system has been described in detail elsewhere [34,35].
The O3, NOx, SO2 and CO were measured using trace gas instruments (including a 49i O3 analyzer, 42i nitrogen oxide analyzer, 43i SO2 analyzer and 48i CO analyzer from Thermo Environmental Instruments, Inc., Franklin, MA USA). The sampling time resolution of the instruments was 5 min. The parameters and calibration methods of the instrument have been described by Shao et al. [4] and An et al. [34,35].
The FH62C14-type β-ray online atmospheric particulate concentration observer that was manufactured by the American Thermoelectric Corporation was used for the PM2.5 measurements, with a sampling time resolution of 30 min. To ensure the validity and reliability of the observed data, the instruments were regularly calibrated and maintained during the observation period. Outliers and the time period of the instrument calibrations were eliminated. Then, any data below the detection limit of the instruments were replaced by half of the detection limit.
In order to ensure the reliability of the gaseous pollutant data, the data of precipitation days were excluded in this paper and, in addition, the data from instrument failures and instrument calibration periods were also removed. The number of data samples for TVOC, NOx (NO2 and NO), O3, SO2, CO and PM2.5 were 5780, 7538, 7666, 7650, 7280 and 6733, respectively. The statistical analysis was completed using SPSS and Excel.
The four meteorological variables of wind direction, wind speed, temperature and relative humidity were selected and the meteorological data were obtained from the CAWSD600 automatic weather station with a time resolution of once per hour. The instrument was placed at the meteorological detection experiment base of the China Meteorological Administration on the campus of the Nanjing University of Information Science and Technology. Table 1 shows the average values of three meteorological variables (wind speed, temperature and relative humidity) and Table S1 in the Supplementary Materials shows the seasonal variations in the above factors.

2.2. The PMF Model

The US EPA PMF 5.0 has been widely used for the detection of the sources of particulate matter and VOCs. The principles and procedures have been described by Paatero and Tapper [36] and Paatero [37]. The PMF model decomposes the receptor matrix ( x i j ) into a source component spectral matrix (g), a contribution rate matrix (f) and a residual matrix (e). The g and f matrices are obtained by minimizing the objective function Q. The principles are expressed in Equations (1) and (2):
x i j = k = 1 P g i k f k j + e i j
In Equation (1), x i j represents the data matrix of the jth species at the ith sampling point, g i k represents the contribution of the kth source in the ith sample, f k j is the source profile of the jth species from the kth source, e i j is the residual matrix and P is the total number of sources.
Q = i = 1 n l = 1 m x i j k = 1 P g i k f k j u i j 2
In Equation (2), Q is the object function (which is solved using an iterative minimization algorithm and must be as small as possible) and u i j represents the uncertainty of the jth species at the ith sampling point. By following the PMF model, the uncertainty u i j of the different species was determined using Equations (3) and (4):
u i j = 5 6 × M D L c o n c M D L
u i j = E F × c o n c 2 + M D L 2 c o n c > M D L
where E F represents the error fraction and M D L represents the method detection limit. The error fraction in our study was 20%.
During the uncertainty analysis of the PMF model, there were 20 base runs to verify the stability of the PMF model and the lowest Q value was selected as the base run result. The rotation ambiguity was used to judge the uncertainty and stability of the base runs by varying the Fpeak values from −0.5 to 0.5. Any results with dQ values that were lower than 5% could be accepted.

2.3. The CPF Method

The conditional probability function (CPF) was used to identify the directions of the VOC sources by combining the PMF results and the wind direction data, which was determined as follows:
CPF = m θ n θ
where m θ represents the number of samples in the definite wind sector θ (whose concentration is higher than the “threshold concentration”) and n θ represents the total number of samples in the same wind direction. In this study, θ was set to 22.5° and the “threshold concentration” was the 75th percentile of all of the samples.

2.4. OFP, LOH and SOAP

The ozone formation potential (OFP) was used to evaluate the impact of the VOC species on ozone formation, which was calculated by multiplying a certain VOC species by its corresponding maximum incremental reactivity (MIR) coefficient. The OFP was calculated using the following equation:
O F P i = V O C i × M I R i
where O F P i represents the ozone formation potential of V O C i , V O C i represents the concentration of the VOC species i (unit: ppbv) and M I R i represents the corresponding maximum incremental reactive coefficient of V O C i . The value of MIR was proposed by Carter [38].
The OH radical loss rate (LOH) was used to estimate the reaction activity of the VOC species, which was calculated using the following equation:
L i O H = V O C i × K i O H
where L i O H represents the OH radical loss rate of V O C i , V O C i represents the concentration of the VOC species i (unit: molecule cm−3), K i O H represents the reaction rate coefficient of the VOC species i with OH radicals (unit: cm−3 molecule−1 s−1) and the values of K i O H were proposed by Carter [38].
The secondary organic aerosols potential (SOAP) was used to evaluate the capacity of the VOC species for secondary organic aerosols (SOAs), which was calculated using the following equation:
S O A P i = V O C i × S O A P i
where S O A P i represents the secondary organic aerosols potential of the VOC species i , V O C i represents the concentration of the VOC species i (unit: μg·m−3), S O A P i represents the SOAP of the VOC species i based on the basic mass relative to toluene. The SOAP coefficient was proposed by Derwent et al. [39].

3. Result and Discussion

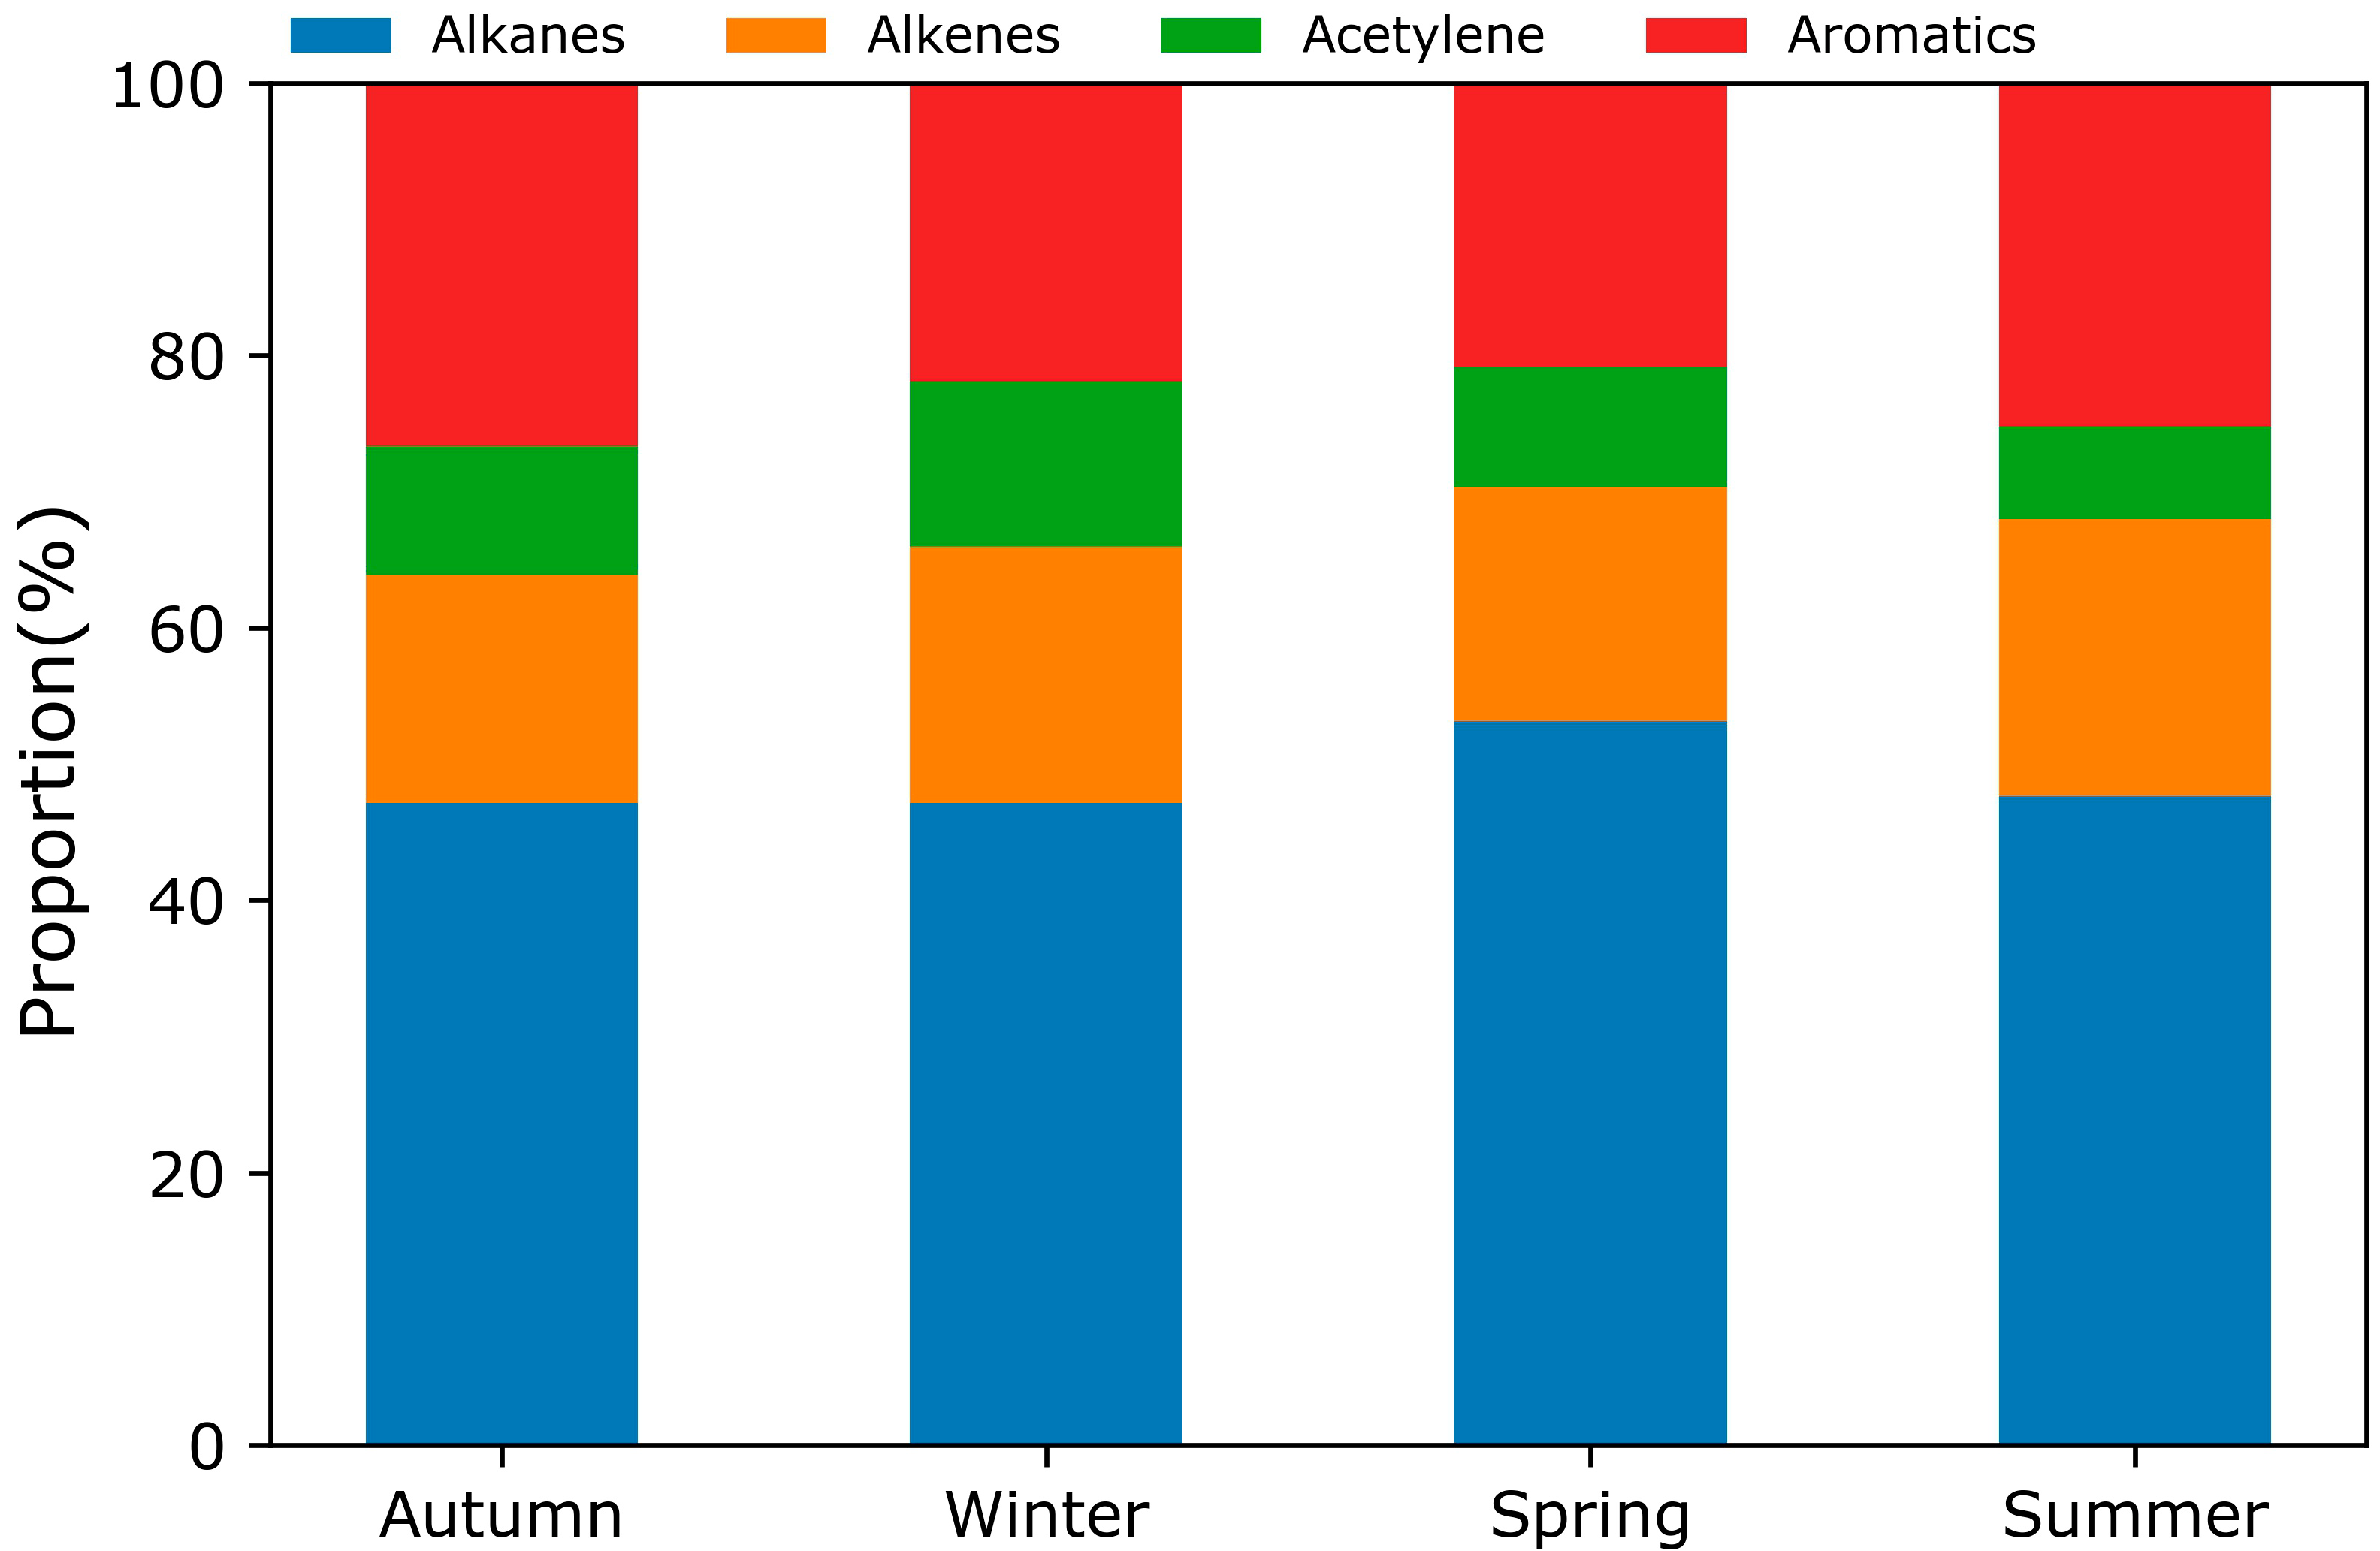
3.1. Characteristics of Gaseous Pollutants

As is shown in Table 2, the average TVOC concentration during the observation period was 38.6 ± 21.36 ppbv and the 10 most abundant VOC species were ethane (5.03 ± 2.56 ppbv), ethylene (4.29 ± 3.76 ppbv), acetylene (3.76 ± 2.37 ppbv), propane (3.65 ± 1.92 ppbv), benzene (2.80 ± 4.46 ppbv), toluene (2.44 ± 2.75 ppbv), n-butane (1.99 ± 1.46 ppbv), propylene (1.86 ± 2.65 ppbv), ethylbenzene (1.61 ± 1.36 ppbv) and i-butane (1.36 ± 0.87 ppbv), with these species accounting for 74.5% of the TVOC. It was found that the main VOC species in the northern suburbs of Nanjing were low-carbon number alkanes, alkenes and alkynes, which indicated that the northern suburbs of Nanjing were more influenced by combustion and vehicle exhausts [40,41,42]. The benzene, toluene and ethylbenzene concentrations were also not low, which indicated that industrial solvent sources [43,44] were not negligible. As shown in Table S2 in the Supplementary Materials, the average concentration of the TVOC was 38.6 ± 21.4 ppbv, which was higher than that in Wuhan (34.7 ppbv) but lower than that in Beijing (44.0 ± 28.9 ppbv), Shanghai (42.7 ppbv) and Guangzhou (42.7 ppbv). Alkanes were the most abundant category of VOC in the abovementioned cities and aromatics were the second most abundant in Nanjing (24.2%), Shanghai (29.7%) and Guangzhou (25.8%). The abovementioned observation sites, which were located in both suburban and urban areas, were also influenced by other emission sources, such as traffic and commercial and residential properties, which led to differences in the percentages of different hydrocarbons and reflected the impacts of complex environments on VOC emissions.
The concentration of the TVOC was characterized by being higher in the autumn (40.6 ± 23.8 ppbv) and winter (41.1 ± 21.7 ppbv) and lower in the spring (40.0 ± 13.8 ppbv) and summer (35.5 ± 19.4 ppbv). There were also seasonal differences in the proportions of different hydrocarbons in the TVOC (e.g., Figure 2). For alkanes, the proportions in the different seasons were 19.5% in the autumn, 18.7% in the winter, 18.2% in the spring and 16.7% in the summer. For alkenes, the proportions were 7.44% in the winter, 7.14% in the summer, 6.95% in the autumn and 5.88% in the spring. For acetylene, as the proportions were 4.83% in the winter, 3.91% in the autumn, 3.03% in the spring and 2.37% in the summer. For aromatics, the proportions were 11.0% in the autumn, 8.82% in the summer, 8.67% in the winter and 7.16% in the spring. The changes in the TVOC concentration and the percentages of different hydrocarbons reflected the effects of seasonal changes on the VOC emission sources.
Figure 3 shows the daily variations in NO, NO2, SO2, PM2.5, O3, CO and the total volatile organic compound (TVOC). These pollutants had obvious seasonal characteristics and the concentrations of all of the above pollutants were higher in the autumn due to the increased combustion emissions [45], except for the O3 concentration, which was higher in the spring due to the low precipitation rates and higher temperatures [46,47].
The daily variations in NO, NO2, SO2, PM2.5, CO and the TVOC were more consistent, indicating that the primary pollutants had more consistent sources. According to the China II Emission Standard [48] (24-h average mixing ratio > 40 ppbv), the number of days with an NO2 concentration that exceeded the standard was 12 days, accounting for 3.93% of the total number of days (305 days).
As a secondary pollutant, the daily variations in PM2.5 were also more consistent with the above pollutants. According to the China II Emission Standard (24-hour average mixing ratio > 75 μg·m−3), the number of samples with PM2.5 concentrations that were over 75 μg·m−3 was 79 days, accounting for 28.9% of the total number of days (273 days). However, O3, which is also a secondary pollutant, had peaks or troughs that significantly lagged behind the other pollutants (NO, NO2, SO2, PM2.5, CO and the TVOC) or were in an anti-phase with the trends of the other pollutants. Based on the China II Emission Standard (maximum hourly average mixing ratio > 100 ppbv), the number of samples over 100 ppbv was 8 days, accounting for 2.53% of the total number of days (315 days). According to the Pearson correlation coefficients of the TVOC, the other pollutants (NO, NO2, SO2, O3, CO and PM2.5) and the meteorological variables (Supplementary Materials, Table S3), there were significant positive correlations (p < 0.05) between the TVOC and the other pollutants. However, the meteorological variables and most of the pollutants were negative correlated (p < 0.05), which reflected the effects of high temperatures and high humidity on the removal of pollutants [49,50].

3.2. Source Detection Results

3.2.1. PMF and CPF Results

In total, 56 VOC species were measured in this study, according to the following principles: (1) species with very low concentrations were excluded; (2) species reflecting VOC sources were reserved; (3) species with high reactivity rates were excluded, except for sources markers; (4) species with signal-to-noise ratios (S/N) of <1.5 were excluded [51,52]. Finally, 27 (26 in the spring) VOC species were selected to input into the PMF model and the selected species accounted for more than 90% of both the concentration and OFP of the TVOC, so that the selected species reflected the characteristics of the TVOC.
Seven sources of VOCs existed in each season (autumn, winter, spring and summer). In the autumn (Figure 4), Factor 1 was dominated by high proportions of 2,3-dimethylbutane, cyclohexane and benzene. Based on the source analysis results in Wuhan [53] and Nanjing [54], it could be assumed that this factor was mainly derived from industrial refinery coke (Industrial Production 1). Factor 2 had a high percentage of toluene. In addition to solvent use, toluene may also come from industrial production [55,56,57]. According to the ratio of toluene to benzene (T/B), when the T/B < 2 [58,59], Factor 2 was not from a vehicle emission source. Due to the proximity of the observation site to an industrial area, Factor 2 could be determined as an industrial production source that was related to the iron and steel industries (Industrial Production 2). Factor 3, with a high proportion of alkanes from C4 to C5 (e.g., n-pentane and i-pentane), was from a source that was related to vehicle emissions since n-pentane and i-pentane are markers for gasoline evaporation [60,61]. At the same time, because of the low contributions of combustion-related species (acetylene and benzene), it was further determined that this factor could be from a gasoline evaporation source. Factor 4 was characterized by high proportions of ethane, ethylene and acetylene, which was presumed to be from a source of LPG (liquefied petroleum gas) usage since ethylene is mainly released from LPG [62,63,64]. Factor 5 was characterized by a high percentage of aromatic hydrocarbons, such as benzene, toluene, ethylbenzene and trimethylbenzene. Toluene, ethylbenzene, o-xylene and trimethylbenzene are generated from the use of solvents in paints, coatings, adhesives, cleaners and synthetic fragrances [61,65,66]. Combined with the environment around the observation site, Factor 5 could be determined as being from a solvent source that was related to paints and coatings. Factor 6, with a high percentage of isoprene, was determined to be from a biogenic emission source because it is a biogenic marker and the percentages of the other species were low [67]. Factor 7, which was mainly dominated by high proportions of ethylene and propylene, also had a certain proportion of C2 to C4 alkanes and aromatic species. Since both ethylene and propylene are mainly produced by the petrochemical industry [68,69], the source is determined to be a petrochemical industry source.
In the winter (Figure 5), Factor 1 was similar to that in the autumn, so it was also determined being from an industrial refinery coke source (Industrial Production 1). Factor 2 was dominated by a high proportion of styrene and some alkenes were also present. Since both styrene and alkenes are mainly derived from the petrochemical industry [70], the source was determined to be a petrochemical industrial source. Factor 3, similar to Factor 5 in the autumn, was dominated by a high percentage of aromatic hydrocarbons. Therefore, this factor was determined to be from the solvent usage for paints, coatings and adhesives. Factor 4, similar to Factor 1, had high percentages of acetylene and benzene and had some amount of ethane, which was related to combustion and judged to be from an industrial source that was related to coal combustion, based on the T/B of < 2. Factor 5, based on the high proportions of alkanes, alkenes and acetylene (especially ethane, propane and propylene, which are the species that are mainly used to prepare LPG), was judged as being from a source of LPG usage. Factor 6, which was dominated by a high proportion of toluene, also had some proportions of C5 to C7 alkanes, so the source was judged to be an industrial source that was related to steel making (Industrial Production 2). Factor 7 was found to have high proportions of 2-methylpentane, 3-methylpentane and n-hexane. While 2-methylpentane and 3-methylpentane are both markers for gasoline vehicle emissions [71,72], n-hexane is generally present as a gasoline additive [73]. Therefore, Factor 7 was determined as being from a vehicle emission source.
In the spring (Figure 6), Factor 1 had high proportions of n-pentane, i-pentane and C4 to C5 alkene hydrocarbons and markers that were related to combustion (acetylene and toluene) accounted for a relatively small proportion, so the source was determined to be gasoline evaporation. Factor 2, similar to the that in the autumn and winter, had high percentages of acetylene and benzene and also had some alkenes and aromatic hydrocarbons, so it was presumed to be from vehicle emissions and petrochemical industrial sources. Factor 3 had a high percentage of n-octane, a smaller proportion of methylcyclohexane (which is a marker for diesel vehicles evaporation [2]) and some presence of aromatic hydrocarbons and was judged to be from vehicle emissions and solvent sources. Factor 4 had high percentages of alkanes, alkenes and acetylene (especially ethane, propane and propylene, which are the species that are mainly used to prepare LPG [53,64]), so this factor was judged to be from a source of LPG usage. Factor 5 had a high percentage of toluene, so was judged to be related to the iron and steel industries and was determined as being from a iron and steel industry source (Industrial Production 1). Factor 6, similar to the above, had high percentages of cyclohexane, 2,3-dimethylbutane and benzene and was judged to be from industrial coking (Industrial Production 2). Factor 7 contained a high percentage of aromatic hydrocarbons, so was determined as being from a solvent source that was related to coatings and paints (Solvent Source 2).
In the summer (Figure 7), Factor 1 had relatively high proportions of ethylene, propylene and benzene and there was also a certain amount of ethane and propane, although the marker for the combustion source accounted for a relatively low proportion. Since olefins and benzene are mostly used in petrochemical industry, the source was judged to be a petrochemical industry source. Factor 2 had a high percentage of aromatic hydrocarbons, similar to the above, so it was judged to originate from solvent usage in paints, coatings and adhesives. Factor 3 had a high percentage of isoprene and low percentages of the other species, so was determined to be from a biogenic emission source. Factor 4, based on the high proportions of alkanes, alkenes and acetylene (especially ethane, propane and propylene, which are the species that are mainly used to prepare LPG), was judged as being from a source of LPG usage. Factor 5 and Factor 6, similar to the above, were determined as being related to an iron and steel industry source (Industrial Production 1) and an industrial refining coking source (Industrial Production 2), respectively. Factor 7 had a high proportion of C4~C5 alkene hydrocarbons and a small proportion of combustion-related markers (acetylene and toluene), so the source was presumed to be gasoline evaporation.
The CPF method was used to understand the directions of the emission sources. According to the CPF method (see the Supplementary Materials, e.g., Figures S1–S4), it was found that the contribution of each source was basically the most dominant from the eastward direction for all of the seasons, which was related to the complex environments to the east (industrial areas, residential areas, major traffic routes, etc.). The directions of the industrial sources were dominated by the east to northeast direction, which corresponded to the industrial park (containing chemical, steel and petrochemical industries) in the northeast. Some differences between the biological emission sources in the autumn and summer were evident and they were dominated by an eastward direction in the autumn and a westward direction in the summer.

3.2.2. Proportions of OFP, LOH and SOAP Concentrations

Figure 8, Figure 9, Figure 10 and Figure 11 describe the contributions of the different sources to the concentrations of OFP, LOH and SOAP in the different seasons. In the autumn, the contribution of petrochemical industrial sources (23.9%) to those concentrations was the largest, while the contribution of other sources was close behind (12.6~18.6%), except for the lower contribution of Industrial Production 1 (coking) and biological sources. In the winter, the contributions of Industrial Production 2 (coal combustion) (21.3%) and LPG (33.3%) were significantly higher than those of the other sources. In the spring, except for Industrial Production 2 (coking), the contributions of the various industrial sources and vehicle emissions (including fuel evaporation and exhausts) contributed more. In the summer, the concentration contributions were dominated by petrochemical industrial sources (23.3%), solvent sources (14.9%), LPG usage (18.2%), Industrial Production 1 (17.2%) and vehicle emissions (17.2%).
The contribution of each source to the OFP and LOH concentrations was similar. LPG, the petrochemical industry, the iron and steel industries and vehicle emissions were major contributing sources of LOH, except in the summer when the LOH concentration was more influenced by biogenic emissions. Except for the winter season, when the contribution of Industrial Production 1 (coal combustion) increased due to the increased use of coal, the SOAP was mainly produced by solvent sources (26.0–29.9%) and industrial sources (the iron and steel industries) (28.4–39.6%) during the other seasons.
It was found that LPG sources, vehicle sources and industrial sources (including the steel industry, coking industry and petrochemical industry) were the main contributors to the OFP and LOH concentrations, accounting for more than 50% in each season. However, for the SOAP, solvent sources and industrial sources (the iron and steel industries) were the main contributors and accounted for more than 40% of the total concentration.

3.2.3. Estimation of VOCs in the OFP and SOAP

To further investigate the VOC contributions to the OFP and SOAP, the time series of O3, OFP, PM2.5 and SOAP are described in Figure 12. As is shown in Figure 12, the concentration of O3 did not correspond to the peak or trough values of the OFP that were obtained from VOC calculations using the majority of the time series, which often had an anti-phase correlation or showed the values of O3 and OFP lagging behind each other. In contrast, there was a better correlation between the PM2.5 and SOAP values that were obtained from the VOC calculations. This proved that the locally emitted VOCs played a completely different role in the generation of O3 and PM2.5. This was because the generation and elimination of O3 was related to several factors, such as solar radiation [74,75], NOx concentration and VOC concentration [76,77], and was also influenced by non-local sources [78,79].
The wind rose figure for the combined pollutant concentrations is widely used to determine the directions and characteristics of the pollutants [80,81]. Figures S5–S9 in the Supplementary Materials show the wind rose figures of the TVOC, O3, OFP, PM2.5 and SOAP, which were used to investigate the VOC contributions in the OFP and SOAP from different directions. As is shown in Figure S5, an area with a high TVOC concentration was located in an area with wind speeds of less than 2 m·s−1 in the easterly direction, indicating that the TVOC was still mainly influenced by short-distance transport and further proving that industrial areas, living areas and major traffic routes in the easterly direction were the main sources of VOCs.
The areas with high O3 concentrations were mainly concentrated in the southwest direction, except in the spring when they were located in the eastward direction, and the wind speed range of the area was 3~4 m·s−1 (Supplementary Materials, Figure S6). According to Figure S7, the distributions of areas with high OFP values and areas with high O3 concentrations were widely different, indicating that O3 was influenced by non-local transport.
In Figure S8, an area with a high PM2.5 concentration was located in the southeast direction, while in the winter, there were also areas located in the northwestern and southeastern directions. The wind speeds corresponding to the above areas with high PM2.5 concentrations were all higher (frequently greater than 4 m·s−1). The distributions of areas with high SOAP values (Figure S9) and areas with high PM2.5 concentrations were similar in all seasons except for winter (the area with a high PM2.5 concentration was in the northwest direction), when the difference between the distributions was larger. This indicated that, except for the contribution of long-range transport in the autumn and winter, the secondary particles in PM2.5 were still mainly influenced by local emissions.

4. Conclusions

In this study, 56 VOC species were observed in the northern suburbs of Nanjing and the concentrations of each species were measured during the observation period. Additionally, the seasonal differences between the proportions of different hydrocarbons in the TVOC were explored: the proportions of alkanes and acetylene were higher in the autumn (19.5%; 3.91%) and winter (18.7%; 4.83%) and lower in the spring (18.2%; 3.03%) and summer (16.7%; 2.37%); the proportion of alkenes was lower in the spring (5.88%) and close to that in other seasons; and the proportion of aromatic hydrocarbons was significantly higher in the autumn (11.0%) than in the other seasons. Then, time series for the TVOC and other pollutants (NO, NO2, SO2, PM2.5, O3 and CO) were collected and it was found that the time series for the TVOC and the other pollutants (except O3) had similar trends, indicating that the TVOC and the other pollutants had relatively similar sources.
The identification of the sources of the VOCs was carried out using the PMF model. The source analysis results showed that there are seven sources of VOCs in all four seasons, with six major sources: LPG (23.2~36.2%), gasoline vehicle emissions (14.1~22.3%), iron and steel industry sources (8.6~14.6%), industrial refining coke sources (4.3~12.6%), solvent sources (6.6~13.6%) and petrochemical industry sources (6.2~16.9%). The seventh source had some seasonal differences: in the autumn and summer, the seventh source tended to be a biogenic source due to the higher temperatures, which led to enhanced biogenic emissions; in the winter, the seventh source was coal combustion because of the increased use of coal; and in the spring, the seventh source was diesel vehicle emissions. According to the CPF method, it was also found that although there were some seasonal differences between the source directions, the direction of each source was still mainly eastward because of the complex environments, such as residential areas, industrial areas and major traffic roads, that were the main sources of VOCs were in this direction.
The contributions of different sources to the concentrations of OFP, LOH and SOAP and their seasonal differences were also compared. It was found that LPG sources, vehicle sources and industrial sources (including the steel industry, coking industry and petrochemical industry) were the main contributors to the concentrations of OFP and LOH, accounting for more than 50% of the total concentrations in all seasons. However, for SOAP, solvent sources and industrial sources (the iron and steel industries) were the main contributors and accounted for more than 40% of the total concentrations.
The OFP and SOAP values that were obtained from the VOC calculations were compared to the O3 and PM2.5 time series and it was found that the O3 concentration did not correspond to the peaks or troughs of the OFP series, while the PM2.5 concentration corresponded well to the peaks and troughs of the SOAP time series. This showed that the variations in O3 concentration were not only related to VOC concentrations, but also to solar radiation, NOx concentration and non-local transport. When combined with the wind rose figure, it was found that the O3 generation was more influenced by non-local transport, while the PM2.5 generation was mainly influenced by local emissions.
Therefore, the seasonal variations in VOC emissions should be considered when developing statement measures as VOCs are both adverse to human health and important precursors to O3 and PM2.5.

Supplementary Materials

The following supporting information can be downloaded at: https://www.mdpi.com/article/10.3390/atmos13071136/s1, Figure S1: CPF plots of the PMF source profiles in Autumn; Figure S2: CPF plots of the PMF source profiles in Winter; Figure S3: CPF plots of the PMF source profiles in Spring; Figure S4: CPF plots of the PMF source profiles in Summer; Figure S5: Windrose of the TVOC in different seasons; Figure S6: Windrose of the O3 in different seasons; Figure S7: Windrose of the OFP in different seasons; Figure S8: Windrose of the PM2.5 in different seasons; Figure S9: Windrose of the SOAP in different seasons; Table S1: Mean values of different meteorological variables in different seasons; Table S2: Comparisons of TVOC measured in Nanjing and other cities in China (unit: ppbv); Table S3: Correlation between pollutants and meteorological variables. References [82,83] are cited in the Supplementary Materials.

Author Contributions

Investigation, Y.Z.; data curation, J.W.; software, H.L.; writing—original draft preparation, Y.F.; writing—review and editing, J.A.; supervision, G.T. All authors have read and agreed to the published version of the manuscript.

Funding

This work was supported by grants from the National Natural Science Foundation of China (grant no.: 42075177), the National Key Research and Development Program of China (grant no.: 2017YFC0210003) and the Qing Lan Project.

Acknowledgments

We would like to give thanks to all the editors and reviewers for reviewing this paper, and thanks to the two scientific editors, David Cappelletti and László Bencs. And sincere gratitude should also give to the laboratory for the experimental conditions.

Conflicts of Interest

The authors declare no conflict of interest.

References

  1. de Abrantes, R.; De Assuncao, J.; Pesquero, C.R. Emission of polycyclic aromatic hydrocarbons from light-duty diesel vehicles exhaust. Atmos. Environ. 2004, 38, 1631–1640. [Google Scholar] [CrossRef]
  2. Liu, Y.; Shao, M.; Fu, L.; Lu, S.; Zeng, L.; Tang, D. Source profiles of volatile organic compounds (VOCs) measured in China: Part I. Atmos. Environ. 2008, 42, 6247–6260. [Google Scholar] [CrossRef]
  3. Guo, H.; Cheng, H.R.; Ling, Z.H.; Louie, P.K.K.; Ayoko, G. Which emission sources are responsible for the volatile organic compounds in the atmosphere of Pearl River Delta? J. Hazard. Mater. 2011, 188, 116–124. [Google Scholar] [CrossRef] [PubMed]
  4. Shao, P.; An, J.; Xin, J.; Wu, F.; Wang, J.; Ji, D.; Wang, Y.S. Source apportionment of VOCs and the contribution to photochemical ozone formation during summer in the typical industrial area in the Yangtze River Delta, China. Atmos. Res. 2016, 176–177, 64–74. [Google Scholar] [CrossRef]
  5. Bolden, A.L.; Kwiatkowski, C.F.; Colborn, T. New Look at BTEX: Are Ambient Levels a Problem? Environ. Sci. Technol. 2015, 49, 5261–5276. [Google Scholar] [CrossRef]
  6. Davidson, C.J.; Hannigan, J.H.; Bowen, S.E. Effects of inhaled combined Benzene, Toluene, Ethylbenzene, and Xylenes (BTEX): Toward an environmental exposure model. Environ. Toxicol. Pharmacol. 2021, 81, 103518. [Google Scholar] [CrossRef]
  7. Buczynska, A.J.; Krata, A.; Stranger, M.; Godoi, A.F.L.; Kontozova-Deutsch, V.; Bencs, L.; Naveau, I.; Roekens, E.; Van Grieken, R. Atmospheric BTEX-concentrations in an area with intensive street traffic. Atmos. Environ. 2009, 43, 311–318. [Google Scholar] [CrossRef]
  8. Duan, J.; Tan, J.; Yang, L.; Wu, S.; Hao, J. Concentration, sources and ozone formation potential of volatile organic compounds (VOCs) during ozone episode in Beijing. Atmos. Res. 2008, 88, 25–35. [Google Scholar] [CrossRef]
  9. Wang, M.; Qin, W.; Chen, W.; Zhang, L.; Zhang, Y.; Zhang, X.; Xie, X. Seasonal variability of VOCs in Nanjing, Yangtze River delta: Implications for emission sources and photochemistry. Atmos. Environ. 2020, 223, 117254. [Google Scholar] [CrossRef]
  10. Hoque, R.R.; Khillare, P.; Agarwal, T.; Shridhar, V.; Balachandran, S. Spatial and temporal variation of BTEX in the urban atmosphere of Delhi, India. Sci. Total Environ. 2008, 392, 30–40. [Google Scholar] [CrossRef]
  11. Shu, L.; Wang, T.; Han, H.; Xie, M.; Chen, P.; Li, M.; Wu, H. Summertime ozone pollution in the Yangtze River Delta of eastern China during 2013–2017: Synoptic impacts and source apportionment. Environ. Pollut. 2020, 257, 113631. [Google Scholar] [CrossRef] [PubMed]
  12. Yang, L.; Luo, H.; Yuan, Z.; Zheng, J.; Huang, Z.; Li, C.; Lin, X.; Louie, P.K.K.; Chen, D.; Bian, Y. Quantitative impacts of meteorology and precursor emission changes on the long-term trend of ambient ozone over the Pearl River Delta, China, and implications for ozone control strategy. Atmos. Chem. Phys. 2019, 19, 12901–12916. [Google Scholar] [CrossRef] [Green Version]
  13. Lu, X.; Zhang, L.; Wang, X.; Gao, M.; Li, K.; Zhang, Y.; Yue, X.; Zhang, Y. Rapid Increases in Warm-Season Surface Ozone and Resulting Health Impact in China Since 2013. Environ. Sci. Technol. Lett. 2020, 7, 240–247. [Google Scholar] [CrossRef]
  14. Yin, Z.; Cao, B.; Wang, H. Dominant patterns of summer ozone pollution in eastern China and associated atmospheric circulations. Atmos. Chem. Phys. 2019, 19, 13933–13943. [Google Scholar] [CrossRef] [Green Version]
  15. Karlsson, P.E.; Klingberg, J.; Engardt, M.; Andersson, C.; Langner, J.; Karlsson, G.P.; Pleijel, H. Past, present and future concentrations of ground-level ozone and potential impacts on ecosystems and human health in northern Europe. Sci. Total Environ. 2017, 576, 22–35. [Google Scholar] [CrossRef]
  16. Ashworth, K.; Wild, O.; Eller, A.S.D.; Hewitt, C.N. Impact of Biofuel Poplar Cultivation on Ground-Level Ozone and Premature Human Mortality Depends on Cultivar Selection and Planting Location. Environ. Sci. Technol. 2015, 49, 8566–8575. [Google Scholar] [CrossRef] [Green Version]
  17. Safieddine, S.; Bouillon, M.; Paracho, A.; Jumelet, J.; Tencé, F.; Pazmino, A.; Goutail, F.; Wespes, C.; Bekki, S.; Boynard, A.; et al. Antarctic Ozone Enhancement During the 2019 Sudden Stratospheric Warming Event. Geophys. Res. Lett. 2020, 47, e2020GL087810. [Google Scholar] [CrossRef]
  18. Li, J.; Wu, R.; Li, Y.; Hao, Y.; Xie, S.; Zeng, L. Effects of rigorous emission controls on reducing ambient volatile organic compounds in Beijing, China. Sci. Total Environ. 2016, 557–558, 531–541. [Google Scholar] [CrossRef]
  19. Shao, P.; An, J.-L.; Yang, H.; Lin, X.; Ji, D.-S. Variation characteristics of surface ozone and its precursors during summertime in Nanjing northern suburb. Environ. Sci. 2014, 35, 4031–4043. [Google Scholar]
  20. Fan, M.-Y.; Zhang, Y.-L.; Lin, Y.-C.; Li, L.; Xie, F.; Hu, J.; Mozaffar, A.; Cao, F. Source apportionments of atmospheric volatile organic compounds in Nanjing, China during high ozone pollution season. Chemosphere 2021, 263, 128025. [Google Scholar] [CrossRef]
  21. Cao, M.Y.; Lin, Y.Q.; Zhang, Y.L. Characteristics, source apportionment of atmospheric VOCs in the Nanjing industrial area in autumn. Environ. Sci. 2020, 41, 2565–2576. [Google Scholar] [CrossRef]
  22. Chen, C.; Wang, L.; Qin, Y.; Zhang, Y.; Zheng, S.; Yang, Y.; Jin, S.; Yang, X. VOC Characteristics and Their Source Apportionment in the Yangtze River Delta Region during the G20 Summit. Atmosphere 2021, 12, 928. [Google Scholar] [CrossRef]
  23. Watson, J.G.; Chow, J.C.; Fujita, E.M. Review of volatile organic compound source apportionment by chemical mass balance. Atmos. Environ. 2001, 35, 1567–1584. [Google Scholar] [CrossRef]
  24. Sosa, E.R.; Bravo, A.H.; Mugica, A.V.; Sanchez, A.P.; Bueno, L.E.; Krupa, S. Levels and source apportionment of volatile organic compounds in southwestern area of Mexico City. Environ. Pollut. 2009, 157, 1038–1044. [Google Scholar] [CrossRef]
  25. Zheng, H.; Kong, S.; Xing, X.; Mao, Y.; Hu, T.; Ding, Y.; Li, G.; Liu, D.; Li, S.; Qi, S. Monitoring of volatile organic compounds (VOCs) from an oil and gas station in northwest China for 1 year. Atmos. Chem. Phys. 2018, 18, 4567–4595. [Google Scholar] [CrossRef] [Green Version]
  26. Bari, A.; Kindzierski, W.B. Ambient volatile organic compounds (VOCs) in communities of the Athabasca oil sands region: Sources and screening health risk assessment. Environ. Pollut. 2018, 235, 602–614. [Google Scholar] [CrossRef] [PubMed] [Green Version]
  27. Bruno, P.; Caselli, M.; De Gennaro, G.; Traini, A. Source apportionment of gaseous atmospheric pollutants by means of an absolute principal component scores (APCS) receptor model. Anal. Bioanal. Chem. 2001, 371, 1119–1123. [Google Scholar] [CrossRef]
  28. Guo, H.; So, K.; Simpson, I.; Barletta, B.; Meinardi, S.; Blake, D. C1–C8 volatile organic compounds in the atmosphere of Hong Kong: Overview of atmospheric processing and source apportionment. Atmos. Environ. 2007, 41, 1456–1472. [Google Scholar] [CrossRef] [Green Version]
  29. Olson, D.A.; Norris, G.A.; Seila, R.L.; Landis, M.S.; Vette, A.F. Chemical characterization of volatile organic compounds near the World Trade Center: Ambient concentrations and source apportionment. Atmos. Environ. 2007, 41, 5673–5683. [Google Scholar] [CrossRef]
  30. Song, Y.; Shao, M.; Liu, Y.; Lu, S.; Kuster, W.; Goldan, P.; Xie, S. Source Apportionment of Ambient Volatile Organic Compounds in Beijing. Environ. Sci. Technol. 2007, 41, 4348–4353. [Google Scholar] [CrossRef]
  31. He, Z.; Wang, X.; Ling, Z.; Zhao, J.; Guo, H.; Shao, M.; Wang, Z. Contributions of different anthropogenic volatile organic compound sources to ozone formation at a receptor site in the Pearl River Delta region and its policy implications. Atmos. Chem. Phys. 2019, 19, 8801–8816. [Google Scholar] [CrossRef] [Green Version]
  32. Bon, D.M.; Ulbrich, I.M.; de Gouw, J.A.; Warneke, C.; Kuster, W.C.; Alexander, M.L.; Baker, A.; Beyersdorf, A.J.; Blake, D.; Fall, R.; et al. Measurements of volatile organic compounds at a suburban ground site (T1) in Mexico City during the MILAGRO 2006 campaign: Measurement comparison, emission ratios, and source attribution. Atmos. Chem. Phys. 2011, 11, 2399–2421. [Google Scholar] [CrossRef] [Green Version]
  33. McCarthy, M.C.; Aklilu, Y.-A.; Brown, S.G.; Lyder, D.A. Source apportionment of volatile organic compounds measured in Edmonton, Alberta. Atmos. Environ. 2013, 81, 504–516. [Google Scholar] [CrossRef]
  34. An, J.; Zhu, B.; Wang, H.; Li, Y.; Lin, X.; Yang, H. Characteristics and source apportionment of VOCs measured in an industrial area of Nanjing, Yangtze River Delta, China. Atmos. Environ. 2014, 97, 206–214. [Google Scholar] [CrossRef]
  35. An, J.; Zou, J.; Wang, J.; Lin, X.; Zhu, B. Differences in ozone photochemical characteristics between the megacity Nanjing and its suburban surroundings, Yangtze River Delta, China. Environ. Sci. Pollut. Res. 2015, 22, 19607–19617. [Google Scholar] [CrossRef] [PubMed]
  36. Paatero, P.; Tapper, U. Positive matrix factorization: A non-negative factor model with optimal utilization of error estimates of data values. Environmetrics 1994, 5, 111–126. [Google Scholar] [CrossRef]
  37. Paatero, P. Least squares formulation of robust non-negative factor analysis. Chemom. Intell. Lab. Syst. 1997, 37, 23–35. [Google Scholar] [CrossRef]
  38. Carter, W.P. Development of the SAPRC-07 chemical mechanism. Atmos. Environ. 2010, 44, 5324–5335. [Google Scholar] [CrossRef]
  39. Derwent, R.G.; Jenkin, M.; Utembe, S.; Shallcross, D.E.; Murrells, T.P.; Passant, N.R. Secondary organic aerosol formation from a large number of reactive man-made organic compounds. Sci. Total Environ. 2010, 408, 3374–3381. [Google Scholar] [CrossRef]
  40. Baudic, A.; Gros, V.; Sauvage, S.; Locoge, N.; Sanchez, O.; Sarda-Estève, R.; Kalogridis, C.; Petit, J.-E.; Bonnaire, N.; Baisnée, D.; et al. Seasonal variability and source apportionment of volatile organic compounds (VOCs) in the Paris megacity (France). Atmos. Chem. Phys. 2016, 16, 11961–11989. [Google Scholar] [CrossRef] [Green Version]
  41. Gentner, D.R.; Worton, D.R.; Isaacman, G.; Davis, L.C.; Dallmann, T.R.; Wood, E.C.; Herndon, S.C.; Goldstein, A.H.; Harley, R.A. Chemical Composition of Gas-Phase Organic Carbon Emissions from Motor Vehicles and Implications for Ozone Production. Environ. Sci. Technol. 2013, 47, 11837–11848. [Google Scholar] [CrossRef] [PubMed]
  42. Cai, C.; Geng, F.; Tie, X.; Yu, Q.; An, J. Characteristics and source apportionment of VOCs measured in Shanghai, China. Atmos. Environ. 2010, 44, 5005–5014. [Google Scholar] [CrossRef]
  43. Buzcu, B.; Fraser, M.P. Source identification and apportionment of volatile organic compounds in Houston, TX. Atmos. Environ. 2006, 40, 2385–2400. [Google Scholar] [CrossRef]
  44. Ou, J.; Guo, H.; Zheng, J.; Cheung, K.; Louie, P.K.; Ling, Z.; Wang, D. Concentrations and sources of non-methane hydrocarbons (NMHCs) from 2005 to 2013 in Hong Kong: A multi-year real-time data analysis. Atmos. Environ. 2015, 103, 196–206. [Google Scholar] [CrossRef]
  45. Wang, T.; He, H.Q.; Xia, Z.H.; Zhang, Q.Q. Characteristics, source apportionment of atmospheric VOCs in the Nanjing industrial area in autumn. Chin. J. Environ. Eng. 2017, 11, 4155–4161. [Google Scholar]
  46. Olszyna, K.; Luria, M.; Meagher, J. The correlation of temperature and rural ozone levels in southeastern U.S.A. Atmos. Environ. 1997, 31, 3011–3022. [Google Scholar] [CrossRef]
  47. Coates, J.; Mar, K.A.; Ojha, N.; Butler, T.M. The influence of temperature on ozone production under varying NOx conditions—A modelling study. Atmos. Chem. Phys. 2016, 16, 11601–11615. [Google Scholar] [CrossRef] [Green Version]
  48. GB3095-2012; National Ambient Air Quality Standard of China. Ministry of Ecological Environment of the People’s Republic of China: Beijing, China, 2012.
  49. Huang, Y.-K.; Luvsan, M.-E.; Gombojav, E.; Ochir, C.; Bulgan, J.; Chan, C.-C. Land use patterns and SO2 and NO2 pollution in Ulaanbaatar, Mongolia. Environ. Res. 2013, 124, 1–6. [Google Scholar] [CrossRef]
  50. Marković, D.M.; Jovanović, A.; Lazić, L.; Mijić, Z. Determination of O3, NO2, SO2, CO and PM10 measured in Belgrade urban area. Environ. Monit. Assess. 2007, 145, 349–359. [Google Scholar] [CrossRef]
  51. Yao, S.; Wang, Q.; Zhang, J.; Zhang, R.; Gao, Y.; Zhang, H.; Li, J.; Zhou, Z. Ambient volatile organic compounds in a heavy industrial city: Concentration, ozone formation potential, sources, and health risk assessment. Atmos. Pollut. Res. 2021, 12, 101053. [Google Scholar] [CrossRef]
  52. Gu, Y.; Liu, B.; Li, Y.; Zhang, Y.; Bi, X.; Wu, J.; Song, C.; Dai, Q.; Han, Y.; Ren, G.; et al. Multi-scale volatile organic compound (VOC) source apportionment in Tianjin, China, using a receptor model coupled with 1-hr resolution data. Environ. Pollut. 2020, 265, 115023. [Google Scholar] [CrossRef] [PubMed]
  53. Hui, L.; Liu, X.; Tan, Q.; Feng, M.; An, J.; Qu, Y.; Zhang, Y.; Jiang, M. Characteristics, source apportionment and contribution of VOCs to ozone formation in Wuhan, Central China. Atmos. Environ. 2018, 192, 55–71. [Google Scholar] [CrossRef]
  54. Guo, H.; Wang, T.; Simpson, I.; Blake, D.; Yu, X.; Kwok, Y.; Li, Y. Source contributions to ambient VOCs and CO at a rural site in eastern China. Atmos. Environ. 2004, 38, 4551–4560. [Google Scholar] [CrossRef] [Green Version]
  55. Liu, Y.; Shao, M.; Lu, S.; Chang, C.-C.; Wang, J.-L.; Chen, G. Volatile Organic Compound (VOC) measurements in the Pearl River Delta (PRD) region, China. Atmos. Chem. Phys. 2008, 8, 1531–1545. [Google Scholar] [CrossRef] [Green Version]
  56. An, J.; Wang, J.; Zhang, Y.; Zhu, B. Source Apportionment of Volatile Organic Compounds in an Urban Environment at the Yangtze River Delta, China. Arch. Environ. Contam. Toxicol. 2017, 72, 335–348. [Google Scholar] [CrossRef]
  57. Niu, Z.; Zhang, H.; Xu, Y.; Liao, X.; Xu, L.; Chen, J. Pollution characteristics of volatile organic compounds in the atmosphere of Haicang District in Xiamen City, Southeast China. J. Environ. Monit. 2012, 14, 1145–1151. [Google Scholar] [CrossRef]
  58. Xia, L.; Cai, C.; Zhu, B.; An, J.; Li, Y.; Li, Y. Source apportionment of VOCs in a suburb of Nanjing, China, in autumn and winter. J. Atmos. Chem. 2014, 71, 175–193. [Google Scholar] [CrossRef]
  59. Huang, C.; Wang, H.L.; Li, L.; Wang, Q.; Lu, Q.; de Gouw, J.A.; Zhou, M.; Jing, S.A.; Lu, J.; Chen, C.H. VOC species and emission inventory from vehicles and their SOA formation potentials estimation in Shanghai, China. Atmos. Chem. Phys. 2015, 15, 11081–11096. [Google Scholar] [CrossRef] [Green Version]
  60. Wu, F.; Yu, Y.; Sun, J.; Zhang, J.; Wang, J.; Tang, G.; Wang, Y. Characteristics, source apportionment and reactivity of ambient volatile organic compounds at Dinghu Mountain in Guangdong Province, China. Sci. Total Environ. 2016, 548–549, 347–359. [Google Scholar] [CrossRef]
  61. Yang, H.; Zhu, B.; Gao, J.-H.; Li, Y.-Y.; Xia, L. Source apportionment of VOCs in the northern suburb of Nanjing in summer. Environ. Sci. 2013, 34, 4519–4528. [Google Scholar]
  62. Song, Y.; Dai, W.; Shao, M.; Liu, Y.; Lu, S.; Kuster, W.; Goldan, P. Comparison of receptor models for source apportionment of volatile organic compounds in Beijing, China. Environ. Pollut. 2008, 156, 174–183. [Google Scholar] [CrossRef] [PubMed]
  63. Lyu, X.; Chen, N.; Guo, H.; Zhang, W.; Wang, N.; Wang, Y.; Liu, M. Ambient volatile organic compounds and their effect on ozone production in Wuhan, central China. Sci. Total Environ. 2016, 541, 200–209. [Google Scholar] [CrossRef]
  64. Liu, C.; Ma, Z.; Mu, Y.; Liu, J.; Zhang, C.; Zhang, Y.; Liu, P.; Zhang, H. The levels, variation characteristics, and sources of atmospheric non-methane hydrocarbon compounds during wintertime in Beijing, China. Atmos. Chem. Phys. 2017, 17, 10633–10649. [Google Scholar] [CrossRef] [Green Version]
  65. Wang, H.; Qiao, Y.; Chen, C.; Lu, J.; Dai, H.; Qiao, L.; Lou, S.; Huang, C.; Li, L.; Jing, S.; et al. Source Profiles and Chemical Reactivity of Volatile Organic Compounds from Solvent Use in Shanghai, China. Aerosol Air Qual. Res. 2014, 14, 301–310. [Google Scholar] [CrossRef] [Green Version]
  66. Yuan, B.; Chen, W.; Shao, M.; Wang, M.; Lu, S.; Wang, B.; Liu, Y.; Chang, C.-C.; Wang, B. Measurements of ambient hydrocarbons and carbonyls in the Pearl River Delta (PRD), China. Atmos. Res. 2012, 116, 93–104. [Google Scholar] [CrossRef]
  67. Mo, Z.; Shao, M.; Lu, S.; Niu, H.; Zhou, M.; Sun, J. Characterization of non-methane hydrocarbons and their sources in an industrialized coastal city, Yangtze River Delta, China. Sci. Total. Environ. 2017, 593–594, 641–653. [Google Scholar] [CrossRef]
  68. Leuchner, M.; Rappenglück, B. VOC source–receptor relationships in Houston during TexAQS-II. Atmos. Environ. 2010, 44, 4056–4067. [Google Scholar] [CrossRef]
  69. Knighton, W.B.; Herndon, S.C.; Wood, E.C.; Fortner, E.C.; Onasch, T.B.; Wormhoudt, J.; Kolb, C.E.; Lee, B.H.; Zavala, M.; Molina, L.; et al. Detecting Fugitive Emissions of 1,3-Butadiene and Styrene from a Petrochemical Facility: An Application of a Mobile Laboratory and a Modified Proton Transfer Reaction Mass Spectrometer. Ind. Eng. Chem. Res. 2012, 51, 12706–12711. [Google Scholar] [CrossRef]
  70. Song, M.; Tan, Q.; Feng, M.; Qu, Y.; Liu, X.; An, J.; Zhang, Y. Source Apportionment and Secondary Transformation of Atmospheric Nonmethane Hydrocarbons in Chengdu, Southwest China. J. Geophys. Res. Atmos. 2018, 123, 9741–9763. [Google Scholar] [CrossRef]
  71. Chan, L.-Y.; Chu, K.-W.; Zou, S.-C.; Chan, C.-Y.; Wang, X.; Barletta, B.; Blake, D.R.; Guo, H.; Tsai, W.-Y. Characteristics of nonmethane hydrocarbons (NMHCs) in industrial, industrial-urban, and industrial-suburban atmospheres of the Pearl River Delta (PRD) region of south China. J. Geophys. Res. Earth Surf. 2006, 111, D11. [Google Scholar] [CrossRef] [Green Version]
  72. Tan, Q.; Liu, H.; Xie, S.; Zhou, L.; Song, T.; Shi, G.; Jiang, W.; Yang, F.; Wei, F. Temporal and spatial distribution characteristics and source origins of volatile organic compounds in a megacity of Sichuan Basin, China. Environ. Res. 2020, 185, 109478. [Google Scholar] [CrossRef] [PubMed]
  73. Ordóñez, C.; Garrido-Perez, J.M.; García-Herrera, R. Early spring near-surface ozone in Europe during the COVID-19 shutdown: Meteorological effects outweigh emission changes. Sci. Total Environ. 2020, 747, 141322. [Google Scholar] [CrossRef] [PubMed]
  74. Wang, X.; Shen, Z.; Cao, J.; Zhang, L.; Liu, L.; Li, J.; Liu, S.; Sun, Y. Characteristics of surface ozone at an urban site of Xi’an in Northwest China. J. Environ. Monit. 2012, 14, 116–126. [Google Scholar] [CrossRef] [PubMed]
  75. Cheng, H.; Saunders, S.; Guo, H.; Louie, P.; Jiang, F. Photochemical trajectory modeling of ozone concentrations in Hong Kong. Environ. Pollut. 2013, 180, 101–110. [Google Scholar] [CrossRef] [PubMed]
  76. Wang, H.; Xiang, Z.; Wang, L.; Jing, S.; Lou, S.; Tao, S.; Liu, J.; Yu, M.; Li, L.; Chen, Y.; et al. Emissions of volatile organic compounds (VOCs) from cooking and their speciation: A case study for Shanghai with implications for China. Sci. Total Environ. 2018, 621, 1300–1309. [Google Scholar] [CrossRef] [PubMed] [Green Version]
  77. Liu, Y.; Song, M.; Liu, X.; Zhang, Y.; Hui, L.; Kong, L.; Zhang, Y.; Zhang, C.; Qu, Y.; An, J.; et al. Characterization and sources of volatile organic compounds (VOCs) and their related changes during ozone pollution days in 2016 in Beijing, China. Environ. Pollut. 2020, 257, 113599. [Google Scholar] [CrossRef]
  78. Zheng, J.; Zhong, L.; Wang, T.; Louie, P.K.; Li, Z. Ground-level ozone in the Pearl River Delta region: Analysis of data from a recently established regional air quality monitoring network. Atmos. Environ. 2010, 44, 814–823. [Google Scholar] [CrossRef]
  79. Carslaw, D.C.; Beevers, S.D. Characterising and understanding emission sources using bivariate polar plots and k-means clustering. Environ. Model. Softw. 2013, 40, 325–329. [Google Scholar] [CrossRef]
  80. Wang, Q.; Zhao, Z.; Tian, J.; Zhu, C.; Ni, H.; Zhang, Y.; Zhang, N.; Shen, Z.; Han, Y.; Cao, J. Seasonal Transport and Dry Deposition of Black Carbon Aerosol in the Southeastern Tibetan Plateau. Aerosol Sci. Eng. 2017, 1, 160–168. [Google Scholar] [CrossRef]
  81. Duan, Z.; Yang, Y.; Wang, L.; Liu, C.; Fan, S.; Chen, C.; Tong, Y.; Lin, X.; Gao, Z. Temporal characteristics of carbon dioxide and ozone over a rural-cropland area in the Yangtze River Delta of eastern China. Sci. Total Environ. 2021, 757, 143750. [Google Scholar] [CrossRef]
  82. Liu, Y.; Wang, H.; Jing, S.; Gao, Y.; Peng, Y.; Lou, S.; Cheng, T.; Tao, S.; Li, L.; Li, Y.; et al. Characteristics and sources of volatile organic compounds (VOCs) in Shanghai during summer: Implications of regional transport. Atmos. Environ. 2019, 215, 116902. [Google Scholar] [CrossRef]
  83. Zou, Y.; Deng, X.; Zhu, D.; Gong, D.; Wang, H.; Li, F.; Tan, H.; Deng, T.; Mai, B.; Liu, X.; et al. Characteristics of 1 year of observational data of VOCs, NOx and O3 at a suburban site in Guangzhou, China. Atmos. Chem. Phys. 2015, 15, 6625–6636. [Google Scholar] [CrossRef] [Green Version]
Figure 1. The location and surrounding environment of the observation site.
Atmosphere 13 01136 g001
Figure 2. The seasonal proportions of different hydrocarbons.
Atmosphere 13 01136 g002
Figure 3. The daily variations in the different pollutant concentrations.
Atmosphere 13 01136 g003
Figure 4. The source profiles (blue bars) and distributions of each species for the different factors (red squares) in the autumn. (a) Industrial introduction 1; (b) Industrial introduction 2; (c) Gasoline evaporation; (d) LPG emission; (e) Solvent usage; (f) Biological emission; (g) Petrochemical industry.
Atmosphere 13 01136 g004
Figure 5. The source profiles (blue bars) and distributions of each species for the different factors (red squares) in the winter. (a) Industrial introduction 1; (b) Petrochemical industry; (c) Solvent usage; (d) Industrial introduction 2; (e) LPG emission; (f) Industrial introduction 3; (g) Vehicle emission.
Atmosphere 13 01136 g005
Figure 6. The source profiles (blue bars) and distributions of each species for the different factors (red squares) in the spring. (a) Gasoline evaporation; (b) Vehicle emission 1 + Petrochemical industry; (c) Vehicle emission 2 + Solvent usage 1; (d) LPG emission; (e) Industrial introduction 1; (f) Industrial introduction 2; (g) Solvent usage 2.
Atmosphere 13 01136 g006
Figure 7. The source profiles (blue bars) and distributions of each species for the different factors (red squares) in the summer. (a) Petrochemical industry; (b) Solvent usage; (c) Biological emission; (d) LPG emission; (e) Industrial introduction 1; (f) Industrial introduction 2; (g) Vehicle emission.
Atmosphere 13 01136 g007
Figure 8. The source contributions to the concentrations (a) of OFP (b), LOH (c) and SOAP (d) in the autumn.
Atmosphere 13 01136 g008
Figure 9. The source contributions to the concentrations (a) of OFP (b), LOH (c) and SOAP (d) in the winter.
Atmosphere 13 01136 g009
Figure 10. The source contributions to the concentrations (a) of OFP (b), LOH (c) and SOAP (d) in the spring.
Atmosphere 13 01136 g010
Figure 11. The source contributions to the concentrations (a) of OFP (b), LOH (c) and SOAP (d) in the summer.
Atmosphere 13 01136 g011
Figure 12. The concentrations of O3 and PM2.5 and OFP and SOAP that were estimated at the sampling site.
Atmosphere 13 01136 g012
Table 1. The mean values of the different meteorological variables.
TypeMeanStd aMinMaxN b
Wind Speed (m·s−1)1.950.970.107.708184
Temperature (℃)16.88.90−5.1036.48227
Relative Humidity (%)67.121.812.098.08201
a The standard deviation of the different variables; b the number of samples.
Table 2. The mean values of the VOCs (unit: ppbv).
MeanStdMinMaxMIR aKOH × 10−12 bSOAP cDL d
TVOC38.621.43.79164
Alkanes
Ethane5.032.560.0429.90.280.250.100.08
Propane3.651.920.0215.00.491.11 0.04
i-Butane1.360.870.0110.11.232.14 0.03
n-Butane1.991.460.0118.41.152.380.300.03
Cyclopentane0.110.110.012.652.395.02 0.02
i-Pentane1.201.150.0119.11.453.600.200.02
n-Pentane0.820.860.0117.31.313.840.300.02
Methylcyclopentane0.130.120.021.932.195.68 0.04
2,3-Dimethylbutane0.381.060.0115.30.975.79 0.03
2-Methylpentane0.260.270.016.781.505.200.000.03
2,4-Dimethylpentane0.060.070.012.151.554.77 0.03
2,2-Dimethylbutane0.090.360.0214.31.172.27 0.04
3-Methylpentane0.280.360.0210.11.805.200.200.04
n-Hexane0.450.560.0213.11.245.250.100.04
Cyclohexane0.782.130.0222.81.257.020.000.04
2-Methylhexane0.130.150.023.511.196.890.000.03
3-Methylhexane0.040.050.010.941.807.170.000.03
2,3-Dimethylpentane0.150.150.023.331.347.150.400.03
2,2,4-Trimethylpentane0.030.050.011.351.263.38 0.03
n-Heptane0.150.160.013.871.076.810.100.03
Methylcyclohexane0.100.110.012.191.709.64 0.03
2,3,4-Trimethylpentane0.020.050.011.361.036.60 0.02
2-Methylheptane0.440.990.0114.01.078.31 0.02
3-Methylheptane0.030.050.011.721.248.59 0.02
n-Octane0.170.240.013.520.908.160.800.02
n-Nonane0.040.100.013.310.789.751.900.02
n-Decane0.080.150.035.400.6811.07.000.06
n-Undecane0.350.930.018.560.6112.316.20.02
n-Dodecane0.110.080.012.010.5513.234.50.03
Alkenes
Ethene4.293.760.0454.99.008.151.300.07
Propene1.862.650.0133.011.726.01.600.03
Trans-2-Butene0.080.100.011.8915.263.24.000.02
1-Butene0.350.310.014.569.7331.11.200.02
Cis-2-Butene0.070.110.015.5514.255.83.600.03
Trans-2-Pentene0.030.050.011.7010.667.03.100.03
1-Pentene0.050.050.020.937.2131.40.000.03
Cis-2-Pentene0.030.030.020.6510.465.03.100.03
Isoprene0.260.560.0113.110.699.61.900.02
1-Hexene0.020.050.022.495.4937.00.000.04
Alkyne
Acetylene3.762.370.0220.60.950.760.100.04
Aromatics
Benzene2.804.460.0254.90.721.2292.90.03
Toluene2.442.750.0133.34.005.581000.03
Ethylbenzene1.611.360.0126.13.047.001120.02
m,p-Xylene0.600.540.018.677.8018.775.80.02
Styrene0.200.330.014.971.7358.02120.02
o-Xylene0.400.410.019.277.6413.695.50.02
i-Propylbenzene0.050.070.011.032.526.3095.50.02
n-Propylbenzene0.050.060.011.482.035.801100.02
p-Ethyltoluene0.260.170.022.604.4411.869.70.04
m-Ethyltoluene0.070.110.021.357.3918.61010.04
1,3,5-Trimethylbenzene0.060.150.018.0111.856.713.50.03
o-Ethyltoluene0.070.080.011.495.5911.994.80.02
1,2,4-Trimethylbenzene0.570.730.0615.78.8732.520.60.12
1,2,3-Trimethylbenzene0.050.040.011.0112.032.743.90.02
m-Diethylbenzene0.040.050.011.167.10 0.02
p-Diethylbenzene0.070.050.010.684.43 0.02
a The maximum incremental reactivity in O3/VOC, as proposed by Carter (2010); b the reaction rate with OH radicals in cm−3 molecule−1 s−1, as proposed by Carter (2010); c the SOA formation mass based on the basic mass relative to toluene, as proposed by Derwent et al. (2010); d the detection limit of the different VOC species.
Publisher’s Note: MDPI stays neutral with regard to jurisdictional claims in published maps and institutional affiliations.

