Article

Spatiotemporal Variations in the Air Pollutant NO2 in Some Regions of Pakistan, India, China, and Korea, before and after COVID-19, Based on Ozone Monitoring Instrument Data

Atmospheric Sciences, Department of Astronomy, Space Science, and Geology, Chungnam National University, Daejeon 34134, Korea
*
Author to whom correspondence should be addressed.
Atmosphere 2022, 13(6), 986; https://doi.org/10.3390/atmos13060986
Submission received: 10 May 2022 / Revised: 28 May 2022 / Accepted: 13 June 2022 / Published: 18 June 2022
(This article belongs to the Section Air Quality)

Abstract

:
In 2020, COVID-19 was proclaimed a pandemic by the World Health Organization, prompting several nations throughout the world to block their borders and impose a countrywide lockdown, halting all major manmade activities and thus leaving a beneficial impact on the natural environment. We investigated the influence of a sudden cessation of human activity on tropospheric NO2 concentrations to understand the resulting changes in emissions, particularly from the power-generating sector, before (2010–2019) and during the pandemic (2020). NO2 was chosen because of its short lifespan in the Earth’s atmosphere. Using daily tropospheric NO2 column concentrations from the Ozone Monitoring Instrument, the geographic and temporal characteristics of tropospheric NO2 column were investigated across 12 regions in India, Pakistan, China, and South Korea (2010–2020). We analyzed weekly, monthly, and annual trends and found that the NO2 concentrations were decreased in 2020 (COVID-19 period) in the locations investigated. Reduced anthropogenic activities, including changes in energy production and a reduction in fossil fuel consumption before and during the COVID-19 pandemic, as well as reduced traffic and industrial activity in 2020, can explain the lower tropospheric NO2 concentrations. The findings of this study provide a better understanding of the process of tropospheric NO2 emissions over four nations before and after the coronavirus pandemic for improving air quality modeling and management approaches.

1. Introduction

Coronavirus disease (COVID-19) has been labeled the pandemic of the twenty-first century [1]. The disease rapidly spread to 210 countries and killed more than 100,000 people around the world in less than half a year [2]. Due to COVID-19, many countries across the world applied strict lockdown measures that were implemented by government authorities to reduce the further spread of the disease [3]. Isolation, quarantine, social distancing, and community restraint were recommended to limit human-to-human transmission in most countries. Several other countries instituted limits on public gatherings when the number of cases and death rates were increasing [4,5].
As countries went into lockdown, the industrial activities shut down globally. Road and air transport came to a halt, as people were not allowed, or hesitated, to travel. Not only the transport sector but also the industrial and manufacturing sector was heavily affected by the pandemic. Global oil demand declined drastically and prices cut down sharply as industrial and transport sectors came to a halt worldwide [6]. COVID-19 has had a devastating influence on human health and the global economy. The COVID-19-related restrictions lowered particulate matter and trace gas concentrations across cities around the world, providing a natural opportunity to study the effects of anthropogenic activities on emissions of air pollutants [7]. Air pollution is a global problem, and its effects can be seen even across developed nations. Annually, 4.6 million people die worldwide due to poor air quality [8]. Air pollutants can be divided into two forms: particulate matter (PM) and gaseous pollutants. Gaseous pollutants, such as sulfur dioxide (SO2), nitrogen dioxide (NO2), and ozone (O3), also play very important roles in our atmospheric environment and are receiving increasing attention [9,10].
NO2 plays an important role in the modification of the radiative balance of the Earth’s atmosphere by changing its oxidizing capacity and chemistry and by influencing the lifetimes of important greenhouse gases. A high NO2 concentration in the troposphere adversely impacts the inhabitants of the planet [11,12]. NO2 is primarily released by anthropogenic emissions, including the industrial burning of fossil fuels such as coal, oil, and gas, vehicle exhaust, biomass burning, and electricity generation. It is also created during the production of nitric acid, welding, and the use of explosives, the refining of petrol and metals, commercial manufacturing, and food manufacturing. In terms of natural sources, it is emitted from soils through the decomposition process of nitrates and can be produced by lightning [13]. NO2 is considered an important indicator of environmental pollution worldwide, as breathing air with a high concentration of NO2 can irritate the airways in the human respiratory system. NO2 exposures over short periods can aggravate respiratory diseases, particularly asthma, leading to respiratory symptoms, such as coughing, wheezing, or difficulty in breathing. Longer exposures to elevated concentrations of NO2 may contribute to the development of asthma and potentially increase the susceptibility to respiratory infections [14].
Although the decline in anthropogenic activities during the COVID-19 pandemic had adverse implications, such as a drop in economic development, it had some favorable consequences in terms of air pollution levels. Studies in various parts of the world have documented the influence of lockdowns on tropospheric NO2 concentrations. Since the onset of the COVID-19 pandemic, NASA has published studies indicating that NO2 concentrations have decreased as a result of the COVID-19 lockdown measures. Several other studies have reported that the restricted human activities during the lockdown resulted in a significant reduction in surface NO2 emissions in Indian cities and megacities [15,16,17]. NO2 measured with the Tropospheric Monitoring Instrument on the Sentinel-5 satellite of the European Space Agency revealed a 30% reduction in tropospheric NO2 concentrations across Chinese cities [18,19].
In this study, the influence of the COVID-19 shutdown on the dynamics of tropospheric NO2 concentrations in 12 locations was investigated using satellite-based (Ozone Monitoring Instrument; OMI) NO2 data. With the aim to provide a scientific interpretation and aid air pollution control, in this study, we investigated changes in air pollution before and during the COVID-19 period in 12 cities in Pakistan, India, China, and Korea, using satellite data. In particular, we focused on the most important air pollutant, NO2, which is associated with industrial and transportation activities, and we evaluated (1) changes in NO2 concentrations during each day of the week in 12 cities in the above-mentioned four countries; (2) monthly changes in NO2 emissions in 2020 (compared with the previous 10 years) in the 12 cites; (3) significant changes in annual NO2 concentration trends during 2010–2019 (before COVID-19) and 2010–2020 (including the COVID-19 period) in Lahore, Karachi, Bahawalpur, New Delhi, Kolkata, Hyderabad, Kanpur, Beijing, Wuhan, Shanghai, and Seoul; and (4) a possible reason for the drop in NO2 concentrations during the pandemic.

2. Materials and Methods
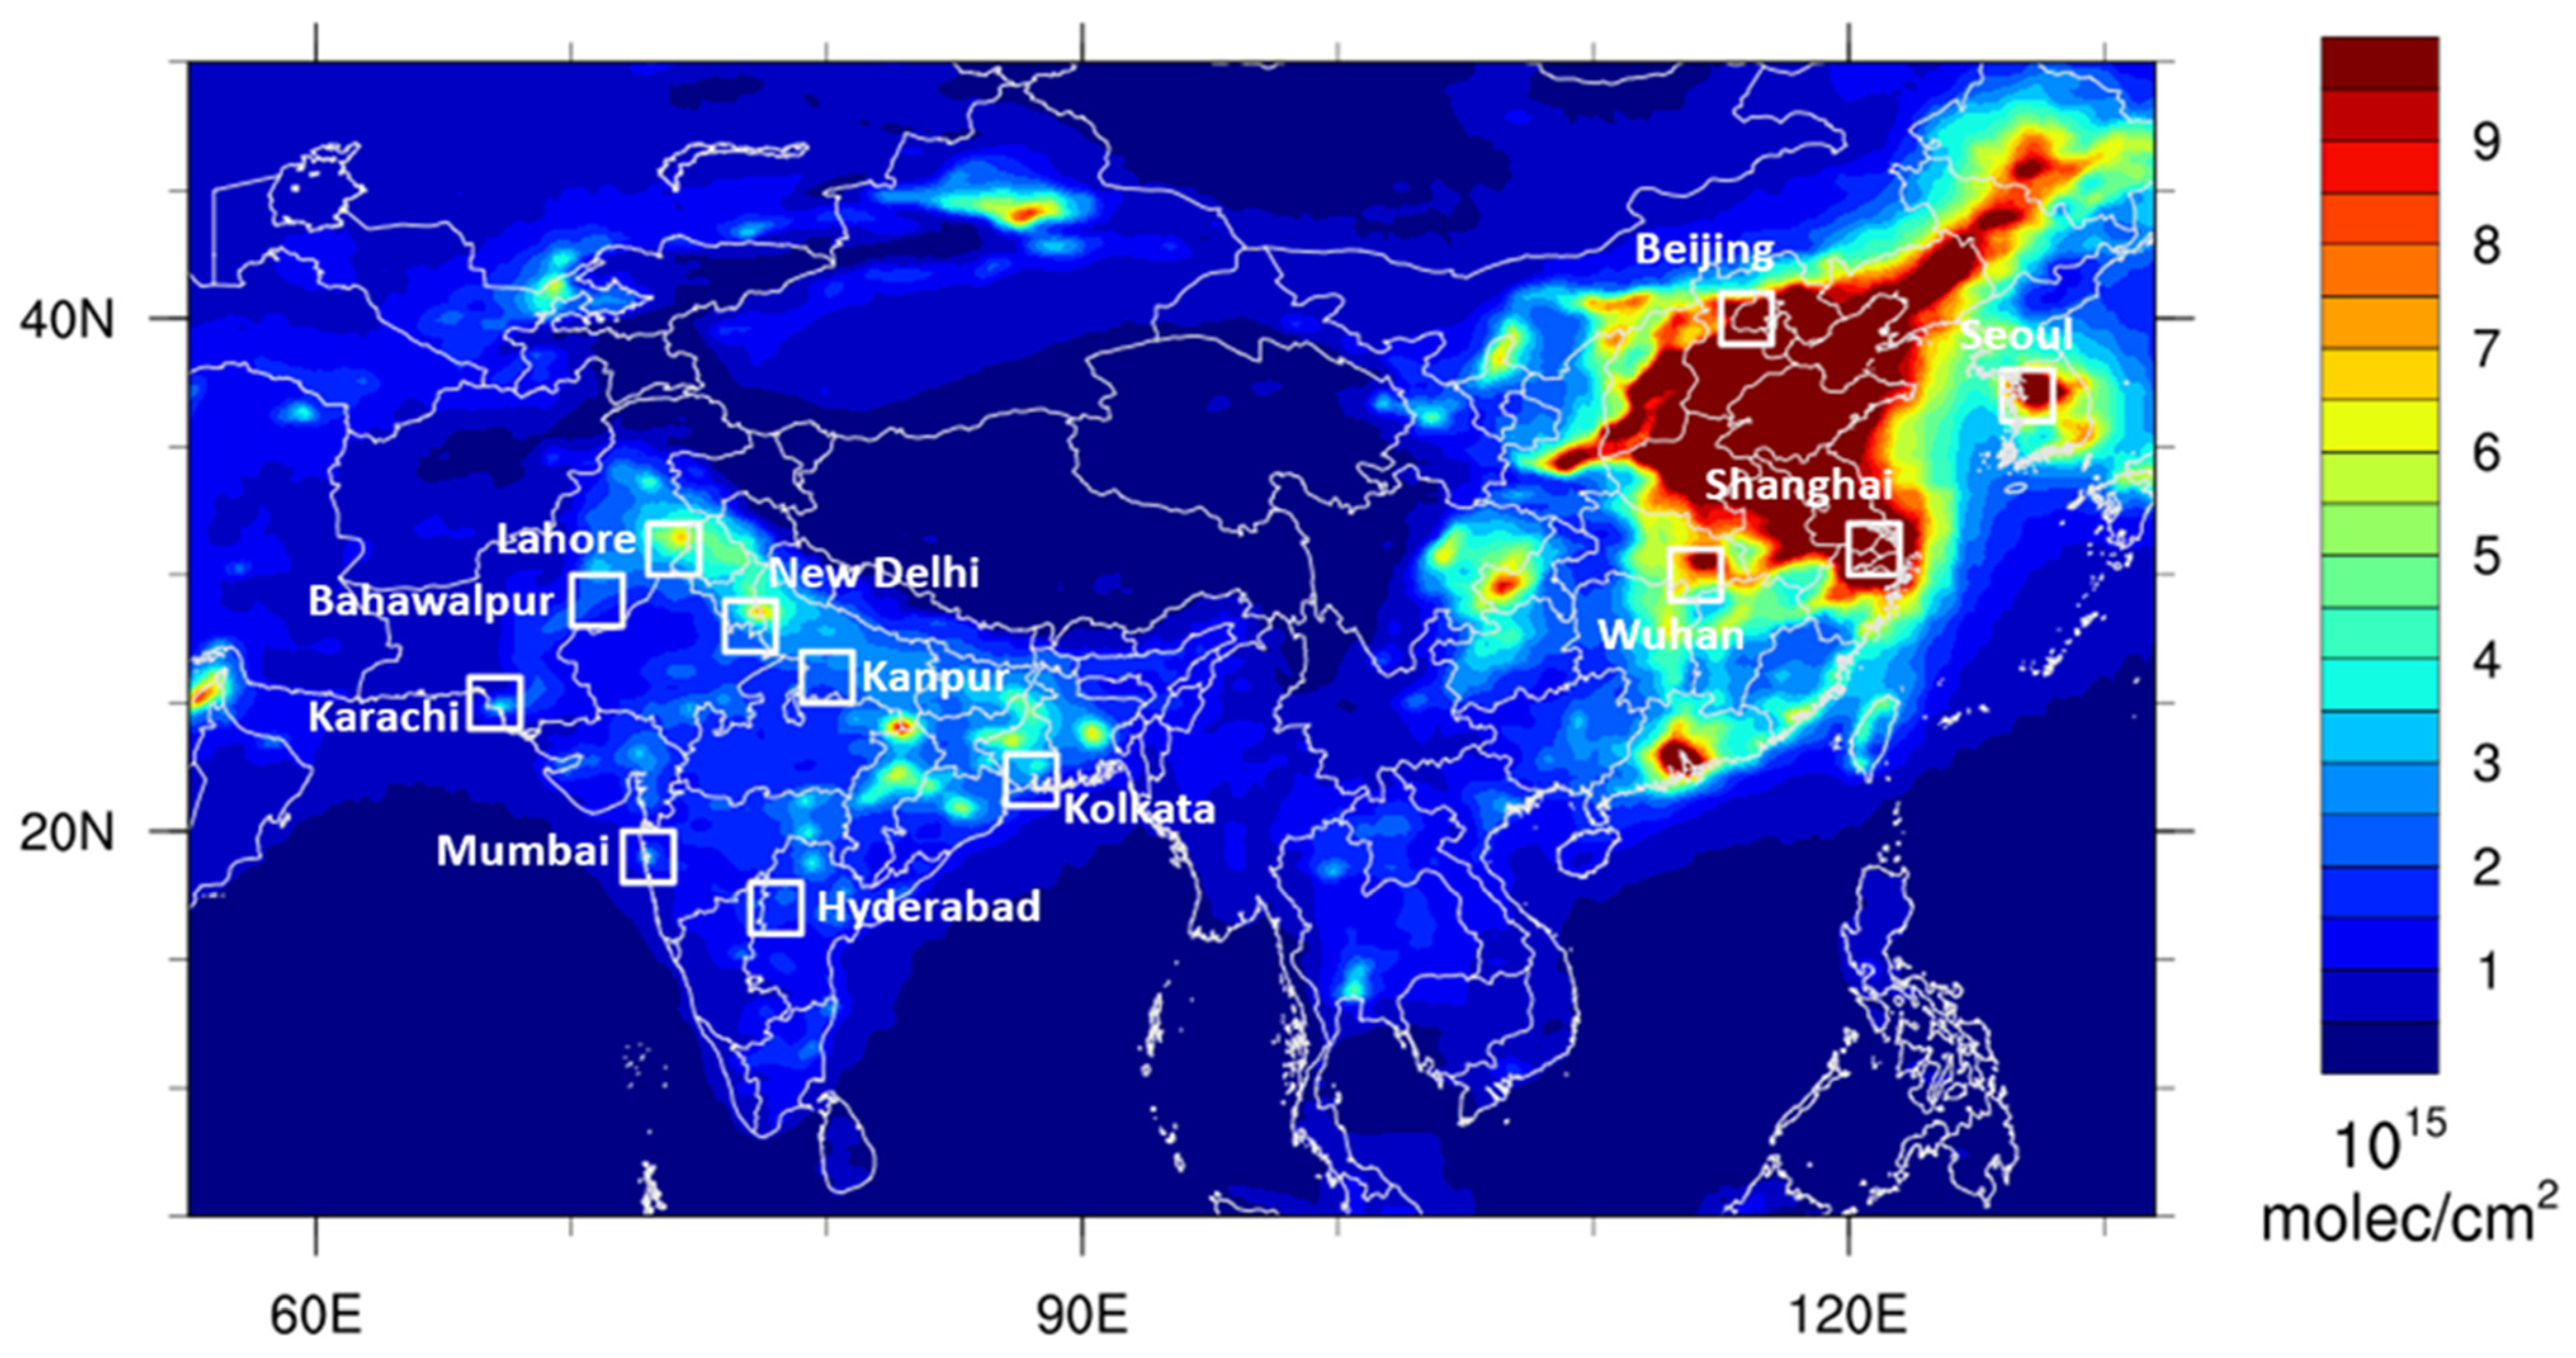
2.1. Study Area

The 12 areas of interest included in the present study are located in two countries in South Asia (Pakistan and India) and two in East Asia (China and South Korea). The locations include three cities (Lahore, Karachi, and Bahawalpur) in Pakistan; five cities (New Delhi, Kolkata, Mumbai, Hyderabad, and Kanpur) in India; three (Beijing, Wuhan, and Shanghai) in China; and one (Seoul) in Korea, as shown in Figure 1. These cities were selected because most of them are densely populated, major cities. As one of the most populous countries in the world, Pakistan is home to some of the world’s megacities. Its most populous city, Karachi, is the largest in Pakistan but also the 12th most populous city in the world, with a population that exceeds 16 million people. Pakistan’s 2nd most populous city, Lahore, is only about half the size of Karachi, with a population surpassing 13 million, and ranks the 22nd most populous city globally. India has many large cities that contribute to its massive population. These megacities, especially New Delhi (ranked 2nd) and Mumbai (ranked 9th), contribute millions to the global population. Shanghai is China’s most populous city, ranking 3rd in the world, and Beijing ranks 8th. Seoul ranks 1st in South Korea and 33rd in the world in terms of population [20]. The current population sizes of these cities are provided in Table 1. A large population implies more anthropogenic activities and thus, higher levels of pollution [21]. Therefore, we selected these large cities with massive communities and substantial human-caused activities to evaluate the effect of COVID-19 on NO2 concentrations.
Air pollution conditions in all 12 cities were assessed by measuring NO2 levels. Figure 1 shows the mean annual distribution of NO2 over the study area by using the OMI/Aura NO2 Cloud-Screened Total and Tropospheric Column Level 3 Global Gridded (0.25° × 0.25°) product. The daily data were averaged into monthly data, and the monthly data were averaged into yearly data to observe the annual variation in NO2 over the study area. The figure indicates maximum NO2 concentrations over China and South Korea due to enormous population growth, emissions from vehicles and industrial sites, and additional emissions from house heating during winters. Considerable variability in NO2 column levels was observed over the Indian and Pakistani regions. The moderate levels of NO2 in Pakistan and the Indian Indo-Gangetic Plain are attributed to large populations, heavy industries, and large urban areas. The southern parts of India and Pakistan showed low NO2 concentrations, mostly because these regions have a hotter and more humid climate, leading to higher OH concentrations, which contributes to the reduction in NO2 through enhanced photolysis. Strong winds from the Arabian Sea also contribute to the lower NO2 pollution in the southern parts.

2.2. Data Collection

Satellite-based remote sensing allows the monitoring of different pollutants in the atmosphere on a global scale, which facilitates the study of the spatiotemporal distribution of air pollutants [22]. The OMI is onboard NASA’s Aura satellite, which was launched in October 2004. It is in a sun-synchronous ascending polar orbit with a local equator crossing time of 13:45 [23]. In the nominal global operation mode, the OMI ground pixel size varies from 13 km × 24 km at the true nadir to 28 km × 150 km on the edges of the swath [24]. The main monitoring targets of OMI are various trace gases, including O3, NO2, SO2, and CH2O. The tropospheric column concentration products of OMI that can effectively reflect the NO2 pollution emission characteristics are mainly based on spectral information in the visible wavelength range of 405–465 nm, obtained via the differential optical absorption spectroscopy (DOAS) inversion method [25]. In this study, we used OMI Cloud-Screened Total and Tropospheric Colum Level 3 Product OMNO2d daily data (OMI-NO2) from NASA, which are stored in HDF-EOS5 format, and the file contains tropospheric NO2 column concentration (TropNO2) and total NO2 column concentration (TotNO2) data, with a spatial resolution of 0.25° × 0.25° [26]. The main criteria used to generate the OMNO2d data product were solar zenith angle < 85°, terrain reflectivity < 30%, and cloud fraction < 30% (for cloud-screened fields). We gathered OMNO2d data from 1 January 2010 to 31 December 2020. Data from 2010 to 2019 were used to profile tropospheric NO2 before the pandemic, whereas data from 2020 allowed for the monitoring of NO2 changes throughout the epidemic. The daily values were averaged over various timeframes, as mentioned in the Results Section. To analyze the association between fossil fuel usage and NO2 emissions before and after COVID-19, we retrieved data on coal, oil, and natural gas consumption from bp Statistical Review of Worlds Energy 2021 (https://www.bp.com/ accessed on 15 February 2022). First published in 1952, the Statistical Review has provided a constant source of objective, comprehensive, and, most importantly, trusted data to help industries, governments, and commentators make sense of the developments in the global energy markets. The Statistical Review provides globally consistent data time series. The statistics published in this review were collected from government sources and published data and are very reliable [27]. The population data for the different cities included in this study, shown in Table 1, were obtained from https://www.macrotrends.net/ accessed on 20 February 2022.

3. Results and Discussion

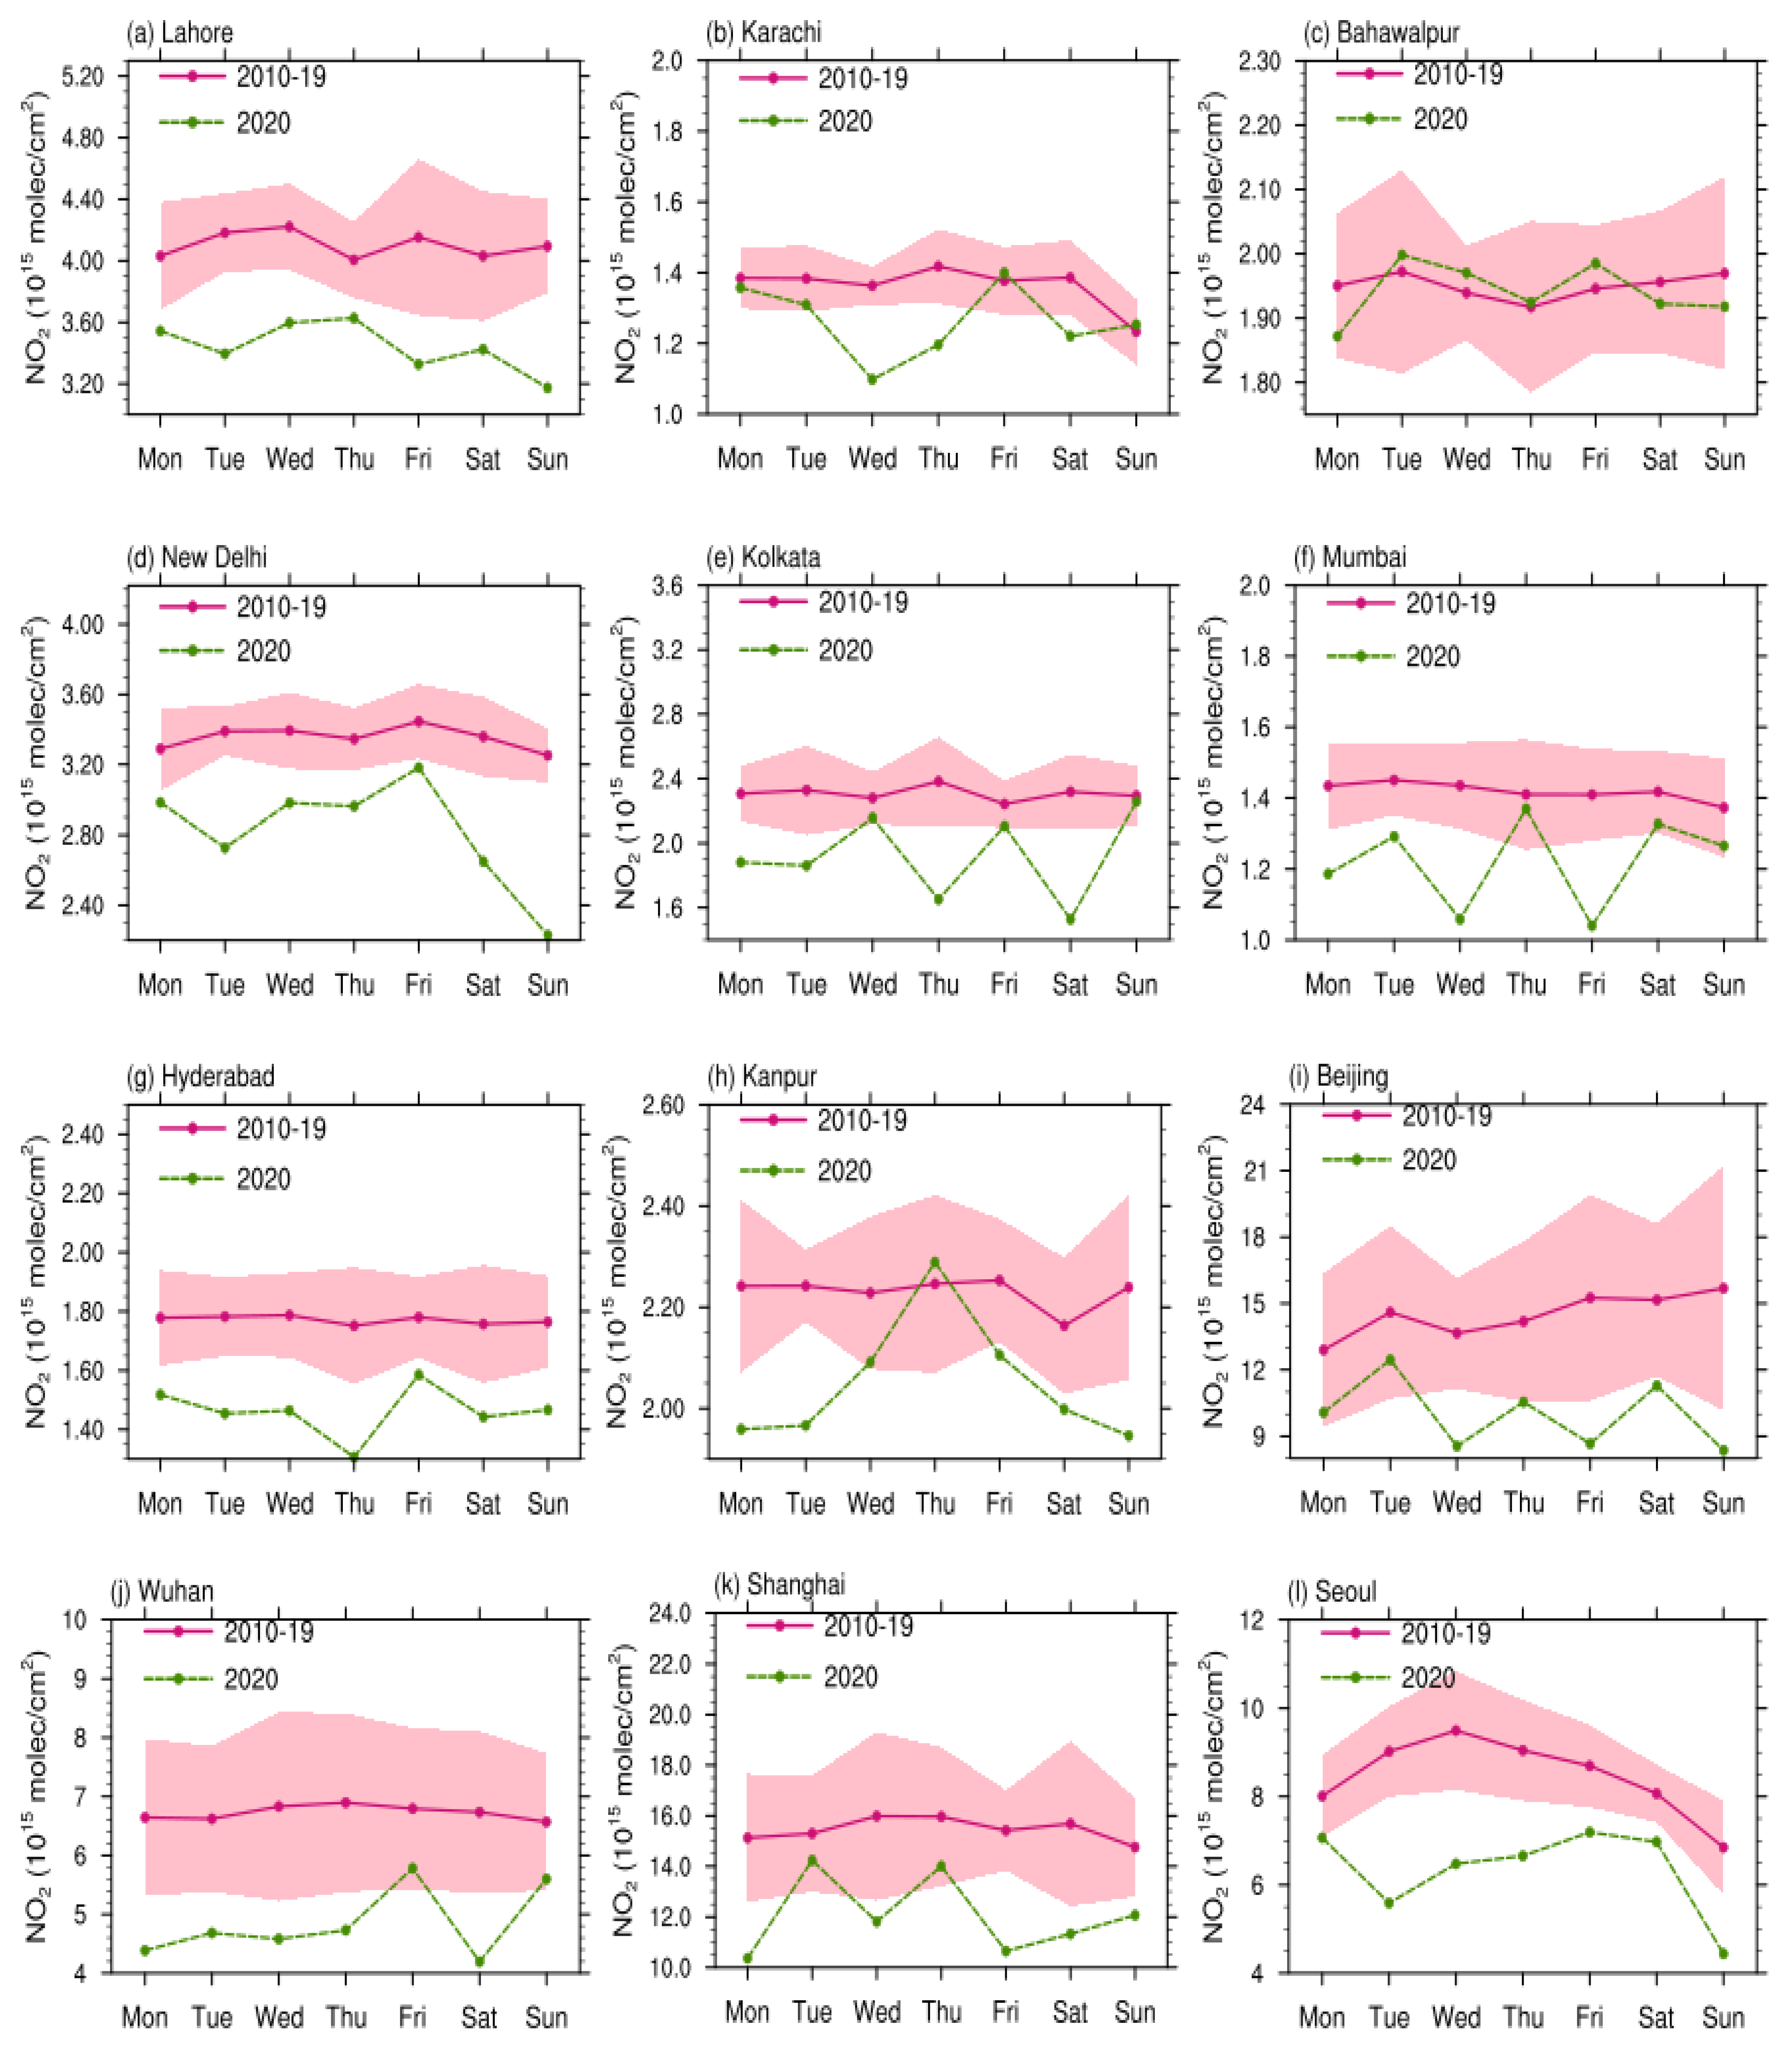
3.1. Weekly Variation in NO2 Concentrations

As human activities are planned according to the weekly cycle, it is crucial to investigate the effect of weekly cycles on anthropogenic emissions. The OMI NO2 column data capture day-to-day variabilities as effectively as ground-based measurements. Figure 2 shows the weekly cycles of NO2 from satellite observations for the 12 cities and reveals that air quality improved in 2020. Human activities during the week are high during the working days (Monday to Friday), whereas they decline over the weekends [28]. This is termed the weekend effect. As expected, and in agreement with previous satellite-based evaluations, during the COVID period (dotted green line in the results), large column decreases were observed on Saturday in Kolkata and Wuhan and, especially, on Sunday in Lahore, New Delhi, Kanpur, Beijing, and Seoul, whereas the other locations showed a dip in NO2 amounts during weekdays. From 2010 to 2019, the average NO2 emissions on all weekdays did not fluctuate substantially in the five Indian cities (New Delhi, Kolkata, Mumbai, Hyderabad, and Kanpur), as well as in Wuhan and Shanghai. During the COVID period, numerous fluctuations and dips in NO2 concentrations were observed during the working days in all 12 cities, similar to previous results reported for Shanghai [29], where the variation in daily mean NO2 on different days of the week was evidently very low, with no definite weekend effect when compared with the normal weekly cycle before the COVID period. Beijing and Lahore showed opposite trends on Sundays, i.e., high NO2 values before COVID and low values during COVID-19. It can be clearly seen that, for nearly all regions, on all days of the week, NO2 concentrations were reduced in 2020, except for Bahawalpur, which showed high NO2 concentrations from Tuesday to Friday, and Kanpur, which showed high NO2 concentrations on Thursday, compared with the pre-COVID period. More uncertainty during the week was observed in Bahawalpur, Kanpur, Beijing, Wuhan, and Shanghai, whereas standard deviation values in the other areas were relatively low. In a previous study [30], NO2 concentrations were reduced mostly on weekends in most regions of Asia, including China, Korea, and India, but the weekly cycles in this study showed dips also on weekdays, because of the reduced emissions from car traffic and industrial activity [31] on weekdays during the COVID period.

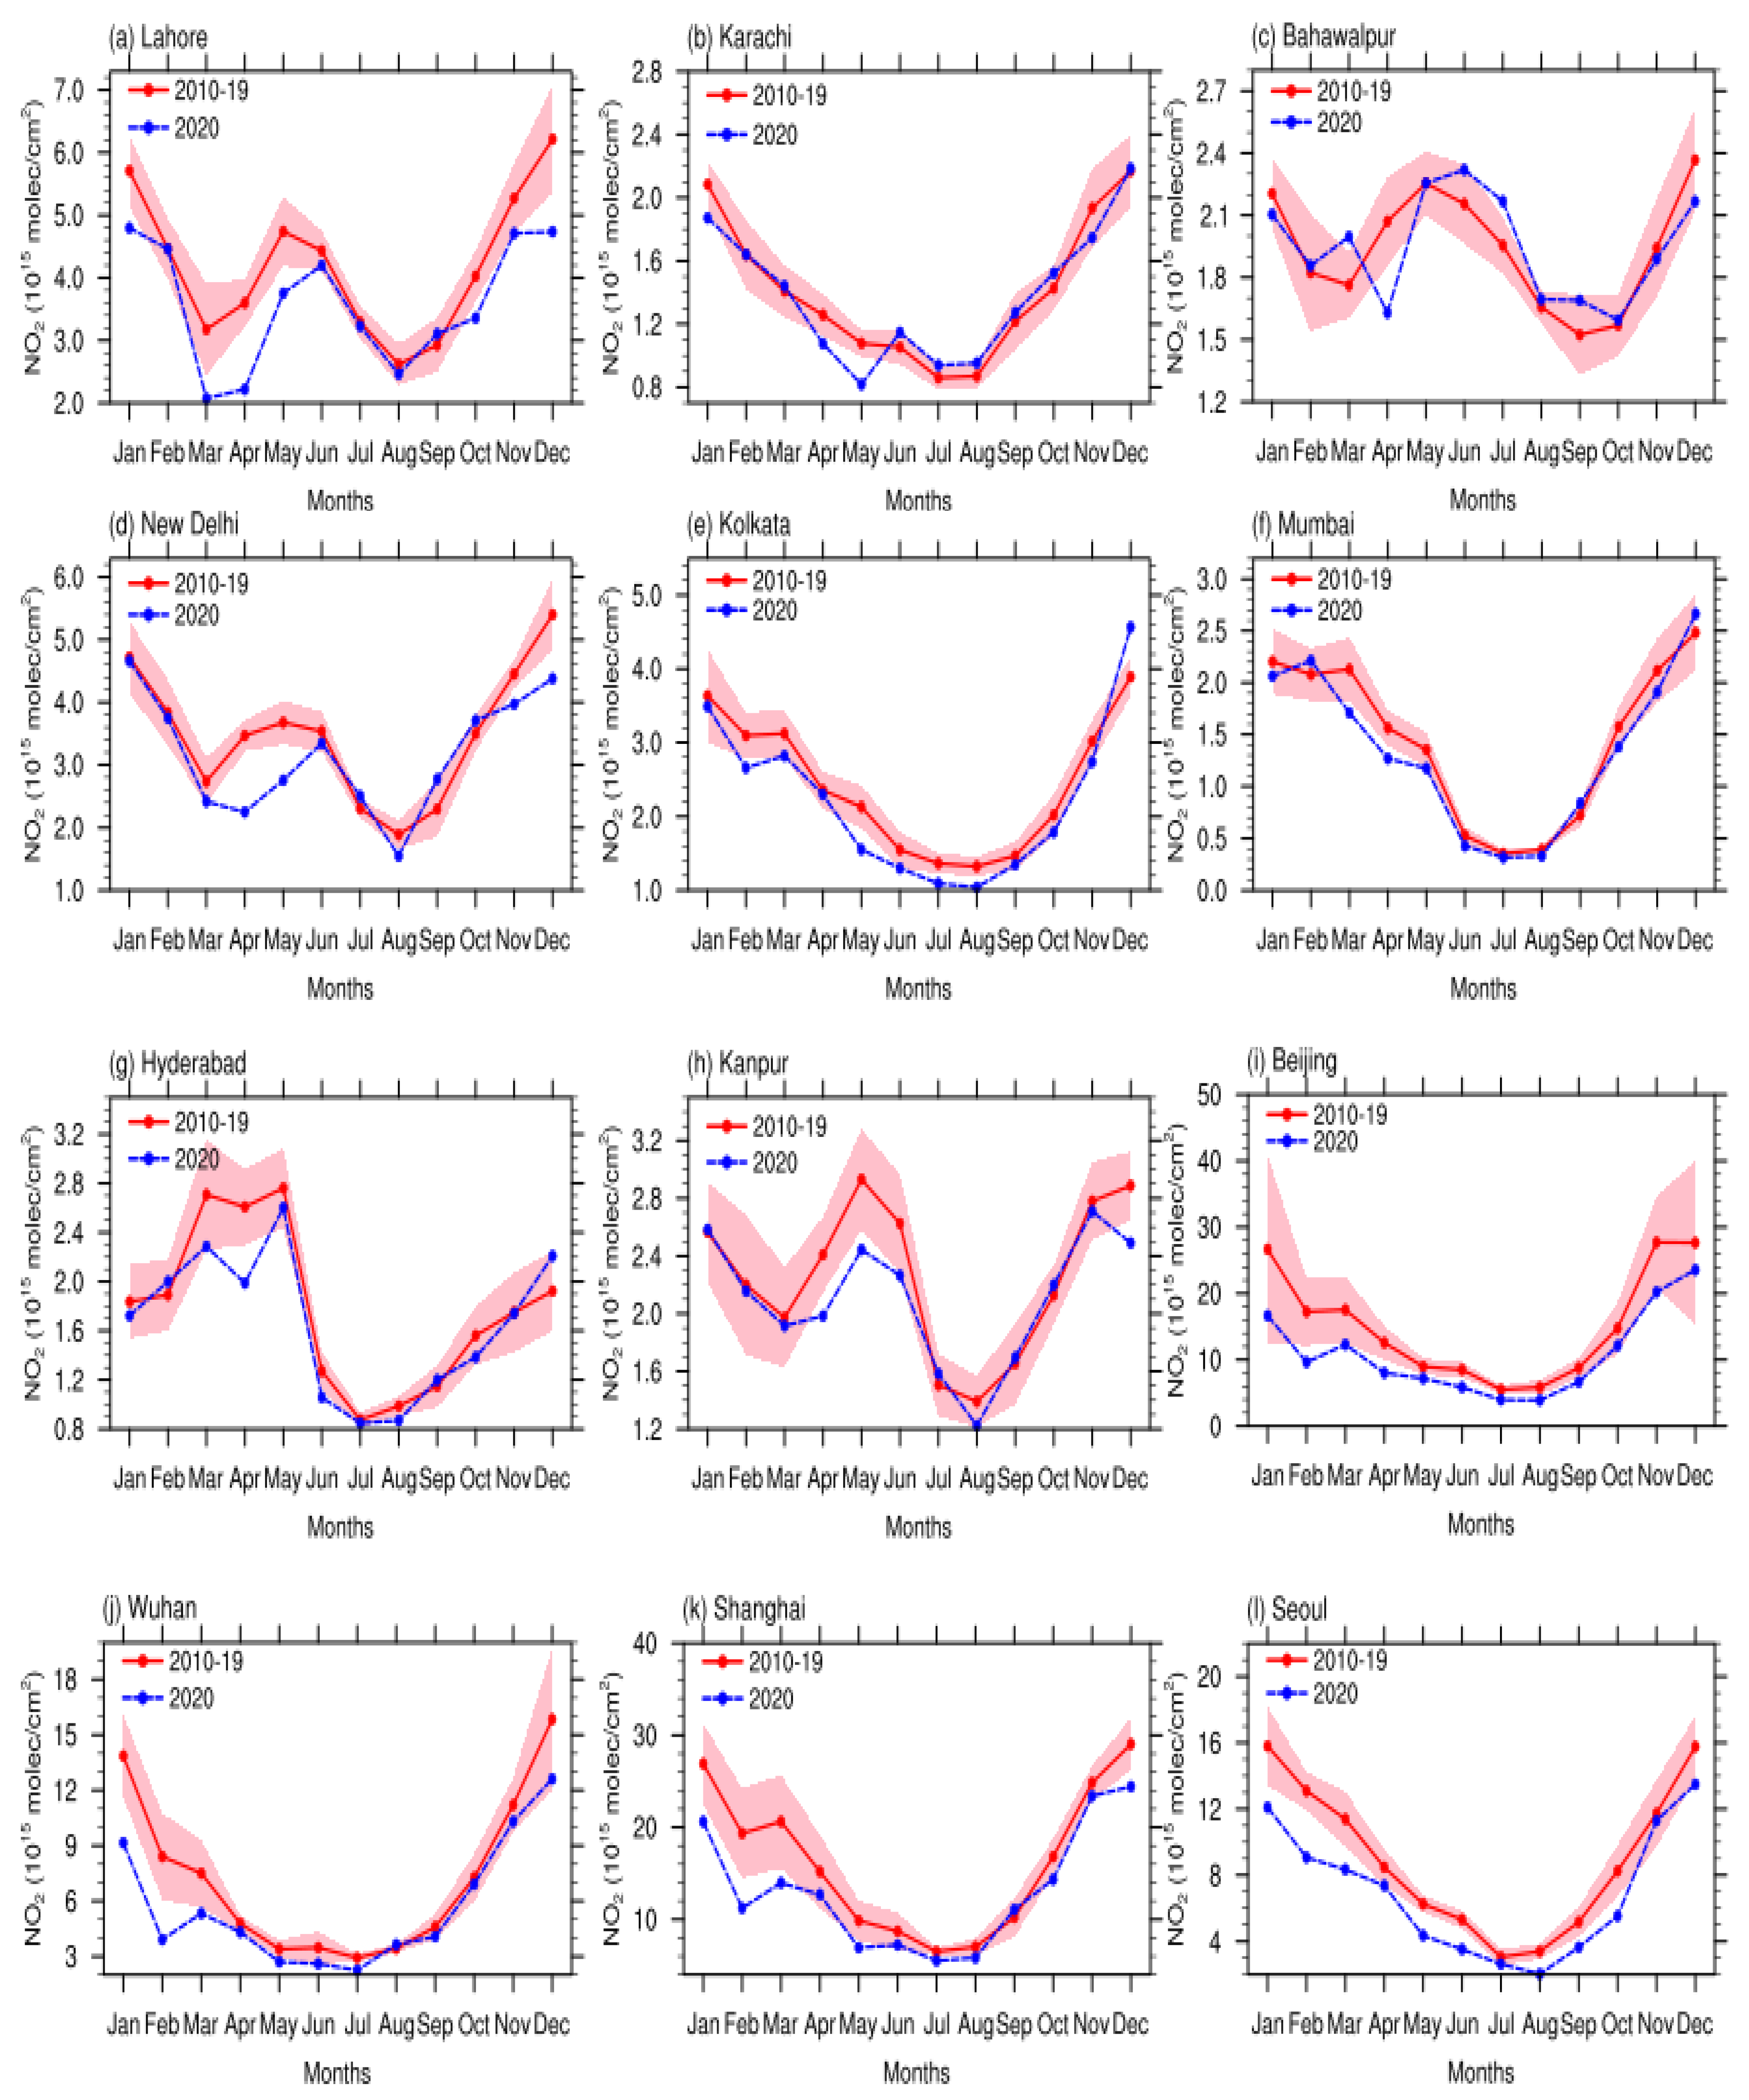
3.2. Monthly Variation in NO2 Concentrations

Figure 3 shows the monthly surface NO2 concentration and corresponding standard deviations at the 12 selected sites. For most cities (i.e., Karachi, Kolkata, Mumbai, Beijing, Wuhan, Shanghai, and Seoul), in the pre-COVID period, the fluctuations in monthly averaged NO2 concentrations were U-shaped, with peaks in the winter (December and January) and dips in the summer (July and August), as is also clear from Table 2. In these areas, uncertainty was high in winter and low during the summer months. The high NO2 concentrations during the cold season were due to weak winds, dry weather conditions, and the heavy use of biomass fuel for wintertime home cooking, as well as a lack of UV radiation to initiate photolysis reactions that break down NO2 [32,33]. The reduced levels of pollutants such as NO2 and carbon monoxide in the summer months can be attributed to the contribution of these compounds to photochemical reactions occurring under the influence of solar radiation, which result in ozone formation, and presumably, less traffic activity due to reduced social and educational activities during the very hot summer [34]. As for the emission source, coal-fired heating emissions and more natural gas usage in winter should be important contributing factors [35,36]. In addition, the lifetime of NO2 is several times longer in winter than in summer [37]. The same trend was observed in the above-mentioned cities in the COVID period, but with reduced NO2 emissions, especially during the lockdown periods. In winter, less radiation reaches the Earth’s surface, and the boundary layer substantially decreases, causing the build-up of near-surface air pollutants and thus, more serious air pollution [38]. In the other cities (Lahore, Bahawalpur, New Delhi, and Kanpur), NO2 emissions showed a bimodal pattern, with a flat “W” shape because of high NO2 amounts in January, December, and May. The December and January peaks in these areas are mainly due to biomass burning for domestic heating, stable winds, fewer daily sun hours, and low temperatures, and the surge in NO2 in May was associated with large-scale crop residue burning in wheat fields in neighboring rural areas [39]. The standard deviation was roughly the same for all months in these locations. Hyderabad showed a different pattern from the other regions, with high NO2 and standard deviation values in March and May. The maximum difference in NO2 before and during the pandemic was observed in Chinese cities, especially in Beijing, and the minimum difference was observed in Bahawalpur.

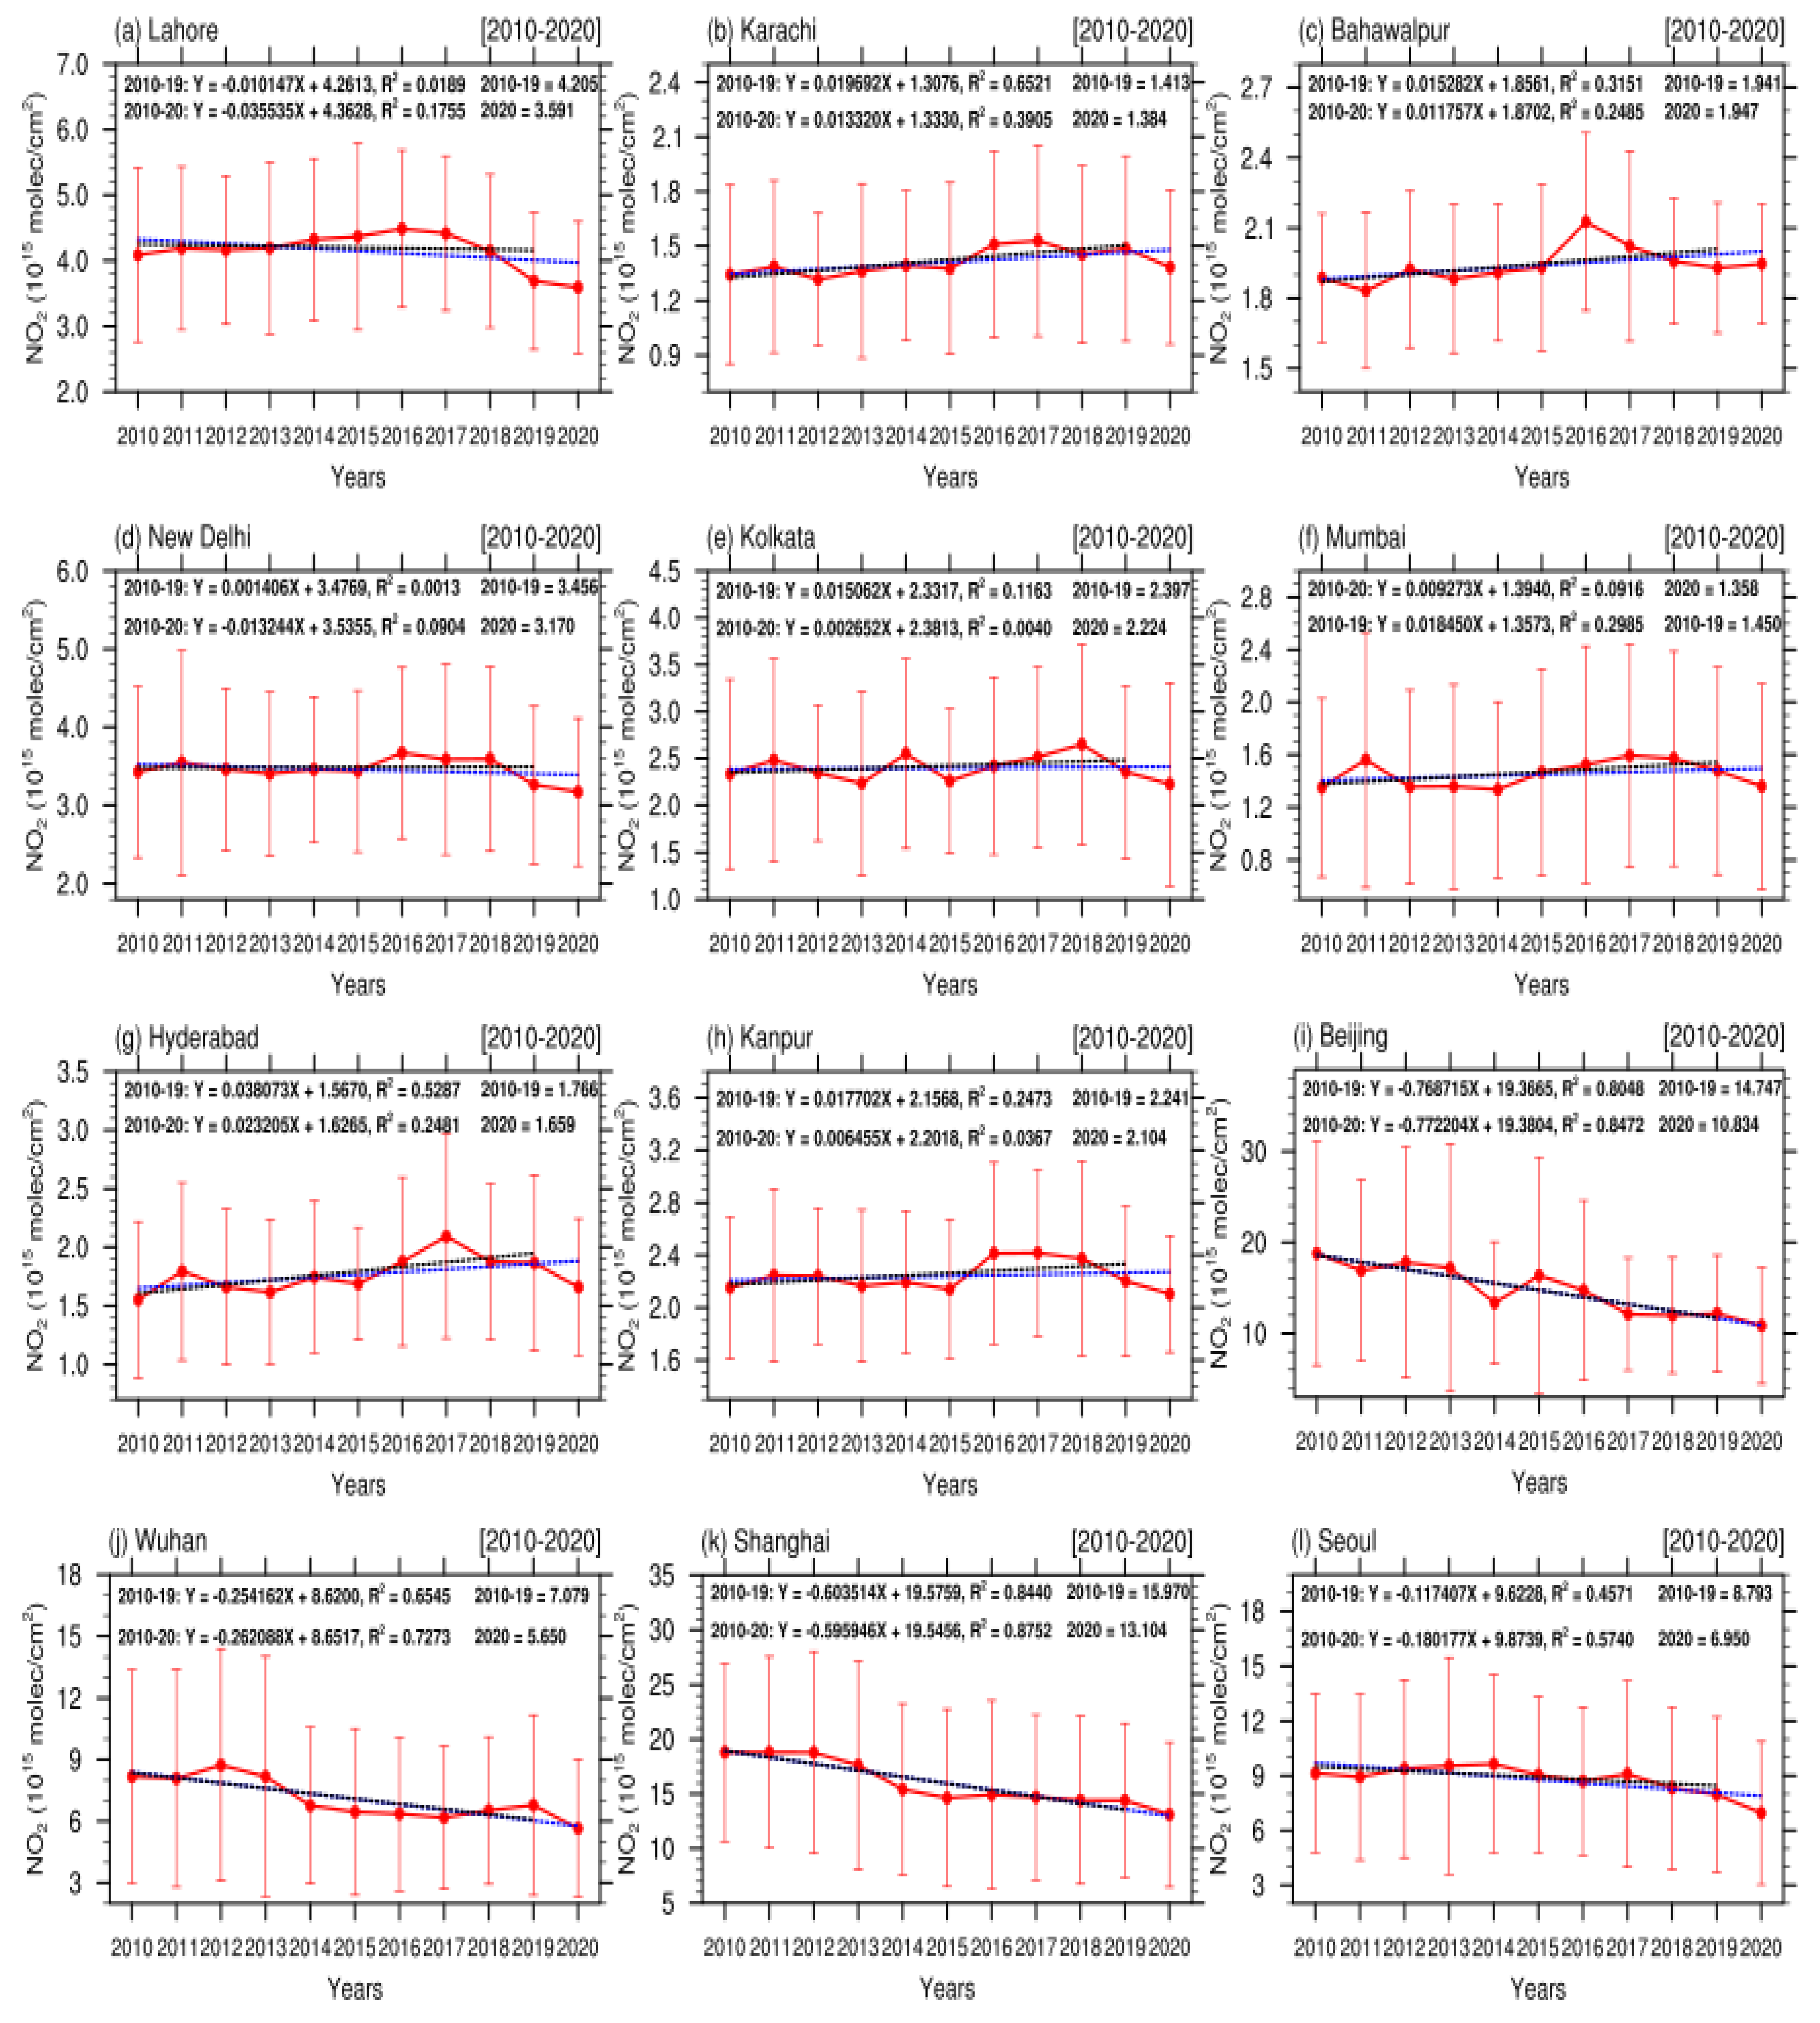
3.3. Annual Mean Trends in NO2 Concentrations

The annual variations in the 12 cities exhibited different change patterns, as shown in Figure 4. Over the entire period, maximum NO2 concentrations were observed in Beijing and Shanghai, and minima were observed in Karachi and Mumbai. During the 11-year period, a decreasing trend in NO2 concentrations was observed in Lahore, New Delhi, Beijing, Wuhan, Shanghai, and Seoul. The other cities—namely, Karachi, Bahawalpur, Kolkata, Mumbai, Hyderabad, and Kanpur—showed an increasing trend. As shown in Table 3, for the period 2010–2019, a maximum percentage decrease in NO2 concentrations of 5.07% per year was observed in Beijing and a minimum of 0.24% per year in Lahore. In the same period, the maximum percentage increase per year was observed in Hyderabad (2.14%) and the minimum in New Delhi (0.04%). During the 2010–2020 period, a maximum decrease in NO2% of 5.23% per year was observed in Beijing, and the minimum decrease in Delhi (0.38%). The maximum increase during this period was observed in Hyderabad (1.31%) and the minimum increase in Kanpur (0.28%). The largest fluctuation was observed in Hyderabad and the lowest in Shanghai. Overall, it can be seen that, due to the inclusion of the COVID period, the trends declined in all locations, compared with the pre-COVID period.

3.4. A Possible Reason for the Reduced NO2 Emissions during the COVID-19 Period

Fossil fuel combustion and anthropogenic alterations to soils through fertilization or livestock management are the primary sources of NO2 in many parts of the world [40]. A substantial decrease in human activities that require the use of fossil fuels, such as industrialization and transportation, can lead to a considerable decrease in NO2 emissions [41]. Since NO2 emissions are largely anthropogenic, it is expected that the spatial and temporal trends in NO2 should be closely associated with the energy consumption structure and exhaust emissions in the study areas. If we study the percentage consumption of oil, coal, and natural gas in China in 2020 in Table 4, it clearly shows a 3.6% decrease in oil consumption, a 1.2% decrease in coal consumption, and a 6.2% decrease in natural gas consumption, compared with the previous years. Limited anthropogenic activities and lower use of fossil fuels in 2020 resulted in lower NO2 concentrations over the area, which is in line with the trend results in Beijing, Wuhan, and Shanghai, where the NO2 % per year was reduced when the COVID period was included. In India, the consumption of oil, coal, and gas also decreased by 7.0%, 12.2%, and 3.9%, respectively, and this lower consumption resulted in reduced NO2 emissions during the COVID period, as indicated for New Delhi, Kolkata, Mumbai, Hyderabad, and Kanpur in Table 3. All non-renewable energy source percentages tended to decline during the COVID period, compared with the previous years, except for coal in Pakistan, which increased by 0.5% because primary energy production by coal rose from 0.56 exajoules in 2019 to 0.62 exajoules in 2020. Overall, because of the lockdown, social distancing rules, and work restrictions, industrial activities, transportation, and other human activities declined during the COVID period and so did the NO2 emissions.

4. Conclusions

We conducted a satellite, remote sensing-based assessment of NO2 emissions associated with the nonrenewable energy consumption during and before the COVID-19 restrictions in Pakistan, India, China, and Korea. The main findings of this comparison are as follows: (1) NO2 levels were lowered mostly on weekends in most Asian countries before COVID-19 and high or fluctuating on weekdays, but the weekly cycle during the pandemic showed drops in NO2 amounts on weekdays. (2) Monthly emissions showed the same trend as before the pandemic, i.e., high NO2 concentrations in winter months (January and December) and low concentrations in July and August, but NO2 levels were reduced in 2020. (3) Over the entire study period, some of the cities showed an increasing trend, whereas others showed a decreasing trend, but nearly all cities showed a percentage decrease in NO2 emissions in the COVID period, due to which trend results declined in all locations. (4) Since the percentage of fossil fuel consumption was reduced in 2020, compared with the pre-COVID period, NO2 emissions were also reduced during the COVID-19 period. It can be concluded that a significant reduction in human activities that involve the use of fossil fuels, such as industrialization and transportation, during a pandemic can result in a significant reduction in NO2 emissions. This favorable influence on the environment may only be temporary, but authorities should take note of how to minimize pollution on a long-term basis using the experience of the lockdown period. The present study’s findings may aid in the development of better air pollution control strategies as well as improved air quality modeling and forecasting for the benefit of human health and the environment.

Author Contributions

Conceptualization, Y.G.L., W.N. and J.K.; methodology, Y.G.L., W.N. and J.K.; software, W.N. and J.K.; validation, W.N.; formal analysis, W.N.; investigation, W.N.; resources, Y.G.L., W.N. and J.K.; data curation, Y.G.L., W.N. and J.K.; writing—original draft preparation, W.N.; writing—review and editing, Y.G.L., W.N. and J.K.; visualization, W.N. and J.K.; supervision, Y.G.L.; project administration, Y.G.L.; funding acquisition, Y.G.L. All authors have read and agreed to the published version of the manuscript.

Funding

This research was supported by the research fund of Chungnam National University (2019-0685-01).

Institutional Review Board Statement

Not applicable.

Informed Consent Statement

Not applicable.

Data Availability Statement

Not applicable.

Acknowledgments

OMI data were directly downloaded from the Earth Data server (https://disc.gsfc.nasa.gov accessed on 27 May 2022).

Conflicts of Interest

The authors declare no conflict of interest.

References

  1. WHO. Available online: https://www.who.int/director-general/speeches/detail/who-director-general-s-opening-remarks-at-the-media-briefing-on-covid-19---11-march-2020 (accessed on 2 March 2022).
  2. WHO. Available online: https://www.worldometers.info/coronavirus/coronavirus-cases/ (accessed on 4 March 2022).
  3. Arshad, A.; Hussain, S.; Saleem, F.; Shafeeque, M.; Khan, S.; Waqas, M. Unprecedented reduction in airborne aerosol particles and nitrogen dioxide level in response to COVID-19 pandemic lockdown over the Indo-Pak region. Geophys. Res. Lett. 2020. [Google Scholar]
  4. Fauci, A.; Lane, H.; Redfield, R. COVID-19—Navigating the uncharted. N. Engl. J. Med. 2020, 382, 1268–1269. [Google Scholar] [CrossRef] [PubMed]
  5. Haffajee, R.; Mello, M. Thinking globally, acting locally—The U.S. response to COVID-19. N. Engl. J. Med. 2020, 382, e75. [Google Scholar] [CrossRef] [PubMed]
  6. Muhammad, S.; Long, X.; Salman, M. COVID-19 pandemic and environmental pollution: A blessing in disguise? Sci. Total Environ. 2020, 728, 138820. [Google Scholar] [CrossRef]
  7. Misra, P.; Takigawa, M.; Khatri, P.; Dhaka, S.; Dimri, A.; Yamaji, K.; Kajino, M.; Takeuchi, W.; Imasu, R.; Nitta, K.; et al. Nitrogen oxides concentration and emission change detection during COVID-19 restrictions in North India. Sci. Rep. 2021, 11, 9800. [Google Scholar] [CrossRef] [PubMed]
  8. Cohen, A.; Brauer, M.; Burnett, R.; Anderson, H.; Frostad, J.; Estep, K.; Balakrishnan, K.; Brunekreef, B.; Dandona, L.; Dandona, R.; et al. Estimates and 25-year trends of the global burden of disease attributable to ambient air pollution: An analysis of data from the global burden of diseases study 2015. Lancet 2017, 389, 1907–1918. [Google Scholar] [CrossRef] [Green Version]
  9. Hao, J.; He, K.; Duan, L.; Li, J.; Wang, L. Air Pollution and Its Control in China. Front. Environ. Sci. Eng. China 2007, 1, 129–142. [Google Scholar] [CrossRef]
  10. Wang, S.; Xing, J.; Chatani, S.; Hao, J.; Klimont, Z.; Cofala, J.; Amann, M. Verification of anthropogenic emissions of China by satellite and ground observations. Atmos. Environ. 2011, 45, 6347–6358. [Google Scholar] [CrossRef]
  11. IPCC. Available online: https://archive.ipcc.ch/report/ar4/wg1/ (accessed on 2 March 2022).
  12. WHO. Available online: www.euro.who.int (accessed on 8 March 2022).
  13. Cheng, M.; Jiang, H.; Guo, Z. Evaluation of long-term tropospheric NO2 columns and the effect of different ecosystem in Yangtze river delta. Proc. Environ. Sci. 2012, 13, 1045–1056. [Google Scholar] [CrossRef] [Green Version]
  14. US EPA. Nitrogen Dioxide (NO2) Pollution. Available online: https://www.epa.gov/no2-pollution (accessed on 5 March 2022).
  15. Mor, S.; Kumar, S.; Singh, T.; Dogra, S.; Pandey, V.; Ravindra, K. Impact of COVID-19 lockdown on air quality in Chandigarh, India: Understanding the emission sources during controlled anthropogenic activities. Chemosphere 2021, 263, 127978. [Google Scholar] [CrossRef]
  16. Jain, S.; Sharma, T. Social and travel lockdown impact considering coronavirus disease (COVID-19) on air quality in megacities of India: Present benefits, future challenges and way forward. Aerosol Air Qual. Res. 2020, 20, 1222–1236. [Google Scholar] [CrossRef]
  17. Singh, V.; Singh, S.; Biswal, A.; Kesarkar, A.; Mor, S.; Ravindra, K. Diurnal and temporal changes in air pollution during COVID-19 strict lockdown over different regions of India. Environ. Pollut. 2020, 266, 115368. [Google Scholar] [CrossRef] [PubMed]
  18. NASA. Available online: https://earthobservatory.nasa.gov/images/146362/airborne-nitrogen-dioxide-plummets-over-china (accessed on 12 March 2022).
  19. Dutheil, F.; Baker, J.; Navel, V. COVID-19 as a factor influencing air pollution? Environ. Pollut. 2020, 263, 114466. [Google Scholar] [CrossRef] [PubMed]
  20. World City Populations. Available online: https://worldpopulationreview.com/world-cities (accessed on 15 March 2022).
  21. Gautam, A.; Dilwaliya, N.; Srivastava, A.; Kumar, S.; Bauddh, K.; Siingh, D.; Shah, M.; Singh, K.; Gautam, S. Temporary reduction in air pollution due to anthropogenic activity switch-off during COVID-19 lockdown in northern parts of India. Environ. Dev. Sustain. 2020, 23, 8774–8797. [Google Scholar] [CrossRef]
  22. Zhao, F.; Liu, C.; Cai, Z.; Liu, X.; Bak, J.; Kim, J.; Hu, Q.; Xia, C.; Zhang, C.; Sun, Y.; et al. Ozone profile retrievals from TROPOMI: Implication for the variation of tropospheric ozone during the outbreak of COVID-19 in China. Sci. Total Environ. 2021, 764, 142886. [Google Scholar] [CrossRef]
  23. Levelt, P.; van den Oord, G.; Dobber, M.; Malkki, A.; Visser, H.; de Vries, J.; Stammes, P.; Lundell, J.; Saari, H. The Ozone Monitoring Instrument. IEEE Trans. Geosci. Remote Sens. 2006, 44, 1093–1101. [Google Scholar] [CrossRef]
  24. Pinardi, G.; Van Roozendael, M.; Hendrick, F.; Theys, N.; Abuhassan, N.; Bais, A.; Boersma, F.; Cede, A.; Chong, J.; Donner, S.; et al. Validation of tropospheric NO2 column measurements of GOME-2A and OMI using MAX-DOAS and direct sun network observations. Atmos. Meas. Tech. 2020, 13, 6141–6174. [Google Scholar] [CrossRef]
  25. Goldberg, D.; Lu, Z.; Oda, T.; Lamsal, L.; Liu, F.; Griffin, D.; McLinden, C.; Krotkov, N.; Duncan, B.; Streets, D. Exploiting OMI NO2 satellite observations to infer fossil-fuel CO2 emissions from U.S. megacities. Sci. Total Environ. 2019, 695, 133805. [Google Scholar] [CrossRef]
  26. Zhang, X.; Lu, X.; Liu, L.; Chen, D.; Zhang, X.; Liu, X.; Zhang, Y. Dry deposition of NO2 over China inferred from OMI columnar NO2 and atmospheric chemistry transport model. Atmos. Environ. 2017, 169, 238–249. [Google Scholar] [CrossRef]
  27. bp Statistical Review of Worlds Energy. Available online: https://www.bp.com/ (accessed on 13 March 2022).
  28. Cleveland, W.; Graedel, T.; Kleiner, B.; Warner, J. Sunday and workday variations in photochemical air pollutants in New Jersey and New York. Science 1974, 186, 1037–1038. [Google Scholar] [CrossRef]
  29. Tanvir, A.; Javed, Z.; Jian, Z.; Zhang, S.; Bilal, M.; Xue, R.; Wang, S.; Bin, Z. Ground-based MAX-DOAS observations of tropospheric NO2 and HCHO during COVID-19 lockdown and spring festival over Shanghai, China. Remote Sens. 2021, 13, 488. [Google Scholar] [CrossRef]
  30. Stavrakou, T.; Müller, J.; Bauwens, M.; Boersma, K.; van Geffen, J. Satellite evidence for changes in the NO2 weekly cycle over large cities. Sci. Rep. 2020, 10, 10066. [Google Scholar] [CrossRef] [PubMed]
  31. Ialongo, I.; Herman, J.; Krotkov, N.; Lamsal, L.; Boersma, F.; Hovila, J.; Tamminen, J. Comparison of OMI NO2 observations and their seasonal and weekly cycles with ground-based measurements in Helsinki. Atmos. Meas. Tech. 2016, 9, 5203–5212. [Google Scholar] [CrossRef] [Green Version]
  32. Richter, A.; Burrows, J.; Nüß, H.; Granier, C.; Niemeier, U. Increase in tropospheric nitrogen dioxide over China observed from space. Nature 2005, 437, 129–132. [Google Scholar] [CrossRef]
  33. Uno, I.; He, Y.; Ohara, T.; Yamaji, K.; Kurokawa, J.; Katayama, M.; Wang, Z.; Noguchi, K.; Hayashida, S.; Richter, A.; et al. Systematic analysis of interannual and seasonal variations of model-simulated tropospheric NO2 in Asia and comparison with GOME-satellite data. Atmos. Chem. Phys. 2007, 7, 1671–1681. [Google Scholar] [CrossRef] [Green Version]
  34. Cichowicz, R.; Wielgosiński, G.; Fetter, W. Dispersion of atmospheric air pollution in summer and winter season. Environ. Monit. Assess. 2017, 189, 105. [Google Scholar] [CrossRef] [PubMed] [Green Version]
  35. Zhao, N.; Li, B.; Li, H.; Li, G.; Wu, R.; Hong, Q.; Mperejekumana, P.; Liu, S.; Zhou, Y.; Ahmad, R.; et al. The potential co-benefits for health, economy and climate by substituting raw coal with waste cooking oil as a winter heating fuel in rural households of Northern China. Environ. Res. 2021, 194, 110683. [Google Scholar] [CrossRef]
  36. Wang, C.; Wang, T.; Wang, P. The spatial–temporal variation of tropospheric NO2 over China during 2005 to 2018. Atmosphere 2019, 10, 444. [Google Scholar] [CrossRef] [Green Version]
  37. Cui, Y.; Lin, J.; Song, C.; Liu, M.; Yan, Y.; Xu, Y.; Huang, B. Rapid growth in nitrogen dioxide pollution over Western China, 2005–2013. Atmos. Chem. Phys. 2016, 16, 6207–6221. [Google Scholar] [CrossRef] [Green Version]
  38. Zheng, C.; Zhao, C.; Li, Y.; Wu, X.; Zhang, K.; Gao, J.; Qiao, Q.; Ren, Y.; Zhang, X.; Chai, F. Spatial and temporal distribution of NO2 and SO2 in inner Mongolia urban agglomeration obtained from satellite remote sensing and ground observations. Atmos. Environ. 2018, 188, 50–59. [Google Scholar] [CrossRef] [Green Version]
  39. ul-Haq, Z.; Tariq, S.; Ali, M. Tropospheric NO2 trends over South Asia during the last decade (2004–2014) using OMI data. Adv. Meteorol. 2015, 2015, 959284. [Google Scholar] [CrossRef] [Green Version]
  40. Hickman, J.; Andela, N.; Tsigaridis, K.; Galy-Lacaux, C.; Ossohou, M.; Bauer, S. Reductions in NO2 burden over north equatorial Africa from decline in biomass burning in spite of growing fossil fuel use, 2005 to 2017. Proc. Natl. Acad. Sci. USA 2021, 118, e20025791118. [Google Scholar] [CrossRef]
  41. Abbas, S.; Ali, G.; Qamer, F.; Irteza, S. Associations of air pollution concentrations and energy production dynamics in Pakistan during lockdown. Environ. Sci. Pollut. Res. 2022, 29, 5036–35047. [Google Scholar] [CrossRef]
Figure 1. Eleven-year mean (2010–2020) of OMI-retrieved global tropospheric NO2 column density in 1015 molecules/cm2 at the 12 locations included in this study (marked with boxes).
Atmosphere 13 00986 g001
Figure 2. Variations in weekly tropospheric NO2 in 2010–2019 and 2020, before (pink line) and during (dotted green line) COVID-19, with standard deviation (pink shading) in (a) Lahore, (b) Karachi, (c) Bahawalpur, (d) New Delhi, (e) Kolkata, (f) Mumbai, (g) Hyderabad, (h) Kanpur, (i) Beijing, (j) Wuhan, (k) Shanghai, and (l) Seoul.
Atmosphere 13 00986 g002
Figure 3. Changes in monthly NO2 emissions in 2020 (during COVID-19), compared with the average of 2010–2019 (before COVID-19), with standard deviation (pink shading) in (a) Lahore, (b) Karachi, (c) Bahawalpur, (d) New Delhi, (e) Kolkata, (f) Mumbai, (g) Hyderabad, (h) Kanpur, (i) Beijing, (j) Wuhan, (k) Shanghai, and (l) Seoul.
Atmosphere 13 00986 g003
Figure 4. Annual trends in NO2 concentrations during 2010–2020 in (a) Lahore, (b) Karachi, (c) Bahawalpur, (d) New Delhi, (e) Kolkata, (f) Mumbai, (g) Hyderabad, (h) Kanpur, (i) Beijing, (j) Wuhan, (k) Shanghai, and (l) Seoul. The red lines represent NO2 concentrations during the years, the black dotted lines represent trends in NO2 during 2010–2019, and the blue lines during 2010–2020. Error bars represent standard deviations.
Atmosphere 13 00986 g004
Table 1. Population sizes of the cities selected for the current research.
CountryCityPopulation
PakistanLahore13,542,000
Karachi16,840,000
Bahawalpur895,000
IndiaNew Delhi32,066,000
Kolkata15,134,000
Mumbai20,961,000
Hyderabad10,534,000
Kanpur3,190,000
ChinaBeijing21,333,000
Wuhan8,592,000
Shanghai28,517,000
South KoreaSeoul9,976,000
Table 2. Minimum and maximum monthly NO2 concentrations in the 12 cities and differences before and during COVID-19.
CityMin 2010–2019Min 2020Max 2010–2019Max 2020Mean 2010–2019 (A)Mean 2020 (B)Difference
(A–B)
Lahore2.61 (August)2.07 (March)6.21 (December)4.79 (January)4.203.590.61
Karachi0.85 (July)0.81 (May)2.16 (December)2.18 (December)1.411.380.03
Bahawalpur1.52 (September)1.59 (October)2.36 (December)2.31 (June)1.941.940
New Delhi1.89 (August)1.54 (August)5.39 (December)4.65 (January)3.483.170.31
Kolkata1.32 (August)1.04 (August)3.89 (December)4.56 (January)2.412.220.19
Mumbai0.35 (July)0.31 (July)2.48 (December)2.66 (December)1.451.350.10
Hyderabad0.87 (July)0.84 (July)2.76 (May)2.60 (May)1.771.650.12
Kanpur1.39 (August)1.22 (August)2.93 (May)2.70 (November)2.252.100.15
Beijing5.49 (July)3.90 (August)27.71 (November)23.57 (December)15.1310.834.30
Wuhan2.92 (July)2.25 (July)15.83 (December)12.61 (December)7.225.641.57
Shanghai6.50 (July)5.52 (July)29.04 (December)24.42 (December)16.2513.103.15
Seoul3.05 (July)2.03 (August)15.80 (January)13.49 (December)8.976.952.02
Table 3. Percentage NO2 increase or decrease per year from 2010 to 2019, and from 2010 to 2020, as well as the differences for the 12 locations.
CityYearly Trend (2010–2019)Yearly Trend (2010–2020)Difference
Lahore−0.24%−0.85%−0.61%
Karachi1.39%0.94%−0.45%
Bahawalpur0.78%0.60%−0.18%
New Delhi0.04%−0.38%−0.42%
Kolkata0.62%0.11%−0.51%
Mumbai1.26%0.63%−0.63%
Hyderabad2.14%1.31%−0.83%
Kanpur0.78%0.28%−0.50%
Beijing−5.07%−5.23%−0.16%
Wuhan−3.51%−3.70%−0.19%
Shanghai−3.71%−3.73%−0.02%
Seoul−1.30%−2.04%−0.74%
Table 4. Percentage consumption of oil, coal, and natural gas each year during 2009–2019 and in 2020, as well as the difference.
CountryOilCoalNatural
Gas
2009–20192020Difference2009–20192020Difference2009–20192020Difference
Pakistan0.2%−2.5%−2.7%10.5%11.0%0.5%2.5%−7.5%−10.0%
India4.5%−9.9%−14.4%4.7%−6.0%−10.7%1.9%0.3%−1.6%
China5.3%1.7%−3.6%1.5%0.3%−1.2%13.1%6.9%−6.2%
South Korea1.7%−5.3%−7.0%1.8%–12.2%−14.0%4.7%0.8%−3.9%
Publisher’s Note: MDPI stays neutral with regard to jurisdictional claims in published maps and institutional affiliations.

