1. Introduction
Air pollution is a major global environmental problem of concern impacting all age groups and social strata. However, people with low socioeconomic status in urban areas and those living in developing countries are reported to be the most severely affected [
1,
2]. Most air pollution problems are driven by human-initiated activities and arise from incomplete fuel combustion from sources such as furnaces, mobile sources, and industrial emissions [
1]. The apportionment among these sources is continually changing due to factors such as increasing control of mobile source emissions and fuel switching. Atmospheric pollutants impact human health and the environment, especially in urban areas and emerging economies with substantial industrial activities [
3]. Pollutants also cause significant morbidity and mortality, particularly in vulnerable individuals such as the immunocompromised [
4]. Despite increasingly strict regulations put in place by regulatory agencies, air pollution is still a significant environmental problem in urban centers across the globe.
The toxicity of particulate matter (PM) is dependent on particle size, as this affects the probability of where a particle will be deposited in the upper, thoracic, and lower airways. PM is composed of both inorganic and organic compounds, e.g., trace metals, elemental carbon (EC), organic carbon (OC), polycyclic aromatic hydrocarbons (PAHs) and minerals. PM size fractions include coarse (PM
10), fine (PM
2.5), sub-micron (PM
1), and ultrafine particles (UFP). A recent World Health Organization (WHO) report [
5] has defined UFP as particulates greater than 10 nm in size. Low particulate matter number concentration (PNC) can be considered <1000 particles/cm
3 (24 hour mean). High PNC can be considered >10,000 particles/cm
3 (24 hour mean) or 20,000 particles/cm
3 (1-hour mean) [
6]. Cities with emission sources and urbanization often suffer poor air quality, resulting in adverse health effects [
7,
8]. PM
2.5 and PM
1 are particularly toxic to human health because of their ability to reach the deep lungs as well as affect the cardiovascular system [
9] by generation of oxidative stress, reactive oxygen species, and inflammation of the airways [
10]. Trace metals and PAHs contained in PM composition are carcinogenic and may also have neurological effects [
11].
Black carbon (BC), a toxic component of PM from incomplete fuel combustion, is also an important carbonaceous material of concern in air pollution research. BC emissions come primarily from anthropogenic sources such as heavy diesel trucks, and off-and on-road vehicles including major roadway vehicles [
7,
12]. Investigations have found high traffic-related exposure in commuters, especially people living near highways, and a relationship between BC and reduced lung function [
8]. Another pollutant of health and environmental concern is ozone (O
3), which is a secondary gaseous pollutant formed from the photochemical reaction of oxides of nitrogen (NOx) and volatile organic chemicals (VOCs) in the presence of sunlight. O
3 has been reported to be linked to inflammation of the airway, decreased lung function, and exacerbation of asthma in both children and adults [
7].
Numerous epidemiological studies have demonstrated that exposure to PM has adverse health effects on the cardiovascular and respiratory systems, and can lead to premature death [
13,
14,
15,
16,
17]. In one study of ten European cities, road traffic emissions (which consist of both PM and gases) were associated with 14% of the cases of incident childhood asthma and 15% of cases of childhood asthma aggravation [
7]. Studies examining the contribution of traffic emissions to air pollution found UFP to be a better indicator of significant adverse health impacts than PM
2.5 and PM
10 [
8]. The WHO stated in 2019 that air pollution is the principal environmental risk to human health with about 7 million premature air pollution-related deaths annually [
9]. Global burden of disease indicates that PM
2.5 is often the main cause of air pollution-related illnesses and deaths worldwide [
3]. The American Lung Association estimated almost 134 million United States residents are at risk of premature death and diseases arising from air pollution exposure [
9].
Urban areas are primarily affected by air pollution due to activities involving the release of air pollutants such as BC and PM into the environment. The main factors influencing urban air pollution are vehicular traffic, industrialization, urbanization, and economic growth [
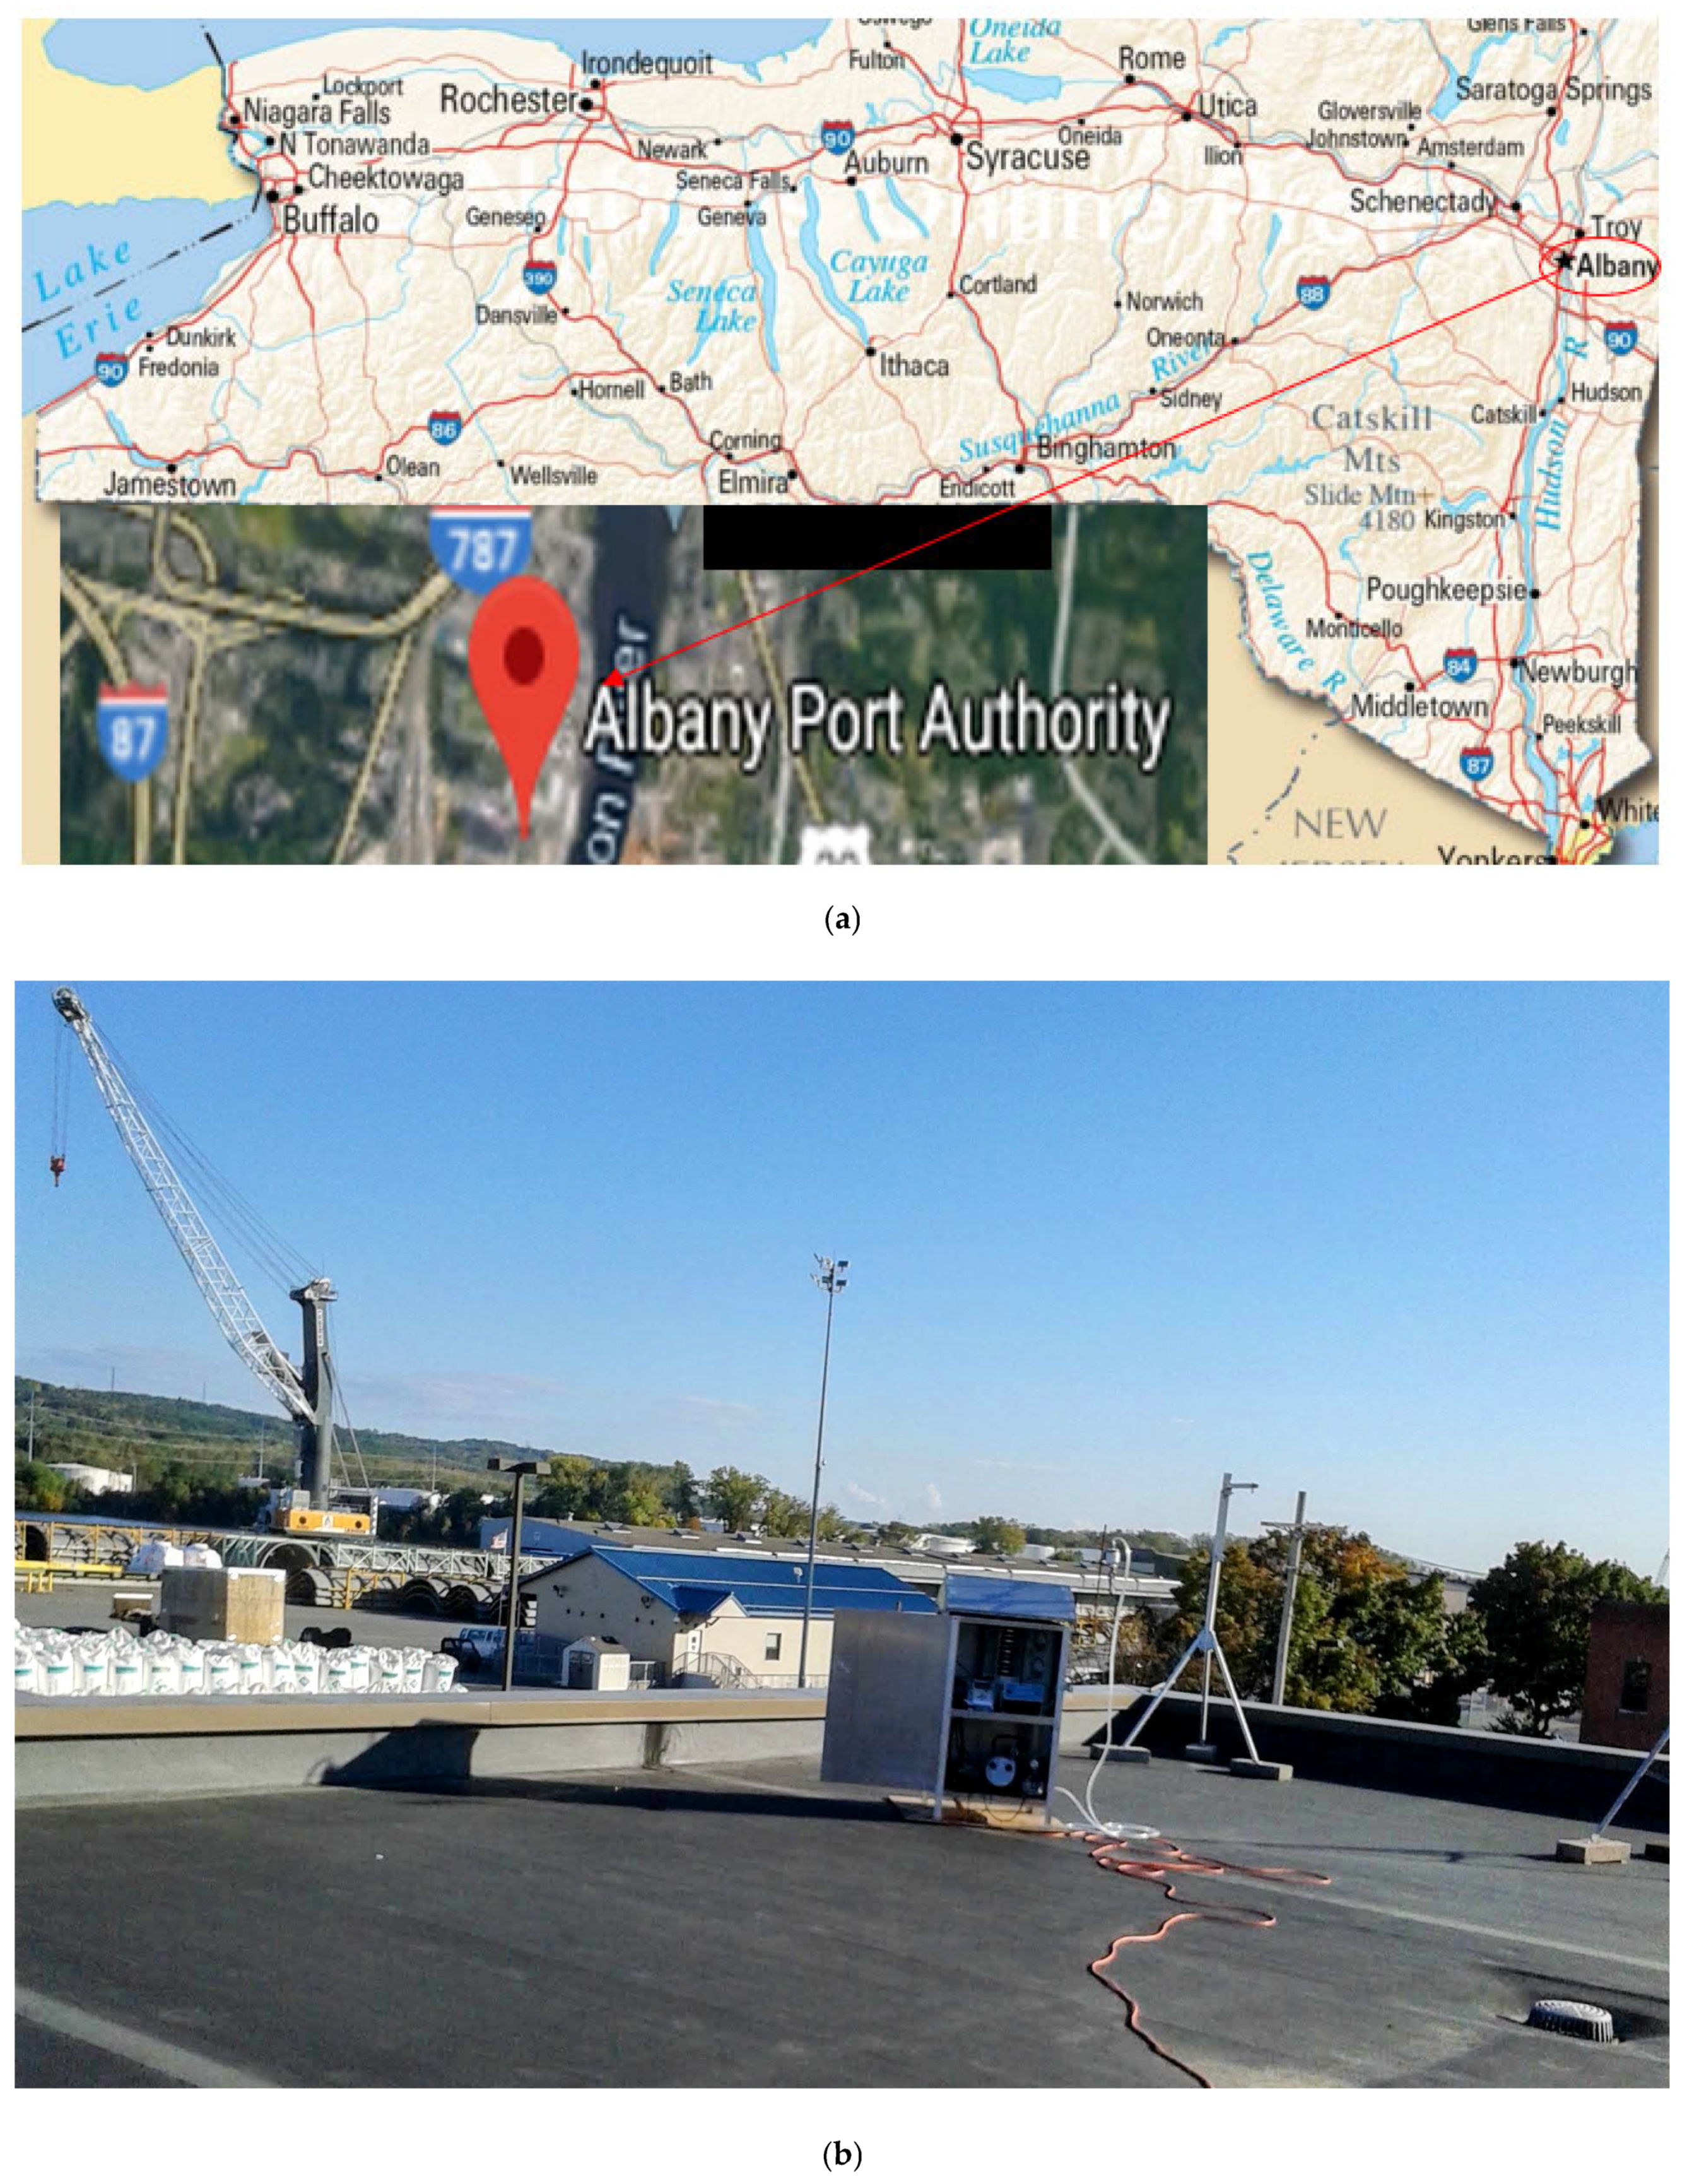
18]. The city of Albany, New York is the capitol of New York State and home to the Port of Albany, with multiple potential emission sources including wastewater treatment plants, industrial activities, and vehicular emissions. The Port of Albany (
Figure 1a,b) houses several petroleum depots and crude oil storage facilities, a grain storage facility, asphalt production, cement industry, and a major transportation center surrounded by two highways. There are also metal processing facilities and other off-road diesel emission sources such as marine vessels, construction equipment, and large cranes.
Many air pollution studies have measured the levels and estimated the negative impacts of air pollutants using data from monitoring stations as proxies for both personal and area exposures, which can result in overestimation or underestimation of the environmental effects of air pollution on an individual basis. The levels, transport, and composition of size-segregated PM have not previously been examined at or around the Port of Albany. Therefore, the objective of this study was to evaluate the environmental pollution from stationary and mobile sources using real-time sampling techniques to characterize the size-segregated PM, BC, and O3 at the Port of Albany. This preliminary study is the first real-time air pollution investigation using a combination of multiple size-segregated direct-reading air monitoring equipment types at the Port of Albany.
2. Materials and Method
Sampling of daily air pollution was performed for three weeks during the weather transition from fall to winter. The air monitoring instruments were positioned on the roof of the New York State Department of Environmental Conservation (NYSDEC) building located at the Port of Albany and surrounded by the facilities shown in
Figure 1a,b. The sampling equipment was set-up in a metal housing built to protect it from precipitation and heat. Sampling was performed with three different particle real-time monitoring devices to measure the particle concentration and size: The first, the Optical Particle Sizer (OPS, model 3330, TSI Inc. Shoreview, MN) measures from 0.3 to 10 µm of PM via 120
0 light collection. The second, MicroAeth (Model AE51, AethLabs, San Francisco, CA) is a real-time instrument that employs the aethalometer optical absorption technique for the determination of mass BC concentration. The third, the AEROCET 531 (Met One Instruments, Inc., Grants Pass, OR) is a handheld mass or particle counter and measures particle size fractions of PM
1, PM
2.5, PM
7, PM
10, and total suspended particles (TSP) via optical measurement. The mass concentrations reported by these instruments and in this study are calculated from optical measurements rather than from direct gravimetric measurements and therefore represent approximations based on assumptions such as particle density. The size-segregated PM measurement by the OPS was carried out on 8-hr cycles, while PM
1, PM
2.5, PM
7, PM
10, TSP, O
3 and BC were measured during 24-hr cycles. An ozone monitor (Model 202, 2B Technologies, Boulder, CO) was also used to measure the atmospheric O
3. Meteorological data was collected from instruments collocated with the air monitoring station.
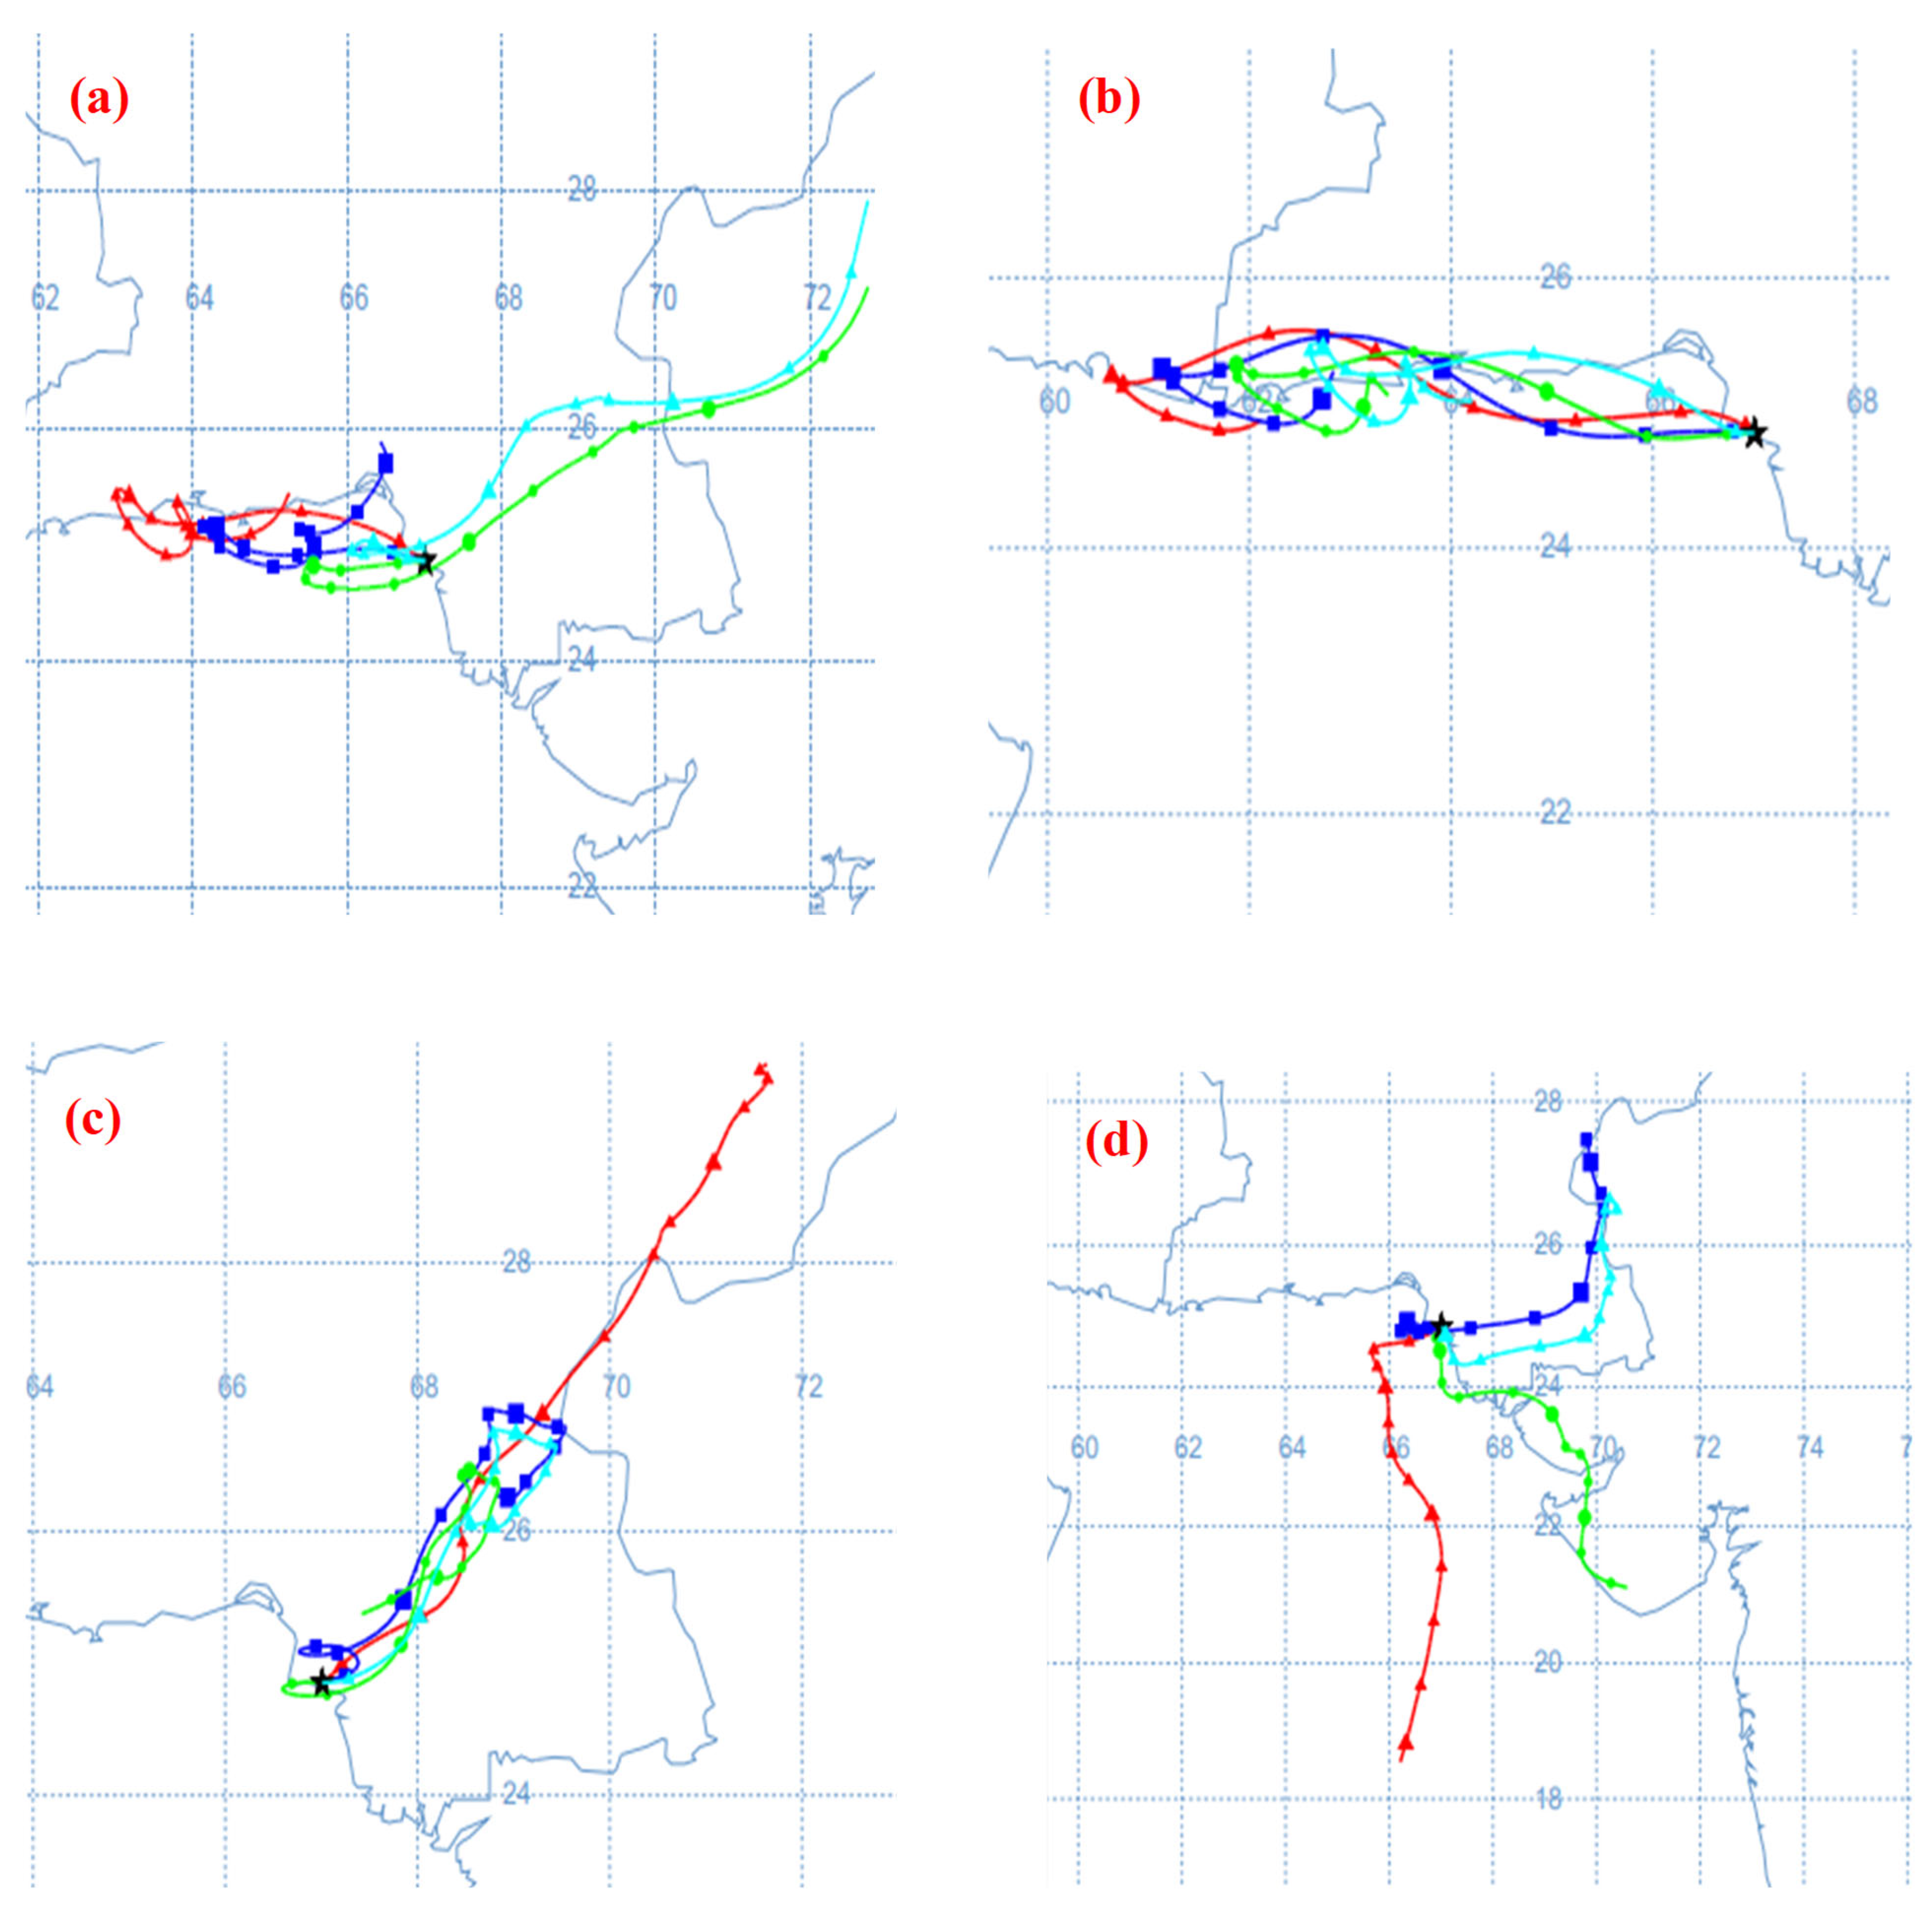
The Hybrid Single-Particle Lagrangian Integrated Trajectory (HYSPLIT) model by the National Oceanic and Atmospheric Administration was used to examine the influence of particle transport over a long-distance for 72-hr prior to the sampling date.
3. Results and Discussion
Table 1 summarizes the statistics of daily estimated mass concentrations of the air pollutants during the study period at the Port of Albany. A wide variation was observed between the lowest and the highest estimated mass concentrations for all sizes from PM
1 to TSP. The maximum concentrations for PM
1 (63.0 µg/m
3), PM
2.5 (271 µg/m
3), PM
7 (335 µg/m
3), PM
10 (344 µg/m
3), and TSP (358 µg/m
3) were all recorded on 15 November 2018 between the hours of 15:00 and 18:00.
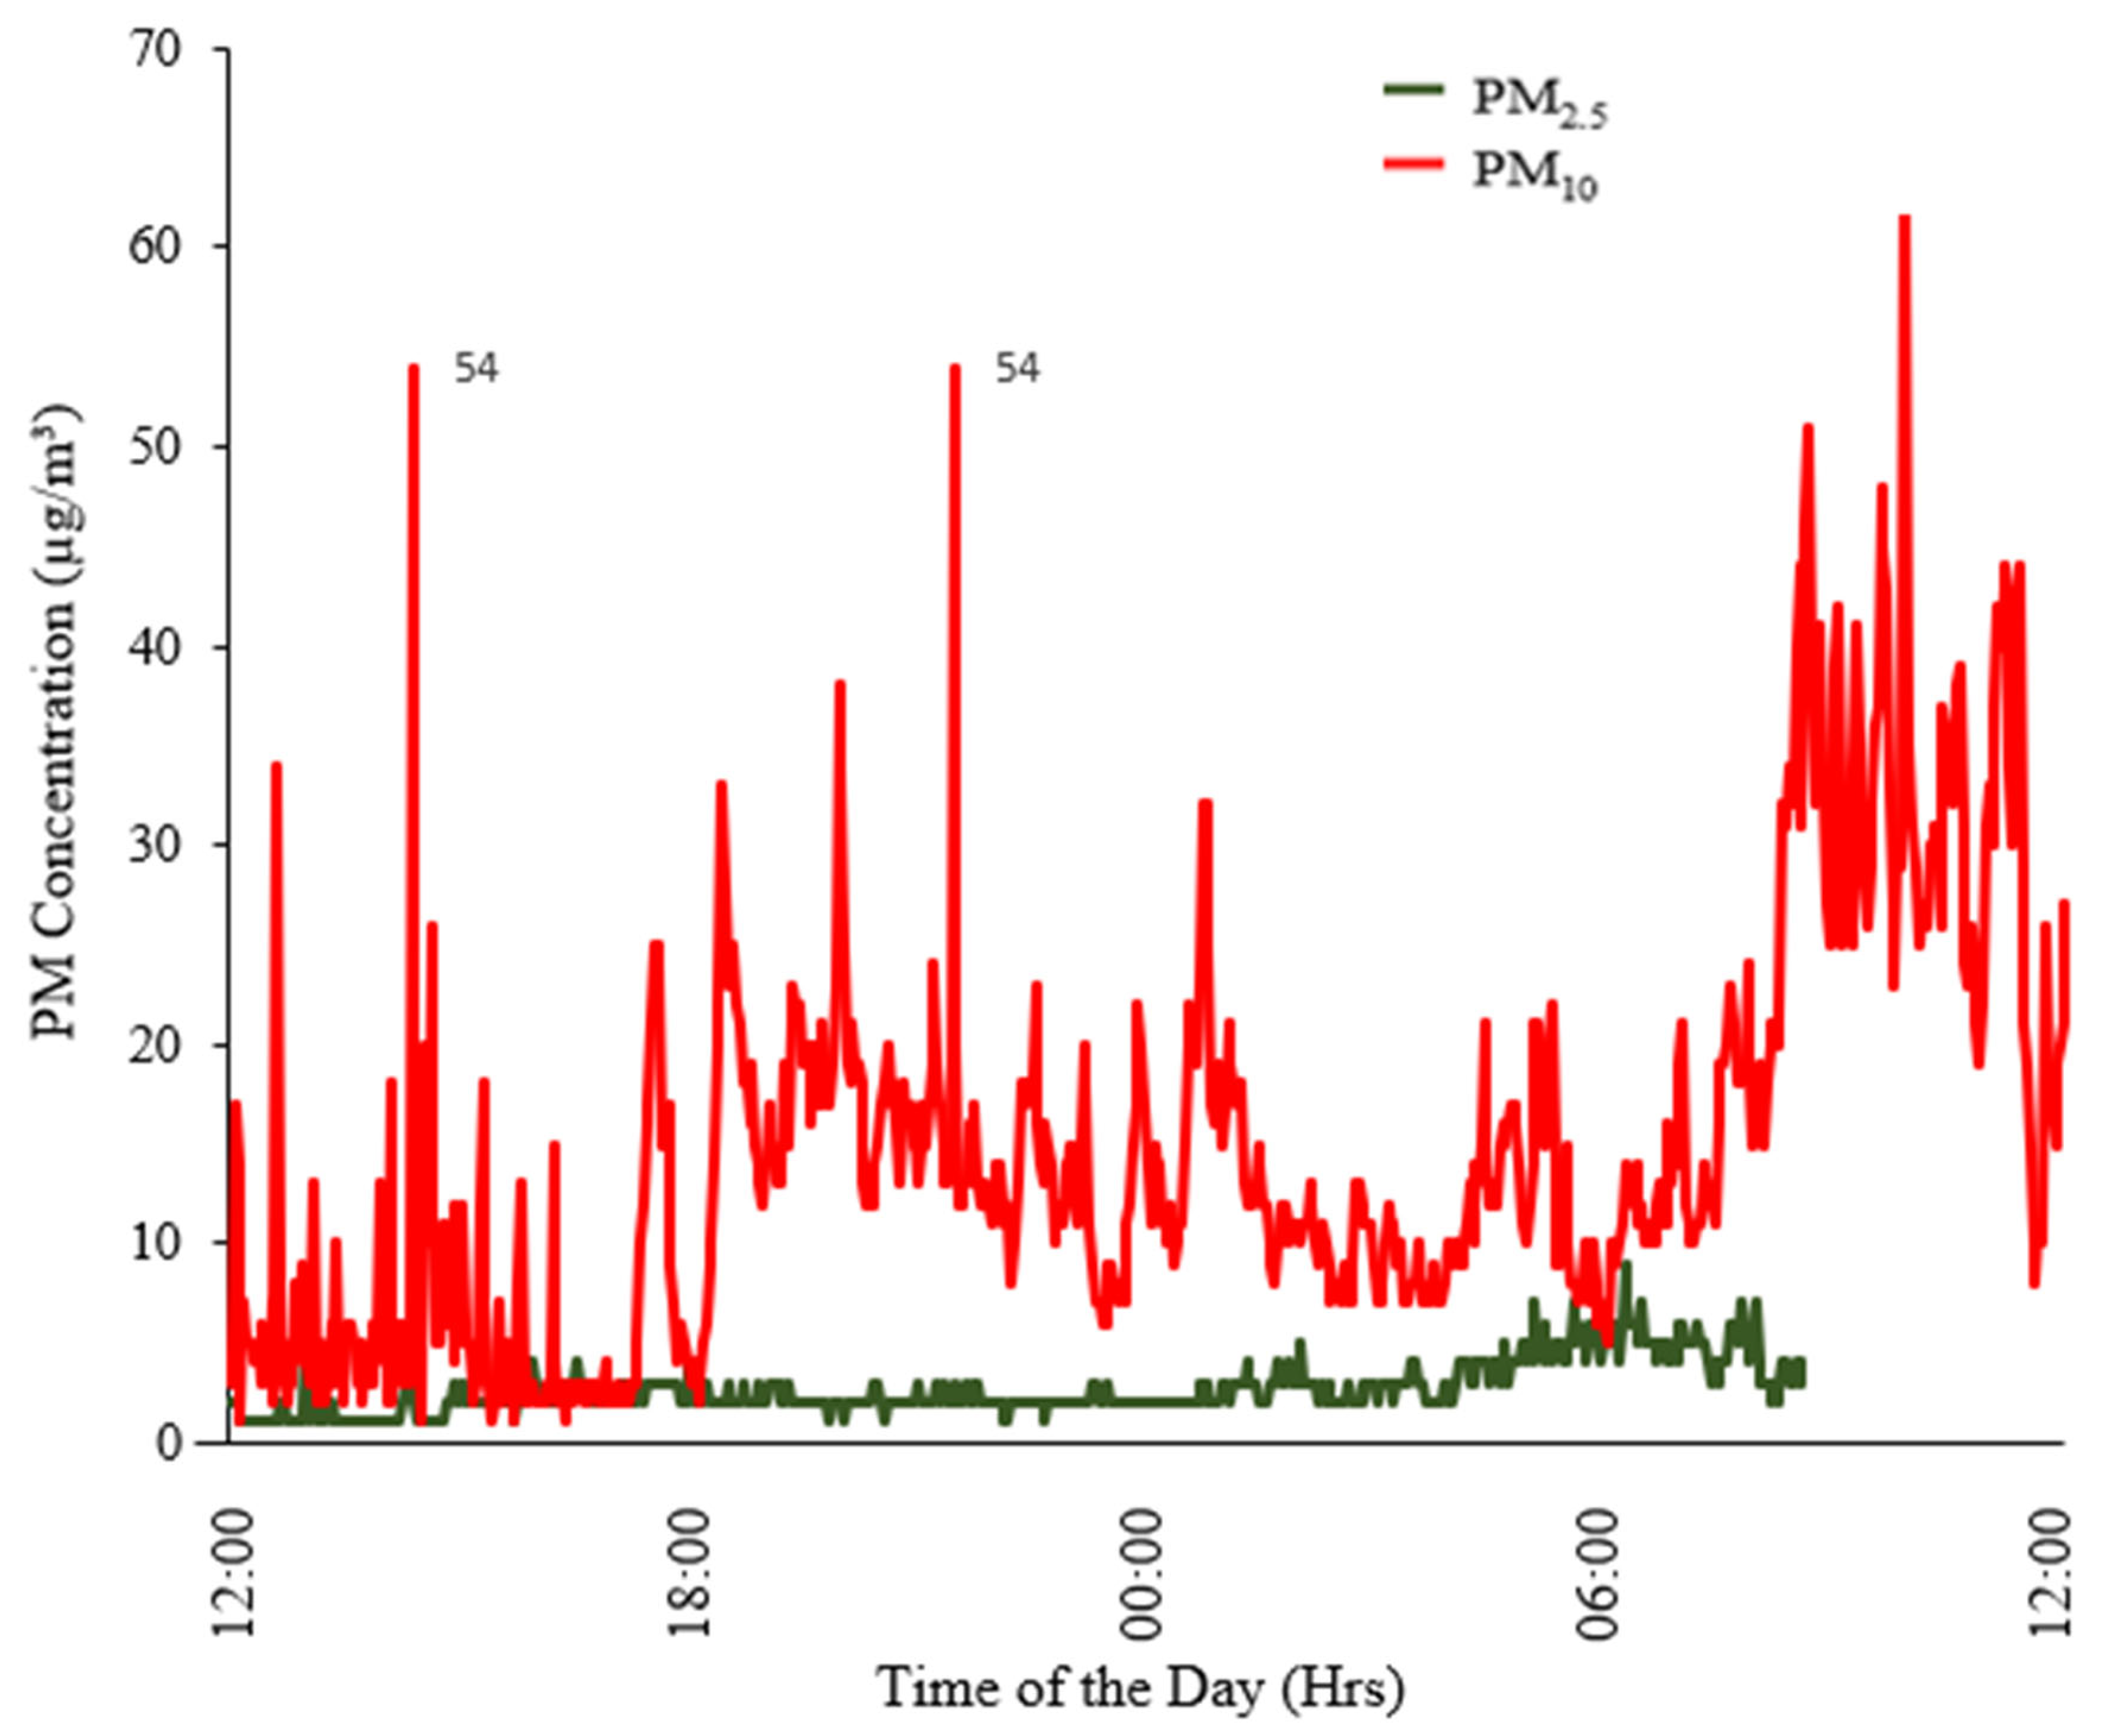
Figure 2 illustrates the variation and concentration of PM
10 and PM
2.5 for a 24-hr period from 8-9 November 2018. As would be expected, estimated PM
10 mass concentrations were observed to be higher than estimated PM
2.5. The 24-hour average PM
10 and PM
2.5 concentrations did not exceed the level of the United States Environmental Protection Agency (USEPA) daily standards [PM
2.5 = 35 μg/m
3 and PM
10 = 150 μg/m
3]. However, daily, transient, short duration, sharp peaks above the levels for daily average concentrations for PM
2.5 and PM
10 were frequently observed. The diurnal variation indicates that PM
10 particle concentrations were higher during morning and evening rush hours with maximum levels of 65 μg/m
3 and 54 μg/m
3 in the morning and evening, respectively.
Figure 2 also shows that the estimated PM
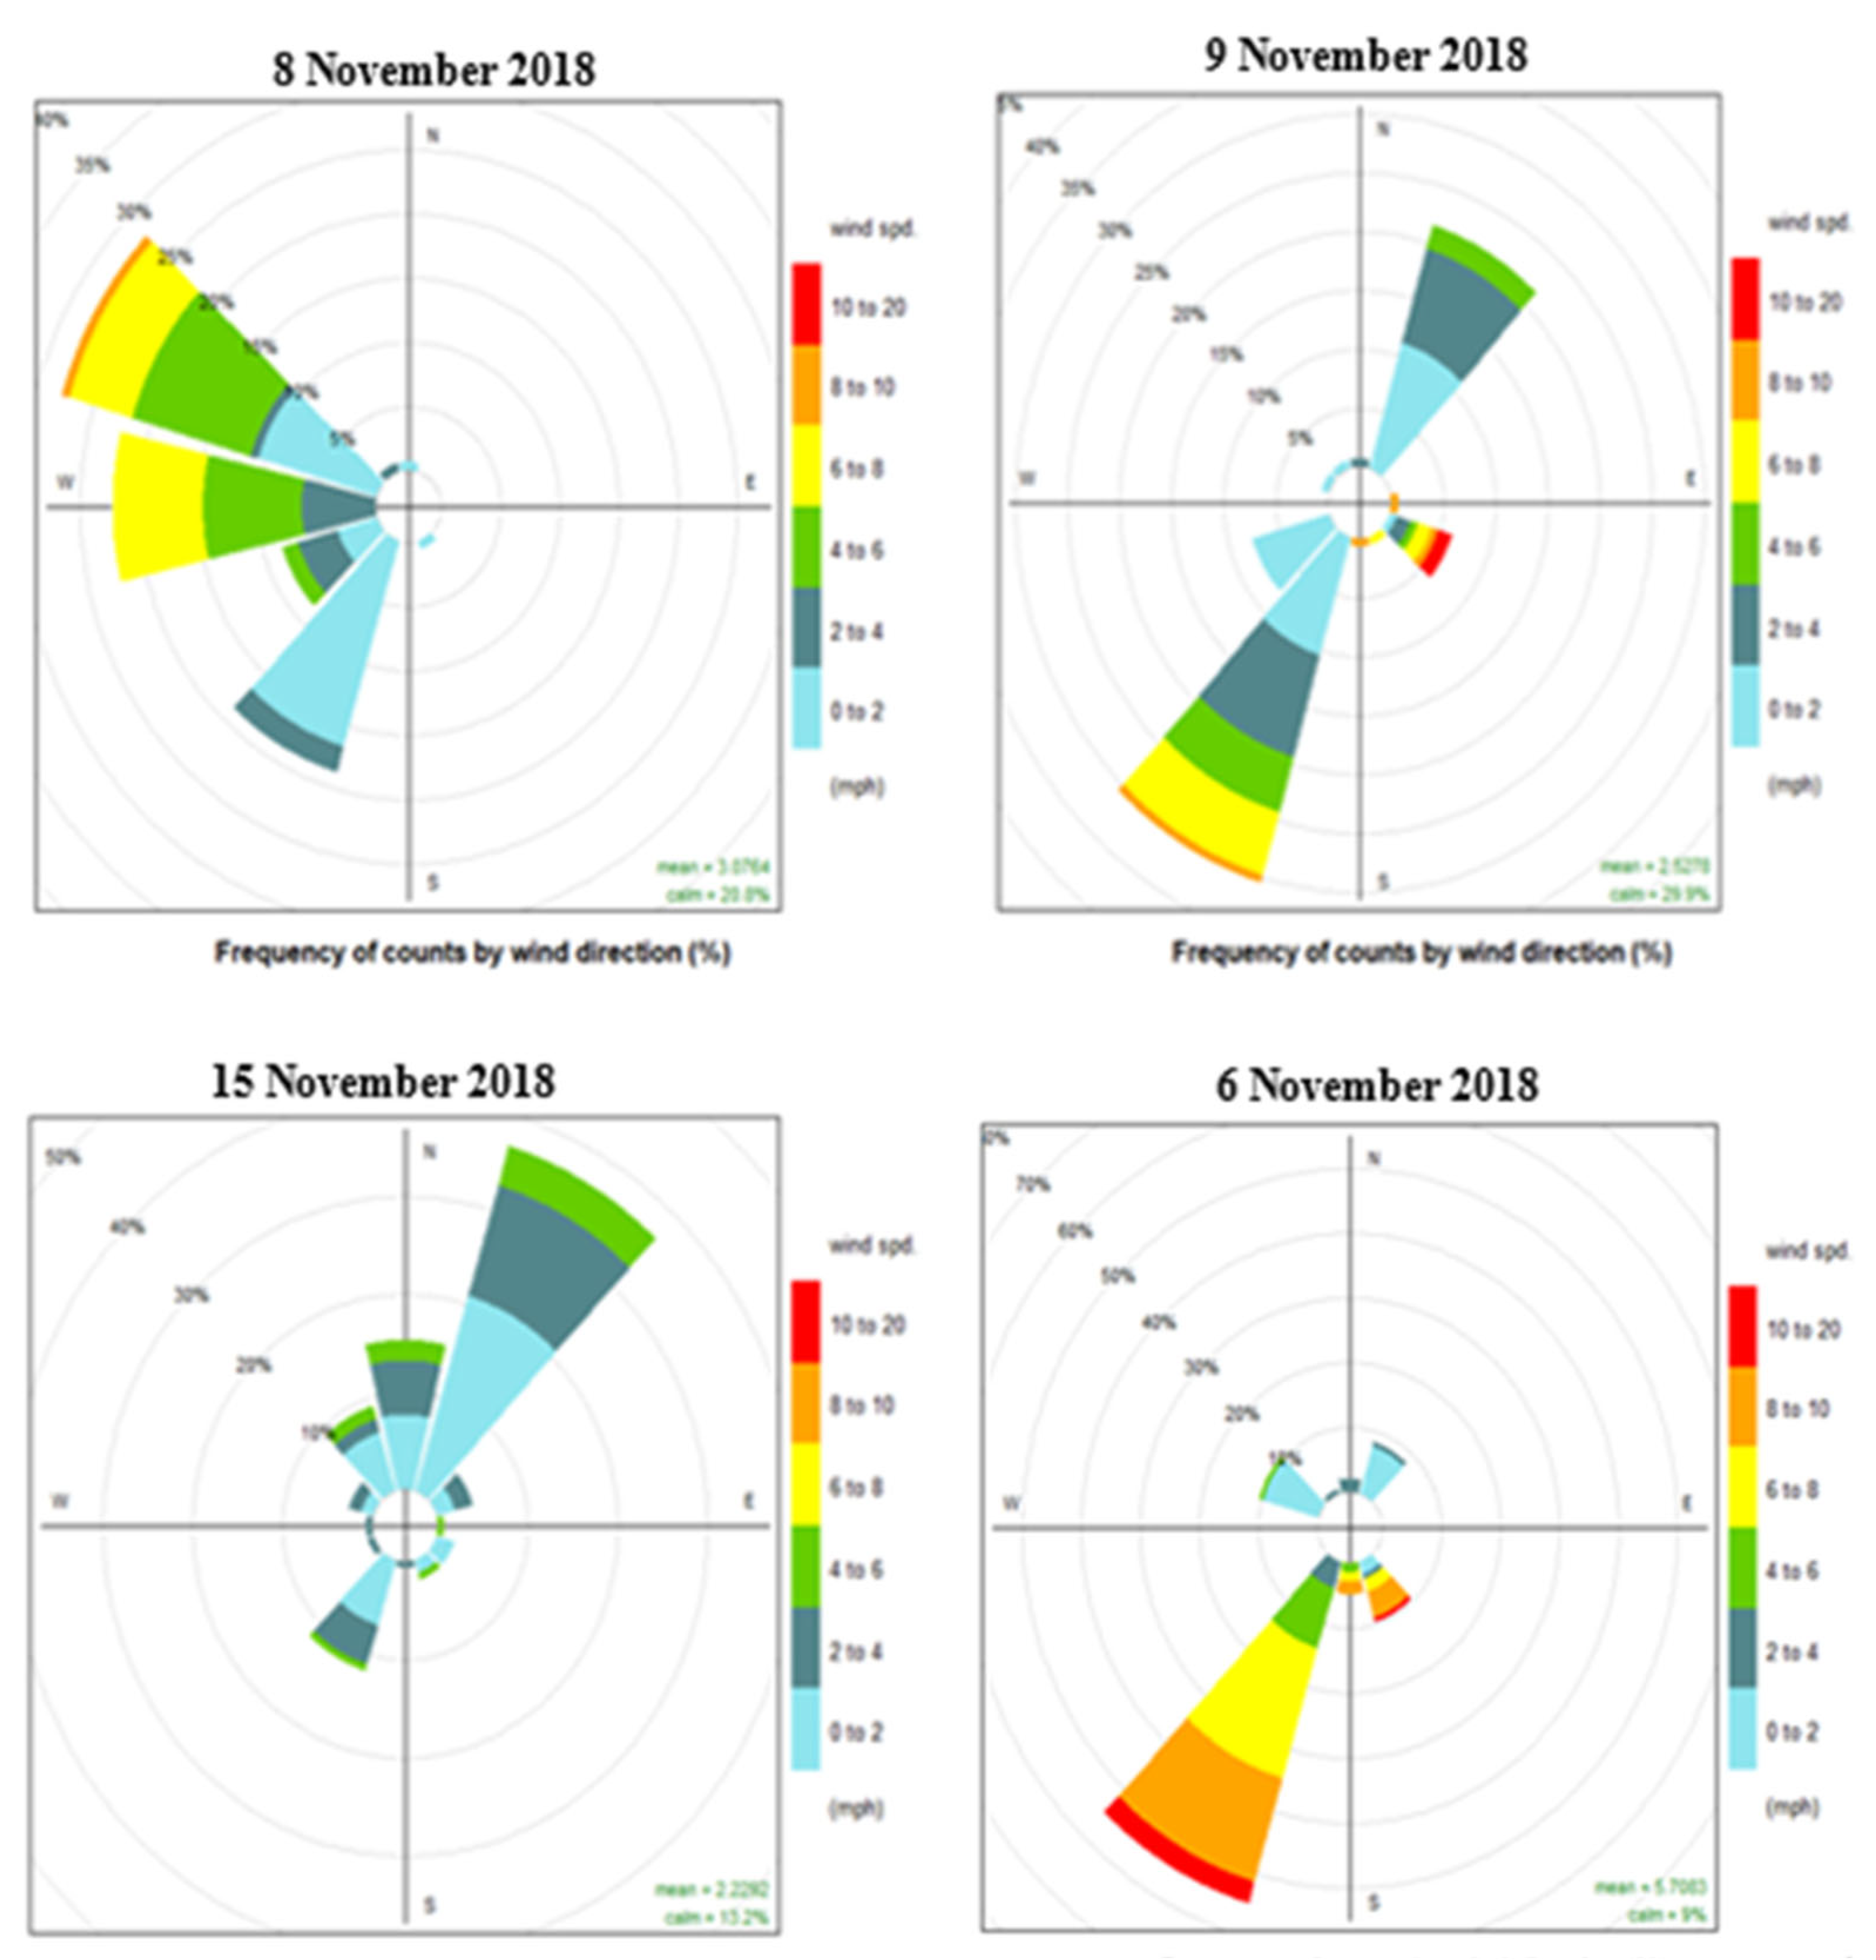
10 mass concentrations were higher during the day than at night, which may be due to human activity, wet deposition, or mixing layer height. The wind rose for the day with maximum total estimated mass concentration for all particle sizes measured (15 November 2018) indicates that the wind speeds were lower, ranging between 0-6 mph (
Figure 3), which was consistent with the 72-hr backward in-time trajectory (
Figure 4). The 72-hr backward-in-time trajectory and low wind speed shows the effect of localized emissions at the Port of Albany. This is indicative of local area emissions or near source emissions with minimal contribution from long-range particle transport, due to low dispersion attributed to stagnant air.
The average daily size-segregated particle number concentrations are given in
Table 2. Large variations in number concentration were observed for particles in the smallest 11 of the 17 size bins, i.e., from 0.3 µm to 2.685 µm. The smallest particle sizes between 0.3 µm and 0.579 µm exhibited the greatest variability.
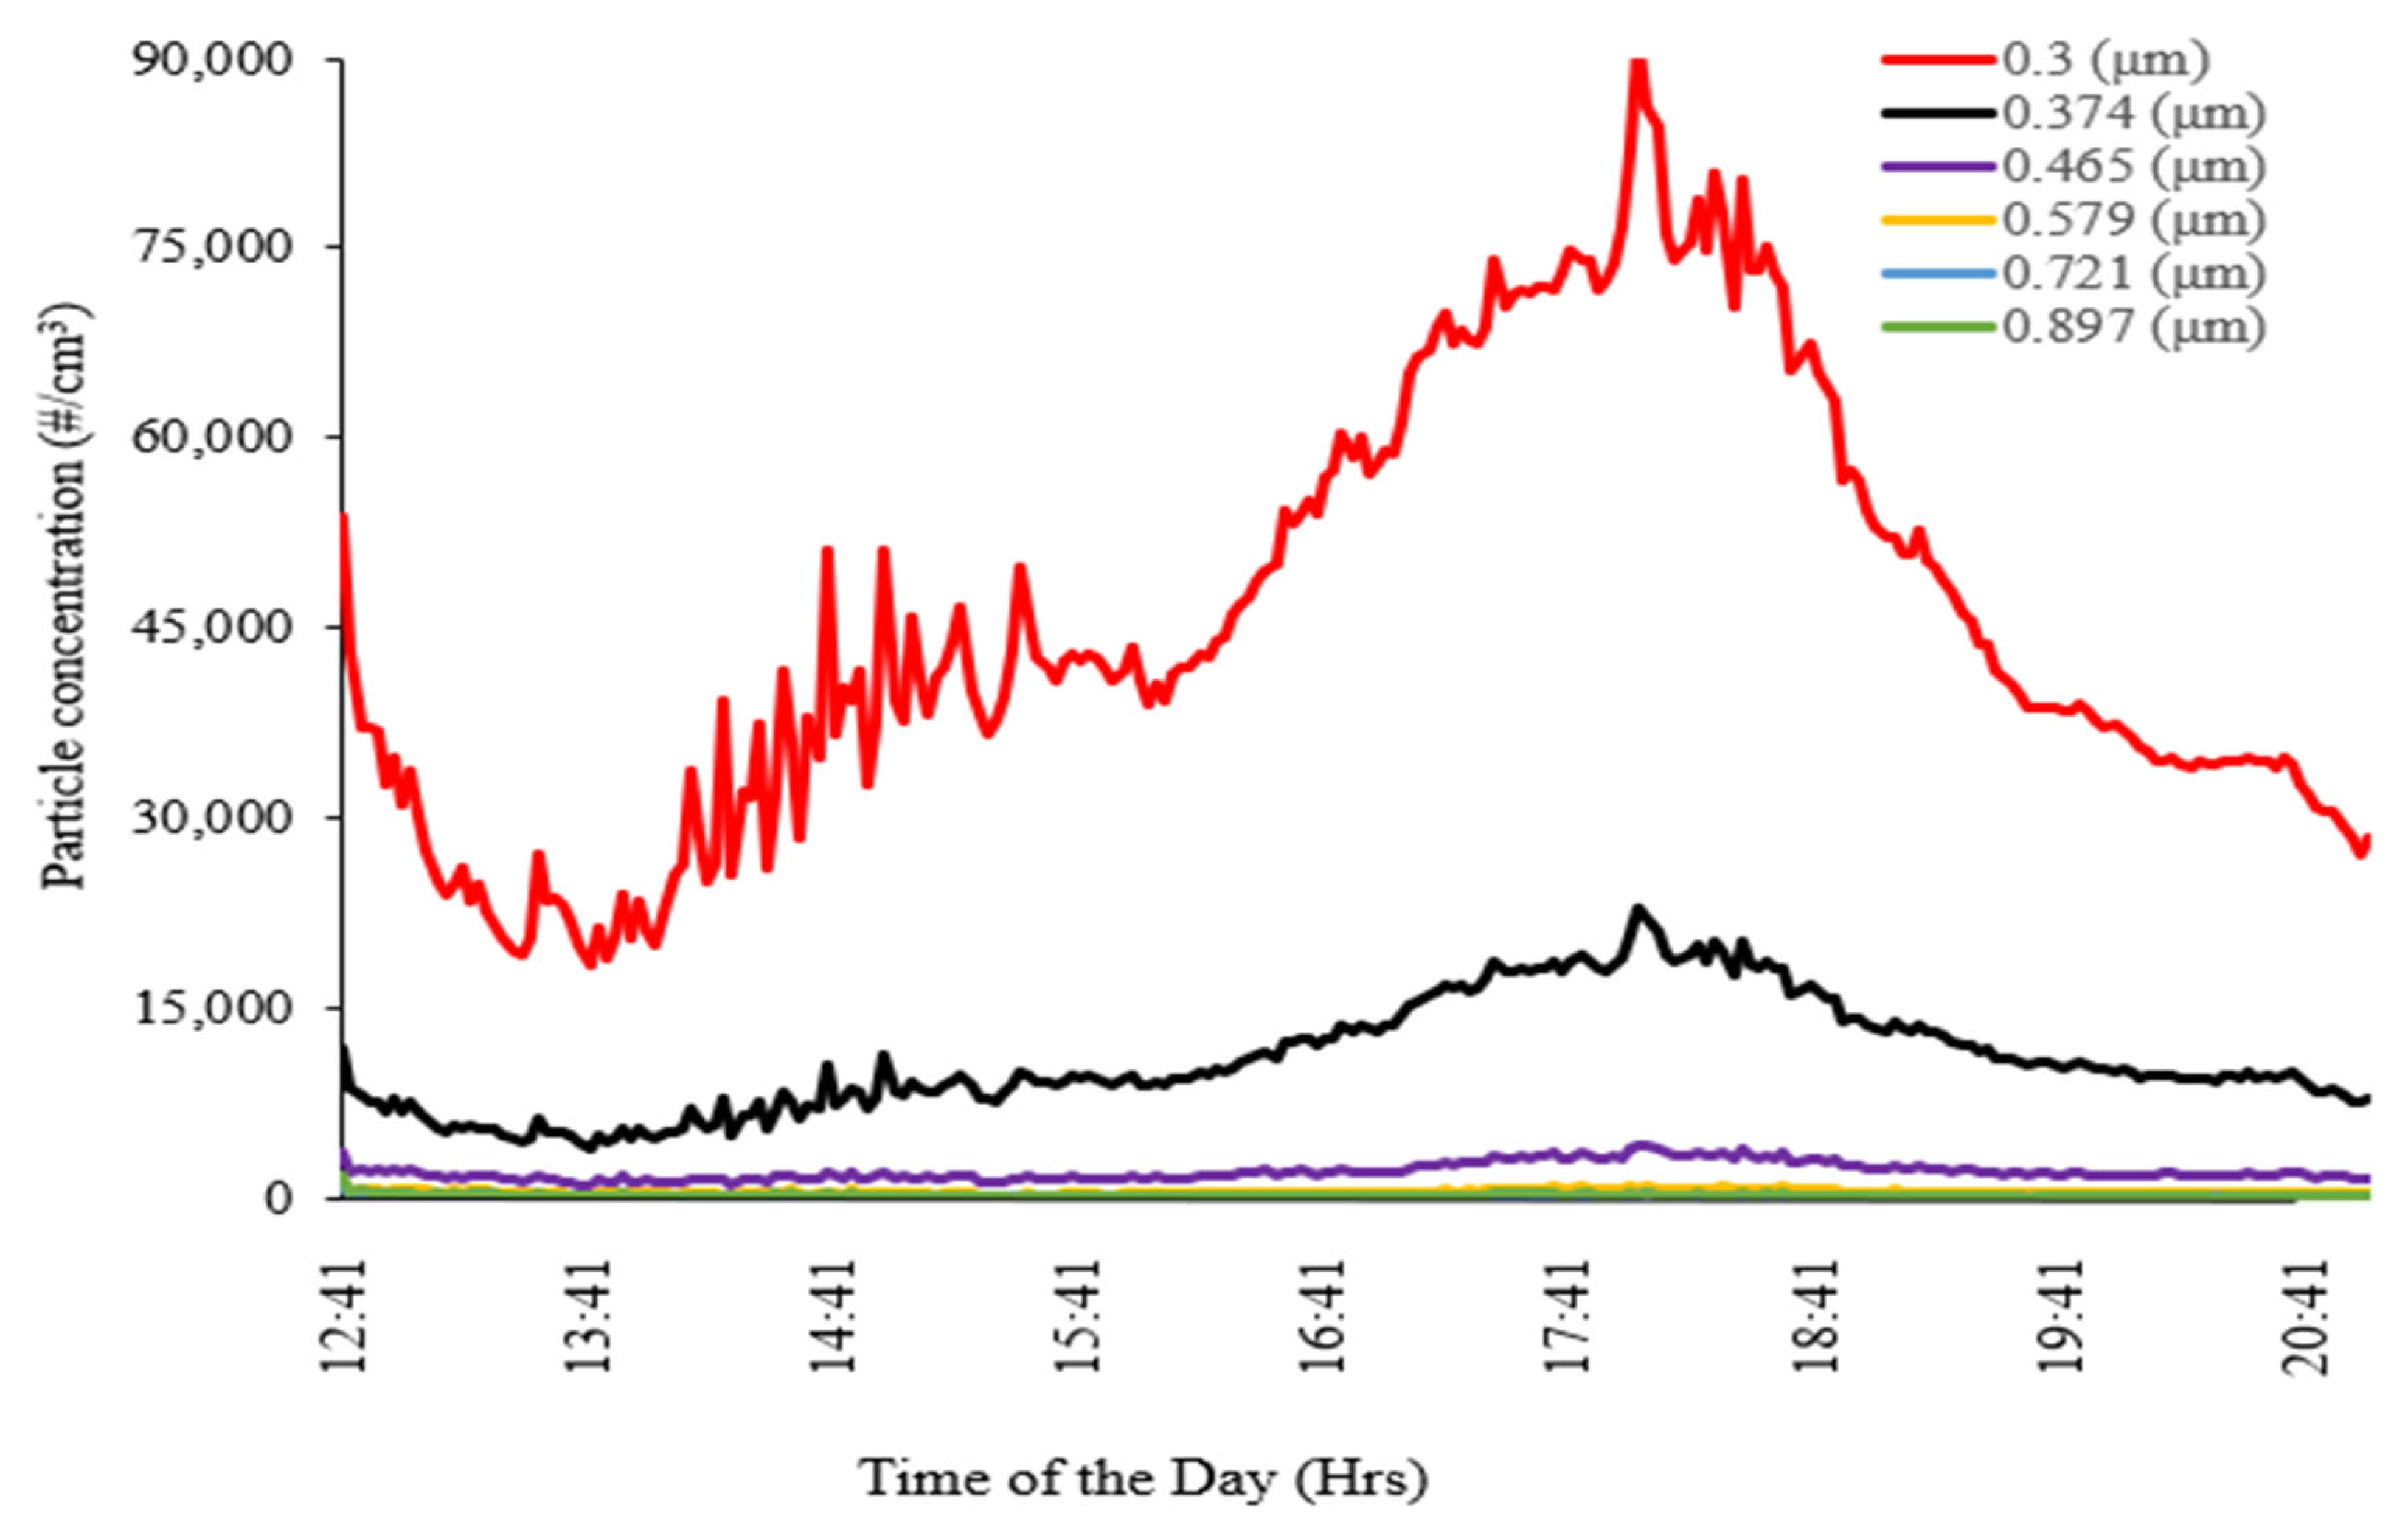
Figure 5 and
Figure 6 show higher particle number concentrations in the smallest particle sizes measured at the Port of Albany during the study period. Among the size-segregated particles, 0.3 µm particles exhibited the highest 8-hr particle number concentration of about 91,471 #/cm
3. This occurred during the evening rush hours but dropped significantly at night (
Figure 5). The concentration peaks for both 0.374 µm and 0.465 µm follow the same daily pattern observed for 0.3 µm during the evening period at 22,194 #/cm
3 and 3892 #/cm
3, respectively. Higher particle number concentrations were observed in the smaller particle fractions (0.3 to 0.897 µm) as given in
Table 2.
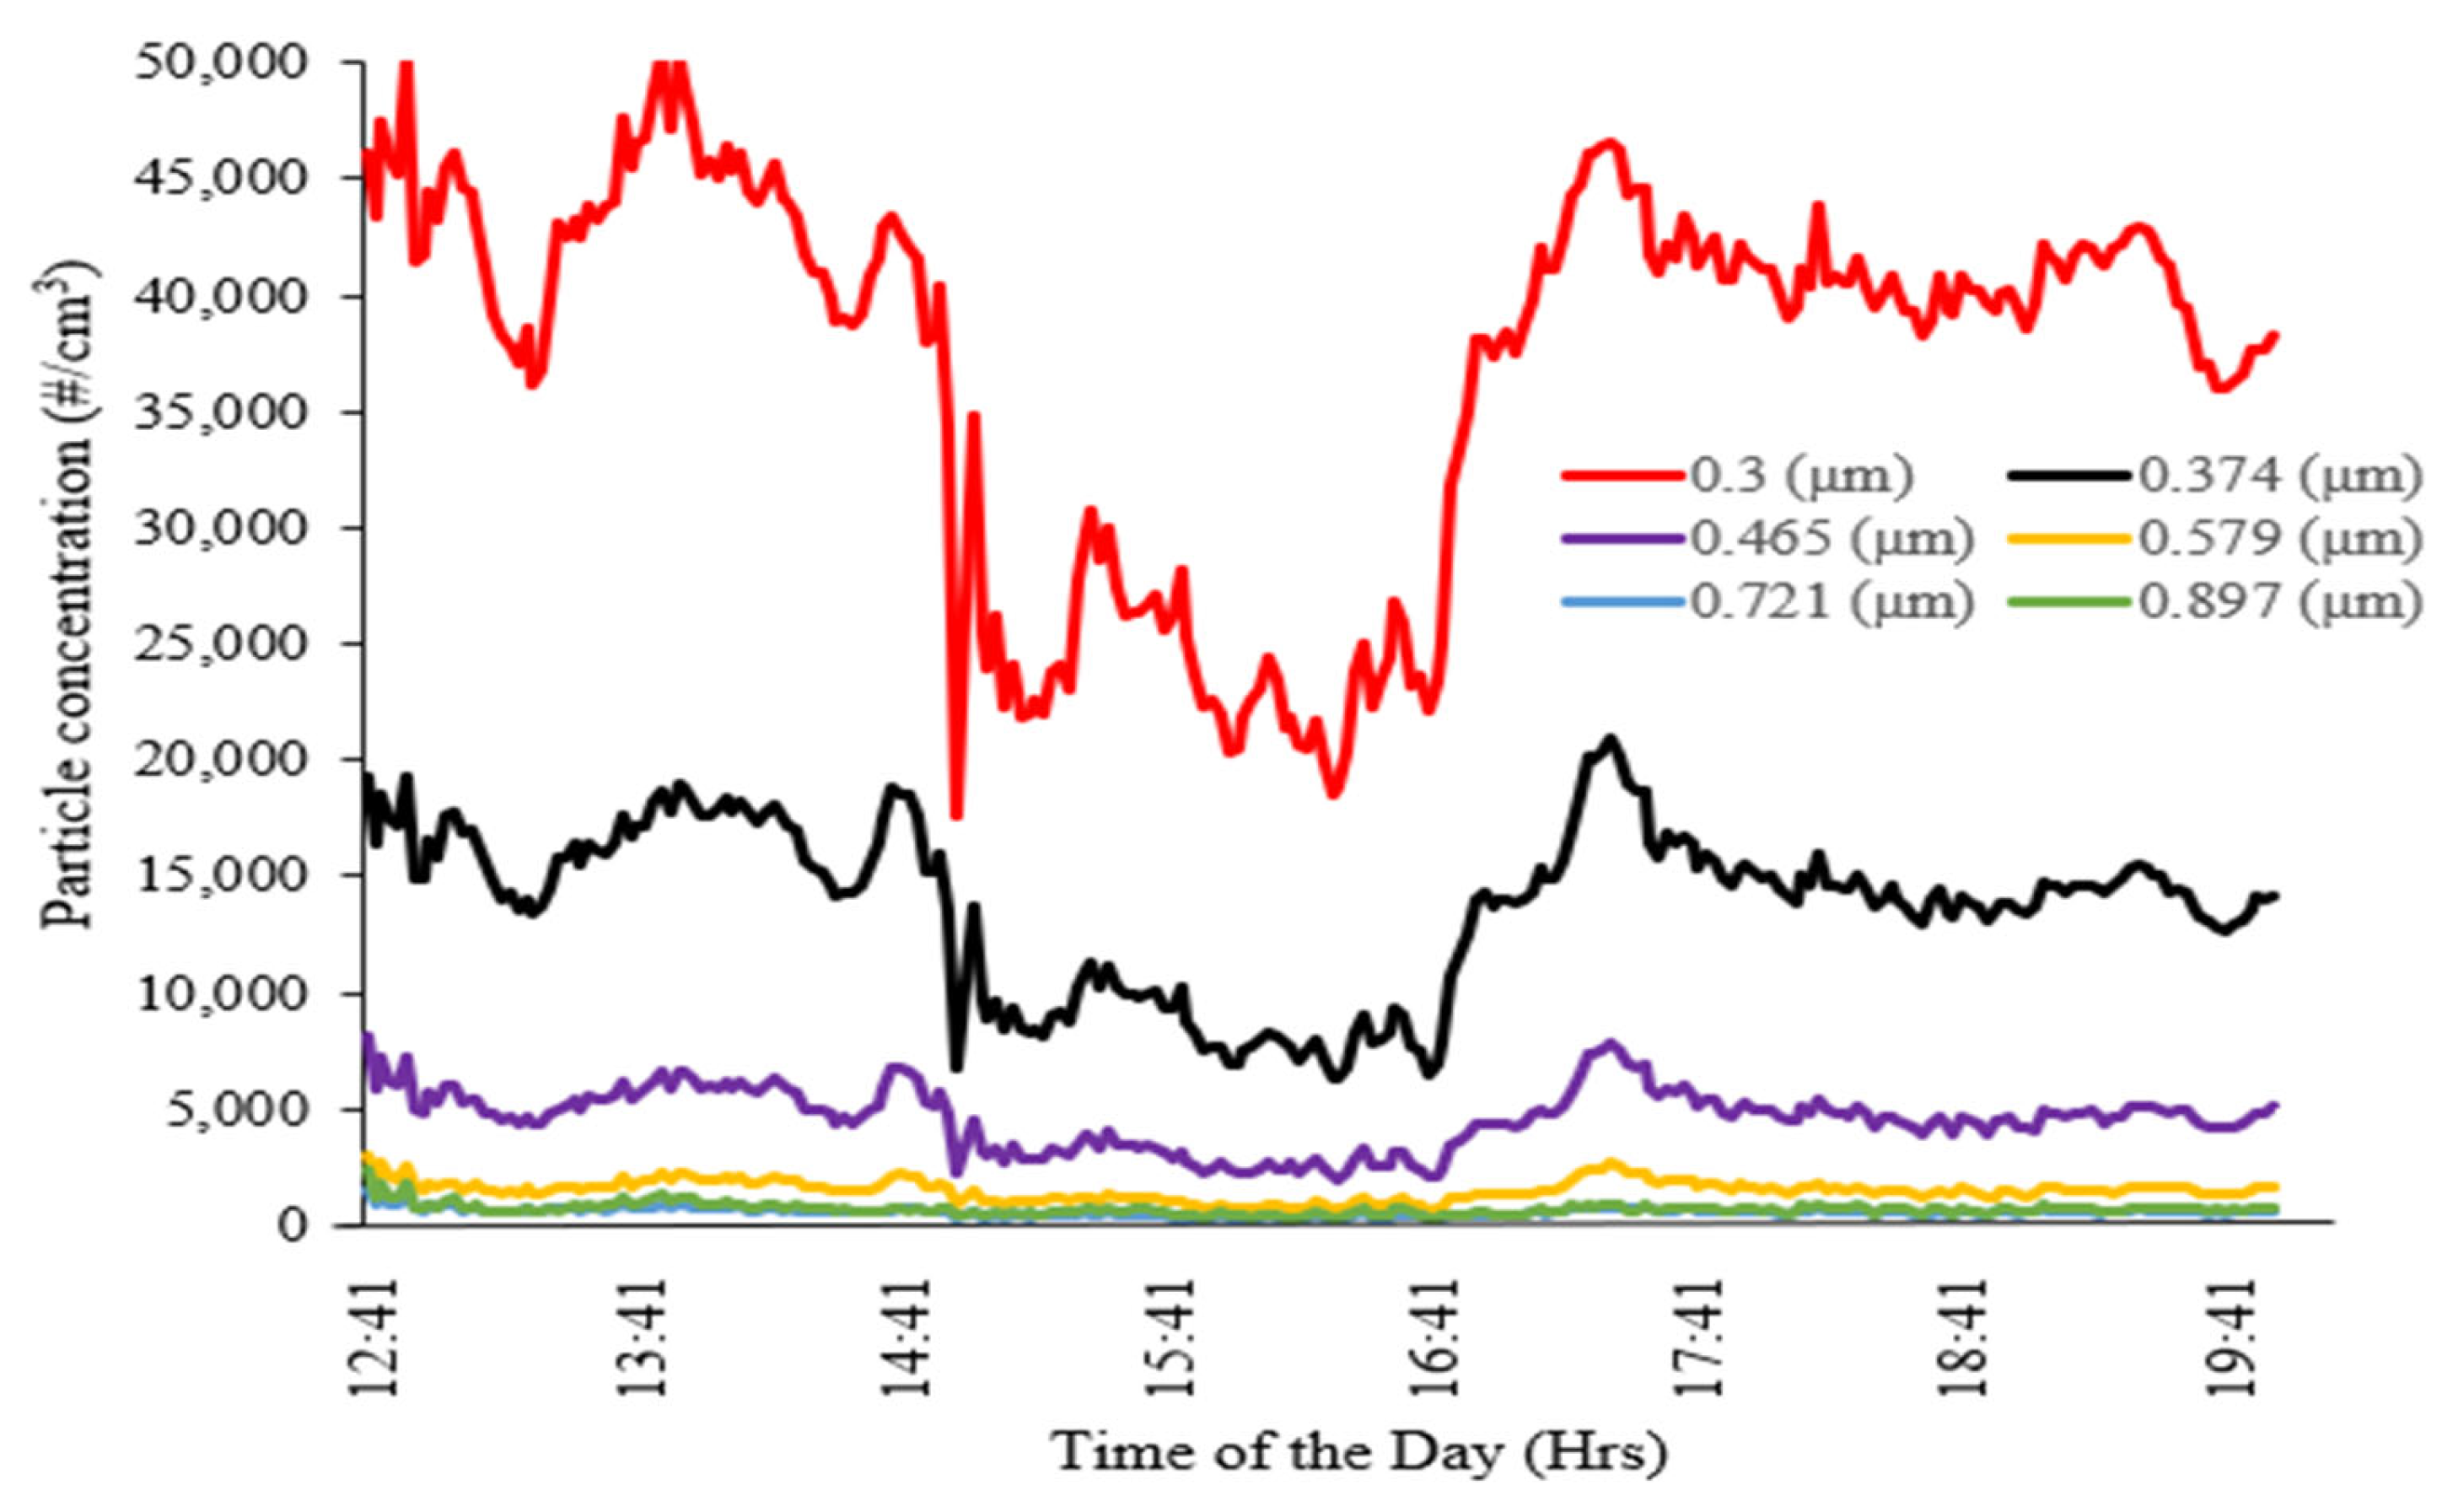
Figure 6 shows a similar concentration peak in the evening with an additional peak in the afternoon at a maximum of 50,546 #/cm
3 for 0.3 µm. Particle sizes of 0.374 µm and 0.465 µm followed the same pattern of temporal variation with maximum concentrations of 20,889 #/cm
3 and 8147 #/cm
3, respectively. In contrast to
Figure 5, the maximum concentration was reported in the afternoon for particle size 0.3 µm and 0.465 µm while the highest concentration for particle size 0.374 µm was in the evening.
The 72-hr plots of wind backward-in-time trajectories (
Figure 4) show the influence of particle transport and wind direction (
Figure 3) on particle number concentrations at the Port. The wind rose and backward-in-time trajectory plots were selected to explain the contribution of both local and regional emissions to the maximum and minimum particle number concentrations recorded in this study. The maximum number concentration for particle size 0.3 µm (101,631 #/cm
3) was observed on 9 November 2018, while maximum number concentrations for particle size 0.374 and 0.465 µm (43,432 and 29,271 #/cm
3) were detected on 8 November 2019. The minimum number concentrations were found on 6 November 2018. The maximum particle number concentrations observed during the study on 8 and 9 November 2018 corresponded to low wind speeds of 0-10 mph. The wind direction on 8 November 2018 was primarily from the northwest, while on 9 November 2018 more than half of the frequency count by wind direction was from the southwest, with approximately one third from the northeast. The wind trajectory from the northwest on 8 and 9 November 2018 traversed highways, local and rail roads as well as the inland areas in Albany, thus transporting emissions from vehicles and human activities to the Port. The lowest concentrations for particle size 0.3, 0.374, and 0.465 µm were recorded on 6 November 2018, with higher wind speeds up to 20 mph, and backward-in-time trajectories show wind currents from the south and north. The low concentration may be the result of a high air dispersion and an atmospheric dilution effect over the Hudson River.
The average daily concentration of BC measured during the study period was 689 ± 734 ng/m
3 (
Table 1).
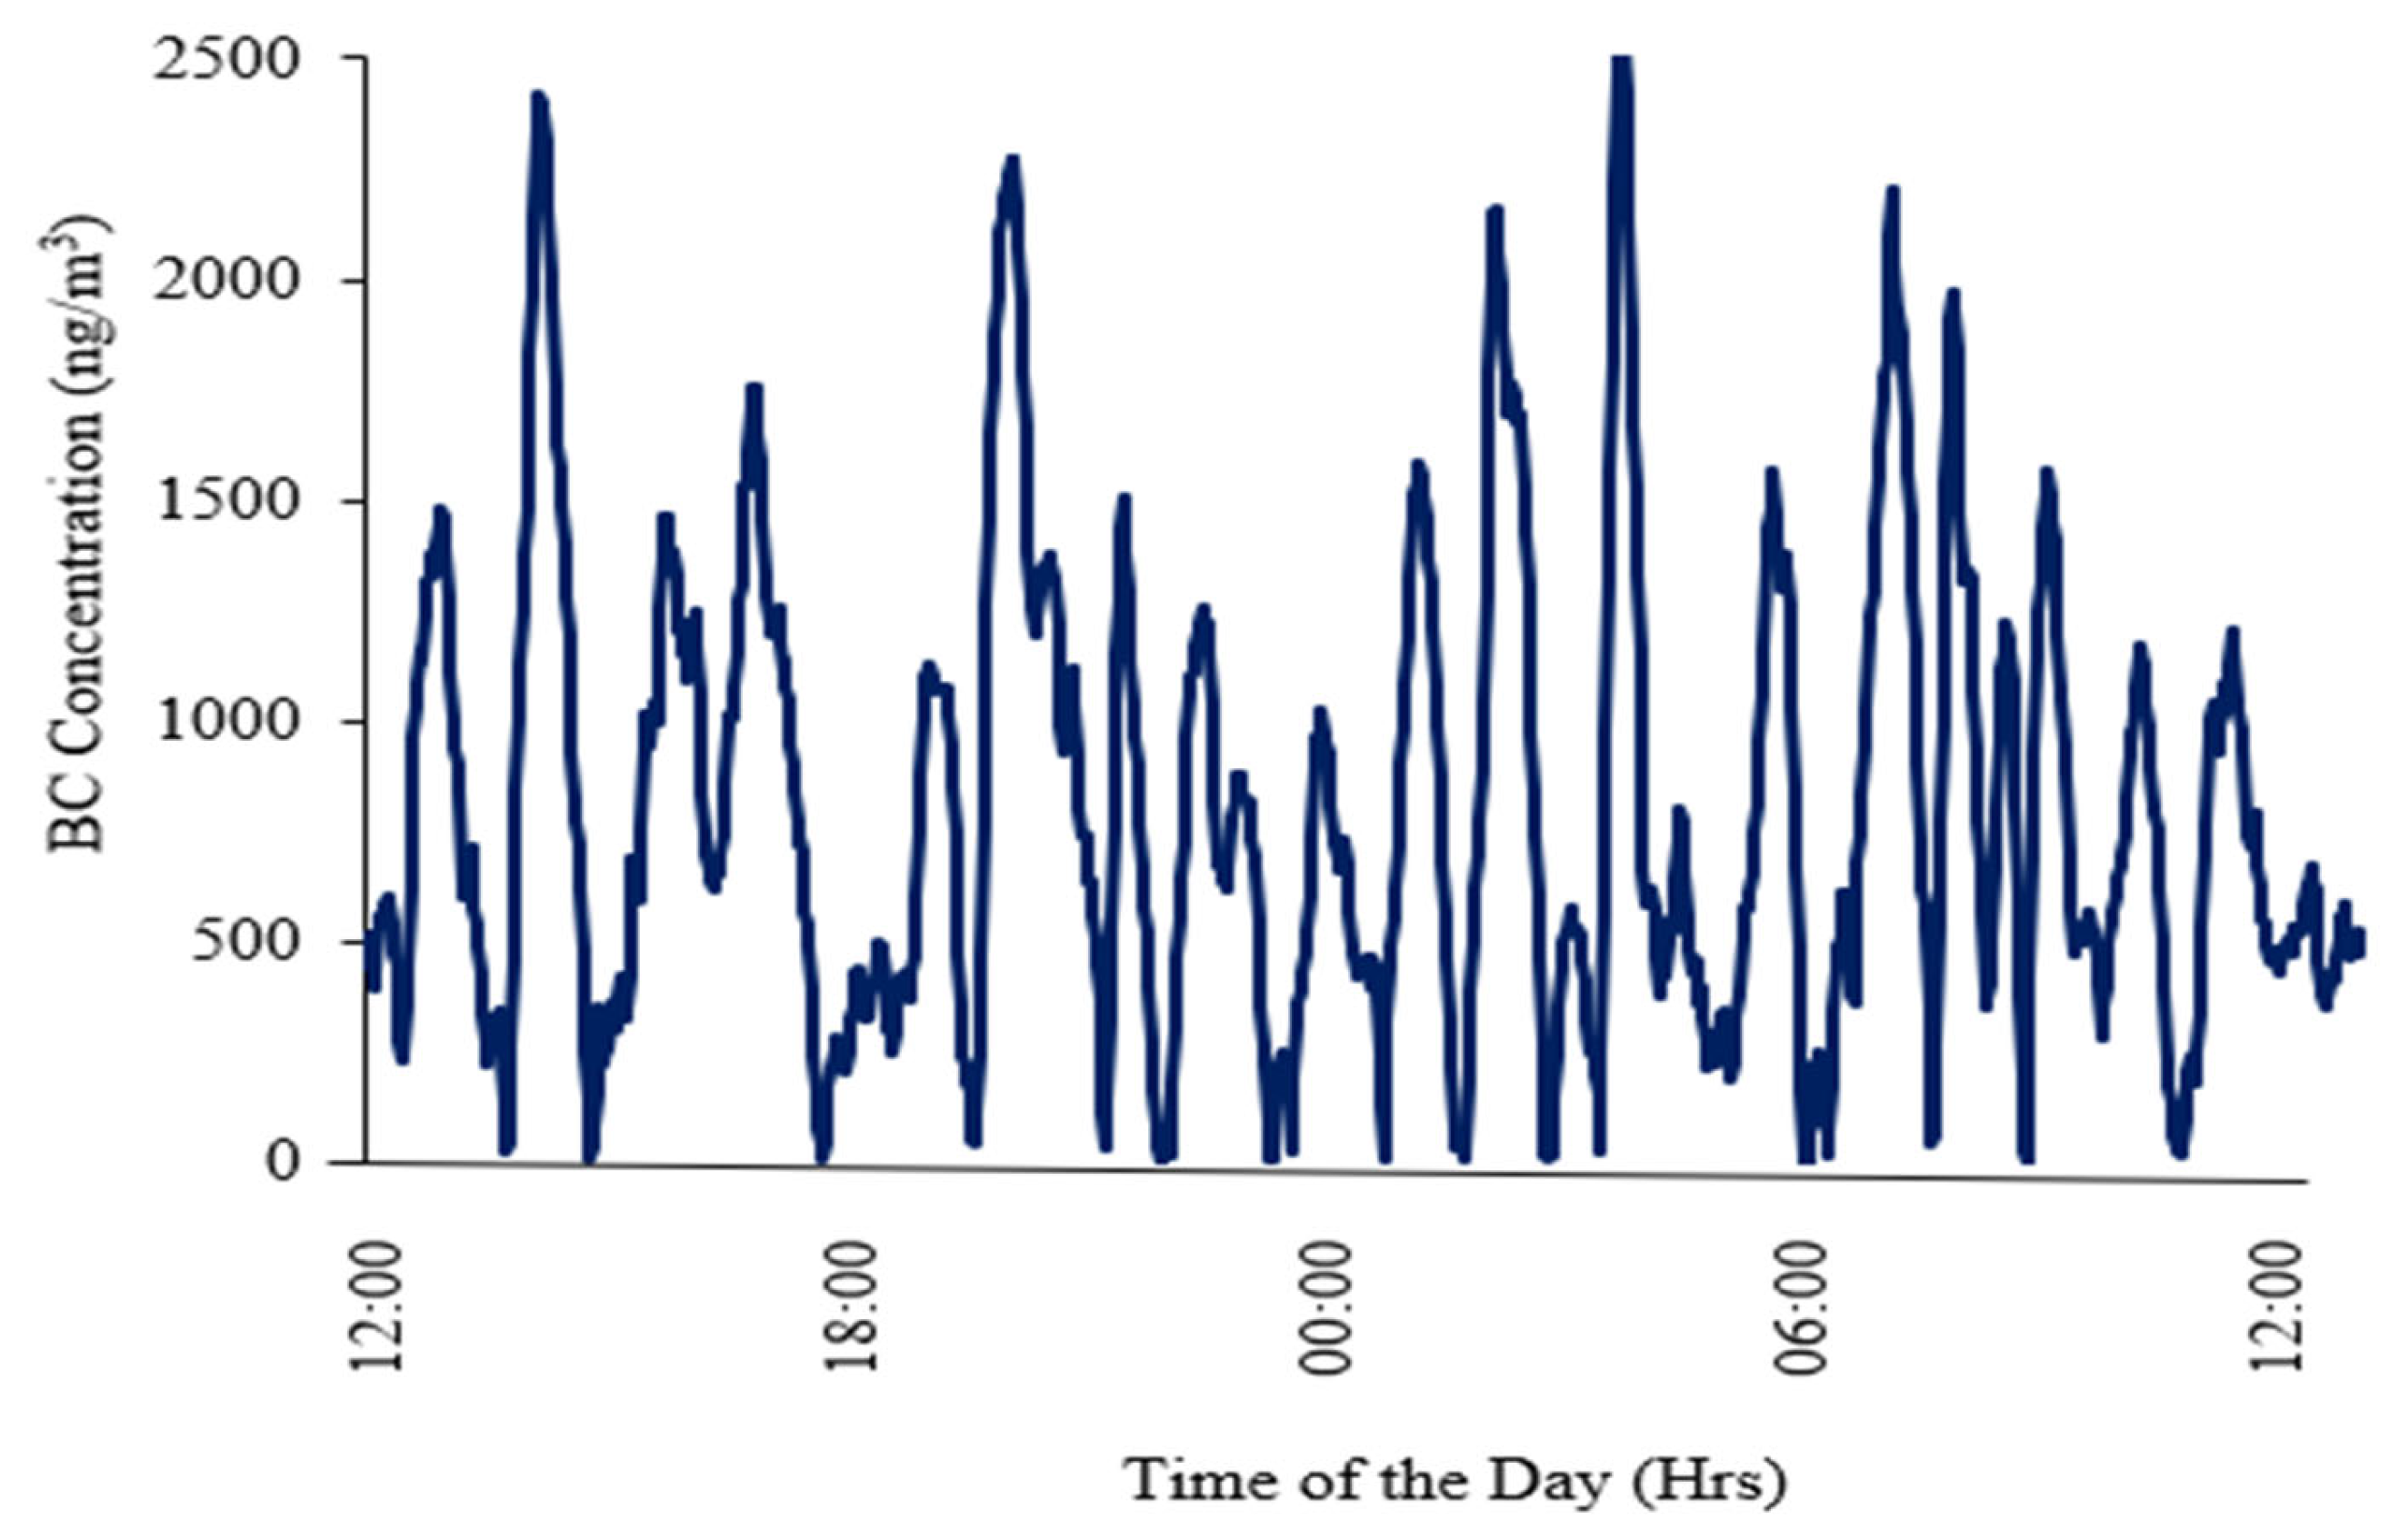
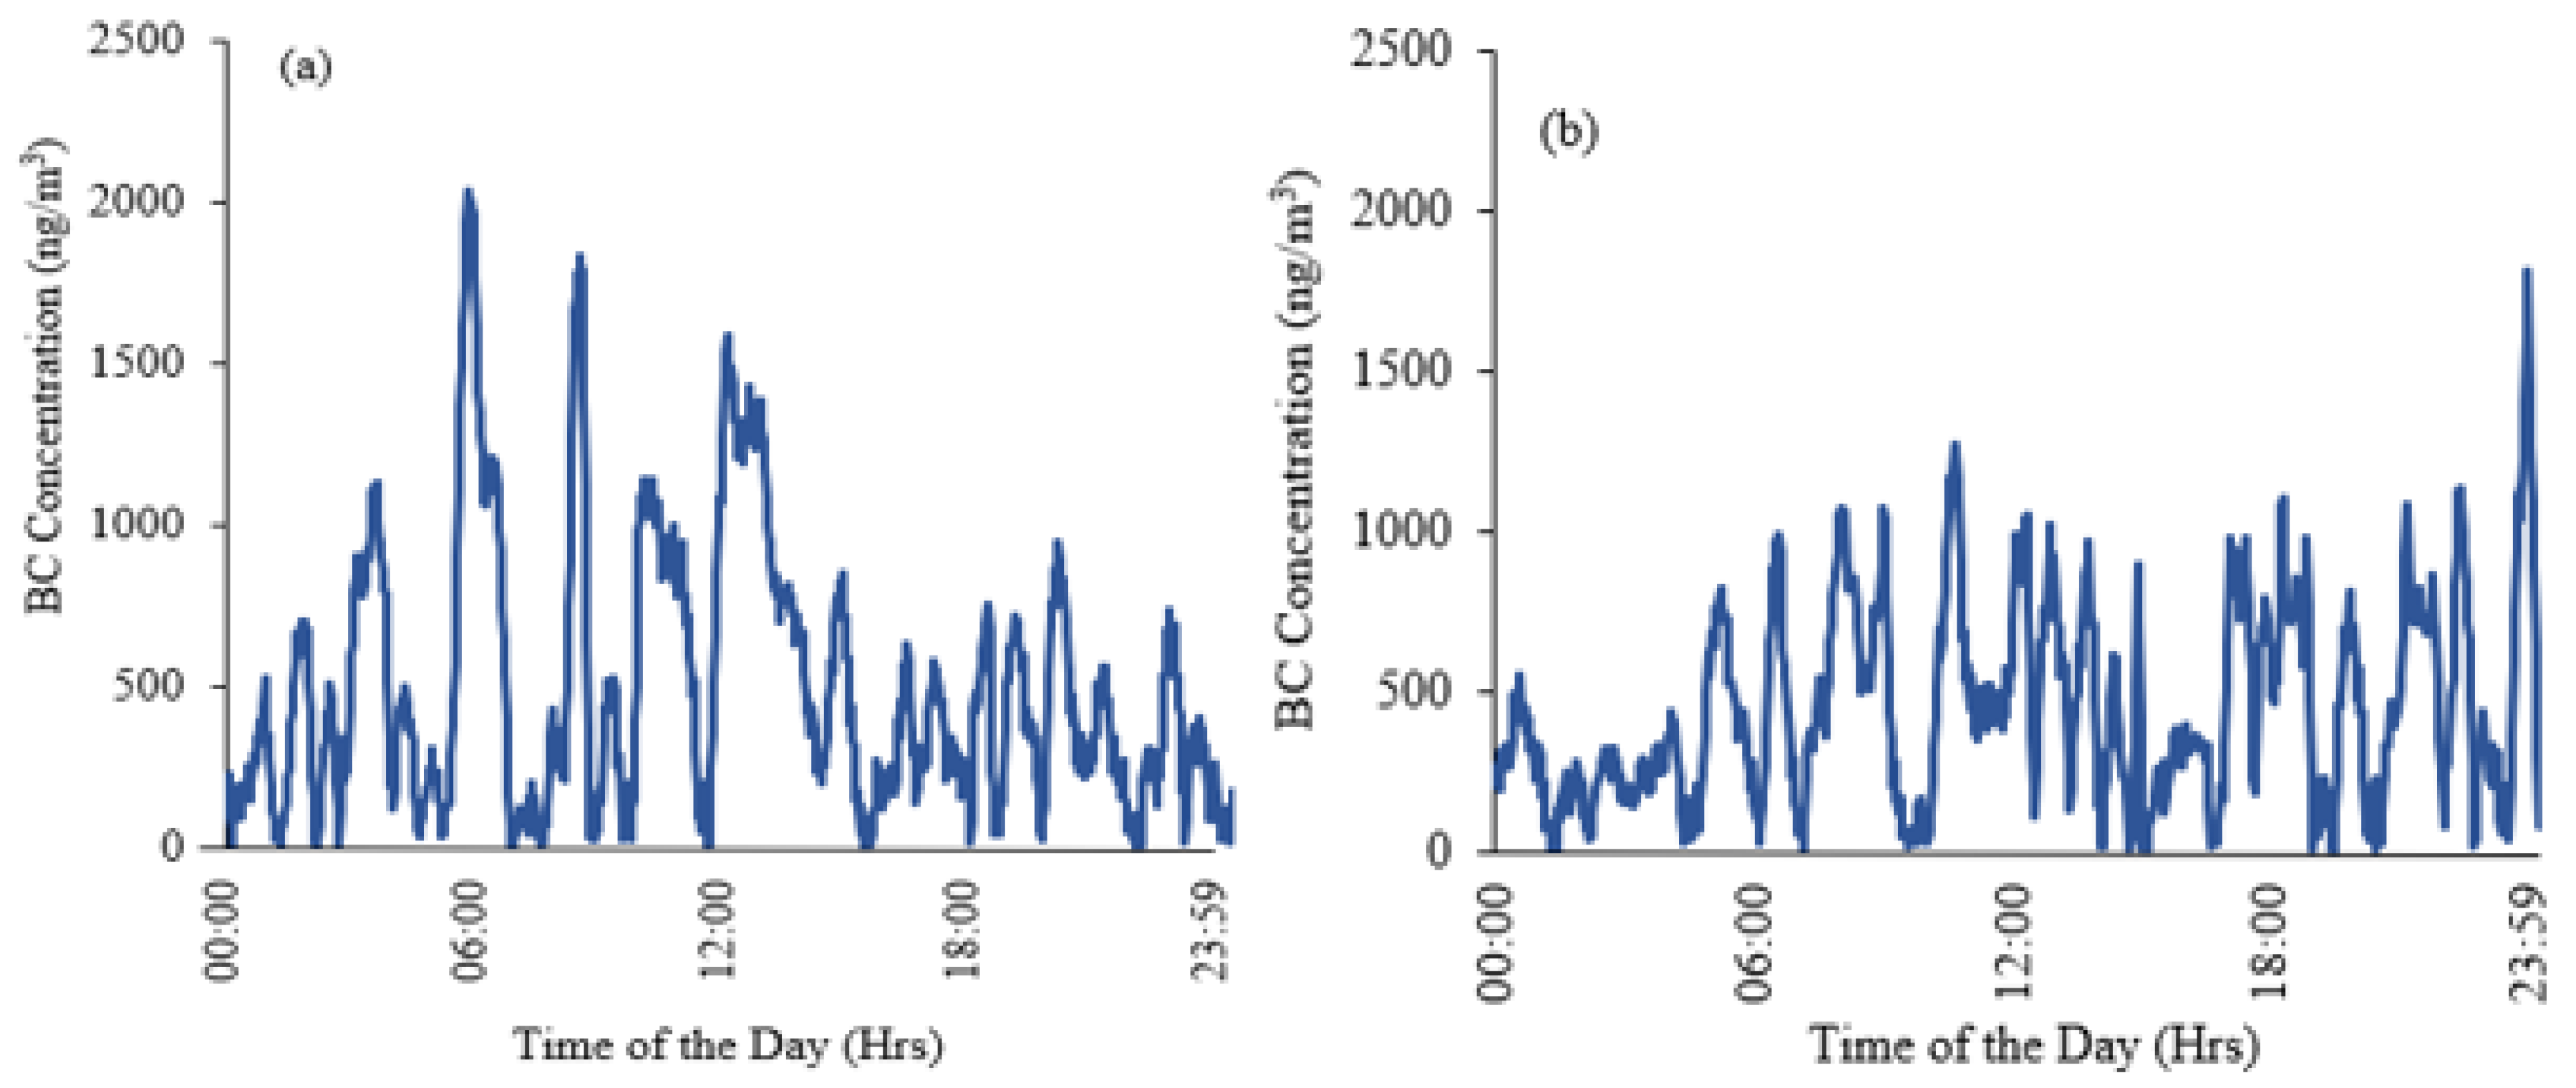
Figure 7 and
Figure 8a,b show the hourly variations of BC for 24-hr during the study period with a high peak of BC concentrations (as high as 2595 ng/m
3) at the Port. BC concentration increased during both morning and evening rush hours. In addition, the average weekday-weekend concentrations for the study period (1–19 November 2018) indicates that BC concentrations were higher on weekdays (748 ± 801 ng/m
3) than on weekends (538 ± 496 ng/m
3). The fluctuation in BC concentration during the study period mostly occurred during regular working hours and was likely due to industrial and vehicular activities around the Port, as BC is associated with diesel vehicles. However, six out of the eighteen days sampled had elevated BC concentrations with irregular fluctuations. The increased concentration during the night shown in
Figure 7 was possibly due to off-road diesel activity at the Port or increased heating demand during the winter, as residential heating plays a significant role in air pollution in the Northeast U.S.
Traffic emissions from the region around the Port may also have significantly contributed to the elevated BC concentration. The maximum BC concentration (11,971 ng/m
3) measured on 9 November 2018 corresponds to a wind path that blew over the highways, local streets, and railyards as shown in the 72-hr wind backward-in-time trajectory (
Figure 4), potentially contributing to the transport of BC emissions to the Port from vehicles and other human activities. Assessing the contribution of regional and local sources to BC concentration with backward-in-time trajectory was consistent with the wind direction 72-hr prior to the day the concentration was measured. The concentration of particles from wind blowing over inland areas is usually higher compared to the concentration over rivers or seas that may have been diluted by sea breezes.
O
3 concentration ranged from 0.1 to 36.8 ppb during the study period, which was around the background level and did not exceed the WHO guideline of 50 ppb as an eight-hour average. The average concentration of O
3 was 17.5 ± 11.2 ppb with a maximum concentration of 36.8 ppb (
Table 1). The low concentration of O
3 may be due to dry deposition and low solar radiation. O
3 did not exhibit a clear diurnal pattern. However, the study was conducted outside of the regional ozone season when ozone levels are generally lower and not prone to the increases seen with higher air temperatures.
This study is the first to evaluate detailed particle size segregation at the Port of Albany. The higher concentrations of PM
10, sub-micron PM, and BC at the Port indicate sources that surround the sampling site, including petroleum depots and crude oil storage facilities, a grain storage facility, asphalt production, cement industry, traffic emissions from local and major highways (I-787 and I-87), wastewater treatment plants, metal processing factories, and other off-road diesel emission sources (marine vessels, construction equipment, and large cranes). The results given here agree with Clarke et al. (2014) study conducted in Ulsan, South Korea, where variability was observed in PM
10 concentrations, with peaks observed in the morning and afternoon [
19]. A study conducted in Paris, France at several traffic locations reported PM
10 concentrations were elevated for some days during the study period [
20]. The particle number concentration recorded in this study also agrees with a study conducted on the effect of vehicles and local environment on particle number concentrations [
8]. Additionally, von Schneidemesser et al. (2019) found an association between vehicular traffic and particle number concentrations, which also showed that particle number concentrations increased with traffic emissions [
8]. In addition, particle number concentration can be heavily dependent on the specific activities taking place within a general classification of sources, such as for metal industry and machine shops within stationary sources [
21].
Traffic emissions are clearly a source for increasing levels of ambient air pollution. BC concentration levels have been consistently found to be higher in the morning and evening, likely due to fossil fuel combustion and diesel from trucks. In a study conducted in Las Vegas, NV around major highways, BC levels increased between 4:00 AM – 8:00 AM on weekdays to about 2840 ng/m
3 downwind or 3020 ng/m
3 low speed wind [
12]. The Las Vegas findings align with the results of this study, in which the maximum BC concentration of 11,971 ng/m
3 occurred around 8:00 AM in the morning. The variations in BC concentrations observed were due to wet deposition (rain and snow), as evidenced in the lower daily average during the study period.


 ,
, 


