Article

Characteristics of Fine Particulate Matter (PM2.5)-Bound n-Alkanes and Polycyclic Aromatic Hydrocarbons (PAHs) in a Hong Kong Suburban Area

1
Instrumentation and Service Center for Science and Technology, Beijing Normal University, Zhuhai 519087, China
2
Department of Civil and Environmental Engineering, The Hong Kong Polytechnic University, Hong Kong 999077, China
3
School of Atmospheric Sciences, Sun Yat-sen University, Key Laboratory of Tropical Atmosphere-Ocean System, Ministry of Education, and Southern Marine Science and Engineering Guangdong Laboratory (Zhuhai), Zhuhai 519087, China
*
Author to whom correspondence should be addressed.
Atmosphere 2022, 13(6), 980; https://doi.org/10.3390/atmos13060980
Submission received: 25 May 2022 / Revised: 11 June 2022 / Accepted: 14 June 2022 / Published: 17 June 2022
(This article belongs to the Special Issue Advances in Light-Absorbing Carbonaceous Aerosols Research)

Abstract

:
PM2.5 samples were collected at Tung Chung (TC), Hong Kong, during four nonconsecutive months in 2011/2012 to determine the concentrations, seasonal variations, and potential sources of polycyclic aromatic hydrocarbons (PAHs) and n-alkanes (n-C15-n-C35). Samples were analyzed using the thermal desorption gas chromatography/mass spectrometry (TD-GC/MS) method. The concentrations of particulate PAHs ranged from 1.26–13.93 ng/m3 with a mean value of 2.57 ng/m3, dominated by 4-ring species. Phenanthrene (Phe) and fluoranthene (Flu) were the two most abundant species, accounting for 13% and 18%, respectively. The dominant sources of PAHs were coal and biomass burning. The inhalation cancer risk value in our study exceeded 1 × 10⁻⁶ but was below 1 × 10⁻⁴, implying that the inhalation cancer risk of PAHs at the TC site is acceptable. The average concertation of n-alkanes was 103.21 ng/m3 (ranging from 38.58 to 191.44 ng/m3), and C25 was the most abundant species. Both PAHs and n-alkanes showed higher concentrations in autumn and winter whilst these values were lowest in summer. The carbon preference index (CPI) and percent contribution of wax n-alkanes showed that biogenic sources were the major sources. The annual average contributions of higher plant wax to n-alkanes at TC were over 40%.

1. Introduction

Organic aerosols are a major component of PM2.5 and have a direct impact on the environment and human health due to their abundance in the ambient environment and complex physical and chemical properties. In midlatitude continental areas, the contribution of organic aerosols to PM2.5 ranged from 20% to 50% [1,2,3,4]; in China, organic aerosols comprise ~35% on average [5]. Organic aerosols can be emitted from both anthropogenic activities, e.g., incomplete combustion of fossil fuel, and natural sources, e.g., volcanic eruptions. Although many studies have investigated the importance of organic aerosols, the levels, formation mechanisms, and chemical characteristics of organic species are different from microenvironments; thereby, to obtain a holistic understanding, further investigation of organic aerosol is needed.
In the past century, only a small fraction of organic aerosols has been identified at the molecular level [6]. Polycyclic aromatic hydrocarbons (PAHs) and n-alkanes are the two important components of organic aerosols. Both PAHs and n-alkanes can be emitted to the environment through anthropogenic activities, e.g., incomplete combustion of fossil fuel; petroleum residues; and natural sources, e.g., wildfire [7,8]. Biogenic sources, including particles shed from leaf epicuticular wax and suspensions of pollen, fungi, bacteria, algae, and higher plant waxes, play important roles in n-alkane emissions to the environment [9,10,11].
The two pollutants have recently received much attention due to their negative impacts on humans; for example, n-alkanes can damage skin and engender skin cancer. Many PAH species are known to be carcinogenic, mutagenic, or teratogenic. For example, benzo(a)pyrene, benzo(b)fluoranthene, benzo(k)fluoranthene, and indeno(1,2,3-cd)pyrene are known for their carcinogenic properties and can bioaccumulate in the environment [7,12]. Their presence and characteristics have been widely studied worldwide and in many Chinese megacities, such as Beijing, Nanjing, Guangzhou, etc. [13,14,15]. Different areas showed varied dominant sources, for example, 25% of n-alkanes were from plant wax, and 37% of PAHs were from biomass burning in Lulang [16] while in Guangzhou, the significant pollution source of PAHs and n-alkanes was from coal combustion [13]. Previous Hong Kong studies have mainly focused on identifying the characteristics and sources of PAHs and n-alkanes in urban and industrial areas. However, the influential features of these two pollutants in different microenvironments can vary. For example, in urban areas, the major contributor of PAHs and n-alkanes is traffic emission, but in industrial areas, the dominant source of the two pollutants is stationary emissions [17,18].
Tung Chung (TC) is a new town in Hong Kong, which was developed to serve as a supporting community for one of the world’s busiest passenger airports (Hong Kong Chep Lap Kok airport), including government public facilities, commercial centers, office blocks, and hotels. In 2016, TC had over 86,000 inhabitants (2016 census) and the development of TC areas is still ongoing to support the growing population. This area is surrounded by many large country parks with many natural resources and located in the centerline of the Pearl River Delta (PRD) region, facing Macau and mainland China. Therefore, this sampling area becomes a speculated microenvironment with mixing with complex potential sources of PAHs and n-alkanes. However, limited PAH- and n-alkane-related studies have been conducted here. To fill the gap in the study of PAHs and n-alkanes in the area, we conducted 4 months of sampling from 2011–2012 to understand the abundance, seasonal variation, and possible sources of particle-associated PAHs and n-alkanes.

2. Materials and Methods

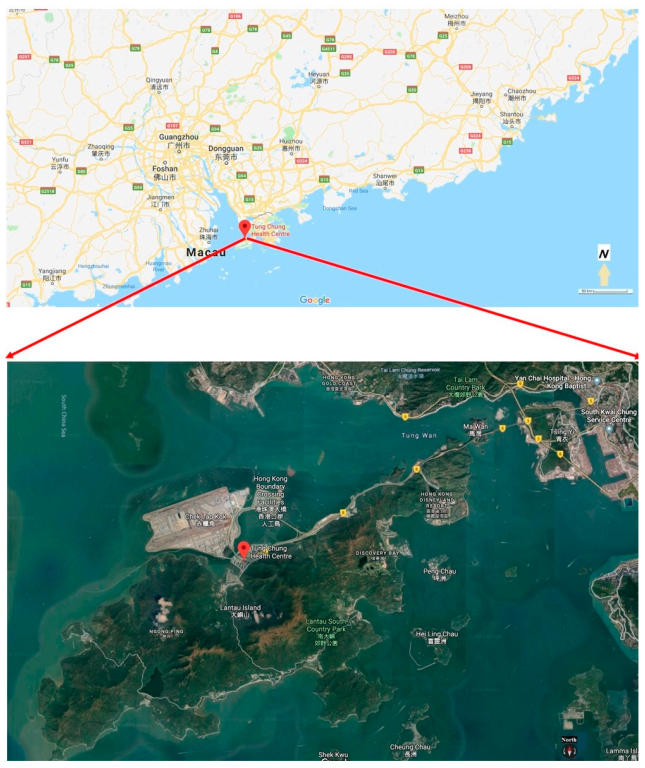
2.1. Sampling Site and Sample Collection

All samples were collected at the TC site (22.17° N, 113.56° E), which is located on the northern coast of Lantau Island and is southwest of Hong Kong (Figure 1), surrounded by three mountains. The sampling was conducted in four nonconsecutive months, which were August (2011), November (2011), February (2012), and May (2012), representing summer, autumn, winter, and spring, respectively. The sampling instruments were placed on the rooftop of a three-story building, which was established by Hong Kong Environmental Protection Department (HKEPD). Detailed information of the sampling site was illustrated in an earlier study [19].
Twenty-four-hour integrated PM2.5 samples (from 10:00 a.m. to 10:00 a.m. the next day local standard time) were collected by a high-volume sampler manufactured by Graseby Andersen (Model Tisch Environmental Inc., Village of Cleves, OH, USA) with a flow rate of 1.13–1.41 m3/min. A total of seven PM2.5 samples were collected in each season. Table S1 lists the sampling dates and daily meteorological conditions. Whatman quartz microfiber filters (20.3 cm × 25.4 cm) were used. Before sampling, all quartz-fiber filters were preheated at 900 °C for 3 h to minimize organic artifacts [20]. Four field blank filters were collected during the four sampling periods. After sampling, the samples were properly stored in a freezer at −20 °C to minimize the loss of volatiles.

2.2. Chemical Analysis

After sampling, the filters were conditioned and weighed to determine the mass concentration of the loaded particles. The filters were cut into small portions and analyzed at the Institute of Earth Environment, Chinese Academy of Science (Xi’an) using the thermal desorption-gas chromatography/mass spectrometry (TD-GC–MS) method with the use of an Agilent 6890A/5975C system. The filter was cut into smaller strips and inserted into a TD tube with wool plugged in both ends of the tube. The HP-5ms capillary column (5% diphenyl/95% dimethylsiloxane; 30 m long × 0.25 mm I.D. (Internal Diameter) × 0.25 μm film thick; J&K Scientific, Folsom, CA, USA) was used to sperate the compounds. The carrier gas was ultra-high-purity (99.999%) helium (He) at a constant flow of 1.0 cm3/min. All the organic compounds desorbed from the filter below 275 °C. The details of this analysis method were described by Ho et al. [21]. A total of 20 PAHs, including acenaphthylene (AC), acenapthene (ACE), fluorene (Flo), phenanthrene (Phe), anthracene (Ant), fluoranthene (Flu), pyrene (Pyr), benzo(a)anthracene (BaA), chrysene (Chr), benzo(b)fluoranthene (BbF), benzo(k)fluoranthene (BkF), benzo(a)fluoranthene (BaF), benzo(e)pyrene (BeP), benzo(a)pyrene (BaP), perylene (Per), indeno(1,2,3-cd)pyrene (IcdP), dibenzo(a,h)anthracene (DahA), benzo(ghi)perylene (BghiP), coronene (Cor), dibenzo(a,e)pyrene (DaeP), and 21 n-alkanes (i.e., from C15–C35), were determined.
For ion analysis, half of the quartz-fiber filters were extracted with 10 mL of ultra-pure water (specific resistance ≥ 18.1 MΩ·cm, Millipore). The extraction solution was analyzed by ion chromatography (ICS3000, DIONEX, Sunnyvale, CA, USA) for water-soluble ions, including chloride (Cl), nitrate (NO3), sulfate (SO42−), sodium (Na+), potassium (K+), calcium (Ca2+), and ammonium (NH4+). The concentration data is shown in the Supplementary Materials Table S2.
Other gaseous measurements included CO, NOx, and O3, which were measured with a CO analyzer (TEI, Model 48C), chemiluminescence NOx analyzer (TEI, Model 42i with blue light converter), and UV photometric O3 analyzer (Teledyne, API 400), respectively. Meteorological parameters (wind profile, temperature, and relative humidity) were also monitored with an RH/T probe and wind monitor (Gill, UK) at the sampling site. The sampling interval of the gaseous species and meteorological parameters was 1 min. Span and zero calibration of the gas analyzers was carried out every week. The daily average data is shown in the Supplementary Materials Table S2

2.3. Risk Assessment

The BaP equivalent concentration (BaPeq) was used to assess the health risk of PAHs; the equation of BaPeq is shown in Equation (1):
BaPeq = ∑Ci × TEFi
where Ci refers to the mass concentration of specific PAHs components (Phe, Ant, Flu, Pyr, BaA, Chr, BbF, BkF, BeP, BaP, Per, IcdP, BghiP, and DahA). Based on Nisbet and LaGoy [22], the TEFi values of the specific PAHs components are Phe (0.001), Ant (0.01), Flu (0.001), Pyr (0.001), BaA (0.01), Chr (0.01), BbF (0.1), BkF (0.1), BeP (0.01), BaP (1), Per (0.001), IcdP (0.1), BghiP (0.01), and DahA (5).
The inhalation cancer risk (ILCR) was used to estimate the cancer risk from PAH exposure, which was calculated by multiplying BaPeq and inhalation unit risk (URBap). The URBap value was the maximum theoretical increased probability of lung cancer that was caused by continuing exposure to atmospheric BaP (1 ng/m3) in a 70-year life time. According to WHO [23], the URBap value is 8.7 × 10⁻⁵. The ILCR was calculated using Equation (2):
ILCR = ∑BaPeq × UReq

3. Results and Discussion

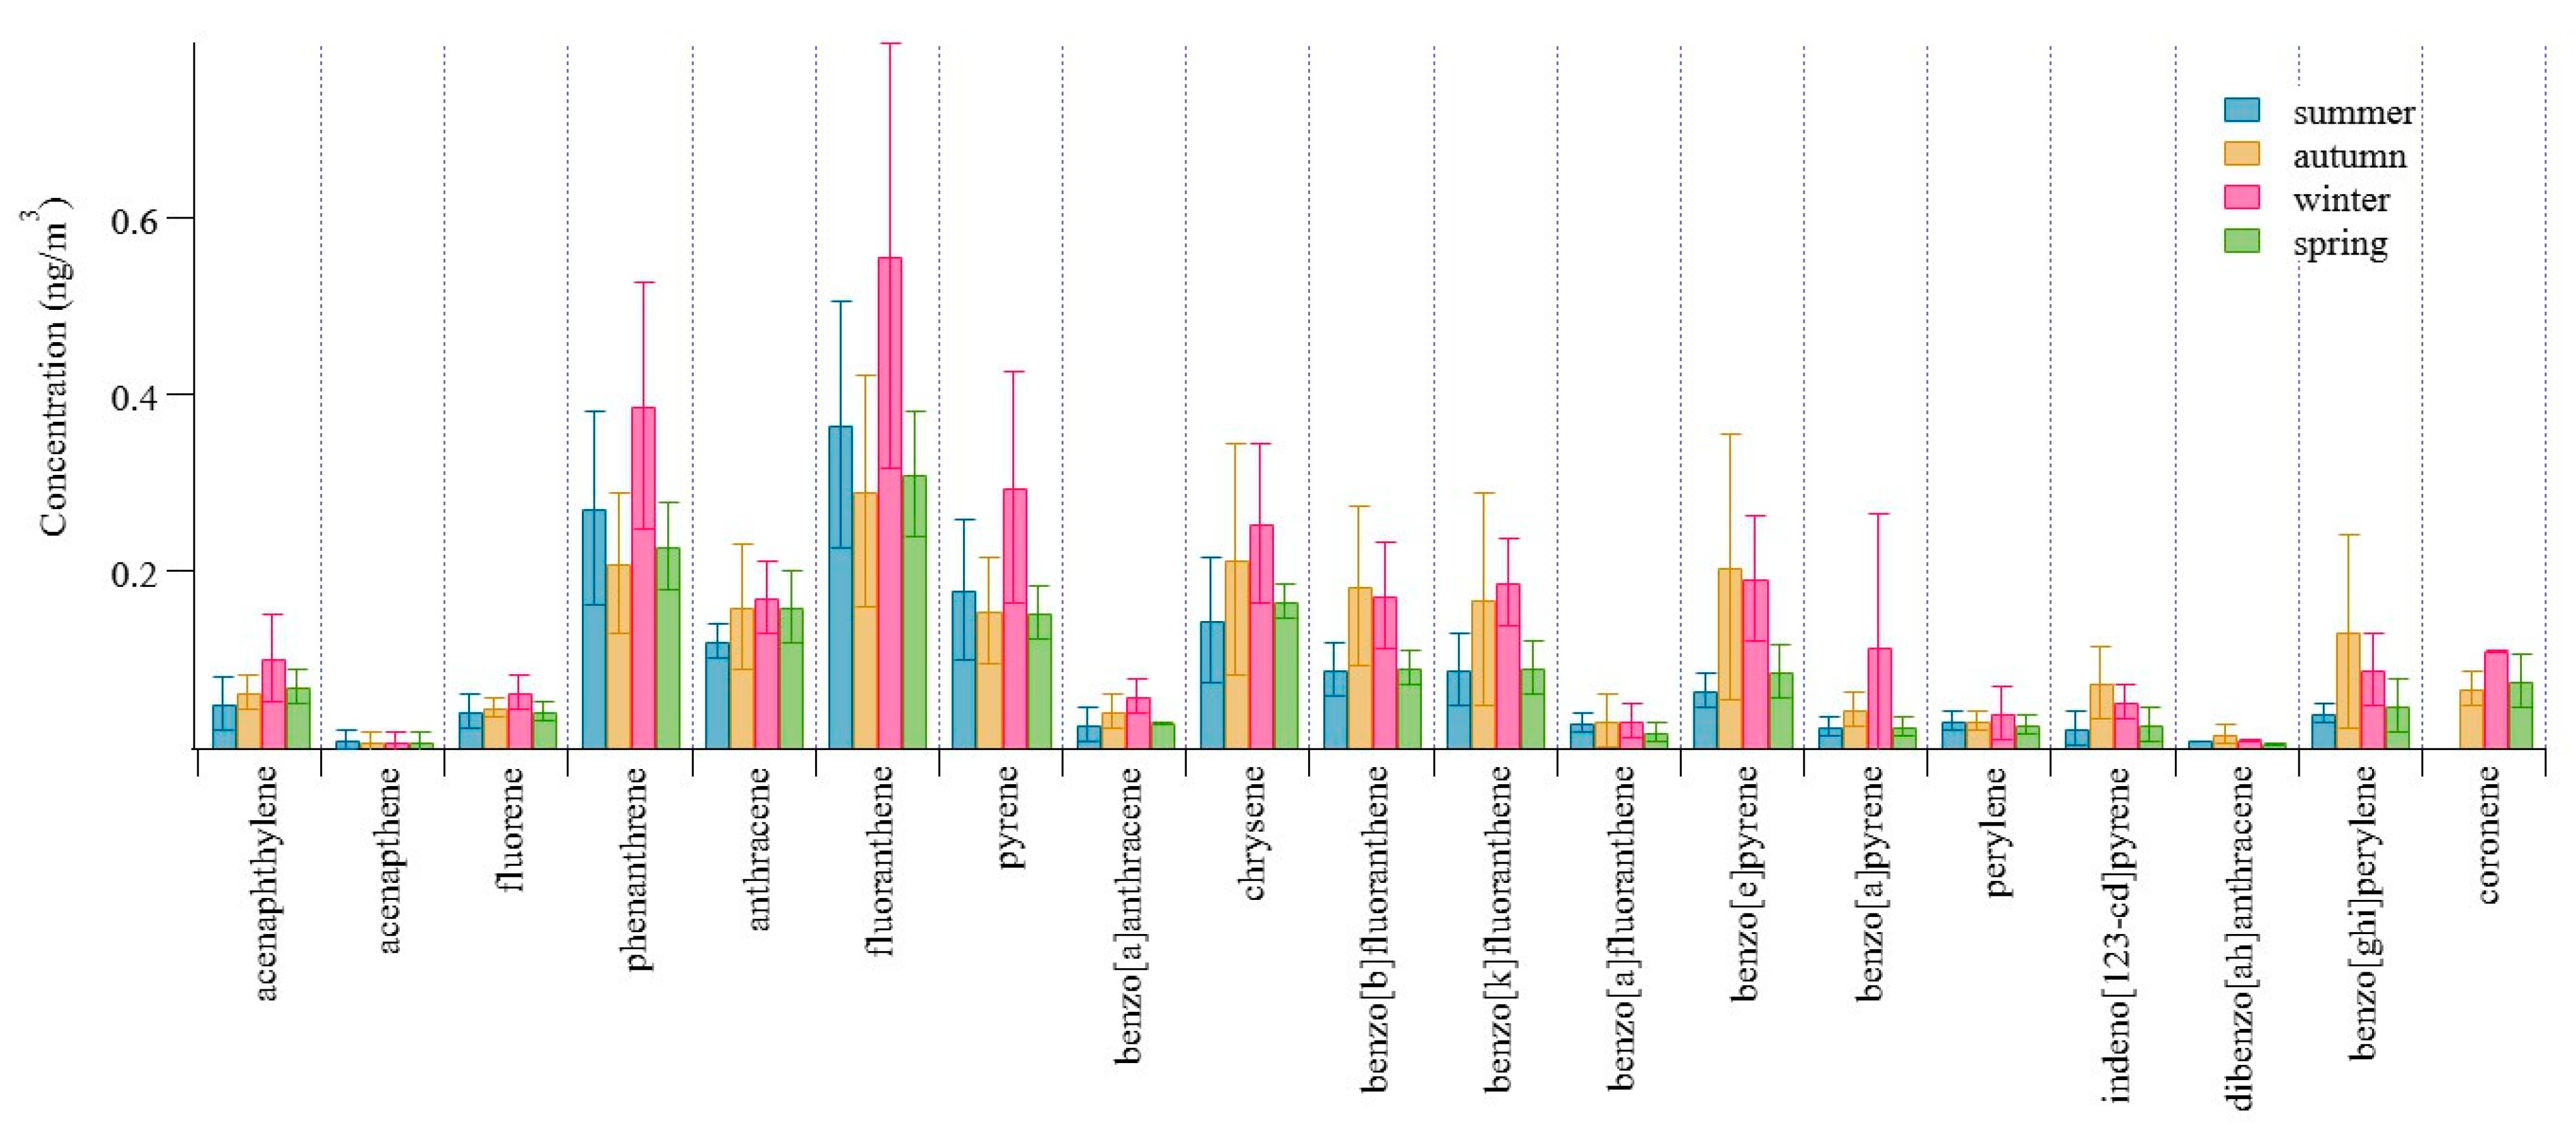
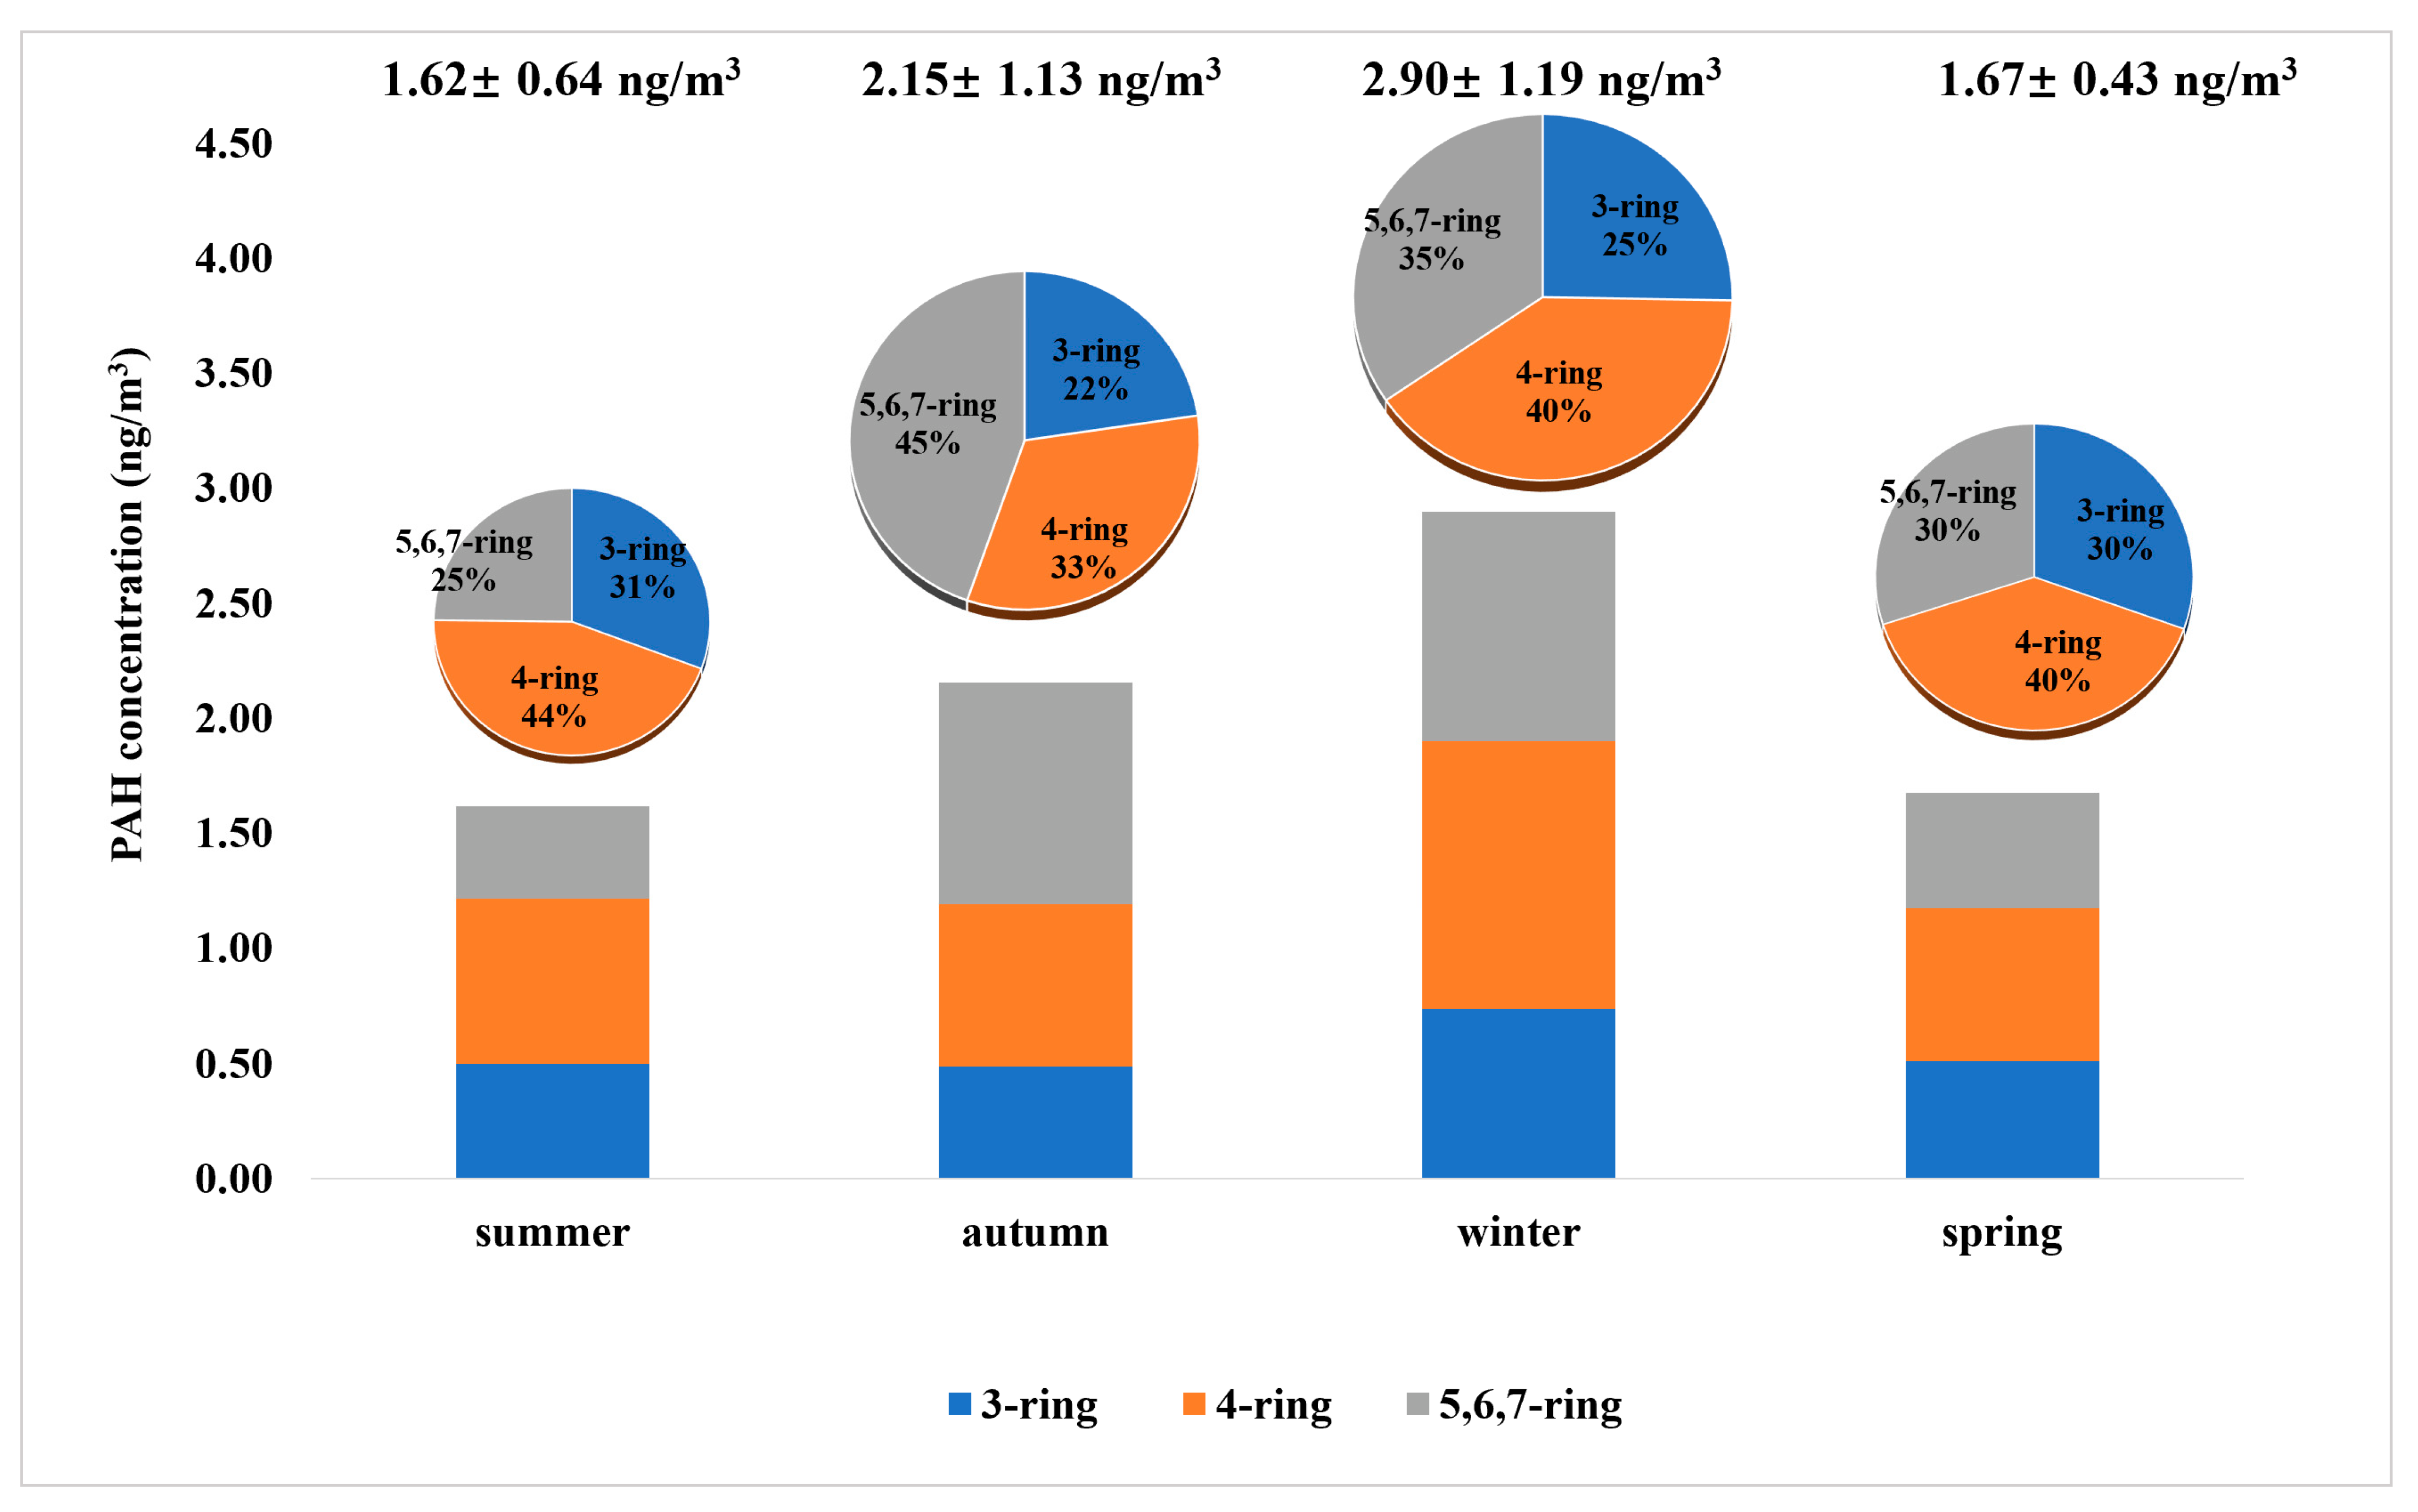
3.1. PAH (Polycyclic Aromatic Hydrocarbon) Concentrations, Seasonal Variations, and Potential Health Risks

The sum of the PAH concentrations (19 species) ranged from 1.26–13.93 ng/m3, with an average concentration of 2.57 ± 2.53 ng/m3, during the whole sampling period in the Hong Kong suburban area (Table 1). The reported value was lower than those measured in the Hong Kong, Guangzhou, Xiamen, and Sanya urban areas, which were 10.72, 23.70, 10.10 and 9.90 ng/m3, respectively [17,24,25,26,27]. The values measured in a Hong Kong rural area (1.90 ng/m3), Korean rural area (2.24 ng/m3), and Finland suburban area (3.27 ng/m3) were comparable to the values measured in this study [28,29,30]. The PAH value has been measured in Hong Kong since 1994, and its concentration in a rural area was 4.16 ng/m3 [31]. After 10 years, the PAH concentration was 1.90 ng/m3 at the same site [28]. In the past 15 years, a 2–3-fold reduction in the PAH value was also observed in the Hong Kong urban area, from 10.72 ng/m3 in 2000–2001 [17] to 4.59 and 3.46 ng/m3 in 2011–2012 [32] and 2014 [33], respectively. This may be attributed to the reduction in local on-road traffic emissions. In addition, from a study by Liao et al. [34], for PAHs, especially BaP, the reduction rate was approximately 0.013 ng/m3 per year, which was due to declining emissions from vehicular exhaust and biomass/coal combustion. By determining the abundance of 20 PAHs in PM2.5 samples, Phe and Flu were found to be the dominant species in the four seasons (Figure 2). The average concentrations of Phe and Flu were 0.27 and 0.38 ng/m3, respectively. The annual percent contributions of the two most abundant compounds relative to ∑PAHs were 13% (Phe) and 18% (Flu), which collectively accounted for approximately 31%. The authors of [31] reported a similar situation in a rural area of Hong Kong (Hok Tsui), and they attributed this to some of the previously deposited Phe and Flu being revolatilized and re-emitted into the atmosphere. Notably, one summer pollution episode was observed during sampling. The average PAH concentration was up to 13.93 ng/m3, and the abundant species were Chr, BbF, BkF, and BeP, with values of 1.83, 2.74, 1.64, and 1.77 ng/m3, respectively, and accounted for approximately 60% of the ∑PAH concentration. Many studies have pointed to stationary emissions if there is a high factor loading of Chr and BbF [7,8,35].
As shown in Figure 3, the mean PAH concentrations observed in the autumn (2.15 ng/m3) and winter (2.90 ng/m3) are higher than those in summer (1.62 ng/m3) and spring (1.67 ng/m3). In summer and spring, stronger thermal circulation and deeper mixing heights result in excellent dilution and dispersion of pollutants, effectively causing the diffusion and dilution of PAHs [36]. Therefore, relatively low PAH values were observed. In autumn and winter, the predominant wind brings relatively high concentrations of particles matter pollutants from mainland China [36]. From Table S1, relatively high PAHs were observed when the predominant wind was from north, northeast, and northwest. A more detailed picture of the seasonal variations in the 19 PAH species is shown in Figure 3. The targeted PAHs can be grouped into three categories: 3-ring compounds, 4-ring compounds, and 5,6,7-ring compounds. The dominant PAHs in our study were 4-ring compounds in summer, winter, and spring, accounting for 44%, 40%, and 40%, respectively. The contribution of 3-ring PAHs ranged from 22% to 31% during the four seasons, with the highest contribution in summer. The major contributor in autumn was observed as the 5,6,7-ring compounds (45%).
In this study, the observed BaP concentration was 0.024–0.115 ng/m3, which is below the value of the Chinese standard (2.5 ng/m3) and EU standard (1 ng/m3). Based on Equation (1), BaPeq was calculated, and its mean value was 0.06 ± 0.02, 0.16 ± 0.09, 0.20 ± 0.14, and 0.08 ± 0.03 ng/m3 in summer, autumn, winter, and spring, respectively. The value is lower than those reported of many urban areas, such as 0.77 ng/m3 in Xiamen (China), 4.10 ng/m3 in Guangzhou (China), 1.91 ng/m3 in Fuji (Japan), 0.99 ng/m3 in Birmingham (UK), and a rural area in Hong Kong, China (0.31 ng/m3) [25,26,28,37,38]. The ILCR value (via Equation (2)) in our study ranged from 5.4 × 10⁻⁶ to 1.7 × 10⁻⁵, with a mean value of 1.1 × 10⁻⁵. According to the US-EPA and Liu et al. [39], the reported ILCR values lower than 1 × 10⁻⁶ and 1 × 10⁻⁴ and higher than 1 × 10⁻⁴ can be defined as a negligible, acceptable, and serious cancer risk level, respectively. Therefore, the ILCR value in our study exceeded 1 × 10⁻⁶ but was below 1 × 10⁻⁴, indicating that the inhalation cancer risk of PAH in TC, HK is acceptable.

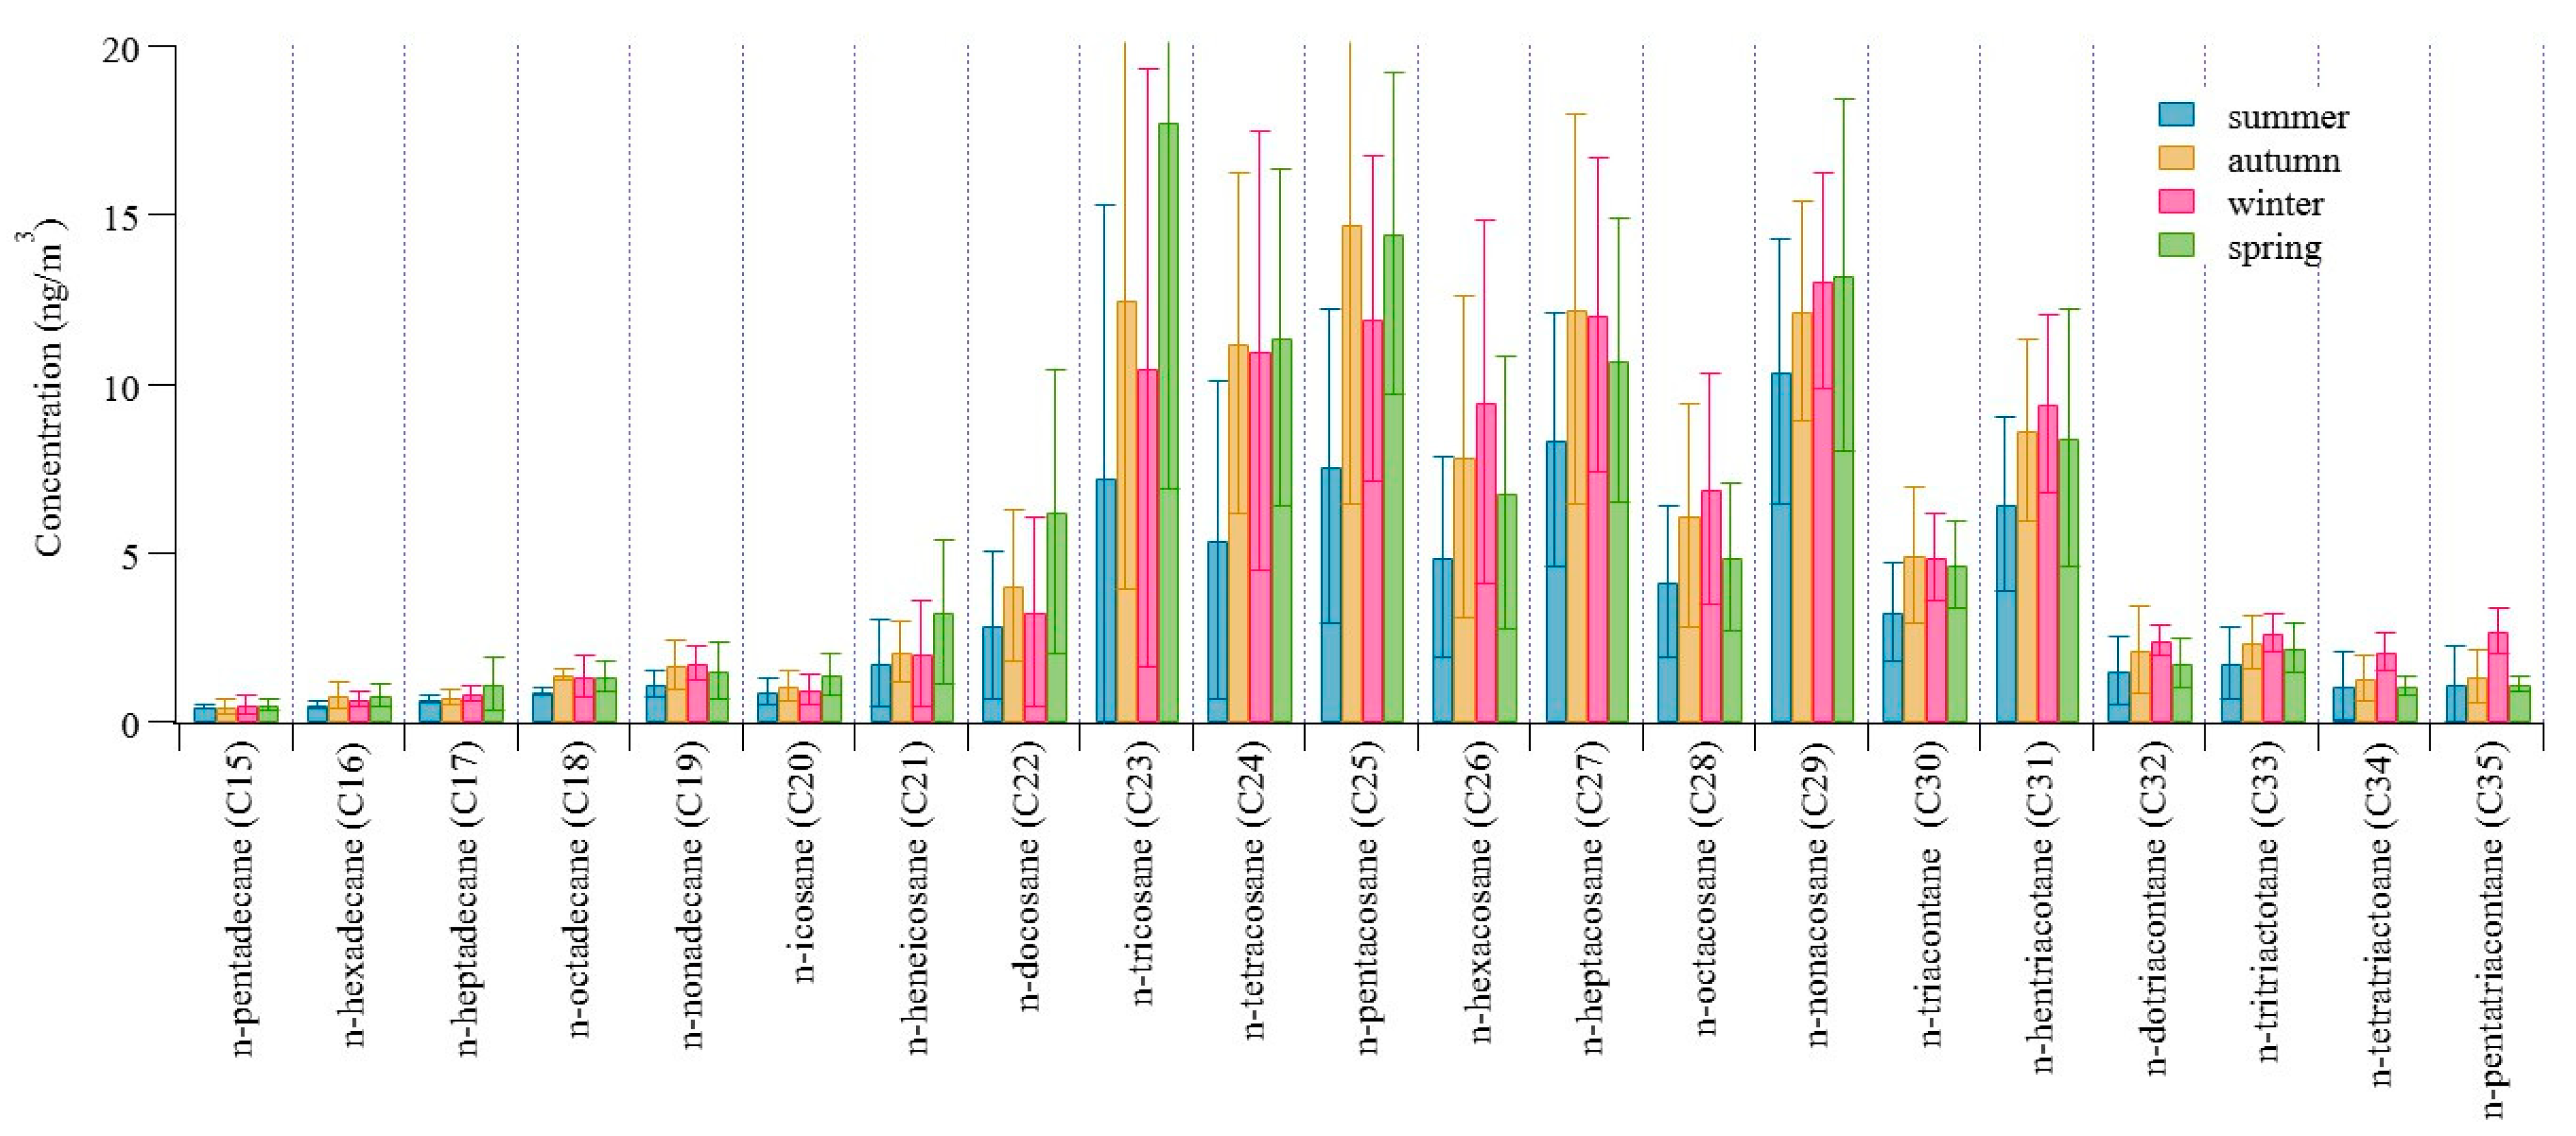
3.2. n-Alkanes Concentrations and Seasonal Variations

A set of 21 n-alkanes (C15–C35) were investigated in this study, and the average concentrations of these compounds are presented in Table 2. C25 was the most abundant species of the n-alkane homologs, with a value of 12.48 ng/m3. C29 and C23 also exhibited a high abundance, with concentrations of 12.27 and 12.20 ng/m3, respectively. Most n-alkane species were below 10 ng/m3. The sum of the measured n-alkane concentrations ranged from 38.58 to 191.44 ng/m3, with a mean value of 103.21 ng/m3 for the entire study. In comparison, the average n-alkane concentration was much lower than the concentrations observed in other urban areas of China: 225 ng/m3 in Nanjing, 184 ng/m3 in Ningbo, and 163 ng/m3 in Beijing [14,15,40]. Relatively low values were observed in a Hong Kong rural area (23.5 ng/m3) [31], Lulang in Tibet (1.25 ng/m3) [16], and Sanya (5.7 ng/m3) [27]. The observed n-alkane values at TC were comparable with those reported for some major cities in China, such as Shanghai (93.7 ng/m3) [40] and Guangzhou (102 ng/m3) [13].
The patterns of the n-alkanes as a function of the carbon number showed some similarities among the four seasons (Figure 4). The average concentrations in the four seasons (summer, autumn, winter, and spring) were 72.18, 109.76, 110.33, and 114.43 ng/m3, respectively (Table 2). The lowest value was observed in summer, and the highest one was observed in spring. The n-alkane value in spring was slightly higher than the values in autumn and winter. The contributions to the annual sum n-alkanes from different seasons were relatively stable and were 18%, 27%, 27%, and 28% in summer, autumn, winter, and spring, respectively.
Aerosol pollution from different sources can be estimated via specific molecular markers of n-alkanes. The epicuticular waxes of high plants (angiosperm) are the important contributor to long-chain-length n-alkanes (>C24) with a predominance of odd carbon numbers while anthropogenic sources, including fossil fuel burning and vehicular emissions, usually contribute short-chain-length (<C24) n-alkanes [11,41,42]. Cmax, the carbon number exhibiting the highest concentration, is usually used to distinguish biogenic from anthropogenic sources. In this study, Cmax in summer, autumn, winter, and spring was C29, C25, C29, and C23, respectively. They were characterized by a predominance of odd carbon numbers in the range of C23 to C29. In summer, autumn, and winter, Cmax of C25 and C29 suggested that biogenic sources contributed greatly to organic aerosol loading. Thus, it is interesting that in spring, the highest n-alkane concentration was observed, and C23 was the predominant species, which may be attributed to anthropogenic activities (Rogge et al., 1993; Hong et al., 2017). However, our previous study reported that the air masses that reached TC are relatively clean, with low PM2.5 concentrations, during spring [19], indicating that the observed C23 is not predominantly from the anthropogenic source. With the warm temperatures (~26 °C) and high relative humidity (~86%) in spring, the growth of moss, an important source of C23 [43], is likely in favor. The sampling site is surrounded by high mountains, which may be embedded with a considerable amount of C23 emission sources. The predominant n-alkane species in the other three seasons also supports the idea that the dominant source at this site was biogenic emission.

3.3. Source Identification of PAHs and n-Alkanes

3.3.1. Diagnostic Ratios of PAHs and Their Relations with Gases and Major Water-Soluble Ions

Diagnostic ratios were used to identify the possible sources of PAHs. Tobiszewski and Namieśnik [8] summarized the PAH diagnostic ratios for the identification of pollutant emissions in different environmental compartments, e.g., ratios of Ant/(Phe + Ant), Flu/(Flu + Pyr), IcdP/(IcdP + BghiP), and BaA/(BaA + Chr). However, the ratio of BaA/(BaA + Chr) is sensitive to atmospheric photoreaction, and it is still difficult to differentiate diesel emissions and biomass burning from the ratio of IcdP/(IcdP + BghiP). Therefore, in this study, we only provide a simple estimation by using the ratios of Ant/(Phe + Ant) and Flu/(Flu+Pyr) to distinguish the possible categories of PAH sources in the environment. It has been reported that a ratio of Ant/(Ant + Phe) higher than 0.1 can be used as an indicator of a combustion source [8]. The Ant/(Ant + Phe) ratio in this study ranged from 0.24 to 0.59, with average values of 0.38 in summer, 0.43 in autumn, 0.33 in winter, and 0.41 in spring. The ratios in different seasons were higher than 0.1, suggesting that combustion sources of PAHs were dominant at the TC site. A diagnostic ratio of Flu/(Flu + Pyr) lower than 0.4, between 0.4 and 0.5, and higher than 0.5 indicates petroleum, fossil fuel combustion, and grass, wood, and coal combustion, respectively [8,25]. There was no difference in the average Flu/(Flu + Pyr) ratios in the four seasons, which were 0.67, 0.65, 0.65, and 0.67 in summer, autumn, winter, and spring, respectively. Therefore, grass, wood, and coal combustion was suggested to be the dominant source at the sampling site.
Moderate correlations between PAHs and sulfate (R2 = 0.60) and SO2 (R2 = 0.77) were observed in summer and spring. In autumn and winter, PAHs were moderately correlated with potassium (R2 = 0.69), which supports the conclusion from diagnostic ratios and a previous study [32]. In the Hong Kong suburban area, the dominant sources of PAHs are coal and biomass burning. Very weak correlations between PAHs and NOx (R2 = 0.17) and CO (R2 = 0.18) were observed, indicating that the contribution from local traffic was limited. A moderate correlation (R2 = 0.55) between O3 and PAHs was found in summer and spring, and no correlation (R2 = 0.01) between the two species was observed in autumn and spring.

3.3.2. Carbon Preference Index (CPI) and Contribution of Plant Wax

The carbon preference index (CPI) is used to investigate the relative contributions of biogenic and anthropogenic emissions and is defined as the ratio of the total odd number of n-alkanes to the even number of n-alkanes [9,10,25,40,44]. When the CPI value is close to 1, n-alkanes mainly originate from vehicular and fossil fuels while n-alkane emissions are derived from high plants. Terrestrial vegetation usually has a high CPI value (>1). The contribution of biogenic sources increases with increasing CPI values. The equation of the CPI calculation is as follows:
  • For all n-alkanes measured: CPI = ∑(C17 − C39)/∑(C16 − C40).
  • For anthropogenic n-alkanes: CPI1 = ∑(C17 − C25)/∑(16 − C24).
  • For biogenic n-alkanes: CPI2 = ∑(C27 − C39)/∑(C26 − C38).
The CPI value at TC ranged from 1.35 to 2.29, with a mean of 1.74 (Table 3). The highest CPI value was found in spring (1.87), indicating impacts from many biogenic activities, i.e., leaf changes, fungi and pollen dispersal, and blooming during the growing season. A comparable CPI value was observed in summer (1.80), implying that high temperatures favored the evaporation of semivolatile compounds from epicuticular waxes of high plants (angiosperm). CPI1 ranged from 1.60 to 1.83, with a mean value of 1.72. CPI2 ranged from 1.58 to 1.94, with a mean value of 1.79. CPI1 and CPI2 showed relatively high values, suggesting emissions from plant waxes. This further supports the previous conclusion that a significant impact from biogenic sources occurred at the site during the whole sampling period.
The concentrations of wax n-alkanes (%waxCn) were used to estimate the relative contributions of biogenic sources versus anthropogenic sources [45]. The %waxCn was calculated by the following equation:
%waxCn = ∑(Cn − 0.5(Cn−1 + Cn+1))/∑Cn × 100%
where Cn is the concentration of plant wax alkanes, and a negative value of [Cn − 0.5(Cn−1 + Cn+1)] is taken as zero. In general, the %waxCn value is below 20% in an urban area with dominant vehicular emission [13,46] and a higher %waxCn value implies a greater contribution from plants or biogenic sources.
The annual average %waxCn was 43%, with a range of 28% to 59% (Table 3). The value was higher than that in many urban cities, i.e., Ningbo (35%), Guangzhou (17%), and Beijing (20%), indicating that %waxCn in the incomplete combustion of fossil fuels and petroleum residue and municipal incineration was 17% and 25%, respectively [13,15,40]. In our study, %waxCn in the four seasons was higher than 30%, indicating that epicuticular wax and biogenic sources might play a more prominent role in the large abundance of n-alkanes in this area.

4. Conclusions

In this study, PM2.5 samples were collected in four nonconsecutive months, August, November, February, and May, in 2011–2012, representing summer, autumn, winter, and spring, respectively. The samples were used to investigate the characteristics of PAHs and n-alkanes, including their concentration, seasonal variation, and potential sources in the Hong Kong suburban area, TC. In addition, the health risk for PAHs exposure was also assessed. The annual average concentration of particulate PAHs was 2.57 ng/m3, ranging from 1.26–13.93 ng/m3. The most abundant species were Phe and Flu, which constituted 13% and 18%, respectively. The 4-ring species were dominant in summer, winter, and spring, accounting for over 40%. In autumn, the 5,6,7-ring species contributed the most, ~45%. By comparing the BaP and BaPeq values with ambient air quality standards and the reported values in worldwide cities, the values in our study are much lower, suggesting that PAH pollution at the TC site is not serious. The ILCR value in our study exceeded 1 × 10⁻⁶ but was below 1 × 10⁻⁴, implying that the inhalation cancer risk of PAHs at the TC site is acceptable. However, the presence of oxidants (i.e., O3 and NOx) can favor the formation of PAH derivatives and it may have a more toxic effect on human health. Therefore, future study on determining the PAH derivatives at this site is essential. The concentration of n-alkane ranged from 35.58 to 191.44 ng/m3. C25 was the most abundant species. For n-alkanes, a lower value was found in summer, but the highest value was found in spring. Based on the CPI and %wax values, biogenic sources were the major sources of n-alkanes at the sampling site. The annual average contribution of higher plant wax to n-alkane was up to 40%. PAHs were mainly emitted from coal and biomass burning based on the results, diagnostic ratios, and correlations with source indicators.
Our results reveal the characteristics of PAHs and n-alkanes in a Hong Kong suburban site, which can provide a useful reference for future study to evaluate the characteristics of PAHs and n-alkanes in the different microenvironments of Hong Kong.

Supplementary Materials

The following supporting information can be downloaded at: https://www.mdpi.com/article/10.3390/atmos13060980/s1, Figure S1: correlation plot between (a) PAH and sulfate, SO2 in summer and spring seasons; (b) PAH and potassium, O3 in autumn and winter seasons; (c) PAH and NOx, CO in whole sampling period.; Table S1: Meteorological data during the whole sampling period; Table S2: Data of PM2.5, potassium, sulfate, chloride, nitrate, sodium, calcium, ammonium, NOx, SO2, O3 and CO during the whole sampling period.

Author Contributions

Data analysis, writing—original draft, visualization, Y.G.; review and editing, supervision, Z.L.; data curation, investigation, Z.Z.; review and editing, supervision, project administration, S.L. All authors have read and agreed to the published version of the manuscript.

Funding

The research was supported by Research Start-up fund of Beijing Normal University at Zhuhai (28714-111032101) and Environmental Conservation Fund of Hong Kong (7/2009).

Institutional Review Board Statement

Not applicable.

Informed Consent Statement

Not applicable.

Data Availability Statement

Not applicable.

Conflicts of Interest

The authors declare no conflict of interest.

References

  1. Vega, E.; Reyes, E.; Ruiz, H.; García, J.; Sánchez, G.; Martínez-Villa, G.; González, U.; Chow, J.C.; Watson, J.G. Analysis of PM2.5and PM10 in the Atmosphere of Mexico City during 2000–2002. J. Air Waste Manag. Assoc. 2004, 54, 786–798. [Google Scholar] [CrossRef] [PubMed] [Green Version]
  2. Venkataraman, C.; Reddy, C.K.; Josson, S.; Reddy, M.S. Aerosol size and chemical characteristics at Mumbai, India, during the INDOEX-IFP (1999). Atmos. Environ. 2002, 36, 1979–1991. [Google Scholar] [CrossRef]
  3. Wu, X.; Vu, T.V.; Shi, Z.; Harrison, R.M.; Liu, D.; Cen, K. Characterization and source apportionment of carbonaceous PM2.5 particles in China-A review. Atmos. Environ. 2018, 189, 187–212. [Google Scholar] [CrossRef]
  4. Joseph, A.E.; Unnikrishnan, S.; Kumar, R. Chemical characterization and mass closure of fine aerosol for different land use patterns in Mumbai city. Aerosol Air Qual. Res. 2012, 12, 61–72. [Google Scholar] [CrossRef] [Green Version]
  5. Cao, J.J.; Lee, S.C.; Chow, J.C.; Watson, J.G.; Ho, K.F.; Zhang, R.J.; Jin, Z.D.; Shen, Z.X.; Chen, G.C.; Kang, Y.M.; et al. Spatial and seasonal distributions of carbonaceous aerosols over China. J. Geophys. Res.-Atmos. 2007, 112, D22. [Google Scholar] [CrossRef] [Green Version]
  6. Kalberer, M.; Sax, M.; Samburova, V. Molecular Size Evolution of Oligomers in Organic Aerosols Collected in Urban Atmospheres and Generated in a Smog Chamber. Environ. Sci. Technol. 2006, 40, 5917–5922. [Google Scholar] [CrossRef]
  7. Ravindra, K.; Sokhi, R.; Van Grieken, R. Atmospheric polycyclic aromatic hydrocarbons: Source attribution, emission factors and regulation. Atmos. Environ. 2008, 42, 2895–2921. [Google Scholar] [CrossRef] [Green Version]
  8. Tobiszewski, M.; Namieśnik, J. PAH diagnostic ratios for the identification of pollution emission sources. Environ. Pollut. 2012, 162, 110–1109. [Google Scholar] [CrossRef]
  9. Simoneit, B.R.T.; Mazurek, M.A. Organic matter of the troposphere—II. For Part I, see Simoneit et al. (1977). Natural background of biogenic lipid matter in aerosols over the rural western united states. Atmos. Environ. (1967) 1982, 16, 2139–2159. [Google Scholar] [CrossRef]
  10. Simoneit, B.R.T. Organic matter of the troposphere—III. Characterization and sources of petroleum and pyrogenic residues in aerosols over the western united states. Atmos. Environ. (1967) 1984, 18, 51–67. [Google Scholar] [CrossRef]
  11. Rogge, W.F.; Hildemann, L.M.; Mazurek, M.A.; Cass, G.R.; Simoneit, B.R.T. Sources of fine organic aerosol. 4. Particulate abrasion products from leaf surfaces of urban plants. Environ. Sci. Technol. 1993, 27, 2700–2711. [Google Scholar] [CrossRef]
  12. Lammel, G. Polycyclic Aromatic Compounds in the Atmosphere-A Review Identifying Research Needs. Polycycl. Aromat. Compd. 2015, 35, 316–329. [Google Scholar] [CrossRef]
  13. Wang, J.; Ho, S.S.H.; Ma, S.; Cao, J.; Dai, W.; Liu, S.; Shen, Z.; Huang, R.; Wang, G.; Han, Y. Characterization of PM2.5 in Guangzhou, China: Uses of organic markers for supporting source apportionment. Sci. Total Environ. 2016, 550, 961–971. [Google Scholar] [CrossRef]
  14. Wang, G.; Kawamura, K. Molecular Characteristics of Urban Organic Aerosols from Nanjing:  A Case Study of A Mega-City in China. Environ. Sci. Technol. 2005, 39, 7430–7438. [Google Scholar] [CrossRef] [PubMed]
  15. Huang, X.-F.; He, L.-Y.; Hu, M.; Zhang, Y.-H. Annual variation of particulate organic compounds in PM2.5 in the urban atmosphere of Beijing. Atmos. Environ. 2006, 40, 2449–2458. [Google Scholar] [CrossRef]
  16. Chen, Y.; Cao, J.; Zhao, J.; Xu, H.; Arimoto, R.; Wang, G.; Han, Y.; Shen, Z.; Li, G. n-Alkanes and polycyclic aromatic hydrocarbons in total suspended particulates from the southeastern Tibetan Plateau: Concentrations, seasonal variations, and sources. Sci. Total Environ. 2014, 470, 9–18. [Google Scholar] [CrossRef]
  17. Guo, H.; Lee, S.C.; Ho, K.F.; Wang, X.M.; Zou, S.C. Particle-associated polycyclic aromatic hydrocarbons in urban air of Hong Kong. Atmos. Environ. 2003, 37, 5307–5317. [Google Scholar] [CrossRef]
  18. Ho, K.F.; Lee, S.C. Identification of atmospheric volatile organic compounds (VOCs), polycyclic aromatic hydrocarbons (PAHs) and carbonyl compounds in Hong Kong. Sci. Total Environ. 2002, 289, 145–158. [Google Scholar] [CrossRef]
  19. Gao, Y.; Lee, S.-C.; Huang, Y.; Chow, J.C.; Watson, J.G. Chemical characterization and source apportionment of size-resolved particles in Hong Kong sub-urban area. Atmos. Res. 2016, 170, 112–122. [Google Scholar] [CrossRef]
  20. Ho, K.F.; Cao, J.J.; Lee, S.C.; Chan, C.K. Source apportionment of PM2.5 in urban area of Hong Kong. J. Hazard. Mater. 2006, 138, 73–85. [Google Scholar] [CrossRef]
  21. Ho, S.S.H.; Chow, J.C.; Watson, J.G.; Ting Ng, L.P.; Kwok, Y.; Ho, K.F.; Cao, J. Precautions for in-injection port thermal desorption-gas chromatography/mass spectrometry (TD-GC/MS) as applied to aerosol filter samples. Atmos. Environ. 2011, 45, 1491–1496. [Google Scholar] [CrossRef]
  22. Nisbet, I.C.T.; LaGoy, P.K. Toxic equivalency factors (TEFs) for polycyclic aromatic hydrocarbons (PAHs). Regul. Toxicol. Pharmacol. 1992, 16, 290–300. [Google Scholar] [CrossRef]
  23. Europe, W. Air quality guidelines for Europe. Eur. Ser. 2000, 3, 23. [Google Scholar]
  24. Gao, Y.; Ji, H. Characteristics of polycyclic aromatic hydrocarbons components in fine particle during heavy polluting phase of each season in urban Beijing. Chemosphere 2018, 212, 346–357. [Google Scholar] [CrossRef] [PubMed]
  25. Zhang, N.; Cao, J.; Li, L.; Ho, S.S.H.; Wang, Q.; Zhu, C.; Wang, L. Characteristics and Source Identification of Polycyclic Aromatic Hydrocarbons and n-Alkanes in PM2.5 in Xiamen. Aerosol Air Qual. Res. 2018, 18, 1673–1683. [Google Scholar] [CrossRef]
  26. Li, J.; Zhang, G.; Li, X.D.; Qi, S.H.; Liu, G.Q.; Peng, X.Z. Source seasonality of polycyclic aromatic hydrocarbons (PAHs) in a subtropical city, Guangzhou, South China. Sci. Total Environ. 2006, 355, 145–155. [Google Scholar] [CrossRef]
  27. Wang, J.; Ho, S.S.H.; Cao, J.; Huang, R.; Zhou, J.; Zhao, Y.; Xu, H.; Liu, S.; Wang, G.; Shen, Z.; et al. Characteristics and major sources of carbonaceous aerosols in PM2.5 from Sanya, China. Sci. Total Environ. 2015, 530, 110–119. [Google Scholar] [CrossRef]
  28. Liu, F.; Xu, Y.; Liu, J.; Liu, D.; Li, J.; Zhang, G.; Li, X.; Zou, S.; Lai, S. Atmospheric deposition of polycyclic aromatic hydrocarbons (PAHs) to a coastal site of Hong Kong, South China. Atmos. Environ. 2013, 69, 265–272. [Google Scholar] [CrossRef]
  29. Moon, K.J.; Han, J.S.; Ghim, Y.S.; Kim, Y.J. Source apportionment of fine carbonaceous particles by positive matrix factorization at Gosan background site in East Asia. Environ. Int. 2008, 34, 654–664. [Google Scholar] [CrossRef]
  30. Vestenius, M.; Leppänen, S.; Anttila, P.; Kyllönen, K.; Hatakka, J.; Hellén, H.; Hyvärinen, A.-P.; Hakola, H. Background concentrations and source apportionment of polycyclic aromatic hydrocarbons in south-eastern Finland. Atmos. Environ. 2011, 45, 3391–3399. [Google Scholar] [CrossRef]
  31. Zheng, M.; Fang, M. Particle-associated Polycyclic Aromatic Hydrocarbons in the Atmosphere of Hong Kong. Water Air Soil Pollut. 2000, 117, 175–189. [Google Scholar] [CrossRef]
  32. Ma, Y.; Cheng, Y.; Qiu, X.; Lin, Y.; Cao, J.; Hu, D. A quantitative assessment of source contributions to fine particulate matter (PM2.5)-bound polycyclic aromatic hydrocarbons (PAHs) and their nitrated and hydroxylated derivatives in Hong Kong. Environ. Pollut. 2016, 219, 742–749. [Google Scholar] [CrossRef] [PubMed]
  33. Fan, Z.-L.; Chen, X.-C.; Lui, K.-H.; Ho, S.S.-H.; Cao, J.-J.; Lee, S.-C.; Huang, H.; Ho, K.-F. Relationships between Outdoor and Personal Exposure of Carbonaceous Species and Polycyclic Aromatic Hydrocarbons (PAHs) in Fine Particulate Matter (PM2.5) at Hong Kong. Aerosol Air Qual. Res. 2017, 17, 666–679. [Google Scholar] [CrossRef]
  34. Liao, K.; Yu, J.Z. Abundance and sources of benzo[a]pyrene and other PAHs in ambient air in Hong Kong: A review of 20-year measurements (1997–2016). Chemosphere 2020, 259, 127518. [Google Scholar] [CrossRef]
  35. Yang, J.; Xu, W.; Cheng, H. Seasonal variations and sources of airborne polycyclic aromatic hydrocarbons (PAHs) in Chengdu, China. Atmosphere 2018, 9, 63. [Google Scholar] [CrossRef] [Green Version]
  36. Zhou, S.; Wang, T.; Wang, Z.; Li, W.; Xu, Z.; Wang, X.; Yuan, C.; Poon, C.N.; Louie, P.K.K.; Luk, C.W.Y.; et al. Photochemical evolution of organic aerosols observed in urban plumes from Hong Kong and the Pearl River Delta of China. Atmos. Environ. 2014, 88, 219–229. [Google Scholar] [CrossRef]
  37. Ohura, T.; Amagai, T.; Fusaya, M.; Matsushita, H. Spatial Distributions and Profiles of Atmospheric Polycyclic Aromatic Hydrocarbons in Two Industrial Cities in Japan. Environ. Sci. Technol. 2004, 38, 49–55. [Google Scholar] [CrossRef]
  38. Smith, D.; Harrison, R.M. Concentrations, trends and vehicle source profile of polynuclear aromatic hydrocarbons in the UK atmosphere. Atmos. Environ. 1996, 30, 2513–2525. [Google Scholar] [CrossRef]
  39. Liu, J.; Wang, Y.; Li, P.-H.; Shou, Y.-P.; Li, T.; Yang, M.-M.; Wang, L.; Yue, J.-J.; Yi, X.-L.; Guo, L.-Q. Polycyclic aromatic hydrocarbons (PAHs) at high mountain site in North China: Concentration, source and health risk assessment. Aerosol Air Qual. Res. 2017, 17, 2867–2877. [Google Scholar] [CrossRef]
  40. Hong, Z.; Hong, Y.; Zhang, H.; Chen, J.; Xu, L.; Deng, J.; Du, W.; Zhang, Y.; Xiao, H. Pollution Characteristics and Source Apportionment of PM2.5-Bound n-Alkanes in the Yangtze River Delta, China. Aerosol Air Qual. Res. 2017, 17, 1985–1998. [Google Scholar] [CrossRef]
  41. Simoneit, B.R.T. Biomass burning-A review of organic tracers for smoke from incomplete combustion. Appl. Geochem. 2002, 17, 129–162. [Google Scholar] [CrossRef]
  42. Simoneit, B.R.T. A review of biomarker compounds as source indicators and tracers for air pollution. Environ. Sci. Pollut. Res. 1999, 6, 159–169. [Google Scholar] [CrossRef] [PubMed]
  43. Bush, R.T.; McInerney, F.A. Leaf wax n-alkane distributions in and across modern plants: Implications for paleoecology and chemotaxonomy. Geochim. Cosmochim. Acta 2013, 117, 161–179. [Google Scholar] [CrossRef]
  44. Flores, R.M.; Özdemir, H.; Ünal, A.; Tayanç, M. Distribution and sources of SVOCs in fine and coarse aerosols in the megacity of Istanbul. Atmos. Res. 2022, 271, 106100. [Google Scholar] [CrossRef]
  45. Kavouras, I.G.; Lawrence, J.; Koutrakis, P.; Stephanou, E.G.; Oyola, P. Measurement of particulate aliphatic and polynuclear aromatic hydrocarbons in Santiago de Chile: Source reconciliation and evaluation of sampling artifacts. Atmos. Environ. 1999, 33, 4977–4986. [Google Scholar] [CrossRef]
  46. Ren, L.; Fu, P.; He, Y.; Hou, J.; Chen, J.; Pavuluri, C.M.; Sun, Y.; Wang, Z. Molecular distributions and compound-specific stable carbon isotopic compositions of lipids in wintertime aerosols from Beijing. Sci. Rep. 2016, 6, 27481. [Google Scholar] [CrossRef] [Green Version]
Figure 1. Location of the sampling site. Source: from Google map.
Atmosphere 13 00980 g001
Figure 2. The abundance of detected PAH components in various seasons (unit: ng/m3; blue: summer, yellow: autumn, red: winter, green: spring).
Atmosphere 13 00980 g002
Figure 3. Relative concentrations of the 3-, 4-, and 5,6,7-ring groups in different seasons (unit: ng/m3; blue: 3-ring PAH species, orange: 4-ring PAH species, grey: 5,6,7-ring PAH species).
Atmosphere 13 00980 g003
Figure 4. Relative concentration of n-alkane species in different seasons (unit: ng/m3; blue: summer, yellow: autumn, red: winter, green: spring).
Atmosphere 13 00980 g004
Table 1. Mass concentration of PAH components (ng/m3) in PM2.5 at TC, Hong Kong.
SummerAutumnWinterSpringAnnual
AverageS.D.AverageS.D.AverageS.D.AverageS.D.AverageS.D.
3-ringAC0.050.030.060.020.100.050.070.020.070.03
3-ringACE0.010.010.010.010.010.010.010.010.010.01
3-ringFlo0.040.020.050.010.060.020.040.010.050.02
3-ringPhe0.270.110.210.080.390.140.230.050.270.12
3-ringAnt0.120.020.160.070.170.040.160.040.160.05
4-ringFlu0.370.140.290.130.560.240.310.070.380.18
4-ringPyr0.180.080.160.060.290.130.150.030.200.10
4-ringBaA0.030.020.040.020.060.020.030.000.040.02
4-ringChr0.150.070.210.130.250.090.170.020.200.10
5-ringBbF0.090.030.180.090.170.060.090.020.140.08
5-ringBkF0.090.040.170.120.190.050.090.030.140.09
5-ringBaF0.030.010.030.030.030.020.020.010.030.02
5-ringBeP0.070.020.210.150.190.070.090.030.150.13
5-ringBaP0.020.010.050.020.120.150.030.010.050.08
5-ringPer0.030.010.030.010.040.030.030.010.030.01
6-ringIcdP0.020.020.070.040.050.020.030.020.050.03
5-ringDahA0.010.000.020.010.010.000.010.000.010.01
6-ringBghiP0.040.010.130.110.090.040.050.030.080.07
7-ringCorndnd0.070.020.110.000.080.030.080.02
∑PAH1.620.642.151.132.901.191.670.432.572.53
Table 2. Mass concentration of n-alkane (ng/m3) components in PM2.5 at TC, HK.
SummerAutumnWinterSpringAnnual
AverageS.D.AverageS.D.AverageS.D.AverageS.D.AverageS.D.
n-pentadecane (C15)0.430.070.470.220.520.260.490.150.480.18
n-hexadecane (C16)0.490.110.760.410.700.240.800.310.700.31
n-heptadecane (C17)0.670.120.740.230.850.251.130.800.850.45
n-octadecane (C18)0.920.131.400.181.340.611.320.461.270.41
n-nonadecane (C19)1.110.381.670.741.740.521.500.851.530.66
n-icosane (C20)0.900.371.090.470.980.471.380.641.100.50
n-heneicosane (C21)1.751.302.090.922.031.583.262.122.301.54
n-docosane (C22)2.852.174.042.243.242.816.214.214.133.06
n-tricosane (C23)7.238.0812.478.5510.458.8617.7710.8512.209.35
n-tetracosane (C24)5.364.6911.225.0610.996.5211.374.989.985.57
n-pentacosane (C25)7.554.6714.758.2811.934.7914.484.7812.486.29
n-hexacosane (C26)4.872.957.824.779.475.376.784.057.364.47
n-heptacosane (C27)8.343.7812.245.7912.074.6510.704.2211.004.70
n-octacosane (C28)4.152.266.103.306.873.444.852.165.572.90
n-nonacosane (C29)10.363.9412.173.2413.043.2113.205.2212.273.85
n-triacontane (C30)3.271.444.952.014.881.314.671.304.511.61
n-hentriacotane (C31)6.472.588.622.709.432.638.423.838.322.97
n-dotriacontane (C32)1.510.992.121.272.420.451.740.751.980.94
n-tritriactotane (C33)1.731.042.370.782.610.542.160.752.250.79
n-tetratriactoane (C34)1.091.031.300.692.070.581.060.271.390.75
n-pentatriacontane (C35)1.141.101.350.812.690.651.130.231.560.93
n-alkanes72.1822.76109.7647.97110.3341.29114.4344.30103.2141.92
Table 3. CPI and %wax values of PM2.5-bound alkanes at TC.
SummerAutumnWinterSpringAnnual
CPI1.80 (1.52−2.15)1.71 (1.50−1.98)1.58 (1.35−1.82)1.87 (1.43−2.29)1.74 (1.35−2.29)
CPI11.78 (1.30−2.10)1.68 (1.44−2.22)1.60 (1.49−1.77)1.83 (1.70−1.98)1.72 (1.30−2.22)
CPI21.94 (1.51−2.64)1.76 (1.35−2.24)1.58 (1.25−1.88)1.92 (1.08−2.60)1.79 (1.08−2.64)
%wax45% (34−54%)43% (34−51%)37% (28−47%)47% (31−59%)43% (28−59%)
Publisher’s Note: MDPI stays neutral with regard to jurisdictional claims in published maps and institutional affiliations.

